1 引言
粮食生产关系国计民生,在国家政策倾斜、资金扶持和技术支撑等条件下中国粮食生产于2020年实现“十七连丰”,谷物总产量稳居世界首位,为解决中国14亿人口吃饭问题提供了保障[1 ] 。然而,长期以来粮食增产依赖农用化学品的大量使用,导致农业面源污染等环境问题日益加剧[2 ⇓ -4 ] ,依赖传统粗放式发展谋求粮食增产加剧了生态环境恶化、扩大了粮食生产风险。已有学者指出在充分考虑生态环境恶化问题后的粮食增产空间几乎接近“天花板”[5 ] 。由粮食生产的自然属性可知,粮食生产具有碳排和碳汇的双重属性[6 ] ,降碳减排是促成碳中和、碳达峰的基本盘[7 ] 。从这个意义上来说,粮食生产碳减排对缓解环境压力、实现绿色生产和提升粮食供给品质更为重要,也是助力中国2030年实现“碳达峰”的有效途径。在此背景下,中国高度重视粮食生产绿色转型与粮食安全的协调问题,2021年《中共中央国务院关于完整准确全面贯彻新发展理念做好碳达峰碳中和工作的意见》,指出“要处理好减污降碳与粮食安全的关系,防止过度反应以确保安全降碳”;2022年《减污降碳协同增效实施方案》指出,“深入实施化肥农药减量增效行动,提升粮食生产化肥、农药利用率以落实碳减排要求”;中国共产党的“二十大”报告也指出,“协同推进降碳、减污、扩绿、增长”,夯实粮食安全根基。因此,如何科学估算粮食生产碳排放并掌握其演进规律,是中国应对气候变化、落实安全降碳要求和制定粮食安全策略的关键问题,也是中国谋求可持续发展、实现全球共同利益以及构建人类生命共同体的重要课题。
现有研究主要从宏观视角聚焦于农业整体碳排放测算和影响因素分析。其中,农业碳排放是指农业生产部门(即种植业、畜牧业和渔业)在生产过程中直接或间接导致的碳排放,测算依据和范畴大多涵盖了农地利用、物资资料投入、水稻生长发育、畜禽养殖、渔业养殖、能源利用和废弃物处理等几个方面[7 ⇓ -9 ] 。碳排放的驱动力分析包括多因素和单因素两个方面,前者将农业碳排放的影响因素分解为效率、结构和劳动力[9 ] ,或是采用Lasso回归从多维度指标体系筛选关键驱动力[10 ] ;后者涵盖范围更为广泛,涉及个体技术水平[11 -12 ] 、经济增长[13 -14 ] 、农业生产结构[15 -16 ] 、城乡差异[17 ] 、非农兼业[12 ,18 ] 和人口规模等[19 ] 。这些相对成熟的研究方法为分析粮食生产碳排放提供了有益借鉴。相比于农业整体碳排放,粮食生产碳排放更具针对性,专指所有粮食作物(即水稻、小麦、玉米、豆类、薯类和其他)生长、发育及其收获处理过程产生的碳排放。目前学术界对粮食生产碳排放的探究相对较少,直到“十二五”末期国家农业部下发《到2020年化肥使用零增长行动方案》才引起学术界的关注。然而,现有粮食生产碳排放研究多是从农业整体碳排放中提取与粮食生产相关的部分,从总量、作物贡献和区域贡献等视角进行探析。从测算内容来看,起初仅评估了农用化肥施用导致的碳排放[20 ] ,随后将农药、农膜、柴油等物资资料投入和秸秆燃烧纳入评估体系[21 ⇓ ⇓ -24 ] 。虽然粮食生产碳排放评估所涵盖的内容不断丰富,但其作物选择仍聚焦在小麦、玉米和水稻三大粮食作物。值得注意的是,由于粮食生产物质资料投入的多样性无法精确细分到每一种作物,且秸秆燃烧的范畴不局限于三大粮食作物,仅保留以上三大粮食作物而非所有粮食作物品种的“加总”,将导致碳排放测算结果产生偏差[25 ] 。
中国省际间粮食生产所依赖的资源禀赋差异大,影响粮食生产碳排放的因素错综复杂,这一点也可以从上述“农业碳排放影响因素多样化”得以证实。不仅如此,粮食生产碳排放及其影响因素还可能会表现出显著的阶段性和区域性特征,一方面纵观中国“五年计划”,战略性引领粮食生产领域经历了相同时间跨度的政策演变,促使粮食种植、管理、收获及处理等生产过程愈发现代化,粮食生产调整能力增强[26 ] ,理论上使得碳减排的驱动力呈现阶段性演变。另一方面地区间横向比较来看,中国依据不同省际间资源要素禀赋、气候条件、粮食产销情况及其形成的比较优势等[27 ] 划分了粮食主产区、主销区和产销平衡区① (①根据2001年《国务院关于进一步深化粮食流通体制改革的意见》、2003年《关于改革和完善农业综合开发政策措施的意见》和2008年《国家粮食安全中长期规划纲要(2008—2020年)》等政策标准将中国31个省份(数据暂未含港澳台)划分为粮食主产区、主销区和产销平衡区,其中主产区包括河北、内蒙古、辽宁、吉林、黑龙江、江苏、安徽、江西、山东、河南、湖北、湖南和四川13个省份;主销区包括北京、天津、上海、浙江、福建、广东和海南7个省份;产销平衡区包括山西、广西、重庆、贵州、云南、西藏、陕西、甘肃、青海、宁夏和新疆11个省份。),也有少数学者依据粮食作物种植制度将中国划分为华北、东北、西北、长江中下游、东南沿海和西南② (②华北地区:北京、天津、河北、山西、山东和河南;东北地区:辽宁、吉林和黑龙江;西北地区:内蒙古、陕西、甘肃、青海、宁夏和新疆;长江中下游地区:上海、江苏、安徽、江西、湖北和湖南;东南沿海地区:浙江、福建、广东、广西和海南;西南地区:重庆、四川、贵州、云南和西藏。)六大地区[28 ] ,粮食生产的区域分工深化,加之碳排放本身的负外部性特征和区域关联效应,使得碳减排驱动力在地理空间上也表现出区域异质性。然而,现有文献鲜少对粮食生产碳排放的时空特征、纵向和横向影响因素的演变进行深入分析。
综上所述,既有文献对农业碳排放测算与分析较为丰富,对粮食生产碳排放的研究还处于初步阶段,尚未形成“加总”方法的粮食生产碳排放测算体系,也未对其演进特征和影响因素进行深度挖掘。基于此,本文的边际贡献在于:① 综合考虑水稻、小麦、玉米、豆类、薯类和其他6个方面“加总”粮食作物,采用生命周期评价法全面测算粮食生产碳排放;② 综合运用Dagum基尼系数、标准差椭圆与核密度估计等方法,深入阐释粮食生产碳排放的区域差异大小和来源、空间迁移过程及空间非均衡格局的演进特征,从而全面刻画中国粮食生产碳排放的时空差异及动态演进;③ 从经济发展水平、人民生活水平、技术进步水平、人口规模和自然条件5个方面构建了影响粮食生产碳排放的指标体系,从全国尺度、分时段和分区域3个方面客观筛选关键变量并探究其空间溢出效应。总而言之,区别于现有研究浅析三大粮食作物碳排放的现状特征,本研究将全面测算中国粮食生产的碳排放量,深入揭示粮食生产碳排放的演进规律,进一步明晰粮食生产碳减排驱动力,为粮食绿色生产及其赋能“碳达峰、碳中和”提供理论和方法依据,同时对如何实现国家粮食安全及其绿色转型提供支持和启示。
2 数据与方法
2.1 数据来源
粮食生产碳排放总量测算指标数据源于《中国农村统计年鉴》。影响因素指标中,个体技术水平数据源于《中国人口和就业年鉴》,科技创新水平数据源于国家知识产权局(www.cnipa.gov.cn/),经济增长、政府财政投入、农村居民人均可支配收入、农村居民人均消费支出、城乡收入差距、农村老龄化和城镇化率数据源于《中国统计年鉴》,其余数据均源自《中国农村统计年鉴》。鉴于数据可获得性,选择1997—2020年中国31个省份(数据暂未含港澳台)为研究对象。其中,1997—2001年农产品生产价格指数缺失,以农产品收购价格指数替代;2000年乡村老年抚养比缺失,参照表1 定义进行折算;农林水事务支出中1997—2006年数据缺失,故1997—2002年为支援农村生产支出、农业综合开发支出和农林水利气象等部分的事业费用支出之和,2003—2006年为农业支出、林业支出和农林水利气象等部门的事业费支出之和;其余个别缺失数据采用插值法补充。
2.2 研究方法
2.2.1 生命周期评价法
本文借鉴生命周期评价法的研究思路[23 ] ,综合所有类型粮食作物,按照投入—产出的全过程测算粮食生产碳排放量(图1 )。起初投入劳动力、资本和物质资料,随后通过翻耕、灌溉和其他技术措施开展粮食种植管理,该过程中磷肥、钾肥、复合肥和农药等物质资料以及翻耕、灌溉等均直接产生二氧化碳(CO2 )。然而,氮肥与常规物质资料投入存在差异,残留物主要产生氮氧化物(N2 O),破坏土壤环境。粮食作物开始生长发育之后,水稻在该过程中会产生甲烷(CH4 )。最后环节获得粮食产出,也面临秸秆还田处理,该过程产生CO2 、N2 O和CH4 多种污染物。因此,在已有研究[29 -30 ] 基础上并结合污染物类别将上述过程归纳为物质资料投入(包括翻耕和灌溉)、土地利用(氮肥施用)、水稻生长发育过程和秸秆燃烧4个方面。需要说明的是,水稻作为重要的粮食作物之一,近年来生长发育过程中的碳排放占中国农业碳排放的比重高于22.74%[7 ] ,因而在粮食生产碳排放测算过程中仍需考虑该部分。同时,水稻生长发育排放CH4 与品种、灌溉模式和耕作方式等密切相关,但省份内水稻灌溉模式和耕作方式差异较小,已有研究以种植面积为基础同时考虑品种和地区差异确定排放系数的做法已相对成熟[29 ,31 ] ,因而本文也沿用这种测算方法。此外,本文在测算过程中尚未考虑粮食生产碳汇,原因有二:① 粮食生产过程具有正向和负向碳汇机制,正向碳汇多源于光合作用和技术固碳等[32 ] ,而负向碳汇多源于过度耕作和建设用地扩张引发的土地性质调整等[33 -34 ] ,多种作用途径下的碳汇测算系数和方法尚属未知;② 粮食生产吸收CO2 后通过分解作用仍以碳的方式释放到自然环境中[35 ] ,该过程吸收和释放的碳汇测算仍存在较大争议。综上,粮食生产碳源所产生的碳排放测算过程如下:
(1) C 2 i n p u t = ∑ A c × δ c + ∑ B c × δ c + D c × δ c + E c × δ c
(2) N O 2 i n p u t = F c × δ c
(3) C H 4 r i c e = ∑ G c × δ c
(4) C s t r a w = ∑ H C × I C × J C × L C × K C × δ c N O 2 s t r a w = ∑ H C × I C × J C × L C × K C × δ c C H 4 s t r a w = ∑ H C × I C × J C × L C × K C × δ c
(5) C c = C 2 i n p u t + α 1 × N O 2 i n p u t + α 2 × C H 4 r i c e + C s t r a w + α 1 × N O 2 s t r a w + α 2 × C H 4 s t r a w
式中:δ c C 2 i n p u t 2 排放量;A c B c D c E c δ c [29 ] ;N O 2 i n p u t 2 O;F c ③ (③《2006年IPCC国家温室气体清单指南》,网址: https://www.ipcc.ch/。 )。C H 4 r i c e 4 ;G c [31 ] ;C s t r a w N O 2 s t r a w C H 4 s t r a w 2 、N2 O和CH4 ;H C I C J C K C L C [22 ] 和王晓玉等[36 ] ;C c α 1 α 2
图1
图1
粮食生产碳源
Fig. 1
Carbon source for grain production
2.2.2 时空动态演进分析方法
选用基尼系数、标准差椭圆和核密度等方法探析粮食生产碳排放的时空动态演进特征。其中,Dagum基尼系数是从总体差异和子样本分解的视角,定量阐述区域内差异贡献、区域间差异贡献和超变密度贡献,揭示中国整体和区域内外部粮食生产碳排量的差距;标准差椭圆是衡量地理要素分布中心的迁移过程,用来刻画中国粮食生产碳排放的空间演变特征;Kernel核密度可以阐述地理要素空间分布的非均衡性动态演进,发现中国粮食生产碳排放的整体性和局部性的空间差异问题。其中,方法介绍详见表2 。
2.2.3 驱动效应评估方法
(1)模型选择。参照已有研究[42 -43 ] ,综合自适应Lasso回归模型和空间杜宾模型揭示中国粮食生产碳排放的驱动力,模型设定分为两步。
第一步采用自适应Lasso回归剔除系数被压缩至零的非关键变量。自适应Lasso回归是由Tibshirani首次提出一种机器学习方法,随后Zou针对不同β ˆ [44 ] ,该方法设有N 个样本量,解释变量和被解释变量分别设定为X Y
(6) X = x 1 , x 2 , … , x i , … , x N T , i = 1,2 , … , N
(7) Y = y 1 , y 2 , … , y i , … , y N T , i = 1,2 , … , N
(8) β = β 1 , β 2 , … , β z T
(9) Y = β X + ε
(10) G C V λ = Y - X β ˆ λ 2 ( 1 - e ( λ ) / N ) 2
(11) β ˆ L a s s o = a r g m i n β ∑ i = 1 N ( y i - β x i ) 2 + λ ∑ 1 z w q β q
(12) w q = ( β q ∙ ( O L S ) ) - γ
式中:z 为解释变量X G C V λ λ λ λ = ∑ β ˆ β ˆ L a s s o β q ∈ z w q β q ∙ ( O L S ) β q γ x i ε 为随机扰动项。
第二步运用空间杜宾(SDM)模型进一步评估自适应Lasso回归筛选出的变量,分析这些变量在全国、时段和区域内的本地效应和空间溢出效应,参照Elhorst[45 ] 和LeSage等[46 ] 将SDM模型估计结果分解为直接效应、间接效应和总效应,以评估各解释变量的边际效应。
(13) Y i t = α i + ρ ∑ j = 1 n W i j G C i t + β X i t + φ ∑ j = 1 n W j t X j t + μ i + ξ t + ε i t
式中:i 和j 为不同省份;t 为不同年份;α i Y i t 、 X i t W i j β 、 ρ 和 φ μ i 、 ξ t ε i t
(2)变量选取。被解释变量Y i C c
解释变量X i [47 ] ,而粮食生产地理区位的比较优势取决于气候和耕地资源等自然条件[48 ] ,自然灾害则多源于不可预测的旱灾和水涝等,影响粮食单产水平,限制粮食生产潜能[49 ] ;但由于各省份气候、降水量、旱灾和水涝等长时间序列数据的量化存在一定难度,因此选择与其密切相关的农业生产结构、粮食总产量和自然灾害3个变量作为替代变量。变量指标描述和选择依据详见表1 。
3 中国粮食生产碳排放量变化特征
3.1 整体特征
1997—2020年中国粮食生产年均碳排放总量由36978.35万t增长至49478.19万t,增长了33.80%,年均增长率1.30%,说明中国粮食生产碳排放整体趋于增长(图2a )。从阶段性演进来看,以2003年和2015年为分界点,粮食生产碳排放总量呈“减—增—减”波动,增长率分别为-0.02%、28.86%和-2.38%,这在某种意义上也暗示了样本研究期内中国粮食生产在2017年即实现了“碳达峰”(51753.69万t)。究其原因:① 中国早期的粮食生产主要依赖既有耕地资源,化肥和农药等物资资料投入低,粮食产量低但保留了较好的农业环境。② 为了激励粮食生产,中国相继取消了农业税并推行粮食种植补贴政策,这提高了土地价格并增加了地租[50 ] ,通过改变农户种植行为和投资决策行为促使农民粮食生产积极性高涨,而由此引发的农业生产资料价格上涨会通过政府政策调节和粮价上涨等方式稳定粮食生产积极性[51 ] ,已有研究也表明亩均补贴提高1%将导致粮食产量提高0.056%[52 ] ,从中国粮食生产多年连丰的现实来看,粮食增产主要是靠农用物资资料投入,这也诱致了粮食生产领域碳排放的增长。③ 在经历粮食高投入、高产出和高污染后,“十三五”时期中国高度重视农业绿色发展,尤其是耕地流转形成的适度规模经营,使得农用物资质量和使用效率不断提升,粮食集约化生产水平显著提高,粮食生产碳排放量开始呈下降态势。
图2
图2
1997—2020年中国和区域粮食生产碳排放总量及增长率
Fig. 2
Total carbon emissions and growth rate of grain production in China and regions from 1997 to 2020
3.2 区域差异
从粮食生产三大功能区来看(图2b ~2d),1997—2020年粮食生产碳排放总量呈“主产区>产销平衡区>主销区”的排序,分别由25457.55万t、6769.80万t和4751.00万t增长至34627.59万t、10923.38万t和3927.22万t,年均增长率分别为1.38%、2.14%和 -0.77%,主产区碳排放总量最高且有增长态势,产销平衡区增长率最高,主销区碳排放量最低且呈缩减态势。从碳排放构成来看,主产区和产销平衡区多数省份粮食生产碳排放的来源是化肥等物质资料投入和秸秆燃烧,二者平均占比介于65.22%~94.75%之间;江西、湖北、湖南等中部地区及主销区省份水稻生长的碳排放量较高甚至超过秸秆燃烧,物质资料投入仍占主导地位,二者平均占比介于69.01%~81.50%之间;氮肥投入导致的碳排放量整体偏低,整体占比不足7%。进一步从粮食产量与碳排放量的关系来看,主产区粮食产量年均增长率为1.87%,高于碳排放量增长率,两者呈脱钩之势;同理,主销区和产销平衡区粮食产量年均增长率分别为-2.43%和1.10%,低于碳排放量增长速度,两者仍处于矛盾加剧的负脱钩状态,粮食生产仍较多依赖于化肥等物质资料的高投入。
此外,从粮食作物种植制度划分区域来看,样本期内长江中下游地区和华北地区的粮食生产碳排放总量一直处于最高和次高地位,两个地区碳排放总量占全国的比例介于52%~57.26%之间;其余4个地区粮食生产碳排放总量的空间格局有所变迁,由“东南沿海地区>西南地区>西北地区>东北地区”的排序最终转向“西北地区>东北地区>东南沿海地区>西南地区”的排序。同时,年均增长率按西北、东北、华北、西南、长江中下游和东南沿海的顺序依次递减,分别为3.48%、2.93%、1.30%、1.03%、0.77%和-0.24%,这意味着区域上粮食生产碳排放主要集中在长江中下游和华北地区,同时由东南沿海和西南地区往西北和东北地区积聚。
3.3 省际差异
从各省份来看(图3 ),山东、河南、江苏、安徽、河北、黑龙江、江西、湖北、湖南和四川10个省份粮食生产碳排放量占全国的比例介于59.86%~63.67%之间,其中前4个省份占比约为30%左右;相比于以上省份,北京、天津、青海、宁夏、上海、海南和西藏7省份碳排放总量占全国的比例较低,尚未超过3.1%,中国粮食生产碳排放主要集中在山东、河南、江苏和安徽等主产区省份。此外,样本考察期内有25个省份粮食生产碳排放总量呈增长态势,尤其是内蒙古、甘肃、黑龙江、吉林和宁夏等地区增长势头最猛且增长率均高于85.07%以上,仅有北京、天津、上海、浙江、福建和广东6省份粮食生产碳排放总量呈缩减态势,增长率介于-73.79%~-1.93%之间。从增长源来看,有26个省份物质资料投入对粮食生产碳排放总量的贡献率呈增长态势,其中海南、北京、浙江、上海、广西和青海等省份的增长势头较猛,增长率介于60.46%~138.50%之间;有11个省份秸秆燃烧的贡献也呈增长趋势,但绝大多数省份氮肥投入和水稻生长过程的贡献呈下降态势。
图3
图3
1997—2020年中国各省份粮食生产碳排放量及增长率
注:基于自然资源部标准地图服务网站GS(2019)1823号标准地图制作,底图边界无修改。
Fig. 3
Total carbon emissions and growth rate of grain production in China's provincial-level regions from 1997 to 2020
4 中国粮食生产碳排放量的动态演进
4.1 基尼系数分析
从全国整体来看(图4a ),1997—2020年中国粮食生产碳排放量的总体基尼系数介于0.4171~0.4407之间,均值为0.4302,呈“增—减—增”循环波动式演进,尤其是“十三五”时期的总体差异呈扩大趋势。同时,空间差异主要源于区域间差异的贡献且有进一步扩大趋势,介于61.16%~70.27%之间,年均增长率为0.46%,而区域内差异和超变密度贡献分别以0.22%和2.31%的速率缩减。区域间差异中(图4b ),主产区和主销区绝对值和增速最高,基尼系数均值为0.5899,年均增速为0.8939%;2014年之前主产区和产销平衡区处于中等水平,2014年之后被主销区和产销平衡区赶超。此外,主产区和产销平衡区、主产区和主销区的基尼系数由初期收敛逐渐走向发散,说明主销区与主产区、产销平衡区的区域间差异均有扩大趋势。区域内差异分级特征明显,主销区内部差异最为突出并呈扩大态势,产销平衡区内部差异的增长趋势最为迅速,主产区内部差异最小并呈缩小趋势,但在“十三五”时期出现增长势头。
图4
图4
中国粮食生产碳排放的总体、区域内与区域间差异的演变态势及其贡献率
Fig. 4
Evolution trend and contribution rate of overall, intra-regional and inter-regional differences in carbon emissions from China's grain production
4.2 转移路径分析
对中国1997年、2000年、2005年、2010年、2015年和2020年6个时间节点的粮食生产碳排放重心—标准差椭圆分析来看(图5 ),分布重心一直处于河南省境内,重心向南北方向转移的距离大于东西方向上的移动,样本期向西偏北方向移动了163.01 km,年均移动速度为7.09 km/a,这意味着中国西偏北方向上的粮食生产碳排放量有所增加。同时,从椭圆面积、形状及其变化趋势可知,标准差椭圆涵盖了大多数东、中部地区和部分西部地区,说明中国粮食生产碳排放在各省份广泛存在。椭圆面积向西部、东北部主产区及产销平衡区迁移趋势,表明了中国粮食生产碳排放具有一定的空间发散特征;但椭圆形状逐步趋近于正圆,又表明中国粮食生产碳排放的空间发散特征并不显著。
图5
图5
1997—2020年粮食生产碳排放转移路径
注:基于自然资源部标准地图服务网站GS(2019)1823号标准地图制作,底图边界无修改。
Fig. 5
Carbon emission transfer path of China's grain production from 1997 to 2020
4.3 核密度估计分析
从核密度估计的整体形态及动态演进来看(图6 ),1997—2020年全国粮食生产碳排放密度曲线主峰分布位置偏左但向右移动,大致由600万t右移至800万t,双峰特征从无到有且次级波峰也呈右移态势,说明中国粮食生产碳排放量总体增长、呈现出高水平收敛的恶化趋势,右拖尾延展拓宽形态意味着存在碳排放高值省份,峰值下降、宽度扩大则说明绝大差异扩大。在3个区域方面,主产区特征与全国保持一致;主销区分布无双峰或多峰现象,主峰位于0~700万t之间,主峰位置偏左且有向左移动的态势,说明主销区多数省份实现了碳减排,这与北京、天津、上海、浙江、福建和广东已实现碳减排的结果一致;产销平衡区主峰分布拓宽,右拖尾延展形态明显,说明产销平衡区内部绝对差异扩大。由此可见,全国和主产区核密度估计形态及其动态演进趋势一致,主销区和产销平衡区存在一定的异质性,其成因值得深入探究。
图6
图6
1997—2020年粮食生产碳排放核密度
Fig. 6
Kernel density of grain production carbon emissions from 1997 to 2020
5 中国粮食生产碳排放的驱动效应分析
5.1 驱动因素筛选
根据中国粮食生产的阶段性和区域性特征,本文从纵向和横向两个层面进行驱动因素分析。纵向上以中国的“五年”发展计划为标准;横向上以粮食生产三大功能区为标准,主要是考虑主产区、主销区和产销平衡区的划分综合了诸多要素禀赋及其形成的比较优势,有益于探究区域内碳减排驱动力。首先通过自适应Lasso回归对全国和分时段、分区域的18个自变量进行筛选,有效解决不同样本的多重共线性问题。由图7 可知,粮食生产碳排放驱动因素存在显著的时空差异,全国视角下共筛选出14个非零关键变量,分时期非零关键变量数量呈“减—增—减”波动,分区域按产销平衡区、主产区和主销区依次递减。值得注意的是,粮食总产量和农业生产结构的影响始终存在,说明其与粮食生产碳排放关系尤为密切。
图7
图7
自适应Lasso回归结果
Fig. 7
Adaptive Lasso regression results
5.2 整体效应分析
对SDM模型进行Hausman检验、Wald检验和似然比(LR)检验发现,时间空间双向固定效应模型最优④ (④地区固定效应和时间固定效应检验均通过了1%的显著性检验(χ 2 = 50.72, P < 0.001; χ 2 = 1497.60, P < 0.001),表明时间空间双向固定效应模型最优;Hausman检验通过了1%的显著性检验(χ 2 = 142.42, P = 0.001),表明应选择固定效应模型而非随机效应模型;Wald(SDM、SAR)和Wald(SDM、SEM)检验均通过了1%的显著性检验(χ 2 = 65.38, P < 0.001; χ 2 = 75.63, P < 0.001),说明拒绝SDM模型退化为空间自回归模型(SAR)和空间误差模型(SEM)的原假设,即选择SDM模型最优。LR(SDM、SAR)和LR(SDM、SEM)检验均通过了1%的显著性检验(χ 2 = 63.72, P < 0.001; χ 2 = 74.46, P < 0.001),说明空间杜宾模型优于SAR和SEM模型。此外,本文还进行了全局空间自相关检验,各年份碳排放的莫兰指数均通过了10%的显著性检验,且均值为0.149,说明中国粮食生产碳排放具有空间相关性。其中,空间权重矩阵选择邻接权重矩阵。)。由表3 可知,农业总产值、地区经济结构、劳动节约型技术、农业生产结构和粮食总产量的直接效应和间接效应均显著。其中,农业总产值和粮食总产量的直接效应均为正值而间接效应均为负值,说明两者表现为促增本地—促减邻地粮食生产碳排放,其余3个因素作用方向与之相反。究其原因,耕地资源禀赋优越的地区粮食生产过程投入较多物质资料,促进粮食产量和产值大幅度增长,这种耕地资源的自然属性决定了本地促增效应;同时,耕地资源的空间固定性决定了粮食产能承接的空间关联性和转移效应,尤其是资源禀赋偏差的主销区,粮食生产规模降低并带动碳排放量减少。劳动集约型技术本质上是粮食生产的机械化程度,机械化总量资源的有限性决定了其流动性,即机械化资源不足的地区能够吸引跨区域机械动力的流入,增强了空间关联地区劳动节约型技术水平的提升,呈现明显的正向空间溢出效应[15 ] 。地区经济结构表现为农业产值比重对碳排放的影响,农业产值较高的地区主要得益于现代化的粮食生产方式,有利于减少物质资料的过度投入而实现本地粮食绿色生产,本地粮食集约化生产效应增强,对相邻地区尤其是粮食主产区内部挤出效应加强,推广和应用高效粮食生产方式的能力衰减,呈现出显著的正向空间溢出效应。农业生产结构则衡量粮食种植和畜牧业、水产品饲养等其他农业生产活动之间的比较关系,粮食生产的碳排放较其他农业生产活动相对较低,尤其是粮食种植适度规模经营更加有助于促进农业生产系统化学投入品减少[16 ] ,从而实现碳减排。
在直接效应中,农村总人口、农村人口密度和城镇化率均通过了1%的显著性检验,且系数均为正值,说明人口规模效应提升会导致本地粮食生产碳排放的增长;同理,人民生活水平效应和科技创新效应对碳排放的影响与人口规模效应的作用方向相反。从中国的客观事实而言,一方面,自1997年以来中国农村总人口和人口密度的平均递减率分别为32.77%和43.52%,农村人口对粮食生产的需求不断降低,传统小农户的种植和经营方式缩减,带动物质资料投入减少而降低了碳排放。另一方面,随着中国城镇化率快速推进,由1997年的33.35%增加到2020年的63.89%,城镇化进程促进了经济社会的发展,带动大量农村人口进城务工,某种程度上也伴随着农村居民收入水平的增长以及城乡居民收入差距的缩小,在农民承包耕地尚未进行大规模流转的情况下,粮食生产过程中的物质资料投入代替了劳动力投入,粮食增产的同时也诱致了碳排放量的增加。此外,经济发展、科技创新水平以及农村居民收入的提升,均有益于提升消费能力,无论是小农户还是家庭农场在粮食生长过程中更多倾向于使用高效优质的新品种、绿色防控品和秸秆还田等绿色生产技术,在消费端质量需求拉动和供给端利己效应共同驱动下有效地促进了粮食生产的碳减排[17 ] 。
综上也可以看出,城镇化和农村人口减少是一个同步的过程,但它们对粮食生产碳排放的影响存在相悖现象,这里主要是从全国层面揭示了一般性特征,在不同时段和不同区域内可能会存在差异,因此还需要对驱动因素做进一步的时段效应和区域效应分析。
5.3 时间效应分析
由表4 可知,显著性驱动因素在不同时段呈明显的分异特征,驱动机制也随着阶段性演进由多因素主导向单因素转变。从直接效应来看,通过显著性检验的驱动因素表现为全程性和节点性两个特征。一是,部分驱动因素基本上作用于每个阶段,包含农业总产值、农村总人口和粮食总产量,说明这些变量是粮食生产碳排放的稳定性驱动因素;二是,以“十一五”时期为节点,前后驱动因素变化较大,其中“九五”和“十五”时期以经济、社会、人口和自然等因素综合作用的方式影响着粮食生产碳排放量,“十一五”之后人民生活条件的作用有所减弱,而技术进步水平的作用程度增强。
从间接效应来看,显著性驱动因素的简化过程更加明显,从“九五”到“十三五”时期,粮食生产碳排放空间溢出效应的驱动因素从6个减少到2个,驱动方式由经济、社会、技术、人口和自然等要素共同作用转变为技术要素的单一主导,并由前期的科技创新水平转为劳动节约型技术水平,说明技术要素对粮食生产碳排放的空间溢出效应具有稳健性,同时技术的影响作用逐渐由理论研究转向实际应用。
综上可见,“十一五”时期是中国粮食生产碳排放变化的关键节点,源于“十五”时期为了应对国内外复杂环境,中国粮食生产政策发生重大转变。具体地,自2001年加入WTO后粮食生产保护政策减少且取消了配额采购制度[53 ] ,2004年中国农产品贸易由顺差转向逆差,同年开始取消农业税[54 ] ,2005年中央土地政策制定保护18亿亩(1亩≈666.7 m2 )耕地红线[55 ] 。此外,从客观事实来看,中国实施的一些与粮食生产密切相关的政策还存在着一定的时滞效应,粮食生产于“十五”中期开始由大滑坡转为“连丰”,进而导致“十一五”时期前后粮食生产碳排放的驱动效应出现差异。
5.4 区域效应分析
由表5 可知,三大功能区经济发展水平和自然条件的驱动机制与全国整体效应基本一致,其中农业总产值、粮食总产量和农业生产结构在三大功能区层面均呈现出显著性作用,也是影响范围最广的因素。然而,三大功能区驱动因素数量及其作用方向存在一定的差异。
在主产区中,直接效应的显著性驱动因素有10个,与整体效应的作用效果基本一致。间接效应的显著性驱动因素有7个,较整体效应增加了人民生活水平的正向空间溢出效应,技术进步的驱动因素以宏观的技术创新能力替代了微观的劳动节约型技术。
在主销区中,直接效应的显著性驱动因素比较少(6个),缺少社会和技术方面的驱动力;间接效应的显著性驱动因素为4个,与整体层面的驱动效应基本相似,仅增加了非农兼业水平的负向空间溢出效应,但与主产区的作用方式不同,这与主销区和主产区的空间邻近性具有较大关系,主销区对粮食的需求增加了主产区的粮食生产压力,助长了粮食生产过程中的碳排放。
在产销平衡区,直接效应和间接效应的显著性驱动因素均为9个,驱动机制相对复杂。其中,直接效应的因素表现与整体效应基本一致,但在自然条件方面增加了自然灾害的显著性作用,并且表现为促增本地粮食生产碳排放;间接效应的驱动因素中,经济、社会、技术、人口和自然等因素均有表现,尤其是城镇化水平和农民生活水平的“污染泄露效应”进一步凸显,在空间溢出效应上存在着一定的相悖情境。
这里值得注意的是,技术进步水平在主销区没有发生空间溢出效应,科技创新水平仅在主产区有显著影响,人口规模仅在产销平衡区存在空间溢出效应,自然灾害也仅作用于产销平衡区内部。究其原因在于,主产区粮食产能潜力高且具有示范效应,对绿色粮食生产技术更为敏感,但其内部绿色专利数量极度不平衡,如2020年江苏省最高为797件是最低吉林省的9.72倍,在粮食绿色生产技术总量一定的前提下,发达地区占有量高一定程度上挤占欠发达地区绿色技术引进率,阻碍区域内技术扩散助长“搭便车”行为,进而促减本地和促增邻地碳排放。主销区耕地资源禀赋较差,粮食生产多为小农化,以大量的物质资料投入为主,且不存在劳动力替代机制,区域内尚不存在技术扩散效应。产销平衡区内多为欠发达省份,其人口流动与主产区、主销区存在较大差异,同时该区域自然灾害水平年均递增率为6.63%,不利于保障区域粮食安全,但又加重了区域粮食生产压力而助长碳排放。
6 结论与讨论
6.1 结论
本文基于1997—2020年中国31个省份数据(数据暂未含港澳台),采用生命周期评价法测算了中国粮食生产碳排放量,结合Dagum基尼系数、标准差椭圆和核密度方法全面刻画了中国粮食生产碳排放的动态演进趋势,运用自适应Lasso回归和空间杜宾模型相结合从整体、时段和区域3个层面识别了粮食生产碳排放的驱动效应并探讨了其空间溢出效应,得出以下主要结论:
(1)中国粮食生产的碳排放总量呈现波动性增长态势,年均增长率1.30%,2020年的碳排放总量为49478.19万t。同时,“十三五”时期中国粮食生产碳排放量在2017年达到高峰后逐渐降低,整体下降了2.38%。化肥等物资资料投入和秸秆燃烧对粮食生产碳排放的贡献最大,未来仍有较大的碳减排潜力。
(2)中国粮食生产碳排放存在明显的区域性差异,整体呈现“主产区>产销平衡区>主销区”的分布格局,长江中下游地区和华北地区一直处于最前列,仅主销区呈缩减趋势,碳排放量较高的省份包括山东、河南、江苏和安徽等地。
(3)中国及三大地区粮食生产碳排放的非均衡动态演进趋势存在一定的区别。中国粮食生产碳排放量的总体基尼系数介于0.4171~0.4407之间,主要源于区域间差异,区域内部则呈现“主销区>产销平衡区>主产区”的分级效应特征,分布重心位于河南省境内并向西偏北方向移动,绝对差异扩大且呈高水平收敛的恶化趋势。同时,主产区和主销区粮食生产碳排放的绝对差异扩大而产销平衡区得到有效改善,全国和主产区核密度估计形态及其演进态势一致,主销区和产销平衡区存在明显异质性。
(4)全国、分阶段和分区域自适应Lasso回归筛选的非零关键变量存在异质性,但粮食总产量和农业生产结构对粮食生产碳排放的影响始终存在。考虑空间溢出效应后,全国视角下农业总产值和粮食总产量为负向空间溢出效应,地区经济结构、劳动节约型技术和农业产业结构则为正向空间溢出效应。阶段效应以“十一五”时期为节点由复杂转向简化,农业总产值、农村总人口和粮食总产量的直接效应比较稳定,而空间溢出效应中技术进步相对稳定。区域效应中,粮食主产区的碳排放驱动效应与国家层面基本一致,驱动因素数量方面主销区相对较少而产销平衡区明显更多,部分自然条件因素的影响存在共性,技术进步效应和人口规模效应存在异质性。
6.2 讨论
基于研究发现制定粮食生产绿色转型行动尤为关键,对此提出几点政策启示如下:① 摒弃“一炮轰”的粗放式碳减排管理,有效延续“十三五”时期粮食生产的降碳趋势。具体地,对于主产区、产销平衡区以及长江中下游地区和华北地区,尤其是山东、河南等粮食生产大省以及内蒙古、黑龙江等增碳大省,改变过度依赖物资资料投入的传统粮食生产模式,选择清洁化的秸秆还田方式,促使粮食生产转向降碳阶段。同时,有效发挥农户在粮食生产绿色转型中的主体作用有效解决规模化生产难题[4 ] ,加强化肥、农药等污染源头管理,解决粮食增产与降碳之间的矛盾。② 汲取“十三五”时期粮食生产碳排放空间差距增长的经验,如北京、上海和浙江等地在粮食生产领域已形成降碳之势,但这些地区粮食增产空间有限且多为经济发达地区,劣势省份需在考虑经济社会发展差异的前提下将优势地区的降碳策略本土化;如山东和河南等粮食生产大省通过引进绿色生产技术实现降碳与粮食增产的双赢局面,通过降低这些高值区碳排放能有效形成区域间和省际间优势互补、良性互动格局,避免因粮食生产功能区划分引发“碳泄漏”效应。③ 基于现实碳减排驱动力因地制宜制定粮食总体和区域性碳减排方案。总体上,既有耕地资源一定的情况下,提升落后地区粮食生产的机械化水平,避免耕地撂荒、细碎化或小规模经营导致的增碳,合理引导农户开展耕地流转并协调好城乡要素资源的自由流动等方式[56 ] ,加强粮食适度规模经营以实现本地和邻地双向碳减排目标。同时,充分利用在阶段演变过程中对于粮食生产碳减排具有稳定性的农业总产值、农村总人口和粮食总产量等因素,夯实技术进步的碳减排驱动力。区域共性方面发挥农业结构调整对空间关联地区的碳减排效应,充分发挥主产区粮食生产潜能对绿色生产技术的敏感性,欠发达省份通过政府、企业等平台引进实用性绿色专利,提升绿色技术利用率;以村集体为单位引导产销平衡区农户关注气候和降水等自然灾害,及时传达灾害预防的信息,缩减灾害发生频率;而主销区粮食生产压力大于其降碳压力,采用现代化土壤管理技术,改善耕地肥力,扩大化肥、农药等物资资料投入吸收率以实现粮食增产。
鉴于中国粮食绿色增产的现实需求,充分挖掘粮食生产过程中碳排、碳汇以及降碳潜力,是未来实现“双碳”目标和粮食安全的重要抓手,因而本文对中国“加总”粮食生产碳排放进行测算,刻画其动态演进特征,并从整体、阶段和区域效应3个视角探究多因素碳减排的空间溢出效应,这具有一定的现实意义。但是,本文还存在些许不足:① 在“双碳”和安全降碳目标作用下,对粮食生产碳排放的测算不应局限于碳排放部分,同时以县级单元为研究对象科学处理“加总”粮食生产碳排放种植结构的影响,但这一研究需克服碳汇测算争议和县域数据难题。② 基于现有数据样本剖析过去与现状情景外,未来还应引入预测和模拟模型探析未来粮食生产碳排放的走向趋势。③ 自适应Lasso回归和SDM模型相结合削弱了影响因素在阶段间和区域间的可比性,而选择相同影响因素检验空间溢出效应则忽略了不同样本内多变量间的多重共线性问题,如何兼顾样本有效性和分样本间可比性,这是未来研究高维度数据驱动机制的重点。④ 针对具体政策措施定量评估粮食生产碳减排效果。这些问题均值得做更为深入的探讨。
关联数据信息:本文关联实体数据集已在《全球变化数据仓储电子杂志(中英文)》出版,获取地址: https://doi.org/10.3974/geodb.2023.07.10.V1.
参考文献
View Option
[1]
Chen Yangfen Wang Jieyong Zhang Fengrong et al . New patterns of globalization and food security
Journal of Natural Resources , 2021 , 36 (6 ): 1362 -1380 .
DOI:10.31497/zrzyxb.20210602
[本文引用: 1]
The world is undergoing tremendous changes, and food security is encountering major challenges in China and even the world. In order to systematically study globalization and explore its new patterns, new issues and new paths for food security, we interviewed ten distinguished professors from different fields and discussed hot topics, including the potential for increasing farmland production, agricultural water and soil resources and food production, food waste, international agricultural product trade, stable supply of key agricultural product, global agricultural food system, dual circulation pattern and corporate actions, global food production and consumption, international food security governance, and cutting-edge research on food safety. The result shows that the global agricultural food system has entered an era of complexity and high risk. International food security governance is facing challenges in terms of resources, binding force and action power. We are facing an increasing pressure of import dependent agricultural products to ensure stable supply. It is necessary to deepen supply-side reform and strengthen demand-side management so as to guarantee national food security. New changes have taken place in globalization. This will test China's ability to deepen agricultural opening-up, participate in global food security governance, and achieve national food security. In the face of complex international and domestic situations, for better national food security governance, it is necessary to adhere to system thinking and coordinate domestic and international markets. It is also very important to target the entire industry chain, emphasize risk control, and handle the relationship between the government and the market. Furthermore, researchers need to explore the internal relationships and specific mechanisms between food security and other important issues, such as food systems, ecosystems, high-quality development goals, agricultural opening-up, and new dual-circulation development patterns. This could provide a scientific reference for establishing and improving the national food security strategy of "featuring self-sufficiency based on domestic grain production, guaranteed food production capacity, moderate imports, and technological support" in the New Era.
[陈秧分 , 王介勇 , 张凤荣 , 等 . 全球化与粮食安全新格局
自然资源学报 , 2021 , 36 (6 ): 1362 -1380 .]
DOI:10.31497/zrzyxb.20210602
[本文引用: 1]
当今世界正面临“百年未有之大变局”,中国与全球的粮食安全面临重大挑战。为了系统认知全球化与粮食安全的新格局、新问题和新路径,邀请了十位来自不同专业领域的知名专家,就耕地增产潜力、农业水土资源与粮食生产、食物浪费、国际农产品贸易、重点农产品保供稳供、全球农业食物系统、双循环与企业行动、全球粮食生产与消费、国际粮安治理、粮食安全研究前沿等领域进行了一对一的交流访谈。访谈结果表明:全球农业食物系统进入复合型高风险时代,国际粮安治理面临资源、约束力、行动力等方面的挑战,凸显国家粮食安全尤其是进口依赖型农产品的保供稳供压力,需要加强国内农业供给侧改革与需求侧管理。全球化发生新变化,考验中国深化农业对外开放、参与全球粮安治理、实现国家粮食安全的能力水平。面对复杂的国际国内形势,国家粮食安全治理需要坚持系统思维、统筹国内国际、瞄准全产业链、强调风险管控、处理好政府与市场关系,进一步深入研究食物系统和粮食安全、生态系统和粮食安全、高质量发展与粮食安全、农业对外开放与粮食安全、双循环新格局与粮食安全等方面的具体方式路径,为新时期建立健全“以我为主、立足国内、确保产能、适度进口、科技支撑”的国家粮食安全战略提供科学参考。
[3]
Qi X X Wang R Y Li J C et al . Ensuring food security with lower environmental costs under intensive agricultural land use patterns: A case study from China
Journal of Environmental Management , 2018 , 213 : 329 -340 .
DOI:S0301-4797(18)30155-5
PMID:29502018
[本文引用: 1]
Rapid population growth and environmental deterioration make ensuring food security with lower environmental costs fundamental to realizing sustainable development in China and other developing countries. The conceptual framework used in this paper integrates the major consequences of intensive agricultural land use and the diverse objectives of policymakers and farmers. It also offers an operational approach, based on farmers' diverse performance in grain production and farmland productivity, to assess food production and environmental impacts under foci-differentiated scenarios. Using data from farmer household surveys, soil surveys, land use images, and statistical yearbooks, this approach was tested using a regional case in China. The results indicate that, among all farmer types, the medium-scale farmers had a better comprehensive performance for grain production for yield, fertilizer and pesticide inputs, labor productivity, and sustainability. Therefore, grain yields can be increased and environmental costs reduced simultaneously through the use of policy instruments that encourage the transformation of trapped farmers into medium-scale farmers and balancing the proportion of single and double cropped rice. In addition, and in order to reduce grain losses caused by natural disasters and to prevent environmental degradation, robust policy measures should be developed to avoid the currently predominant cropping patterns that erode biodiversity.Copyright © 2018 Elsevier Ltd. All rights reserved.
[4]
Luo Wanchun China's food security governance: Development trends, challenges and improvements
Chinese Rural Economy , 2020 (12 ): 56 -66 .
[本文引用: 2]
[罗万纯 . 中国粮食安全治理: 发展趋势、挑战及改进
中国农村经济 , 2020 (12 ): 56 -66 .]
[本文引用: 2]
[5]
Chen Yangfen Wang Jieyong China's food security situation and strategy under the background of opening-up
Journal of Natural Resources , 2021 , 36 (6 ): 1616 -1630 .
DOI:10.31497/zrzyxb.20210620
[本文引用: 1]
Geopolitical competition between China and the United States has been intensifying, and uncertain events such as COVID-19 and extreme weather and climate occur frequently. The national strategy, which relies on two types of resources and two markets to ensure national food security, is facing challenges. Based on statistical data and literature viewpoints, this paper focuses on the main problems facing China's food security in the context of opening-up and how to ensure China's food security. The results show that: (1) China has made remarkable achievements in improving domestic food security, but with huge economic and resource environmental costs of food supply, and the increasing risks of stable food supply and access. The government is exploring practical ways for the achievement of food security in the era of globalization. (2) Agricultural opening-up can affect food supply, access, utilization and stability. The current opening-up has promoted the country's food supply, but it has not yet achieved stable and competitive food security. Agricultural opening-up still has a broad foundation for mutual benefit and win-win effect, while it is also facing greater uncertainty, which tests China's ability to deal with the challenges of globalization in food sector. (3) National food security governance is very important to food security. This paper recommends that we should adopt a self-sufficiency strategy with production capacity highlighted, a food security strategy for the entire industry chain to enrich the content of food, and a higher level of agricultural opening-up strategy, which will help to achieve the goal of national food security.
[陈秧分 , 王介勇 . 对外开放背景下中国粮食安全形势研判与战略选择
自然资源学报 , 2021 , 36 (6 ): 1616 -1630 .]
DOI:10.31497/zrzyxb.20210620
[本文引用: 1]
中美地缘政治竞争加剧,新冠肺炎疫情、极端天气气候等不确定性事件频发,依托两种资源两个市场的国家粮食安全策略面临新的挑战。结合统计数据与文献观点,分析了新时期中国粮食安全面临的主要问题,研究了农业开放保障粮食安全的主要效用,探索了扩大对外开放背景下我国粮食安全的保障思路。结果表明:(1)中国粮食安全取得了显著成就,但也存在粮食供应的经济与资源环境代价巨大、粮食稳定供应与获取的风险加大等问题,需要在开放条件下创新粮食安全实现路径。(2)农业对外开放可影响粮食供应、获取、利用与稳定性,当前对外开放促进了国家粮食供应,但尚未实现稳定的食物安全、有竞争力的食物安全。农业对外开放仍有广泛的互惠共赢基础,同时也面临更大的不确定性,考验我国粮食领域应对全球化“危”“机”的治理能力。(3)国家粮食安全治理对于保障粮食安全至关重要,建议采取凸显产能的粮食自给战略、全产业链的食物安全战略与高水平的农业对外开放战略,确保粮食安全落实落地。
[6]
Yang Guo Chen Yao China's agriculture carbon sink estimation and its coupling analysis with agricultural economy development
China Population, Resources and Environment , 2016 , 26 (12 ): 171 -176 .
[本文引用: 1]
[杨果 , 陈瑶 . 中国农业源碳汇估算及其与农业经济发展的耦合分析
中国人口·资源与环境 , 2016 , 26 (12 ): 171 -176 .]
[本文引用: 1]
[7]
Tian Yun Yin Minhao Re-evaluation of China's agricultural carbon emissions: Basic status, dynamic evolution and spatial spillover effects
Chinese Rural Economy , 2022 (3 ): 104 -127 .
[本文引用: 4]
[田云 , 尹忞昊 . 中国农业碳排放再测算: 基本现状、动态演进及空间溢出效应
中国农村经济 , 2022 (3 ): 104 -127 .]
[本文引用: 4]
[8]
Johnson J M Franzluebbers A J Weyers S L et al . Agricultural opportunities to mitigate greenhouse gas emission
Environmental Pollution , 2007 , 150 (1 ): 107 -124 .
PMID:17706849
[本文引用: 1]
Agriculture is a source for three primary greenhouse gases (GHGs): CO(2), CH(4), and N(2)O. It can also be a sink for CO(2) through C sequestration into biomass products and soil organic matter. We summarized the literature on GHG emissions and C sequestration, providing a perspective on how agriculture can reduce its GHG burden and how it can help to mitigate GHG emissions through conservation measures. Impacts of agricultural practices and systems on GHG emission are reviewed and potential trade-offs among potential mitigation options are discussed. Conservation practices that help prevent soil erosion, may also sequester soil C and enhance CH(4) consumption. Managing N to match crop needs can reduce N(2)O emission and avoid adverse impacts on water quality. Manipulating animal diet and manure management can reduce CH(4) and N(2)O emission from animal agriculture. All segments of agriculture have management options that can reduce agriculture's environmental footprint.
[9]
Li Bo Zhang Junbiao Li Haipeng Research on spatial-temporal characteristics and affecting factors decomposition of agricultural carbon emission in China
China Population, Resources and Environment , 2011 , 21 (8 ): 80 -86 .
[本文引用: 2]
[李波 , 张俊飚 , 李海鹏 . 中国农业碳排放时空特征及影响因素分解
中国人口·资源与环境 , 2011 , 21 (8 ): 80 -86 .]
[本文引用: 2]
[10]
Zhang Hengshuo Li Shaoping Peng Min Regional imbalance of carbon emission from China's rural energy consumption and dynamic identification of driving factors
Chinese Rural Economy , 2022 (1 ): 112 -134 .
[本文引用: 8]
[张恒硕 , 李绍萍 , 彭民 . 中国农村能源消费碳排放区域非均衡性及驱动因素动态识别
中国农村经济 , 2022 (1 ): 112 -134 .]
[本文引用: 8]
[11]
Wang Changhai Farmers' attitude towards ecological protection: New findings and policy implications
Journal of Management World , 2014 (11 ): 70 -79 .
[本文引用: 1]
[王昌海 . 农户生态保护态度:新发现与政策启示
管理世界 , 2014 (11 ): 70 -79 .]
[本文引用: 1]
[12]
Shao S Li B L Fan M T et al . How does labor transfer affect environmental pollution in rural China? Evidence from a survey
Energy Economics , 2021 , 102 : 105515 . DOI: 10.1016/j.eneco.2021.105515 .
URL
[本文引用: 5]
[13]
Zhang L Pang J X Chen X P et al . Carbon emissions, energy consumption and economic growth: Evidence from the agricultural sector of China's main grain-producing areas
Science of the Total Environment , 2019 , 665 : 1017 -1025 .
DOI:10.1016/j.scitotenv.2019.02.162
[本文引用: 2]
China is currently the world's largest carbon emitter. As a large agricultural country, understanding the relationship between carbon emissions, economic growth and energy consumption in the agricultural sector can contribute to achieving the sustainable development of agriculture. Hence, this paper aims to investigate the relationship between carbon emissions, energy consumption and economic growth in the agricultural sector using a time series of data from China's main grain-producing areas during the period between 1996 and 2015. We first estimate the agricultural carbon emissions. And then based on the estimated results, we employ the autoregressive distributed lag (ARDL) model, the Granger causality test based on the vector error correction model (VECM), and impulse response and variance decomposition to test the relationship between carbon emissions, energy consumption and economic growth in the agricultural sector. The estimated results support the environmental Kuznets curve (EKC) hypothesis for agricultural carbon emissions in China's main grain-producing areas. Furthermore, agricultural energy consumption has both the short-run and the long-run negative impacts on agricultural carbon emissions. In addition, we find that there is a bidirectional causality between agricultural carbon emissions and agricultural economic growth in both the short-run and the long-run, and the unidirectional causalities are found to exist from agricultural energy consumption to agricultural carbon emissions and agricultural economic growth. Finally, several policy recommendations are offered to promote the sustainable development of agriculture in China's main grain-producing areas. (c) 2019 Elsevier B.V.
[14]
Cao Xiang Gao Yu Liu Ziqi The impact of urbanization of rural residents on carbon emissions from household energy consumption
Chinese Rural Economy , 2021 (10 ): 64 -83 .
[本文引用: 5]
[曹翔 , 高瑀 , 刘子琪 . 农村人口城镇化对居民生活能源消费碳排放的影响分析
中国农村经济 , 2021 (10 ): 64 -83 .]
[本文引用: 5]
[15]
Tian Xiaohui Li Wei Li Rong The environmental effects of agricultural mechanization: Evidence from agricultural machinery purchase subsidy policy
Chinese Rural Economy , 2021 (9 ): 95 -109 .
[本文引用: 4]
[田晓晖 , 李薇 , 李戎 . 农业机械化的环境效应: 来自农机购置补贴政策的证据
中国农村经济 , 2021 (9 ): 95 -109 .]
[本文引用: 4]
[17]
Zhang Chao Sun Yiduo Sun Shengyang et al . Does the urban-rural income gap increase agricultural chemical input?
A case study of pesticide use. Chinese Rural Economy , 2019 (1 ): 96 -111 .
[本文引用: 4]
[张超 , 孙艺夺 , 孙生阳 , 等 . 城乡收入差距是否提高了农业化学品投入? 以农药施用为例
中国农村经济 , 2019 (1 ): 96 -111 .]
[本文引用: 4]
[18]
Xia Qiu Li Dan Zhou Hong Study on the influence of farmers' concurrent business behavior on agricultural non-point source pollution
China Population, Resources and Environment , 2018 , 28 (12 ): 131 -138 .
[本文引用: 1]
[夏秋 , 李丹 , 周宏 . 农户兼业对农业面源污染的影响研究
中国人口·资源与环境 , 2018 , 28 (12 ): 131 -138 .]
[本文引用: 1]
[19]
Qin Tian Peng Jue Deng Zongbing et al . Environmental decentralization, environmental regulation and agricultural non-point source pollution
China Population, Resources and Environment , 2021 , 31 (2 ): 61 -70 .
[本文引用: 1]
[秦天 , 彭珏 , 邓宗兵 , 等 . 环境分权、环境规制对农业面源污染的影响
中国人口·资源与环境 , 2021 , 31 (2 ): 61 -70 .]
[本文引用: 1]
[20]
Wang Baoyi Zhang Weiguo Cross-provincial differences in determinants of agricultural eco-efficiency in China: An analysis based on panel data from 31 provinces in 1996-2015
Chinese Rural Economy , 2018 (1 ): 46 -62 .
[本文引用: 2]
[王宝义 , 张卫国 . 中国农业生态效率的省际差异和影响因素: 基于1996—2015年31个省份的面板数据分析
中国农村经济 , 2018 (1 ): 46 -62 .]
[本文引用: 2]
[21]
Tian Xu Wang Shangao Environmental efficiency and its determinants regarding China's grain production
Resources Science , 2016 , 38 (11 ): 2106 -2116 .
DOI:10.18402/resci.2016.11.09
[本文引用: 1]
Environmental issues caused by agricultural production have attracted wide concern. Estimating environmental efficiency is an intuitive way to reflect the impact of agricultural production on ecological systems,which can make people realize the environmental costs of agricultural production and contribute to sustainable production. We used the Rural Fixed Point Observation(RFPO)dataset from 2004 to 2012 for China and adopted a stochastic frontier translog production function to estimate the environmental efficiency of China’s household grain production. A Tobit model was then used to identify the determinants of environmental efficiency. We found that the average technical efficiency and environmental efficiency are 0.802 and 0.489 respectively. A strong and positive association was also detected between these two efficiencies. The estimated average technical efficiency dropped slightly after taking environmental efficiency into account,while the relative magnitude of technical efficiency in three regions remains the same. We found that environmental efficiency varies greatly across regions and Central China has the highest efficiency while Eastern China the lowest. A decreasing trend along with time change in environmental efficiency was found for all three regions,indicating a deteriorating agricultural ecological system in China. Farmers with different scales also presented different environmental efficiency. Large-scale farmer’s environmental efficiency is higher than small-scale farmers. Environmental efficiency was also influenced by farmer characteristics,agricultural inputs,training and land fragmentation. In particular,older and well-educated farmers have higher environmental efficiency;larger scale farms and more labor input also contributed to lower pollution. Agricultural training,land fragmentation,and intensive use of fertilizers and pesticides have negative impacts on environmental efficiency.
[田旭 , 王善高 . 中国粮食生产环境效率及其影响因素分析
资源科学 , 2016 , 38 (11 ): 2106 -2116 .]
DOI:10.18402/resci.2016.11.09
[本文引用: 1]
近年来,农业生产带来的环境问题引起日益广泛的关注,而测算环境效率能直观反映农业生产对生态环境的影响,使人们清楚地认识到农业生产所付出的环境代价,进而推动中国农业生产向更具可持续性的方向转变。有鉴于此,本文基于2004-2012年全国农村固定观察点数据,采用超越对数随机前沿分析方法测算了中国农户粮食生产的环境效率,并用Tobit模型考察农户粮食生产环境效率的影响因素。研究结果表明:①全国范围内农户粮食生产的技术效率与环境效率均值分别为0.802和0.489,并且两种效率之间具有较高的相关性;②考虑环境效率后,中国粮食生产的技术效率均值出现了略微的下降趋势,但东部、中部、西部依次递减的趋势没有改变;③环境效率地区间差异明显,呈现出中部、西部、东部依次递减的趋势。而且随着时间变化,各地区的环境效率均呈现出递减趋势;④不同规模农户的粮食生产环境效率也存在差异,具体而言,大规模农户粮食生产环境效率普遍高于中小规模农户;⑤农户特征、农业生产要素、农业技术培训以及土地细碎化等因素均会影响粮食生产环境效率。
[22]
Li J Bo Y Xie S D Estimating emissions from crop residue open burning in China based on statistics and MODIS fire products
Journal of Environmental Sciences , 2016 , 44 : 158 -170 .
DOI:S1001-0742(16)00006-1
PMID:27266312
[本文引用: 2]
With the objective of reducing the large uncertainties in the estimations of emissions from crop residue open burning, an improved method for establishing emission inventories of crop residue open burning at a high spatial resolution of 0.25°×0.25° and a temporal resolution of 1month was established based on the moderate resolution imaging spectroradiometer (MODIS) Thermal Anomalies/Fire Daily Level3 Global Product (MOD/MYD14A1). Agriculture mechanization ratios and regional crop-specific grain-to-straw ratios were introduced to improve the accuracy of related activity data. Locally observed emission factors were used to calculate the primary pollutant emissions. MODIS satellite data were modified by combining them with county-level agricultural statistical data, which reduced the influence of missing fire counts caused by their small size and cloud cover. The annual emissions of CO2, CO, CH4, nonmethane volatile organic compounds (NMVOCs), N2O, NOx, NH3, SO2, fine particles (PM2.5), organic carbon (OC), and black carbon (BC) were 150.40, 6.70, 0.51, 0.88, 0.01, 0.13, 0.07, 0.43, 1.09, 0.34, and 0.06Tg, respectively, in 2012. Crop residue open burning emissions displayed typical seasonal and spatial variation. The highest emission regions were the Yellow-Huai River and Yangtse-Huai River areas, and the monthly emissions were highest in June (37%). Uncertainties in the emission estimates, measured as 95% confidence intervals, range from a low of within ±126% for N2O to a high of within ±169% for NH3. Copyright © 2016. Published by Elsevier B.V.
[23]
Zhang D Shen J B Zhang F S et al . Carbon footprint of grain production in China
Scientific Reports , 2017 , 7 : 4126 . DOI: 10.1038/s41598-017-04182-x .
PMID:28663590
[本文引用: 2]
Due to the increasing environmental impact of food production, carbon footprint as an indicator can guide farmland management. This study established a method and estimated the carbon footprint of grain production in China based on life cycle analysis (LCA). The results showed that grain production has a high carbon footprint in 2013, i.e., 4052 kg ce/ha or 0.48 kg ce/kg for maize, 5455 kg ce/ha or 0.75 kg ce/kg for wheat and 11881 kg ce/ha or 1.60 kg ce/kg for rice. These footprints are higher than that of other countries, such as the United States, Canada and India. The most important factors governing carbon emissions were the application of nitrogen fertiliser (8-49%), straw burning (0-70%), energy consumption by machinery (6-40%), energy consumption for irrigation (0-44%) and CH emissions from rice paddies (15-73%). The most important carbon sequestration factors included returning of crop straw (41-90%), chemical nitrogen fertiliser application (10-59%) and no-till farming practices (0-10%). Different factors dominated in different crop systems in different regions. To identity site-specific key factors and take countermeasures could significantly lower carbon footprint, e.g., ban straw burning in northeast and south China, stopping continuous flooding irrigation in wheat and rice production system.
[24]
Lu Qingyao Yang Chunhong A study on the changing trend and driving factors of carbon emissions from grain planting in China
On Economic Problems , 2023 (1 ): 114 -121 .
[本文引用: 1]
[鲁庆尧 , 杨春红 . 我国粮食种植碳排放量变化趋势与驱动因素研究
经济问题 , 2023 (1 ): 114 -121 .]
[本文引用: 1]
[25]
Zhang Yunhua Peng Chao Zhang Chen The use of nitrogen element and grain production efficiency: Evidence from national fixed point survey data
Journal of Management World , 2019 , 35 (4 ): 109 -119 .
[本文引用: 1]
[张云华 , 彭超 , 张琛 . 氮元素施用与农户粮食生产效率: 来自全国农村固定观察点数据的证据
管理世界 , 2019 , 35 (4 ): 109 -119 .]
[本文引用: 1]
[26]
Chen Fei Fan Qingquan Gao Tiemei Agricultural policies, food production and food production-adjustment ability
Economic Research Journal , 2010 , 45 (11 ): 101 -114 , 140.
[本文引用: 1]
[陈飞 , 范庆泉 , 高铁梅 . 农业政策、粮食产量与粮食生产调整能力
经济研究 , 2010 , 45 (11 ): 101 -114 , 140.]
[本文引用: 1]
[27]
Wang Yuemei Yao Xianguo Zhou Minghai Rural labor outflow, regional differences and food production
Journal of Management World , 2013 (11 ): 67 -76 .
[本文引用: 1]
[王跃梅 , 姚先国 , 周明海 . 农村劳动力外流、区域差异与粮食生产
管理世界 , 2013 (11 ): 67 -76 .]
[本文引用: 1]
[28]
Jin Tao The adjustment of China's grain cropping structure and its effects on the consumption of water and land resources
Journal of Natural Resources , 2019 , 34 (1 ): 14 -25 .
DOI:10.31497/zrzyxb.20190102
[本文引用: 1]
Estimation of the effect of grain production adjustment on the consumption of water and land resources will help to formulate the strategy for sustainable agricultural development. Since the mid and late 1990s, the proportion of corn in China's grain production has been obviously improved. Taking grain cropping structure without adjustment as the base scenario, and under certain grain output, the actual grain production adjustment in China during 1996-2015 has brought about the savings of water and land resources, accounting for about 4.2% and 3.7% of current demand in grain production respectively. The adjustment of grain production comes from grain demand structure change, which helps to alleviate the consumption pressure of water/land resources in grain production to some extent, though China's dietary transformation requires more agricultural resources. At the regional level, from the effect of structural adjustment on the demand for planting area, the savings in northern regions with relatively abundant arable land resources are significantly higher than those in the south. The area saving effect is higher in the northeast and northwest regions, and the least in southeastern coastal areas. From the effect of structural adjustment on the demand for water resources, the savings in northern regions are generally higher than those in the south, the highest in the northwest region with the highest drought degree, and the water saving effect in the middle and lower reaches of the Yangtze River is minimal. During the period, the output of regional grain crops has been widely affected by the change of cropping proportion, which is the indicator of the planting benefit and implies the change of consumption demand. Feed grain demand has increased more than rice and wheat rations, making the northern region suitable for corn planting become China's main grain production area. In the southern rice region, the demand for rice is relatively limited, and the regional production advantages of wheat, corn and soybeans are also lacking, which causes the relative stagnation of grain production in the south. To this end, in southern China, the recovery of grain production and full utilization of the potential of water/heat resources mainly depend on the consumption demand for rice and farmers' planting benefit. For the northern region, in order to reduce the amount of groundwater irrigation, it is necessary to rationally control the cropping area of rice and wheat and to adjust farming system according to the law of precipitation as far as possible.
[金涛 . 中国粮食作物种植结构调整及其水土资源利用效应
自然资源学报 , 2019 , 34 (1 ): 14 -25 .]
DOI:10.31497/zrzyxb.20190102
[本文引用: 1]
粮食种植结构调整会影响农业资源的消耗需求。20世纪90年代中后期以来,玉米在我国粮食生产中的地位明显提升。以粮食种植结构无调整为参照情景,一定产量下,1996-2015年,在国家层面,因粮食种植结构调整对水土资源消耗的节省量约占现期需求量的4%左右。在区域层面,从结构调整对种植面积的减省效应看,耕地资源相对丰富的北方地区明显高于南方地区;从对水资源消耗的减省效应看,北方贫水区也普遍高于南方地区,干旱度最高的西北地区最高。期间区域分品种粮食生产广泛受到作物种植比例变化的影响。研究结果表明,要充分利用好南方水热资源,恢复水稻生产,主要取决于稻米需求及其种植效益,而北方地区则要尽可能按降水规律调整农作制度,合理控制水稻、小麦的种植面积。
[29]
Tian Yun Zhang Junbiao Li Bo Agricultural carbon emissions in China: Calculation, spatial-temporal comparison and decoupling effects
Resources Science , 2012 , 34 (11 ): 2097 -2105 .
[本文引用: 3]
This study calculated the agricultural carbon emissions in China during 1995-2010, as well as 31 provinces in 2010, based on 16 categories of major carbon source from agricultural land use, paddy field, livestock enteric fermentation and manure management. We found that China’s agricultural carbon emissions in 2010 were 286.7323 million tons (equal to 1051.3517 million tons of carbon dioxide), a 12.31% increase over 1995 resulting from agricultural land use, paddy fields, livestock enteric fermentation and manure management, which respectively produced carbon emissions of 98.3164 million tons, 121.8020 million tons, 50.9619 million tons and 15.6520 million tons and accounted for 34.29%, 42.48%, 17.77% and 5.46% of total agricultural carbon emissions. Emissions displayed an obvious‘up-down-up’phase-change characteristic, increasing from 1995-1999, decreasing from 2000-2003, and increasing again from 2004-2010. In lateral view, the regional difference was clear as the top 10 regions accounted for 59.61% of the total agricultural carbon emissions, while that of the last 10 regions was only 8.33%. Hunan province ranked first palace and produced 24.2451 million carbon emissions, while Tianjin ranked last and produced only 0.7726 million carbon emissions. As for the structure of agricultural carbon emissions, based on the differences of carbon emissions ration the 31 provinces were divided into four types (paddy field dominant, agricultural land use dominant, livestock enteric fermentation dominant and composite factors led). Agricultural carbon emission intensity across west China was highest, followed by the middle zone, and the east zone was lowest. Tibet province was the highest zone, its agricultural carbon emission intensity as high as 2931.74kilograms per ten thousand agricultural gross domestic product, while Shandong province was the lowest zone with an agricultural carbon emission intensity as low as 207.75 kilograms per ten thousand agricultural gross domestic product. On this basis we conducted Tapio decoupling in the analysis of the decoupling relationship between China’s agricultural carbon emissions and agricultural economic development and found that main types are the weak decoupling and strong decoupling. Based on the difference of elastic, the last 15 years were divided into two stages: the first stage from 1996-2000 included strong decoupling, expansion connection and weak decoupling; the second stage from 2001-2010 had concentration on strong decoupling and weak decoupling, indicating that some certain results have been achieved in agricultural carbon emission reduction during recent years.
[田云 , 张俊飚 , 李波 . 中国农业碳排放研究: 测算、时空比较及脱钩效应
资源科学 , 2012 , 34 (11 ): 2097 -2105 .]
[本文引用: 3]
本研究基于农地利用、稻田、牲畜肠道发酵和粪便管理等四方面16类主要碳源, 测算了我国1995年-2010 年期间以及31 个省(市、区)2010 年的农业碳排放量。结果表明:①2010 年我国农业碳排放总量为2 8673.23万t, 较1995年增加了12.31%。其中, 农地利用、稻田、肠道发酵和粪便管理所导致的碳排放量分别占农业碳排总量的34.29%、42.48%、17.77%和5.46%;分阶段来看, 呈现较为明显的“上升-下降-上升”的三阶段变化特征;②横向来看, 区域差异明显:农业碳排放总量, 排在前10位的地区占全国农业总排放的59.61%, 而排在后10位的地区仅占全国8.33%, 传统农业大省尤其粮食主产省区是我国农业碳排放的主要来源地;基于碳排放比重差异, 将31个地区划分为了稻田主导型、农地利用主导型、牲畜肠道发酵主导型、复合因素主导型等四种不同结构类型;农业碳排放强度, 总体呈现出西高东低的特征, 即西部>中部>东部。在此基础上, 运用Tapio脱钩模型对我国农业碳排放与农业经济发展间的脱钩关系进行了分析, 发现以弱脱钩和强脱钩为主, 说明近年来我国在农业碳减排方面取得了一定成效。
[30]
Zhang Fan Xuan Xin Jin Gui et al . Agricultural non-CO2 greenhouse gases emissions and scenario simulation analysis
Acta Geographica Sinica , 2023 , 78 (1 ): 35 -53 .
[本文引用: 1]
[张帆 , 宣鑫 , 金贵 , 等 . 农业源非二氧化碳温室气体排放及情景模拟
地理学报 , 2023 , 78 (1 ): 35 -53 .]
DOI:10.11821/dlxb202301003
[本文引用: 1]
控制农业源非二氧化碳温室气体排放对中国落实温室气体减缓政策具有现实意义,对于推动农业绿色转型、实现乡村振兴具有指导价值。本文基于IPCC系数法核算了2000—2019年中国省际农业源非二氧化碳温室气体排放,刻画了农业源非二氧化碳温室气体排放强度时空演化规律;基于STRIPAT模型,解析了各地区农业源非二氧化碳温室气体的影响机理,模拟了不同情景组合下农业源非二氧化碳温室气体排放未来演变趋势。结果表明:① 动物肠道发酵甲烷排放是中国农业源非二氧化碳温室气体最主要的来源,中国农业源非二氧化碳温室气体排放逐渐由东部沿海向西部内陆地区转移。② “胡焕庸线”是单位农业增加值排放强度与单位农地面积排放强度高值区的分水岭,农牧交错带是中国单位农业增加值排放强度的高值区。③ 中国农业源非二氧化碳温室气体排放与人均GDP之间存在倒“N”型的EKC曲线关系,华北、东北和华中地区仍面临一定的减排压力,各区域农业源非二氧化碳温室气体排放影响机理存在显著差异。有效减少动物肠道发酵CH<sub>4</sub>排放,根据区域发展特征制定因地制宜的减排政策是未来中国农业源非二氧化碳温室气体减排的关键。
[31]
Min Jisheng Hu Hao Calculation of greenhouse gases emission from agricultural production in China
China Population, Resources and Environment , 2012 , 22 (7 ): 21 -27 .
[本文引用: 2]
[闵继胜 , 胡浩 . 中国农业生产温室气体排放量的测算
中国人口·资源与环境 , 2012 , 22 (7 ): 21 -27 .]
[本文引用: 2]
[32]
Lessmann M Ros G H Young M D et al . Global variation in soil carbon sequestration potential through improved cropland management
Global Change Biology , 2022 , 28 (3 ): 1162 -1177 .
DOI:10.1111/gcb.v28.3
URL
[本文引用: 1]
[33]
Ye X Chuai X W Carbon sinks/sources' spatiotemporal evolution in China and its response to built-up land expansion
Journal of Environmental Management , 2022 , 321 : 115863 . DOI: 10.1016/j.jenvman.2022.115863 .
URL
[本文引用: 1]
[34]
Zhu Wenbo Zhang Jingjing Cui Yaoping et al . Assessment of territorial ecosystem carbon storage based on land use change scenario: A case study in Qihe River Basin
Acta Geographica Sinica , 2019 , 74 (3 ): 446 -459 .
DOI:10.11821/dlxb201903004
[本文引用: 1]
The change of regional land use is the main cause for the change of carbon storage in territorial ecosystem, which affects the process of carbon emission and sink. However, previous studies on the impact of future land use change on ecosystem carbon storage considering temporal and spatial scales in the basin are still absent. This study analyzed land use change from 2005 to 2015 in the Qihe River Basin, Taihang mountainous areas, and used Markov-CLUE-S composite models to predict land use pattern of this region in 2025, under three scenarios of natural growth, farmland protection and ecological conservation. Based on the data of land use, we used carbon storage module in InVEST model to evaluate carbon storage of territorial ecosystem during the past 10 years and the future. The results showed that: (1) The carbon storage and carbon density of the ecosystem in the Qihe River Basin in 2015 were 3.16×10⁷ t and 141.9 t/hm2, respectively, and they both had decreased by 0.07×10⁷ t and 2.89 t/hm2 during the 10 years. (2) From 2005 to 2015, the carbon density was mainly reduced in low altitude areas, and the ratio of the increased areas was similar to that of the reduced areas in the high altitude areas. The decrease of carbon density was mainly caused by expansion of construction land in the middle and lower reaches, and degradation of forestland in the upper reach of Qihe River Basin. (3) From 2015 to 2025, the carbon storage and carbon density of ecosystem will decrease by 0.03×10⁷ t and 1.38 t/hm2 respectively in the natural growth scenario, mainly due to the reduction of carbon sequestration capacity in low altitude areas. The farmland conservation scenario will slow down the decrease of carbon storage and carbon density (0.01×10⁷ t and 0.44 t/hm2), mainly due to the enhancement of carbon sequestration capacity in low altitude areas. The ecological protection scenario will increase carbon storage and carbon density significantly to 3.19×10⁷ t and 143.26 t/hm2 respectively, mainly appearing in the area above 1100 m. The ecological protection scenario can enhance carbon sequestration capacity, but it cannot effectively control the loss of farmland area. Therefore, the land use planning of the study area can comprehensively consider the ecological protection scenario and farmland conservation scenario, which not only increases carbon sink, but also ensures the farmland quality and food security.
[朱文博 , 张静静 , 崔耀平 , 等 . 基于土地利用变化情景的生态系统碳储量评估: 以太行山淇河流域为例
地理学报 , 2019 , 74 (3 ): 446 -459 .]
DOI:10.11821/dlxb201903004
[本文引用: 1]
区域土地利用变化是导致生态系统碳储量变化的主要原因,影响其碳源、碳汇效应,但以往结合时空尺度探讨流域未来土地利用变化对生态系统碳储量影响的研究尚不多见。以太行山淇河流域为例,分析2005-2015年土地利用变化,采用Markov-CLUE-S复合模型预测2025年自然增长、耕地保护及生态保护情景下的土地利用格局,并基于土地利用数据,运用InVEST模型的碳储量模块评估2005-2015年及未来不同情景下的生态系统碳储量。结果表明:① 2015年淇河流域生态系统碳储量和平均碳密度分别为3.16×10<sup>7</sup> t和141.9 t/hm<sup>2</sup>,自2005年以来分别下降0.07×10<sup>7</sup> t和2.89 t/hm<sup>2</sup>。② 2005-2015年碳密度在低海拔区域以减少为主,在高海拔区域增加区与减少区比例相当,淇河中下游地区建设用地的大肆扩张以及上游林地的退化是导致碳密度下降的主要原因。③ 2015-2025年自然增长情景下碳储量和碳密度下降仍较明显,主要是低海拔区域固碳能力的减弱;耕地保护情景减缓了碳储量和碳密度的下降幅度,主要是由于低海拔区固碳能力的增强;生态保护情景下,碳储量和碳密度显著增加,分别达到3.19×10<sup>7</sup> t和143.26 t/hm<sup>2</sup>,主要发生在海拔高于1100 m的区域。生态保护情景能够增强固碳能力,但不能有效控制耕地面积的减小。因此,研究区土地利用规划可统筹考虑生态保护和耕地保护情景,既能增加碳汇,又能保障耕地质量和粮食安全。
[35]
Li Bo Wang Chunyu Zhang Junbiao Dynamic evolution and spatial spillover of China's agricultural net carbon sink
China Population, Resources and Environment , 2019 , 29 (12 ): 68 -76 .
[本文引用: 1]
[李波 , 王春妤 , 张俊飚 . 中国农业净碳汇效率动态演进与空间溢出效应
中国人口·资源与环境 , 2019 , 29 (12 ): 68 -76 .]
[本文引用: 1]
[36]
Wang Xiaoyu Xue Shuai Xie Guanghui Value-taking for residue factor as a parameter to assess the field residue of field crops
Journal of China Agricultural University , 2012 , 17 (1 ): 1 -8 .
[本文引用: 1]
[王晓玉 , 薛帅 , 谢光辉 . 大田作物秸秆量评估中秸秆系数取值研究
中国农业大学学报 , 2012 , 17 (1 ): 1 -8 .]
[本文引用: 1]
[37]
Dagum C A new approach to the decomposition of the Gini income inequality ratio
Empirical Economics , 1997 , 22 (4 ): 515 -531 .
DOI:10.1007/BF01205777
URL
[本文引用: 1]
[38]
Lefever D W Measuring geographic concentration by means of the standard deviational ellipse
American Journal of Sociology , 1926 , 32 (1 ): 88 -94 .
DOI:10.1086/214027
URL
[本文引用: 1]
[39]
Xu Di Xu Yan Spatio-temporal pattern of registered population in Nanjing from 1928 to 2017
Acta Geographica Sinica , 2022 , 77 (10 ): 2439 -2456 .
DOI:10.11821/dlxb202210003
[本文引用: 1]
Based on registered population data, this paper examined a variety of population density models to explore the spatio-temporal pattern of the registered population of Nanjing during the past century. The results showed that: (1) The number of registered residents in Nanjing from 1928 to 2017 showed a flat "S"-shaped growth trend, forming an extensive dispersion with localized concentration types. The population density was the greatest in the Qinhuai River area, which has been the main registered population center. (2) The spatial structure of the registered population included: point-single center, axis-double center, enclave compound-multi center, and radiation-circle polycentric center. (3) The polycentric model, which is based on the central place theory, provided the best explanation for the features of the spatial structure of the registered population. The registered population distribution pattern in Nanjing was attributed to the joint action of four spatial location rules: the distance-decay law, allometric growth effect, spatial polarization characteristic, and regional-edge structure. (4) The transitions in the city during the past century were not a de-urbanization but a temporary fluctuation because of social transformation. Notable differences remained between traditional-Chinese residential center and the central business district.
[徐旳 , 徐彦 . 1928—2017年南京城市户籍人口时空格局演变
地理学报 , 2022 , 77 (10 ): 2439 -2456 .]
DOI:10.11821/dlxb202210003
[本文引用: 1]
以户籍人口数据为基础,运用多种人口密度模型,探究1928—2017年南京城市户籍人口时空格局演变特征,探讨了单中心与多中心城市人口密度模型的适用性,归纳总结了南京城市户籍人口空间结构的演化过程与响应机制。研究表明:① 1928—2017年南京城市户籍人口数量呈扁“S”型阶梯式增长态势与向心式“大分散、小集中”的户籍人口分布格局,以秦淮河为核心的人口集聚区一直是南京城市户籍人口分布的主中心;② 百年尺度南京城市户籍人口空间结构特征呈现点状单中心、轴式双中心、飞地式复合多中心与放射圈层式多中心等4个发展阶段;③ 南京城市户籍人口分布格局可归因成距离衰减规律、异速增长效应、空间极化特性、区域边缘结构等4种空间区位法则的共同作用结果。基于中心地理论的多中心模型假设验核效果最优,符合城市户籍人口分布格局的识别特征;④ 近百年来南京城市户籍人口时空格局演变历程是中国近现代城市转型的缩影。南京历经百年制度变迁,城市户籍人口的“强中心”空间格局一直保持稳定,未见逆城市化端倪。中国传统城市人口居住中心与西方以城市规划用地功能为基础的中心商务区有本质区别。
[40]
Liu Huajun Guo Lixiang Qiao Liecheng et al . Spatial-temporal pattern and dynamic evolution of logistics efficiency in China
Journal of Quantitative & Technological Economics , 2021 , 38 (5 ): 57 -74 .
[本文引用: 2]
[刘华军 , 郭立祥 , 乔列成 , 等 . 中国物流业效率的时空格局及动态演进
数量经济技术经济研究 , 2021 , 38 (5 ): 57 -74 .]
[本文引用: 2]
[41]
Zhao Yanyan Zhang Xiaoping Chen Mingxing et al . Regional variation of urban air quality in China and its dominant factors
Acta Geographica Sinica , 2021 , 76 (11 ): 2814 -2829 .
DOI:10.11821/dlxb202111015
[本文引用: 1]
:Research on the spatiotemporal evolution of urban air pollution and its driving forces has great theoretical and practical significance because it helps to deeply understand the mutual feedback mechanism between urban environment and socio-economic system and improve the efficiency of environmental governance. This paper illustrated the regional evolution characteristics of six urban ambient air pollutants, namely, CO, NO2, O3_8h, PM10, PM2.5, and SO2, in 286 sample cities at the prefecture level in China from 2014 to 2019, starting from the year when the "Air Pollution Prevention and Control Action Plan" was fully implemented in China. The interactions between the concentrations of each pollutant were then analyzed on the basis of panel regression models. Furthermore, random forest model was employed to explore the correlations between concentrations of these six pollutants and thirteen natural and socio-economic impact factors so as to sort out crucial ones. The results are shown in three aspects. First, the average annual concentration of O3_8h increased while that of the other urban ambient air pollutants decreased year by year, among which SO2 concentration decreased the most. Although the typical heavy pollution areas had shrunk, cities in the Beijing-Tianjin-Hebei region, Shandong Peninsula region, Shanxi Province, and Henan Province still have witnessed relatively high concentrations of air pollutants. Second, there was a significant interaction between concentrations of these six pollutants, indicating that comprehensive measures for urban air pollution prevention are necessary. Third, the impact of natural factors and socio-economic factors on urban air quality varied greatly towards different air pollutants, together with a nonlinear response relationship with the pollutant concentrations. Within the selected five natural factors of temperature, precipitation, wind speed, humidity and NDVI, the urban annual average temperature had the strongest correlation with air pollutant concentrations, followed by NDVI. Among the eight selected socio-economic factors, the level of land urbanization and the proportion of secondary production were the two leading drivers of the urban air pollution, followed by the total power consumption and traffic factors. Besides, partial dependence model was used to further analyze the response threshold of different pollutant concentrations to the dominant influencing factors. In consideration of the limited ability of human to control the physical environment and meteorological conditions, it is recommended that urban air quality should be further effectively improved by means of the optimization of urban density, the control of man-made emission sources, and the implementation of strict air pollution prevention and control measures.
[赵艳艳 , 张晓平 , 陈明星 , 等 . 中国城市空气质量的区域差异及归因分析
地理学报 , 2021 , 76 (11 ): 2814 -2829 .]
DOI:10.11821/dlxb202111015
[本文引用: 1]
开展城市空气质量时空格局演变特征及其影响因素的研究,对于深入认识城市环境与社会经济系统的互馈机理、制定高效的环境治理措施、提升城市发展质量具有重要的理论与实践意义。本文以中国全面实施《大气污染防治行动计划》的2014年为起点,刻画了2014—2019年286个地级以上城市6种空气污染物浓度(CO、NO<sub>2</sub>、O<sub>3</sub>、PM<sub>10</sub>、PM<sub>2.5</sub>、SO<sub>2</sub>)的时空演变特征,并基于面板回归模型分析各污染物浓度之间的相互作用关系;进而利用随机森林模型对城市6种空气污染物浓度与13个自然和社会经济影响因子的关联强度进行探究,从中梳理出关键影响因子。结果显示:① 研究期内,O<sub>3</sub>污染加剧,其余污染物年均浓度逐年下降,其中SO<sub>2</sub>浓度降幅最大。虽然典型的重污染区范围有所减小,但京津冀、山东半岛、山西、河南等地区的城市空气污染物浓度仍相对较高。② 城市6种空气污染物浓度之间存在显著的相互影响关系,城市空气复合污染特征明显。③ 自然因素和社会经济因素对不同种类空气污染物浓度的影响差异较大,且与污染物浓度之间呈非线性响应关系。自然因素中,城市年均气温与空气污染物浓度的关联强度最大,其次是植被指数。社会经济影响因素中,土地城市化水平和二产比重是主导影响因子,其次是电力消耗总量和交通因子。偏依赖分析进一步刻画了不同污染物浓度对主导影响因子的响应突变阈值。鉴于人类对于自然环境和气象条件的控制能力有限,建议继续通过优化城市密度、控制人为排放源及严格的空气污染防控措施以进一步有效提高城市空气质量。
[42]
Lam C Souza P C L Estimation and selection of spatial weight matrix in a spatial lag model
Journal of Business & Economic Statistics , 2020 , 38 (3 ): 693 -710 .
DOI:10.1080/07350015.2019.1569526
URL
[本文引用: 1]
[43]
Liu Jiaqi Ru Shaofeng Research on factors of economic growth and path selection for high quality development of western China
Inquiry into Economic Issues , 2019 (9 ): 82 -90 .
[本文引用: 1]
[刘家旗 , 茹少峰 . 西部地区经济增长影响因素分析及其高质量发展的路径选择
经济问题探索 , 2019 (9 ): 82 -90 .]
[本文引用: 1]
[45]
Elhorst J P Matlab software for spatial panels
International Regional Science Review , 2014 , 37 (3 ): 389 -405 .
DOI:10.1177/0160017612452429
URL
[本文引用: 1]
Elhorst provides Matlab routines to estimate spatial panel data models at his website. This article extends these routines to include the bias correction procedure proposed by Lee and Yu if the spatial panel data model contains spatial and/or time-period fixed effects, the direct and indirect effects estimates of the explanatory variables proposed by LeSage and Pace, and a selection framework to determine which spatial panel data model best describes the data. To demonstrate these routines in an empirical setting, a demand model for cigarettes is estimated based on panel data from forty-six US states over the period 1963–1992.
[46]
LeSage J P Pace R K Introduction to Spatial Econometrics . Boca Raton : CRC Press Taylor & Francis Group , 2009 .
[本文引用: 1]
[47]
Dong Xiaoxia Huang Jikun Scott Rozelle et al . Research on the adjustment of geographical location, transportation infrastructure and planting structure
Journal of Management World , 2006 (9 ): 59 -63 , 79.
[本文引用: 1]
[董晓霞 , 黄季焜 , Scott Rozelle 等 . 地理区位、交通基础设施与种植业结构调整研究
管理世界 , 2006 (9 ): 59 -63 , 79.]
[本文引用: 1]
[48]
Liu Yansui Zhang Ziwen Wang Jieyong Regional differentiation and comprehensive regionalization scheme of modern agriculture in China
Acta Geographica Sinica , 2018 , 73 (2 ): 203 -218 .
DOI:10.11821/dlxb201802001
[本文引用: 1]
Agriculture consolidates the process of natural reproduction and economic reproduction. Spatial pattern of agricultural region is comprehensively influenced by factors such as natural geography, economic and social development and advances in technology. Along with the changes of these influencing factors over a long period, agricultural pattern and agricultural function present regional differentiation and spatio-temporal evolution. This lays a scientific foundation for comprehensive agricultural regionalization. China is currently experiencing a new period of coordinated development of industrialization, urbanization, informatization and agricultural modernization. This paper firstly investigates spatio-temporal changes and dynamic characteristics of modern agriculture development conditions in China. Then, it puts forward the coupling measure index system of agricultural natural factors and regional function, zoning principles and scientific method of modern agricultural regionalization under the new development background. Using cluster analysis and qualitative analysis, it carries out a comprehensive research and puts forward China's modern agriculture regionalization scheme in the new era, which divides China into 15 agricultural first-grade regions and 53 agricultural sub-regions. After doing a comparative analysis with the new scheme and the previous one, which was published in 1981, the paper makes a systematic interpretation on current producing situation, regional function, spatial pattern changes and agricultural development trend of each agricultural region and the whole country at last. The results of this research provide scientific basis for strategic structural adjustment and development of modern agriculture in each region. At the theoretical level, this paper provides a research reference for the development of modern agriculture and rural geography. At the application level, it promotes integrated geography research to serve the rural revitalization and national development strategic needs in the transition period in China. The regional agriculture is a natural, economic and technological complex system, with the characteristics of complexity, dynamics and high risk. As such, based on the congnition of spatial differentiation of modern agriculture development patterns, it is necessary to deeply analyze the regional differentiation of agricultural endogenous power, agriculture and rural territorial types, to improve observational research of agricultural geographical engineering and technology, and the economic, ecological, climatic integrated effects of regional agriculture transformation, to summarize systematically regional agricultural models and regional transformation patterns, to explore the early warning mechanism of modern agricultural complex system, and to study continuously the theories and strategic decision-making for promoting agricultural modernization and rural revitalization.
[刘彦随 , 张紫雯 , 王介勇 . 中国农业地域分异与现代农业区划方案
地理学报 , 2018 , 73 (2 ): 203 -218 .]
DOI:10.11821/dlxb201802001
[本文引用: 1]
农业是自然再生产与经济再生产过程的统一,农业地域格局取决于自然、经济、社会和技术等要素的综合影响,而且伴随着这些要素的长期变化而产生时空演化和区域分异,由此奠定了综合农业区划的科学基础。本文探讨了中国工业化、城镇化、信息化和农业现代化协调发展新战略,剖析了现代农业发展环境的时空转变及其动态特征,建立了农业自然要素与农业地域功能耦合测度指标体系,应用聚类分析和定性评判综合手段提出了新时期中国现代农业区划原则和方法,制定了全国现代农业区划方案。该方案包括15个农业一级区、53个农业二级区,并与1981年农业综合区划方案进行比较分析,深入揭示了快速工业化、城镇化、信息化进程中中国农业生产结构、地域功能、格局动态和发展趋向,为新时期加快各地区现代农业战略性结构调整,促进农业现代化发展奠定了重要基础,为创新发展现代农业与乡村地理学,促进地理学综合研究服务国家战略需求提供了重要参考。
[49]
Lei Ming Kong Xiangbin Wang Jianing Estimation of sustainable grain productivity for arable land under water balance in the Huang-Huai-Hai Plain
Acta Geographica Sinica , 2018 , 73 (3 ): 535 -549 .
DOI:10.11821/dlxb201803011
[本文引用: 1]
China puts forward the national strategy of fallow plan so as to improve the sustainable grain production capacity of arable land and alleviate the continuous decline of the groundwater level in the Huang-Huai-Hai Plain. Aiming at estimation of sustainable grain productivity for ensuring the implementation of this strategy, this paper learns management experience and experimental production from agricultural experiment station and adopts step-by-step correction method in twelve agricultural ecological zones, which are relatively uniform in social and economic conditions based on the sustainable theory and water balance. The results showed that: (1) The total sustainable grain production capacity of arable land under water balance in the Huang-Huai-Hai Plain was 116 million t/year. (2) The yield gap of sustainable grain productivity was -0.67 million t/year, the wheat yield gap was -3.31 million t/year due to limited-water irrigation and the maize yield gap was positive. (3) The loss area of wheat production is mainly distributed in Heilonggang area, Luxi Plain, the Beijing-Tianjin-Tangshan Plain and the eastern Henan Plain, and the potential area is mainly in Xuhuai Plain, the Northern Anhui Plain and Jiaoxi Yellow River Flood Plain. The research was valuable for understanding the sustainable productivity of cultivated land and implementing the reliable spatial pattern of agricultural production in the Huang-Huai-Hai Plain.
[雷鸣 , 孔祥斌 , 王佳宁 . 水平衡下黄淮海平原区耕地可持续生产能力测算
地理学报 , 2018 , 73 (3 ): 535 -549 .]
DOI:10.11821/dlxb201803011
[本文引用: 1]
为缓解黄淮海平原区地下水水位的持续下降,国家提出耕地资源休养生息的战略,而实施耕地资源休养生息的关键,是确保水平衡下的耕地资源可持续生产能力。本文从可持续理论和水平衡的条件出发,将黄淮海划分成12个自然条件、社会经济条件相对均一的农业生态区,采用不同农业生态区代表实验站限水高产的产量和管理经验,以水定产并逐步修正,得到了黄淮海平原区耕地可持续生产能力,并与现实产量对比得到产量差。结果表明:① 水平衡条件下黄淮海平原区耕地的可持续粮食生产能力为1.16亿t/年;② 可持续总产产量差为-67.85万t/年,由于限水灌溉造成的粮食产能损失为小麦331.84万t/年,玉米不存在产能损失;③ 小麦主要压产地区为黑龙港地区、鲁西平原、豫东平原以及京津唐平原,而徐淮低平原、豫东平原以及胶西黄泛平原具有一定的提产潜力。通过测算,进一步认识了黄淮海平原区耕地可持续产能状况,为区域粮食生产的合理布局以及农业限水限产提供可靠依据。
[50]
Zhong Funing Gu Hejun Ji Yueqing The role differentiation of farmers and the income distribution effect of agricultural subsidies: An empirical study on the income distribution effect of agricultural tax reduction and food direct subsidies in Jiangsu province
Journal of Management World , 2008 (5 ): 65 -70 , 76.
[本文引用: 1]
[钟甫宁 , 顾和军 , 纪月清 . 农民角色分化与农业补贴政策的收入分配效应: 江苏省农业税减免、粮食直补收入分配效应的实证研究
管理世界 , 2008 (5 ): 65 -70 , 76.]
[本文引用: 1]
[51]
Xu Qing Yang Qing Zhang Yuan The effect of agricultural subsidies reform on the optimum-scale management of grain
Economic Research Journal , 2021 , 56 (8 ): 192 -208 .
[本文引用: 1]
[许庆 , 杨青 , 章元 . 农业补贴改革对粮食适度规模经营的影响
经济研究 , 2021 , 56 (8 ): 192 -208 .]
[本文引用: 1]
[52]
Wu Liancui Tan Junmei Empirical analysis on yield effect and action path of grain subsidy policy
China Population, Resources and Environment , 2013 , 23 (9 ): 100 -106 .
[本文引用: 1]
[吴连翠 , 谭俊美 . 粮食补贴政策的作用路径及产量效应实证分析
中国人口·资源与环境 , 2013 , 23 (9 ): 100 -106 .]
[本文引用: 1]
[53]
Gong B L Agricultural reforms and production in China: Changes in provincial production function and productivity in 1978-2015
Journal of Development Economics , 2018 , 132 : 18 -31 .
DOI:10.1016/j.jdeveco.2017.12.005
URL
[本文引用: 1]
[56]
Duan J K Ren C C Wang S T et al . Consolidation of agricultural land can contribute to agricultural sustainability in China
Nature Food , 2021 , 2 (12 ): 1014 -1022 .
DOI:10.1038/s43016-021-00415-5
PMID:37118257
[本文引用: 1]
China's agricultural sector is dominated by smallholder farms, which mostly exhibit relatively low nutrient use efficiency, low agricultural income and substantial non-point-source pollution. Here we assess the spatial feasibility and cost-effectiveness of agricultural land consolidation in China by integrating data from over 40,000 rural surveys, ecological modelling and geostatistical analysis. We found that 86% of Chinese croplands could be consolidated to establish a large-scale farming regime with an average field size greater than 16 ha. This would result in a 59% and 91% increase in knowledge exchange and machinery use, respectively, contributing to a 24% reduction in total nitrogen input, an 18% increase in nitrogen use efficiency and a 39% reduction in labour requirement, while doubling labour income. Despite requiring a one-time investment of approximate US$370 billion for land consolidation, total agricultural profits would double due to agricultural production costs being halved.© 2021. The Author(s), under exclusive licence to Springer Nature Limited.
全球化与粮食安全新格局
1
2021
... 粮食生产关系国计民生,在国家政策倾斜、资金扶持和技术支撑等条件下中国粮食生产于2020年实现“十七连丰”,谷物总产量稳居世界首位,为解决中国14亿人口吃饭问题提供了保障[1 ] .然而,长期以来粮食增产依赖农用化学品的大量使用,导致农业面源污染等环境问题日益加剧[2 ⇓ -4 ] ,依赖传统粗放式发展谋求粮食增产加剧了生态环境恶化、扩大了粮食生产风险.已有学者指出在充分考虑生态环境恶化问题后的粮食增产空间几乎接近“天花板”[5 ] .由粮食生产的自然属性可知,粮食生产具有碳排和碳汇的双重属性[6 ] ,降碳减排是促成碳中和、碳达峰的基本盘[7 ] .从这个意义上来说,粮食生产碳减排对缓解环境压力、实现绿色生产和提升粮食供给品质更为重要,也是助力中国2030年实现“碳达峰”的有效途径.在此背景下,中国高度重视粮食生产绿色转型与粮食安全的协调问题,2021年《中共中央国务院关于完整准确全面贯彻新发展理念做好碳达峰碳中和工作的意见》,指出“要处理好减污降碳与粮食安全的关系,防止过度反应以确保安全降碳”;2022年《减污降碳协同增效实施方案》指出,“深入实施化肥农药减量增效行动,提升粮食生产化肥、农药利用率以落实碳减排要求”;中国共产党的“二十大”报告也指出,“协同推进降碳、减污、扩绿、增长”,夯实粮食安全根基.因此,如何科学估算粮食生产碳排放并掌握其演进规律,是中国应对气候变化、落实安全降碳要求和制定粮食安全策略的关键问题,也是中国谋求可持续发展、实现全球共同利益以及构建人类生命共同体的重要课题. ...
Effects of land lease policy on changes in land use, mechanization and agricultural pollution
1
2017
... 粮食生产关系国计民生,在国家政策倾斜、资金扶持和技术支撑等条件下中国粮食生产于2020年实现“十七连丰”,谷物总产量稳居世界首位,为解决中国14亿人口吃饭问题提供了保障[1 ] .然而,长期以来粮食增产依赖农用化学品的大量使用,导致农业面源污染等环境问题日益加剧[2 ⇓ -4 ] ,依赖传统粗放式发展谋求粮食增产加剧了生态环境恶化、扩大了粮食生产风险.已有学者指出在充分考虑生态环境恶化问题后的粮食增产空间几乎接近“天花板”[5 ] .由粮食生产的自然属性可知,粮食生产具有碳排和碳汇的双重属性[6 ] ,降碳减排是促成碳中和、碳达峰的基本盘[7 ] .从这个意义上来说,粮食生产碳减排对缓解环境压力、实现绿色生产和提升粮食供给品质更为重要,也是助力中国2030年实现“碳达峰”的有效途径.在此背景下,中国高度重视粮食生产绿色转型与粮食安全的协调问题,2021年《中共中央国务院关于完整准确全面贯彻新发展理念做好碳达峰碳中和工作的意见》,指出“要处理好减污降碳与粮食安全的关系,防止过度反应以确保安全降碳”;2022年《减污降碳协同增效实施方案》指出,“深入实施化肥农药减量增效行动,提升粮食生产化肥、农药利用率以落实碳减排要求”;中国共产党的“二十大”报告也指出,“协同推进降碳、减污、扩绿、增长”,夯实粮食安全根基.因此,如何科学估算粮食生产碳排放并掌握其演进规律,是中国应对气候变化、落实安全降碳要求和制定粮食安全策略的关键问题,也是中国谋求可持续发展、实现全球共同利益以及构建人类生命共同体的重要课题. ...
Ensuring food security with lower environmental costs under intensive agricultural land use patterns: A case study from China
1
2018
... 粮食生产关系国计民生,在国家政策倾斜、资金扶持和技术支撑等条件下中国粮食生产于2020年实现“十七连丰”,谷物总产量稳居世界首位,为解决中国14亿人口吃饭问题提供了保障[1 ] .然而,长期以来粮食增产依赖农用化学品的大量使用,导致农业面源污染等环境问题日益加剧[2 ⇓ -4 ] ,依赖传统粗放式发展谋求粮食增产加剧了生态环境恶化、扩大了粮食生产风险.已有学者指出在充分考虑生态环境恶化问题后的粮食增产空间几乎接近“天花板”[5 ] .由粮食生产的自然属性可知,粮食生产具有碳排和碳汇的双重属性[6 ] ,降碳减排是促成碳中和、碳达峰的基本盘[7 ] .从这个意义上来说,粮食生产碳减排对缓解环境压力、实现绿色生产和提升粮食供给品质更为重要,也是助力中国2030年实现“碳达峰”的有效途径.在此背景下,中国高度重视粮食生产绿色转型与粮食安全的协调问题,2021年《中共中央国务院关于完整准确全面贯彻新发展理念做好碳达峰碳中和工作的意见》,指出“要处理好减污降碳与粮食安全的关系,防止过度反应以确保安全降碳”;2022年《减污降碳协同增效实施方案》指出,“深入实施化肥农药减量增效行动,提升粮食生产化肥、农药利用率以落实碳减排要求”;中国共产党的“二十大”报告也指出,“协同推进降碳、减污、扩绿、增长”,夯实粮食安全根基.因此,如何科学估算粮食生产碳排放并掌握其演进规律,是中国应对气候变化、落实安全降碳要求和制定粮食安全策略的关键问题,也是中国谋求可持续发展、实现全球共同利益以及构建人类生命共同体的重要课题. ...
中国粮食安全治理: 发展趋势、挑战及改进
2
2020
... 粮食生产关系国计民生,在国家政策倾斜、资金扶持和技术支撑等条件下中国粮食生产于2020年实现“十七连丰”,谷物总产量稳居世界首位,为解决中国14亿人口吃饭问题提供了保障[1 ] .然而,长期以来粮食增产依赖农用化学品的大量使用,导致农业面源污染等环境问题日益加剧[2 ⇓ -4 ] ,依赖传统粗放式发展谋求粮食增产加剧了生态环境恶化、扩大了粮食生产风险.已有学者指出在充分考虑生态环境恶化问题后的粮食增产空间几乎接近“天花板”[5 ] .由粮食生产的自然属性可知,粮食生产具有碳排和碳汇的双重属性[6 ] ,降碳减排是促成碳中和、碳达峰的基本盘[7 ] .从这个意义上来说,粮食生产碳减排对缓解环境压力、实现绿色生产和提升粮食供给品质更为重要,也是助力中国2030年实现“碳达峰”的有效途径.在此背景下,中国高度重视粮食生产绿色转型与粮食安全的协调问题,2021年《中共中央国务院关于完整准确全面贯彻新发展理念做好碳达峰碳中和工作的意见》,指出“要处理好减污降碳与粮食安全的关系,防止过度反应以确保安全降碳”;2022年《减污降碳协同增效实施方案》指出,“深入实施化肥农药减量增效行动,提升粮食生产化肥、农药利用率以落实碳减排要求”;中国共产党的“二十大”报告也指出,“协同推进降碳、减污、扩绿、增长”,夯实粮食安全根基.因此,如何科学估算粮食生产碳排放并掌握其演进规律,是中国应对气候变化、落实安全降碳要求和制定粮食安全策略的关键问题,也是中国谋求可持续发展、实现全球共同利益以及构建人类生命共同体的重要课题. ...
... 基于研究发现制定粮食生产绿色转型行动尤为关键,对此提出几点政策启示如下:① 摒弃“一炮轰”的粗放式碳减排管理,有效延续“十三五”时期粮食生产的降碳趋势.具体地,对于主产区、产销平衡区以及长江中下游地区和华北地区,尤其是山东、河南等粮食生产大省以及内蒙古、黑龙江等增碳大省,改变过度依赖物资资料投入的传统粮食生产模式,选择清洁化的秸秆还田方式,促使粮食生产转向降碳阶段.同时,有效发挥农户在粮食生产绿色转型中的主体作用有效解决规模化生产难题[4 ] ,加强化肥、农药等污染源头管理,解决粮食增产与降碳之间的矛盾.② 汲取“十三五”时期粮食生产碳排放空间差距增长的经验,如北京、上海和浙江等地在粮食生产领域已形成降碳之势,但这些地区粮食增产空间有限且多为经济发达地区,劣势省份需在考虑经济社会发展差异的前提下将优势地区的降碳策略本土化;如山东和河南等粮食生产大省通过引进绿色生产技术实现降碳与粮食增产的双赢局面,通过降低这些高值区碳排放能有效形成区域间和省际间优势互补、良性互动格局,避免因粮食生产功能区划分引发“碳泄漏”效应.③ 基于现实碳减排驱动力因地制宜制定粮食总体和区域性碳减排方案.总体上,既有耕地资源一定的情况下,提升落后地区粮食生产的机械化水平,避免耕地撂荒、细碎化或小规模经营导致的增碳,合理引导农户开展耕地流转并协调好城乡要素资源的自由流动等方式[56 ] ,加强粮食适度规模经营以实现本地和邻地双向碳减排目标.同时,充分利用在阶段演变过程中对于粮食生产碳减排具有稳定性的农业总产值、农村总人口和粮食总产量等因素,夯实技术进步的碳减排驱动力.区域共性方面发挥农业结构调整对空间关联地区的碳减排效应,充分发挥主产区粮食生产潜能对绿色生产技术的敏感性,欠发达省份通过政府、企业等平台引进实用性绿色专利,提升绿色技术利用率;以村集体为单位引导产销平衡区农户关注气候和降水等自然灾害,及时传达灾害预防的信息,缩减灾害发生频率;而主销区粮食生产压力大于其降碳压力,采用现代化土壤管理技术,改善耕地肥力,扩大化肥、农药等物资资料投入吸收率以实现粮食增产. ...
对外开放背景下中国粮食安全形势研判与战略选择
1
2021
... 粮食生产关系国计民生,在国家政策倾斜、资金扶持和技术支撑等条件下中国粮食生产于2020年实现“十七连丰”,谷物总产量稳居世界首位,为解决中国14亿人口吃饭问题提供了保障[1 ] .然而,长期以来粮食增产依赖农用化学品的大量使用,导致农业面源污染等环境问题日益加剧[2 ⇓ -4 ] ,依赖传统粗放式发展谋求粮食增产加剧了生态环境恶化、扩大了粮食生产风险.已有学者指出在充分考虑生态环境恶化问题后的粮食增产空间几乎接近“天花板”[5 ] .由粮食生产的自然属性可知,粮食生产具有碳排和碳汇的双重属性[6 ] ,降碳减排是促成碳中和、碳达峰的基本盘[7 ] .从这个意义上来说,粮食生产碳减排对缓解环境压力、实现绿色生产和提升粮食供给品质更为重要,也是助力中国2030年实现“碳达峰”的有效途径.在此背景下,中国高度重视粮食生产绿色转型与粮食安全的协调问题,2021年《中共中央国务院关于完整准确全面贯彻新发展理念做好碳达峰碳中和工作的意见》,指出“要处理好减污降碳与粮食安全的关系,防止过度反应以确保安全降碳”;2022年《减污降碳协同增效实施方案》指出,“深入实施化肥农药减量增效行动,提升粮食生产化肥、农药利用率以落实碳减排要求”;中国共产党的“二十大”报告也指出,“协同推进降碳、减污、扩绿、增长”,夯实粮食安全根基.因此,如何科学估算粮食生产碳排放并掌握其演进规律,是中国应对气候变化、落实安全降碳要求和制定粮食安全策略的关键问题,也是中国谋求可持续发展、实现全球共同利益以及构建人类生命共同体的重要课题. ...
中国农业源碳汇估算及其与农业经济发展的耦合分析
1
2016
... 粮食生产关系国计民生,在国家政策倾斜、资金扶持和技术支撑等条件下中国粮食生产于2020年实现“十七连丰”,谷物总产量稳居世界首位,为解决中国14亿人口吃饭问题提供了保障[1 ] .然而,长期以来粮食增产依赖农用化学品的大量使用,导致农业面源污染等环境问题日益加剧[2 ⇓ -4 ] ,依赖传统粗放式发展谋求粮食增产加剧了生态环境恶化、扩大了粮食生产风险.已有学者指出在充分考虑生态环境恶化问题后的粮食增产空间几乎接近“天花板”[5 ] .由粮食生产的自然属性可知,粮食生产具有碳排和碳汇的双重属性[6 ] ,降碳减排是促成碳中和、碳达峰的基本盘[7 ] .从这个意义上来说,粮食生产碳减排对缓解环境压力、实现绿色生产和提升粮食供给品质更为重要,也是助力中国2030年实现“碳达峰”的有效途径.在此背景下,中国高度重视粮食生产绿色转型与粮食安全的协调问题,2021年《中共中央国务院关于完整准确全面贯彻新发展理念做好碳达峰碳中和工作的意见》,指出“要处理好减污降碳与粮食安全的关系,防止过度反应以确保安全降碳”;2022年《减污降碳协同增效实施方案》指出,“深入实施化肥农药减量增效行动,提升粮食生产化肥、农药利用率以落实碳减排要求”;中国共产党的“二十大”报告也指出,“协同推进降碳、减污、扩绿、增长”,夯实粮食安全根基.因此,如何科学估算粮食生产碳排放并掌握其演进规律,是中国应对气候变化、落实安全降碳要求和制定粮食安全策略的关键问题,也是中国谋求可持续发展、实现全球共同利益以及构建人类生命共同体的重要课题. ...
中国农业碳排放再测算: 基本现状、动态演进及空间溢出效应
4
2022
... 粮食生产关系国计民生,在国家政策倾斜、资金扶持和技术支撑等条件下中国粮食生产于2020年实现“十七连丰”,谷物总产量稳居世界首位,为解决中国14亿人口吃饭问题提供了保障[1 ] .然而,长期以来粮食增产依赖农用化学品的大量使用,导致农业面源污染等环境问题日益加剧[2 ⇓ -4 ] ,依赖传统粗放式发展谋求粮食增产加剧了生态环境恶化、扩大了粮食生产风险.已有学者指出在充分考虑生态环境恶化问题后的粮食增产空间几乎接近“天花板”[5 ] .由粮食生产的自然属性可知,粮食生产具有碳排和碳汇的双重属性[6 ] ,降碳减排是促成碳中和、碳达峰的基本盘[7 ] .从这个意义上来说,粮食生产碳减排对缓解环境压力、实现绿色生产和提升粮食供给品质更为重要,也是助力中国2030年实现“碳达峰”的有效途径.在此背景下,中国高度重视粮食生产绿色转型与粮食安全的协调问题,2021年《中共中央国务院关于完整准确全面贯彻新发展理念做好碳达峰碳中和工作的意见》,指出“要处理好减污降碳与粮食安全的关系,防止过度反应以确保安全降碳”;2022年《减污降碳协同增效实施方案》指出,“深入实施化肥农药减量增效行动,提升粮食生产化肥、农药利用率以落实碳减排要求”;中国共产党的“二十大”报告也指出,“协同推进降碳、减污、扩绿、增长”,夯实粮食安全根基.因此,如何科学估算粮食生产碳排放并掌握其演进规律,是中国应对气候变化、落实安全降碳要求和制定粮食安全策略的关键问题,也是中国谋求可持续发展、实现全球共同利益以及构建人类生命共同体的重要课题. ...
... 现有研究主要从宏观视角聚焦于农业整体碳排放测算和影响因素分析.其中,农业碳排放是指农业生产部门(即种植业、畜牧业和渔业)在生产过程中直接或间接导致的碳排放,测算依据和范畴大多涵盖了农地利用、物资资料投入、水稻生长发育、畜禽养殖、渔业养殖、能源利用和废弃物处理等几个方面[7 ⇓ -9 ] .碳排放的驱动力分析包括多因素和单因素两个方面,前者将农业碳排放的影响因素分解为效率、结构和劳动力[9 ] ,或是采用Lasso回归从多维度指标体系筛选关键驱动力[10 ] ;后者涵盖范围更为广泛,涉及个体技术水平[11 -12 ] 、经济增长[13 -14 ] 、农业生产结构[15 -16 ] 、城乡差异[17 ] 、非农兼业[12 ,18 ] 和人口规模等[19 ] .这些相对成熟的研究方法为分析粮食生产碳排放提供了有益借鉴.相比于农业整体碳排放,粮食生产碳排放更具针对性,专指所有粮食作物(即水稻、小麦、玉米、豆类、薯类和其他)生长、发育及其收获处理过程产生的碳排放.目前学术界对粮食生产碳排放的探究相对较少,直到“十二五”末期国家农业部下发《到2020年化肥使用零增长行动方案》才引起学术界的关注.然而,现有粮食生产碳排放研究多是从农业整体碳排放中提取与粮食生产相关的部分,从总量、作物贡献和区域贡献等视角进行探析.从测算内容来看,起初仅评估了农用化肥施用导致的碳排放[20 ] ,随后将农药、农膜、柴油等物资资料投入和秸秆燃烧纳入评估体系[21 ⇓ ⇓ -24 ] .虽然粮食生产碳排放评估所涵盖的内容不断丰富,但其作物选择仍聚焦在小麦、玉米和水稻三大粮食作物.值得注意的是,由于粮食生产物质资料投入的多样性无法精确细分到每一种作物,且秸秆燃烧的范畴不局限于三大粮食作物,仅保留以上三大粮食作物而非所有粮食作物品种的“加总”,将导致碳排放测算结果产生偏差[25 ] . ...
... Selection and descriptive statistics of variables
Tab. 1 一级指标 二级指标 符号 指标描述 单位 均值 标准差 选择依据 粮食生产碳排放 粮食生产碳排放 CC 测算方法详见上文 万t 1431.21 1136.05 经济发展水平 经济增长 EG 人均地区生产总值 元 32415.12 28383.29 [13 -14 ] 农业总产值 TAOV 以1997年为基期,采用农产品生产者价格指数对农业总产值进行折算 亿元 1095.67 1064.93 [10 ] 地区经济结构 RES 农业增加值/地区生产总值 % 7.51 4.39 [10 ] 政府财政投入 GFI 农林水事务支出/地方一般公共预算支出 % 9.54 3.59 [7 ] 人民生活水平 农村居民人均可支配收入 AID 以1997年为基期,采用农村居民消费价格指数分别对农村居民人均可支配收入和农村居民人均消费支出进行折算 元 7275.58 5880.83 [10 , 12 , 15 , 17 ] 农村居民人均消费支出 FC 元 5665.57 4609.77 [10 , 14 ] 城乡收入差距 IG 城镇居民人均可支配收入/农村居民人均纯收入 % 2.82 0.63 [14 , 17 ] 非农兼业水平 NAI 农村居民经营净收入/农村居民可支配总收入 % 51.31 18.15 非农兼业水平代表农村居民从事非农产业收入占比 技术进步水平 劳动节约型技术 LST 农业机械总动力/乡村第一产业就业人员数量 kW/人 3.26 2.11 劳动节约型技术意味着机械化的使用节约的人力资本 个体技术水平 ITL 以农村劳动力平均受教育年限来表示,不识字或识字很少、小学程度、初中程度、高中程度、大专或大专以上程度的受教育年限分别定义为1 a、6 a、9 a、12 a和16 a a 7.32 0.93 [12 ] 科技创新水平 STI IPC中A01类中的发明专利申请量和实用新型专利申请量之和,来表示粮食生产方面的绿色专利量,即科技创新水平 个 106.56 205.35 分类标准见国家知识产权局(www.cnipa.gov.cn/) 人口规模 农村总人口 TRP 农村年末总人口数 万人 2223.33 1625.99 [10 , 12 ] 人口密度 PD 农村总人口/地区总人口 % 50.61 15.85 [10 ] 农村老龄化 RA 以乡村老年抚养比表示,即农村老年人口与15~64岁人口的比例 % 13.92 5.07 城镇化率 UB 区域城镇人口/总人口 % 49.37 16.67 [14 ] 自然条件 农业生产结构 APS 粮食作物播种面积/农作物总播种面积 % 66.34 12.69 [15 ] 粮食总产量 TGO 地区粮食总产量水平 万t 1765.63 1480.10 [10 ] 自然灾害 ND 农作物受灾面积/农作物播种面积 % 23.75 16.33 [20 ]
2.2 研究方法 2.2.1 生命周期评价法 本文借鉴生命周期评价法的研究思路[23 ] ,综合所有类型粮食作物,按照投入—产出的全过程测算粮食生产碳排放量(图1 ).起初投入劳动力、资本和物质资料,随后通过翻耕、灌溉和其他技术措施开展粮食种植管理,该过程中磷肥、钾肥、复合肥和农药等物质资料以及翻耕、灌溉等均直接产生二氧化碳(CO2 ).然而,氮肥与常规物质资料投入存在差异,残留物主要产生氮氧化物(N2 O),破坏土壤环境.粮食作物开始生长发育之后,水稻在该过程中会产生甲烷(CH4 ).最后环节获得粮食产出,也面临秸秆还田处理,该过程产生CO2 、N2 O和CH4 多种污染物.因此,在已有研究[29 -30 ] 基础上并结合污染物类别将上述过程归纳为物质资料投入(包括翻耕和灌溉)、土地利用(氮肥施用)、水稻生长发育过程和秸秆燃烧4个方面.需要说明的是,水稻作为重要的粮食作物之一,近年来生长发育过程中的碳排放占中国农业碳排放的比重高于22.74%[7 ] ,因而在粮食生产碳排放测算过程中仍需考虑该部分.同时,水稻生长发育排放CH4 与品种、灌溉模式和耕作方式等密切相关,但省份内水稻灌溉模式和耕作方式差异较小,已有研究以种植面积为基础同时考虑品种和地区差异确定排放系数的做法已相对成熟[29 ,31 ] ,因而本文也沿用这种测算方法.此外,本文在测算过程中尚未考虑粮食生产碳汇,原因有二:① 粮食生产过程具有正向和负向碳汇机制,正向碳汇多源于光合作用和技术固碳等[32 ] ,而负向碳汇多源于过度耕作和建设用地扩张引发的土地性质调整等[33 -34 ] ,多种作用途径下的碳汇测算系数和方法尚属未知;② 粮食生产吸收CO2 后通过分解作用仍以碳的方式释放到自然环境中[35 ] ,该过程吸收和释放的碳汇测算仍存在较大争议.综上,粮食生产碳源所产生的碳排放测算过程如下: ...
... 本文借鉴生命周期评价法的研究思路[23 ] ,综合所有类型粮食作物,按照投入—产出的全过程测算粮食生产碳排放量(图1 ).起初投入劳动力、资本和物质资料,随后通过翻耕、灌溉和其他技术措施开展粮食种植管理,该过程中磷肥、钾肥、复合肥和农药等物质资料以及翻耕、灌溉等均直接产生二氧化碳(CO2 ).然而,氮肥与常规物质资料投入存在差异,残留物主要产生氮氧化物(N2 O),破坏土壤环境.粮食作物开始生长发育之后,水稻在该过程中会产生甲烷(CH4 ).最后环节获得粮食产出,也面临秸秆还田处理,该过程产生CO2 、N2 O和CH4 多种污染物.因此,在已有研究[29 -30 ] 基础上并结合污染物类别将上述过程归纳为物质资料投入(包括翻耕和灌溉)、土地利用(氮肥施用)、水稻生长发育过程和秸秆燃烧4个方面.需要说明的是,水稻作为重要的粮食作物之一,近年来生长发育过程中的碳排放占中国农业碳排放的比重高于22.74%[7 ] ,因而在粮食生产碳排放测算过程中仍需考虑该部分.同时,水稻生长发育排放CH4 与品种、灌溉模式和耕作方式等密切相关,但省份内水稻灌溉模式和耕作方式差异较小,已有研究以种植面积为基础同时考虑品种和地区差异确定排放系数的做法已相对成熟[29 ,31 ] ,因而本文也沿用这种测算方法.此外,本文在测算过程中尚未考虑粮食生产碳汇,原因有二:① 粮食生产过程具有正向和负向碳汇机制,正向碳汇多源于光合作用和技术固碳等[32 ] ,而负向碳汇多源于过度耕作和建设用地扩张引发的土地性质调整等[33 -34 ] ,多种作用途径下的碳汇测算系数和方法尚属未知;② 粮食生产吸收CO2 后通过分解作用仍以碳的方式释放到自然环境中[35 ] ,该过程吸收和释放的碳汇测算仍存在较大争议.综上,粮食生产碳源所产生的碳排放测算过程如下: ...
Agricultural opportunities to mitigate greenhouse gas emission
1
2007
... 现有研究主要从宏观视角聚焦于农业整体碳排放测算和影响因素分析.其中,农业碳排放是指农业生产部门(即种植业、畜牧业和渔业)在生产过程中直接或间接导致的碳排放,测算依据和范畴大多涵盖了农地利用、物资资料投入、水稻生长发育、畜禽养殖、渔业养殖、能源利用和废弃物处理等几个方面[7 ⇓ -9 ] .碳排放的驱动力分析包括多因素和单因素两个方面,前者将农业碳排放的影响因素分解为效率、结构和劳动力[9 ] ,或是采用Lasso回归从多维度指标体系筛选关键驱动力[10 ] ;后者涵盖范围更为广泛,涉及个体技术水平[11 -12 ] 、经济增长[13 -14 ] 、农业生产结构[15 -16 ] 、城乡差异[17 ] 、非农兼业[12 ,18 ] 和人口规模等[19 ] .这些相对成熟的研究方法为分析粮食生产碳排放提供了有益借鉴.相比于农业整体碳排放,粮食生产碳排放更具针对性,专指所有粮食作物(即水稻、小麦、玉米、豆类、薯类和其他)生长、发育及其收获处理过程产生的碳排放.目前学术界对粮食生产碳排放的探究相对较少,直到“十二五”末期国家农业部下发《到2020年化肥使用零增长行动方案》才引起学术界的关注.然而,现有粮食生产碳排放研究多是从农业整体碳排放中提取与粮食生产相关的部分,从总量、作物贡献和区域贡献等视角进行探析.从测算内容来看,起初仅评估了农用化肥施用导致的碳排放[20 ] ,随后将农药、农膜、柴油等物资资料投入和秸秆燃烧纳入评估体系[21 ⇓ ⇓ -24 ] .虽然粮食生产碳排放评估所涵盖的内容不断丰富,但其作物选择仍聚焦在小麦、玉米和水稻三大粮食作物.值得注意的是,由于粮食生产物质资料投入的多样性无法精确细分到每一种作物,且秸秆燃烧的范畴不局限于三大粮食作物,仅保留以上三大粮食作物而非所有粮食作物品种的“加总”,将导致碳排放测算结果产生偏差[25 ] . ...
中国农业碳排放时空特征及影响因素分解
2
2011
... 现有研究主要从宏观视角聚焦于农业整体碳排放测算和影响因素分析.其中,农业碳排放是指农业生产部门(即种植业、畜牧业和渔业)在生产过程中直接或间接导致的碳排放,测算依据和范畴大多涵盖了农地利用、物资资料投入、水稻生长发育、畜禽养殖、渔业养殖、能源利用和废弃物处理等几个方面[7 ⇓ -9 ] .碳排放的驱动力分析包括多因素和单因素两个方面,前者将农业碳排放的影响因素分解为效率、结构和劳动力[9 ] ,或是采用Lasso回归从多维度指标体系筛选关键驱动力[10 ] ;后者涵盖范围更为广泛,涉及个体技术水平[11 -12 ] 、经济增长[13 -14 ] 、农业生产结构[15 -16 ] 、城乡差异[17 ] 、非农兼业[12 ,18 ] 和人口规模等[19 ] .这些相对成熟的研究方法为分析粮食生产碳排放提供了有益借鉴.相比于农业整体碳排放,粮食生产碳排放更具针对性,专指所有粮食作物(即水稻、小麦、玉米、豆类、薯类和其他)生长、发育及其收获处理过程产生的碳排放.目前学术界对粮食生产碳排放的探究相对较少,直到“十二五”末期国家农业部下发《到2020年化肥使用零增长行动方案》才引起学术界的关注.然而,现有粮食生产碳排放研究多是从农业整体碳排放中提取与粮食生产相关的部分,从总量、作物贡献和区域贡献等视角进行探析.从测算内容来看,起初仅评估了农用化肥施用导致的碳排放[20 ] ,随后将农药、农膜、柴油等物资资料投入和秸秆燃烧纳入评估体系[21 ⇓ ⇓ -24 ] .虽然粮食生产碳排放评估所涵盖的内容不断丰富,但其作物选择仍聚焦在小麦、玉米和水稻三大粮食作物.值得注意的是,由于粮食生产物质资料投入的多样性无法精确细分到每一种作物,且秸秆燃烧的范畴不局限于三大粮食作物,仅保留以上三大粮食作物而非所有粮食作物品种的“加总”,将导致碳排放测算结果产生偏差[25 ] . ...
... [9 ],或是采用Lasso回归从多维度指标体系筛选关键驱动力[10 ] ;后者涵盖范围更为广泛,涉及个体技术水平[11 -12 ] 、经济增长[13 -14 ] 、农业生产结构[15 -16 ] 、城乡差异[17 ] 、非农兼业[12 ,18 ] 和人口规模等[19 ] .这些相对成熟的研究方法为分析粮食生产碳排放提供了有益借鉴.相比于农业整体碳排放,粮食生产碳排放更具针对性,专指所有粮食作物(即水稻、小麦、玉米、豆类、薯类和其他)生长、发育及其收获处理过程产生的碳排放.目前学术界对粮食生产碳排放的探究相对较少,直到“十二五”末期国家农业部下发《到2020年化肥使用零增长行动方案》才引起学术界的关注.然而,现有粮食生产碳排放研究多是从农业整体碳排放中提取与粮食生产相关的部分,从总量、作物贡献和区域贡献等视角进行探析.从测算内容来看,起初仅评估了农用化肥施用导致的碳排放[20 ] ,随后将农药、农膜、柴油等物资资料投入和秸秆燃烧纳入评估体系[21 ⇓ ⇓ -24 ] .虽然粮食生产碳排放评估所涵盖的内容不断丰富,但其作物选择仍聚焦在小麦、玉米和水稻三大粮食作物.值得注意的是,由于粮食生产物质资料投入的多样性无法精确细分到每一种作物,且秸秆燃烧的范畴不局限于三大粮食作物,仅保留以上三大粮食作物而非所有粮食作物品种的“加总”,将导致碳排放测算结果产生偏差[25 ] . ...
中国农村能源消费碳排放区域非均衡性及驱动因素动态识别
8
2022
... 现有研究主要从宏观视角聚焦于农业整体碳排放测算和影响因素分析.其中,农业碳排放是指农业生产部门(即种植业、畜牧业和渔业)在生产过程中直接或间接导致的碳排放,测算依据和范畴大多涵盖了农地利用、物资资料投入、水稻生长发育、畜禽养殖、渔业养殖、能源利用和废弃物处理等几个方面[7 ⇓ -9 ] .碳排放的驱动力分析包括多因素和单因素两个方面,前者将农业碳排放的影响因素分解为效率、结构和劳动力[9 ] ,或是采用Lasso回归从多维度指标体系筛选关键驱动力[10 ] ;后者涵盖范围更为广泛,涉及个体技术水平[11 -12 ] 、经济增长[13 -14 ] 、农业生产结构[15 -16 ] 、城乡差异[17 ] 、非农兼业[12 ,18 ] 和人口规模等[19 ] .这些相对成熟的研究方法为分析粮食生产碳排放提供了有益借鉴.相比于农业整体碳排放,粮食生产碳排放更具针对性,专指所有粮食作物(即水稻、小麦、玉米、豆类、薯类和其他)生长、发育及其收获处理过程产生的碳排放.目前学术界对粮食生产碳排放的探究相对较少,直到“十二五”末期国家农业部下发《到2020年化肥使用零增长行动方案》才引起学术界的关注.然而,现有粮食生产碳排放研究多是从农业整体碳排放中提取与粮食生产相关的部分,从总量、作物贡献和区域贡献等视角进行探析.从测算内容来看,起初仅评估了农用化肥施用导致的碳排放[20 ] ,随后将农药、农膜、柴油等物资资料投入和秸秆燃烧纳入评估体系[21 ⇓ ⇓ -24 ] .虽然粮食生产碳排放评估所涵盖的内容不断丰富,但其作物选择仍聚焦在小麦、玉米和水稻三大粮食作物.值得注意的是,由于粮食生产物质资料投入的多样性无法精确细分到每一种作物,且秸秆燃烧的范畴不局限于三大粮食作物,仅保留以上三大粮食作物而非所有粮食作物品种的“加总”,将导致碳排放测算结果产生偏差[25 ] . ...
... Selection and descriptive statistics of variables
Tab. 1 一级指标 二级指标 符号 指标描述 单位 均值 标准差 选择依据 粮食生产碳排放 粮食生产碳排放 CC 测算方法详见上文 万t 1431.21 1136.05 经济发展水平 经济增长 EG 人均地区生产总值 元 32415.12 28383.29 [13 -14 ] 农业总产值 TAOV 以1997年为基期,采用农产品生产者价格指数对农业总产值进行折算 亿元 1095.67 1064.93 [10 ] 地区经济结构 RES 农业增加值/地区生产总值 % 7.51 4.39 [10 ] 政府财政投入 GFI 农林水事务支出/地方一般公共预算支出 % 9.54 3.59 [7 ] 人民生活水平 农村居民人均可支配收入 AID 以1997年为基期,采用农村居民消费价格指数分别对农村居民人均可支配收入和农村居民人均消费支出进行折算 元 7275.58 5880.83 [10 , 12 , 15 , 17 ] 农村居民人均消费支出 FC 元 5665.57 4609.77 [10 , 14 ] 城乡收入差距 IG 城镇居民人均可支配收入/农村居民人均纯收入 % 2.82 0.63 [14 , 17 ] 非农兼业水平 NAI 农村居民经营净收入/农村居民可支配总收入 % 51.31 18.15 非农兼业水平代表农村居民从事非农产业收入占比 技术进步水平 劳动节约型技术 LST 农业机械总动力/乡村第一产业就业人员数量 kW/人 3.26 2.11 劳动节约型技术意味着机械化的使用节约的人力资本 个体技术水平 ITL 以农村劳动力平均受教育年限来表示,不识字或识字很少、小学程度、初中程度、高中程度、大专或大专以上程度的受教育年限分别定义为1 a、6 a、9 a、12 a和16 a a 7.32 0.93 [12 ] 科技创新水平 STI IPC中A01类中的发明专利申请量和实用新型专利申请量之和,来表示粮食生产方面的绿色专利量,即科技创新水平 个 106.56 205.35 分类标准见国家知识产权局(www.cnipa.gov.cn/) 人口规模 农村总人口 TRP 农村年末总人口数 万人 2223.33 1625.99 [10 , 12 ] 人口密度 PD 农村总人口/地区总人口 % 50.61 15.85 [10 ] 农村老龄化 RA 以乡村老年抚养比表示,即农村老年人口与15~64岁人口的比例 % 13.92 5.07 城镇化率 UB 区域城镇人口/总人口 % 49.37 16.67 [14 ] 自然条件 农业生产结构 APS 粮食作物播种面积/农作物总播种面积 % 66.34 12.69 [15 ] 粮食总产量 TGO 地区粮食总产量水平 万t 1765.63 1480.10 [10 ] 自然灾害 ND 农作物受灾面积/农作物播种面积 % 23.75 16.33 [20 ]
2.2 研究方法 2.2.1 生命周期评价法 本文借鉴生命周期评价法的研究思路[23 ] ,综合所有类型粮食作物,按照投入—产出的全过程测算粮食生产碳排放量(图1 ).起初投入劳动力、资本和物质资料,随后通过翻耕、灌溉和其他技术措施开展粮食种植管理,该过程中磷肥、钾肥、复合肥和农药等物质资料以及翻耕、灌溉等均直接产生二氧化碳(CO2 ).然而,氮肥与常规物质资料投入存在差异,残留物主要产生氮氧化物(N2 O),破坏土壤环境.粮食作物开始生长发育之后,水稻在该过程中会产生甲烷(CH4 ).最后环节获得粮食产出,也面临秸秆还田处理,该过程产生CO2 、N2 O和CH4 多种污染物.因此,在已有研究[29 -30 ] 基础上并结合污染物类别将上述过程归纳为物质资料投入(包括翻耕和灌溉)、土地利用(氮肥施用)、水稻生长发育过程和秸秆燃烧4个方面.需要说明的是,水稻作为重要的粮食作物之一,近年来生长发育过程中的碳排放占中国农业碳排放的比重高于22.74%[7 ] ,因而在粮食生产碳排放测算过程中仍需考虑该部分.同时,水稻生长发育排放CH4 与品种、灌溉模式和耕作方式等密切相关,但省份内水稻灌溉模式和耕作方式差异较小,已有研究以种植面积为基础同时考虑品种和地区差异确定排放系数的做法已相对成熟[29 ,31 ] ,因而本文也沿用这种测算方法.此外,本文在测算过程中尚未考虑粮食生产碳汇,原因有二:① 粮食生产过程具有正向和负向碳汇机制,正向碳汇多源于光合作用和技术固碳等[32 ] ,而负向碳汇多源于过度耕作和建设用地扩张引发的土地性质调整等[33 -34 ] ,多种作用途径下的碳汇测算系数和方法尚属未知;② 粮食生产吸收CO2 后通过分解作用仍以碳的方式释放到自然环境中[35 ] ,该过程吸收和释放的碳汇测算仍存在较大争议.综上,粮食生产碳源所产生的碳排放测算过程如下: ...
... [
10 ]
政府财政投入 GFI 农林水事务支出/地方一般公共预算支出 % 9.54 3.59 [7 ] 人民生活水平 农村居民人均可支配收入 AID 以1997年为基期,采用农村居民消费价格指数分别对农村居民人均可支配收入和农村居民人均消费支出进行折算 元 7275.58 5880.83 [10 , 12 , 15 , 17 ] 农村居民人均消费支出 FC 元 5665.57 4609.77 [10 , 14 ] 城乡收入差距 IG 城镇居民人均可支配收入/农村居民人均纯收入 % 2.82 0.63 [14 , 17 ] 非农兼业水平 NAI 农村居民经营净收入/农村居民可支配总收入 % 51.31 18.15 非农兼业水平代表农村居民从事非农产业收入占比 技术进步水平 劳动节约型技术 LST 农业机械总动力/乡村第一产业就业人员数量 kW/人 3.26 2.11 劳动节约型技术意味着机械化的使用节约的人力资本 个体技术水平 ITL 以农村劳动力平均受教育年限来表示,不识字或识字很少、小学程度、初中程度、高中程度、大专或大专以上程度的受教育年限分别定义为1 a、6 a、9 a、12 a和16 a a 7.32 0.93 [12 ] 科技创新水平 STI IPC中A01类中的发明专利申请量和实用新型专利申请量之和,来表示粮食生产方面的绿色专利量,即科技创新水平 个 106.56 205.35 分类标准见国家知识产权局(www.cnipa.gov.cn/) 人口规模 农村总人口 TRP 农村年末总人口数 万人 2223.33 1625.99 [10 , 12 ] 人口密度 PD 农村总人口/地区总人口 % 50.61 15.85 [10 ] 农村老龄化 RA 以乡村老年抚养比表示,即农村老年人口与15~64岁人口的比例 % 13.92 5.07 城镇化率 UB 区域城镇人口/总人口 % 49.37 16.67 [14 ] 自然条件 农业生产结构 APS 粮食作物播种面积/农作物总播种面积 % 66.34 12.69 [15 ] 粮食总产量 TGO 地区粮食总产量水平 万t 1765.63 1480.10 [10 ] 自然灾害 ND 农作物受灾面积/农作物播种面积 % 23.75 16.33 [20 ] 2.2 研究方法 2.2.1 生命周期评价法 本文借鉴生命周期评价法的研究思路[23 ] ,综合所有类型粮食作物,按照投入—产出的全过程测算粮食生产碳排放量(图1 ).起初投入劳动力、资本和物质资料,随后通过翻耕、灌溉和其他技术措施开展粮食种植管理,该过程中磷肥、钾肥、复合肥和农药等物质资料以及翻耕、灌溉等均直接产生二氧化碳(CO2 ).然而,氮肥与常规物质资料投入存在差异,残留物主要产生氮氧化物(N2 O),破坏土壤环境.粮食作物开始生长发育之后,水稻在该过程中会产生甲烷(CH4 ).最后环节获得粮食产出,也面临秸秆还田处理,该过程产生CO2 、N2 O和CH4 多种污染物.因此,在已有研究[29 -30 ] 基础上并结合污染物类别将上述过程归纳为物质资料投入(包括翻耕和灌溉)、土地利用(氮肥施用)、水稻生长发育过程和秸秆燃烧4个方面.需要说明的是,水稻作为重要的粮食作物之一,近年来生长发育过程中的碳排放占中国农业碳排放的比重高于22.74%[7 ] ,因而在粮食生产碳排放测算过程中仍需考虑该部分.同时,水稻生长发育排放CH4 与品种、灌溉模式和耕作方式等密切相关,但省份内水稻灌溉模式和耕作方式差异较小,已有研究以种植面积为基础同时考虑品种和地区差异确定排放系数的做法已相对成熟[29 ,31 ] ,因而本文也沿用这种测算方法.此外,本文在测算过程中尚未考虑粮食生产碳汇,原因有二:① 粮食生产过程具有正向和负向碳汇机制,正向碳汇多源于光合作用和技术固碳等[32 ] ,而负向碳汇多源于过度耕作和建设用地扩张引发的土地性质调整等[33 -34 ] ,多种作用途径下的碳汇测算系数和方法尚属未知;② 粮食生产吸收CO2 后通过分解作用仍以碳的方式释放到自然环境中[35 ] ,该过程吸收和释放的碳汇测算仍存在较大争议.综上,粮食生产碳源所产生的碳排放测算过程如下: ...
... [
10 ,
12 ,
15 ,
17 ]
农村居民人均消费支出 FC 元 5665.57 4609.77 [10 , 14 ] 城乡收入差距 IG 城镇居民人均可支配收入/农村居民人均纯收入 % 2.82 0.63 [14 , 17 ] 非农兼业水平 NAI 农村居民经营净收入/农村居民可支配总收入 % 51.31 18.15 非农兼业水平代表农村居民从事非农产业收入占比 技术进步水平 劳动节约型技术 LST 农业机械总动力/乡村第一产业就业人员数量 kW/人 3.26 2.11 劳动节约型技术意味着机械化的使用节约的人力资本 个体技术水平 ITL 以农村劳动力平均受教育年限来表示,不识字或识字很少、小学程度、初中程度、高中程度、大专或大专以上程度的受教育年限分别定义为1 a、6 a、9 a、12 a和16 a a 7.32 0.93 [12 ] 科技创新水平 STI IPC中A01类中的发明专利申请量和实用新型专利申请量之和,来表示粮食生产方面的绿色专利量,即科技创新水平 个 106.56 205.35 分类标准见国家知识产权局(www.cnipa.gov.cn/) 人口规模 农村总人口 TRP 农村年末总人口数 万人 2223.33 1625.99 [10 , 12 ] 人口密度 PD 农村总人口/地区总人口 % 50.61 15.85 [10 ] 农村老龄化 RA 以乡村老年抚养比表示,即农村老年人口与15~64岁人口的比例 % 13.92 5.07 城镇化率 UB 区域城镇人口/总人口 % 49.37 16.67 [14 ] 自然条件 农业生产结构 APS 粮食作物播种面积/农作物总播种面积 % 66.34 12.69 [15 ] 粮食总产量 TGO 地区粮食总产量水平 万t 1765.63 1480.10 [10 ] 自然灾害 ND 农作物受灾面积/农作物播种面积 % 23.75 16.33 [20 ] 2.2 研究方法 2.2.1 生命周期评价法 本文借鉴生命周期评价法的研究思路[23 ] ,综合所有类型粮食作物,按照投入—产出的全过程测算粮食生产碳排放量(图1 ).起初投入劳动力、资本和物质资料,随后通过翻耕、灌溉和其他技术措施开展粮食种植管理,该过程中磷肥、钾肥、复合肥和农药等物质资料以及翻耕、灌溉等均直接产生二氧化碳(CO2 ).然而,氮肥与常规物质资料投入存在差异,残留物主要产生氮氧化物(N2 O),破坏土壤环境.粮食作物开始生长发育之后,水稻在该过程中会产生甲烷(CH4 ).最后环节获得粮食产出,也面临秸秆还田处理,该过程产生CO2 、N2 O和CH4 多种污染物.因此,在已有研究[29 -30 ] 基础上并结合污染物类别将上述过程归纳为物质资料投入(包括翻耕和灌溉)、土地利用(氮肥施用)、水稻生长发育过程和秸秆燃烧4个方面.需要说明的是,水稻作为重要的粮食作物之一,近年来生长发育过程中的碳排放占中国农业碳排放的比重高于22.74%[7 ] ,因而在粮食生产碳排放测算过程中仍需考虑该部分.同时,水稻生长发育排放CH4 与品种、灌溉模式和耕作方式等密切相关,但省份内水稻灌溉模式和耕作方式差异较小,已有研究以种植面积为基础同时考虑品种和地区差异确定排放系数的做法已相对成熟[29 ,31 ] ,因而本文也沿用这种测算方法.此外,本文在测算过程中尚未考虑粮食生产碳汇,原因有二:① 粮食生产过程具有正向和负向碳汇机制,正向碳汇多源于光合作用和技术固碳等[32 ] ,而负向碳汇多源于过度耕作和建设用地扩张引发的土地性质调整等[33 -34 ] ,多种作用途径下的碳汇测算系数和方法尚属未知;② 粮食生产吸收CO2 后通过分解作用仍以碳的方式释放到自然环境中[35 ] ,该过程吸收和释放的碳汇测算仍存在较大争议.综上,粮食生产碳源所产生的碳排放测算过程如下: ...
... [
10 ,
14 ]
城乡收入差距 IG 城镇居民人均可支配收入/农村居民人均纯收入 % 2.82 0.63 [14 , 17 ] 非农兼业水平 NAI 农村居民经营净收入/农村居民可支配总收入 % 51.31 18.15 非农兼业水平代表农村居民从事非农产业收入占比 技术进步水平 劳动节约型技术 LST 农业机械总动力/乡村第一产业就业人员数量 kW/人 3.26 2.11 劳动节约型技术意味着机械化的使用节约的人力资本 个体技术水平 ITL 以农村劳动力平均受教育年限来表示,不识字或识字很少、小学程度、初中程度、高中程度、大专或大专以上程度的受教育年限分别定义为1 a、6 a、9 a、12 a和16 a a 7.32 0.93 [12 ] 科技创新水平 STI IPC中A01类中的发明专利申请量和实用新型专利申请量之和,来表示粮食生产方面的绿色专利量,即科技创新水平 个 106.56 205.35 分类标准见国家知识产权局(www.cnipa.gov.cn/) 人口规模 农村总人口 TRP 农村年末总人口数 万人 2223.33 1625.99 [10 , 12 ] 人口密度 PD 农村总人口/地区总人口 % 50.61 15.85 [10 ] 农村老龄化 RA 以乡村老年抚养比表示,即农村老年人口与15~64岁人口的比例 % 13.92 5.07 城镇化率 UB 区域城镇人口/总人口 % 49.37 16.67 [14 ] 自然条件 农业生产结构 APS 粮食作物播种面积/农作物总播种面积 % 66.34 12.69 [15 ] 粮食总产量 TGO 地区粮食总产量水平 万t 1765.63 1480.10 [10 ] 自然灾害 ND 农作物受灾面积/农作物播种面积 % 23.75 16.33 [20 ] 2.2 研究方法 2.2.1 生命周期评价法 本文借鉴生命周期评价法的研究思路[23 ] ,综合所有类型粮食作物,按照投入—产出的全过程测算粮食生产碳排放量(图1 ).起初投入劳动力、资本和物质资料,随后通过翻耕、灌溉和其他技术措施开展粮食种植管理,该过程中磷肥、钾肥、复合肥和农药等物质资料以及翻耕、灌溉等均直接产生二氧化碳(CO2 ).然而,氮肥与常规物质资料投入存在差异,残留物主要产生氮氧化物(N2 O),破坏土壤环境.粮食作物开始生长发育之后,水稻在该过程中会产生甲烷(CH4 ).最后环节获得粮食产出,也面临秸秆还田处理,该过程产生CO2 、N2 O和CH4 多种污染物.因此,在已有研究[29 -30 ] 基础上并结合污染物类别将上述过程归纳为物质资料投入(包括翻耕和灌溉)、土地利用(氮肥施用)、水稻生长发育过程和秸秆燃烧4个方面.需要说明的是,水稻作为重要的粮食作物之一,近年来生长发育过程中的碳排放占中国农业碳排放的比重高于22.74%[7 ] ,因而在粮食生产碳排放测算过程中仍需考虑该部分.同时,水稻生长发育排放CH4 与品种、灌溉模式和耕作方式等密切相关,但省份内水稻灌溉模式和耕作方式差异较小,已有研究以种植面积为基础同时考虑品种和地区差异确定排放系数的做法已相对成熟[29 ,31 ] ,因而本文也沿用这种测算方法.此外,本文在测算过程中尚未考虑粮食生产碳汇,原因有二:① 粮食生产过程具有正向和负向碳汇机制,正向碳汇多源于光合作用和技术固碳等[32 ] ,而负向碳汇多源于过度耕作和建设用地扩张引发的土地性质调整等[33 -34 ] ,多种作用途径下的碳汇测算系数和方法尚属未知;② 粮食生产吸收CO2 后通过分解作用仍以碳的方式释放到自然环境中[35 ] ,该过程吸收和释放的碳汇测算仍存在较大争议.综上,粮食生产碳源所产生的碳排放测算过程如下: ...
... [
10 ,
12 ]
人口密度 PD 农村总人口/地区总人口 % 50.61 15.85 [10 ] 农村老龄化 RA 以乡村老年抚养比表示,即农村老年人口与15~64岁人口的比例 % 13.92 5.07 城镇化率 UB 区域城镇人口/总人口 % 49.37 16.67 [14 ] 自然条件 农业生产结构 APS 粮食作物播种面积/农作物总播种面积 % 66.34 12.69 [15 ] 粮食总产量 TGO 地区粮食总产量水平 万t 1765.63 1480.10 [10 ] 自然灾害 ND 农作物受灾面积/农作物播种面积 % 23.75 16.33 [20 ] 2.2 研究方法 2.2.1 生命周期评价法 本文借鉴生命周期评价法的研究思路[23 ] ,综合所有类型粮食作物,按照投入—产出的全过程测算粮食生产碳排放量(图1 ).起初投入劳动力、资本和物质资料,随后通过翻耕、灌溉和其他技术措施开展粮食种植管理,该过程中磷肥、钾肥、复合肥和农药等物质资料以及翻耕、灌溉等均直接产生二氧化碳(CO2 ).然而,氮肥与常规物质资料投入存在差异,残留物主要产生氮氧化物(N2 O),破坏土壤环境.粮食作物开始生长发育之后,水稻在该过程中会产生甲烷(CH4 ).最后环节获得粮食产出,也面临秸秆还田处理,该过程产生CO2 、N2 O和CH4 多种污染物.因此,在已有研究[29 -30 ] 基础上并结合污染物类别将上述过程归纳为物质资料投入(包括翻耕和灌溉)、土地利用(氮肥施用)、水稻生长发育过程和秸秆燃烧4个方面.需要说明的是,水稻作为重要的粮食作物之一,近年来生长发育过程中的碳排放占中国农业碳排放的比重高于22.74%[7 ] ,因而在粮食生产碳排放测算过程中仍需考虑该部分.同时,水稻生长发育排放CH4 与品种、灌溉模式和耕作方式等密切相关,但省份内水稻灌溉模式和耕作方式差异较小,已有研究以种植面积为基础同时考虑品种和地区差异确定排放系数的做法已相对成熟[29 ,31 ] ,因而本文也沿用这种测算方法.此外,本文在测算过程中尚未考虑粮食生产碳汇,原因有二:① 粮食生产过程具有正向和负向碳汇机制,正向碳汇多源于光合作用和技术固碳等[32 ] ,而负向碳汇多源于过度耕作和建设用地扩张引发的土地性质调整等[33 -34 ] ,多种作用途径下的碳汇测算系数和方法尚属未知;② 粮食生产吸收CO2 后通过分解作用仍以碳的方式释放到自然环境中[35 ] ,该过程吸收和释放的碳汇测算仍存在较大争议.综上,粮食生产碳源所产生的碳排放测算过程如下: ...
... [
10 ]
农村老龄化 RA 以乡村老年抚养比表示,即农村老年人口与15~64岁人口的比例 % 13.92 5.07 城镇化率 UB 区域城镇人口/总人口 % 49.37 16.67 [14 ] 自然条件 农业生产结构 APS 粮食作物播种面积/农作物总播种面积 % 66.34 12.69 [15 ] 粮食总产量 TGO 地区粮食总产量水平 万t 1765.63 1480.10 [10 ] 自然灾害 ND 农作物受灾面积/农作物播种面积 % 23.75 16.33 [20 ] 2.2 研究方法 2.2.1 生命周期评价法 本文借鉴生命周期评价法的研究思路[23 ] ,综合所有类型粮食作物,按照投入—产出的全过程测算粮食生产碳排放量(图1 ).起初投入劳动力、资本和物质资料,随后通过翻耕、灌溉和其他技术措施开展粮食种植管理,该过程中磷肥、钾肥、复合肥和农药等物质资料以及翻耕、灌溉等均直接产生二氧化碳(CO2 ).然而,氮肥与常规物质资料投入存在差异,残留物主要产生氮氧化物(N2 O),破坏土壤环境.粮食作物开始生长发育之后,水稻在该过程中会产生甲烷(CH4 ).最后环节获得粮食产出,也面临秸秆还田处理,该过程产生CO2 、N2 O和CH4 多种污染物.因此,在已有研究[29 -30 ] 基础上并结合污染物类别将上述过程归纳为物质资料投入(包括翻耕和灌溉)、土地利用(氮肥施用)、水稻生长发育过程和秸秆燃烧4个方面.需要说明的是,水稻作为重要的粮食作物之一,近年来生长发育过程中的碳排放占中国农业碳排放的比重高于22.74%[7 ] ,因而在粮食生产碳排放测算过程中仍需考虑该部分.同时,水稻生长发育排放CH4 与品种、灌溉模式和耕作方式等密切相关,但省份内水稻灌溉模式和耕作方式差异较小,已有研究以种植面积为基础同时考虑品种和地区差异确定排放系数的做法已相对成熟[29 ,31 ] ,因而本文也沿用这种测算方法.此外,本文在测算过程中尚未考虑粮食生产碳汇,原因有二:① 粮食生产过程具有正向和负向碳汇机制,正向碳汇多源于光合作用和技术固碳等[32 ] ,而负向碳汇多源于过度耕作和建设用地扩张引发的土地性质调整等[33 -34 ] ,多种作用途径下的碳汇测算系数和方法尚属未知;② 粮食生产吸收CO2 后通过分解作用仍以碳的方式释放到自然环境中[35 ] ,该过程吸收和释放的碳汇测算仍存在较大争议.综上,粮食生产碳源所产生的碳排放测算过程如下: ...
... [
10 ]
自然灾害 ND 农作物受灾面积/农作物播种面积 % 23.75 16.33 [20 ] 2.2 研究方法 2.2.1 生命周期评价法 本文借鉴生命周期评价法的研究思路[23 ] ,综合所有类型粮食作物,按照投入—产出的全过程测算粮食生产碳排放量(图1 ).起初投入劳动力、资本和物质资料,随后通过翻耕、灌溉和其他技术措施开展粮食种植管理,该过程中磷肥、钾肥、复合肥和农药等物质资料以及翻耕、灌溉等均直接产生二氧化碳(CO2 ).然而,氮肥与常规物质资料投入存在差异,残留物主要产生氮氧化物(N2 O),破坏土壤环境.粮食作物开始生长发育之后,水稻在该过程中会产生甲烷(CH4 ).最后环节获得粮食产出,也面临秸秆还田处理,该过程产生CO2 、N2 O和CH4 多种污染物.因此,在已有研究[29 -30 ] 基础上并结合污染物类别将上述过程归纳为物质资料投入(包括翻耕和灌溉)、土地利用(氮肥施用)、水稻生长发育过程和秸秆燃烧4个方面.需要说明的是,水稻作为重要的粮食作物之一,近年来生长发育过程中的碳排放占中国农业碳排放的比重高于22.74%[7 ] ,因而在粮食生产碳排放测算过程中仍需考虑该部分.同时,水稻生长发育排放CH4 与品种、灌溉模式和耕作方式等密切相关,但省份内水稻灌溉模式和耕作方式差异较小,已有研究以种植面积为基础同时考虑品种和地区差异确定排放系数的做法已相对成熟[29 ,31 ] ,因而本文也沿用这种测算方法.此外,本文在测算过程中尚未考虑粮食生产碳汇,原因有二:① 粮食生产过程具有正向和负向碳汇机制,正向碳汇多源于光合作用和技术固碳等[32 ] ,而负向碳汇多源于过度耕作和建设用地扩张引发的土地性质调整等[33 -34 ] ,多种作用途径下的碳汇测算系数和方法尚属未知;② 粮食生产吸收CO2 后通过分解作用仍以碳的方式释放到自然环境中[35 ] ,该过程吸收和释放的碳汇测算仍存在较大争议.综上,粮食生产碳源所产生的碳排放测算过程如下: ...
农户生态保护态度:新发现与政策启示
1
2014
... 现有研究主要从宏观视角聚焦于农业整体碳排放测算和影响因素分析.其中,农业碳排放是指农业生产部门(即种植业、畜牧业和渔业)在生产过程中直接或间接导致的碳排放,测算依据和范畴大多涵盖了农地利用、物资资料投入、水稻生长发育、畜禽养殖、渔业养殖、能源利用和废弃物处理等几个方面[7 ⇓ -9 ] .碳排放的驱动力分析包括多因素和单因素两个方面,前者将农业碳排放的影响因素分解为效率、结构和劳动力[9 ] ,或是采用Lasso回归从多维度指标体系筛选关键驱动力[10 ] ;后者涵盖范围更为广泛,涉及个体技术水平[11 -12 ] 、经济增长[13 -14 ] 、农业生产结构[15 -16 ] 、城乡差异[17 ] 、非农兼业[12 ,18 ] 和人口规模等[19 ] .这些相对成熟的研究方法为分析粮食生产碳排放提供了有益借鉴.相比于农业整体碳排放,粮食生产碳排放更具针对性,专指所有粮食作物(即水稻、小麦、玉米、豆类、薯类和其他)生长、发育及其收获处理过程产生的碳排放.目前学术界对粮食生产碳排放的探究相对较少,直到“十二五”末期国家农业部下发《到2020年化肥使用零增长行动方案》才引起学术界的关注.然而,现有粮食生产碳排放研究多是从农业整体碳排放中提取与粮食生产相关的部分,从总量、作物贡献和区域贡献等视角进行探析.从测算内容来看,起初仅评估了农用化肥施用导致的碳排放[20 ] ,随后将农药、农膜、柴油等物资资料投入和秸秆燃烧纳入评估体系[21 ⇓ ⇓ -24 ] .虽然粮食生产碳排放评估所涵盖的内容不断丰富,但其作物选择仍聚焦在小麦、玉米和水稻三大粮食作物.值得注意的是,由于粮食生产物质资料投入的多样性无法精确细分到每一种作物,且秸秆燃烧的范畴不局限于三大粮食作物,仅保留以上三大粮食作物而非所有粮食作物品种的“加总”,将导致碳排放测算结果产生偏差[25 ] . ...
How does labor transfer affect environmental pollution in rural China? Evidence from a survey
5
2021
... 现有研究主要从宏观视角聚焦于农业整体碳排放测算和影响因素分析.其中,农业碳排放是指农业生产部门(即种植业、畜牧业和渔业)在生产过程中直接或间接导致的碳排放,测算依据和范畴大多涵盖了农地利用、物资资料投入、水稻生长发育、畜禽养殖、渔业养殖、能源利用和废弃物处理等几个方面[7 ⇓ -9 ] .碳排放的驱动力分析包括多因素和单因素两个方面,前者将农业碳排放的影响因素分解为效率、结构和劳动力[9 ] ,或是采用Lasso回归从多维度指标体系筛选关键驱动力[10 ] ;后者涵盖范围更为广泛,涉及个体技术水平[11 -12 ] 、经济增长[13 -14 ] 、农业生产结构[15 -16 ] 、城乡差异[17 ] 、非农兼业[12 ,18 ] 和人口规模等[19 ] .这些相对成熟的研究方法为分析粮食生产碳排放提供了有益借鉴.相比于农业整体碳排放,粮食生产碳排放更具针对性,专指所有粮食作物(即水稻、小麦、玉米、豆类、薯类和其他)生长、发育及其收获处理过程产生的碳排放.目前学术界对粮食生产碳排放的探究相对较少,直到“十二五”末期国家农业部下发《到2020年化肥使用零增长行动方案》才引起学术界的关注.然而,现有粮食生产碳排放研究多是从农业整体碳排放中提取与粮食生产相关的部分,从总量、作物贡献和区域贡献等视角进行探析.从测算内容来看,起初仅评估了农用化肥施用导致的碳排放[20 ] ,随后将农药、农膜、柴油等物资资料投入和秸秆燃烧纳入评估体系[21 ⇓ ⇓ -24 ] .虽然粮食生产碳排放评估所涵盖的内容不断丰富,但其作物选择仍聚焦在小麦、玉米和水稻三大粮食作物.值得注意的是,由于粮食生产物质资料投入的多样性无法精确细分到每一种作物,且秸秆燃烧的范畴不局限于三大粮食作物,仅保留以上三大粮食作物而非所有粮食作物品种的“加总”,将导致碳排放测算结果产生偏差[25 ] . ...
... [12 ,18 ]和人口规模等[19 ] .这些相对成熟的研究方法为分析粮食生产碳排放提供了有益借鉴.相比于农业整体碳排放,粮食生产碳排放更具针对性,专指所有粮食作物(即水稻、小麦、玉米、豆类、薯类和其他)生长、发育及其收获处理过程产生的碳排放.目前学术界对粮食生产碳排放的探究相对较少,直到“十二五”末期国家农业部下发《到2020年化肥使用零增长行动方案》才引起学术界的关注.然而,现有粮食生产碳排放研究多是从农业整体碳排放中提取与粮食生产相关的部分,从总量、作物贡献和区域贡献等视角进行探析.从测算内容来看,起初仅评估了农用化肥施用导致的碳排放[20 ] ,随后将农药、农膜、柴油等物资资料投入和秸秆燃烧纳入评估体系[21 ⇓ ⇓ -24 ] .虽然粮食生产碳排放评估所涵盖的内容不断丰富,但其作物选择仍聚焦在小麦、玉米和水稻三大粮食作物.值得注意的是,由于粮食生产物质资料投入的多样性无法精确细分到每一种作物,且秸秆燃烧的范畴不局限于三大粮食作物,仅保留以上三大粮食作物而非所有粮食作物品种的“加总”,将导致碳排放测算结果产生偏差[25 ] . ...
... Selection and descriptive statistics of variables
Tab. 1 一级指标 二级指标 符号 指标描述 单位 均值 标准差 选择依据 粮食生产碳排放 粮食生产碳排放 CC 测算方法详见上文 万t 1431.21 1136.05 经济发展水平 经济增长 EG 人均地区生产总值 元 32415.12 28383.29 [13 -14 ] 农业总产值 TAOV 以1997年为基期,采用农产品生产者价格指数对农业总产值进行折算 亿元 1095.67 1064.93 [10 ] 地区经济结构 RES 农业增加值/地区生产总值 % 7.51 4.39 [10 ] 政府财政投入 GFI 农林水事务支出/地方一般公共预算支出 % 9.54 3.59 [7 ] 人民生活水平 农村居民人均可支配收入 AID 以1997年为基期,采用农村居民消费价格指数分别对农村居民人均可支配收入和农村居民人均消费支出进行折算 元 7275.58 5880.83 [10 , 12 , 15 , 17 ] 农村居民人均消费支出 FC 元 5665.57 4609.77 [10 , 14 ] 城乡收入差距 IG 城镇居民人均可支配收入/农村居民人均纯收入 % 2.82 0.63 [14 , 17 ] 非农兼业水平 NAI 农村居民经营净收入/农村居民可支配总收入 % 51.31 18.15 非农兼业水平代表农村居民从事非农产业收入占比 技术进步水平 劳动节约型技术 LST 农业机械总动力/乡村第一产业就业人员数量 kW/人 3.26 2.11 劳动节约型技术意味着机械化的使用节约的人力资本 个体技术水平 ITL 以农村劳动力平均受教育年限来表示,不识字或识字很少、小学程度、初中程度、高中程度、大专或大专以上程度的受教育年限分别定义为1 a、6 a、9 a、12 a和16 a a 7.32 0.93 [12 ] 科技创新水平 STI IPC中A01类中的发明专利申请量和实用新型专利申请量之和,来表示粮食生产方面的绿色专利量,即科技创新水平 个 106.56 205.35 分类标准见国家知识产权局(www.cnipa.gov.cn/) 人口规模 农村总人口 TRP 农村年末总人口数 万人 2223.33 1625.99 [10 , 12 ] 人口密度 PD 农村总人口/地区总人口 % 50.61 15.85 [10 ] 农村老龄化 RA 以乡村老年抚养比表示,即农村老年人口与15~64岁人口的比例 % 13.92 5.07 城镇化率 UB 区域城镇人口/总人口 % 49.37 16.67 [14 ] 自然条件 农业生产结构 APS 粮食作物播种面积/农作物总播种面积 % 66.34 12.69 [15 ] 粮食总产量 TGO 地区粮食总产量水平 万t 1765.63 1480.10 [10 ] 自然灾害 ND 农作物受灾面积/农作物播种面积 % 23.75 16.33 [20 ]
2.2 研究方法 2.2.1 生命周期评价法 本文借鉴生命周期评价法的研究思路[23 ] ,综合所有类型粮食作物,按照投入—产出的全过程测算粮食生产碳排放量(图1 ).起初投入劳动力、资本和物质资料,随后通过翻耕、灌溉和其他技术措施开展粮食种植管理,该过程中磷肥、钾肥、复合肥和农药等物质资料以及翻耕、灌溉等均直接产生二氧化碳(CO2 ).然而,氮肥与常规物质资料投入存在差异,残留物主要产生氮氧化物(N2 O),破坏土壤环境.粮食作物开始生长发育之后,水稻在该过程中会产生甲烷(CH4 ).最后环节获得粮食产出,也面临秸秆还田处理,该过程产生CO2 、N2 O和CH4 多种污染物.因此,在已有研究[29 -30 ] 基础上并结合污染物类别将上述过程归纳为物质资料投入(包括翻耕和灌溉)、土地利用(氮肥施用)、水稻生长发育过程和秸秆燃烧4个方面.需要说明的是,水稻作为重要的粮食作物之一,近年来生长发育过程中的碳排放占中国农业碳排放的比重高于22.74%[7 ] ,因而在粮食生产碳排放测算过程中仍需考虑该部分.同时,水稻生长发育排放CH4 与品种、灌溉模式和耕作方式等密切相关,但省份内水稻灌溉模式和耕作方式差异较小,已有研究以种植面积为基础同时考虑品种和地区差异确定排放系数的做法已相对成熟[29 ,31 ] ,因而本文也沿用这种测算方法.此外,本文在测算过程中尚未考虑粮食生产碳汇,原因有二:① 粮食生产过程具有正向和负向碳汇机制,正向碳汇多源于光合作用和技术固碳等[32 ] ,而负向碳汇多源于过度耕作和建设用地扩张引发的土地性质调整等[33 -34 ] ,多种作用途径下的碳汇测算系数和方法尚属未知;② 粮食生产吸收CO2 后通过分解作用仍以碳的方式释放到自然环境中[35 ] ,该过程吸收和释放的碳汇测算仍存在较大争议.综上,粮食生产碳源所产生的碳排放测算过程如下: ...
... [
12 ]
科技创新水平 STI IPC中A01类中的发明专利申请量和实用新型专利申请量之和,来表示粮食生产方面的绿色专利量,即科技创新水平 个 106.56 205.35 分类标准见国家知识产权局(www.cnipa.gov.cn/) 人口规模 农村总人口 TRP 农村年末总人口数 万人 2223.33 1625.99 [10 , 12 ] 人口密度 PD 农村总人口/地区总人口 % 50.61 15.85 [10 ] 农村老龄化 RA 以乡村老年抚养比表示,即农村老年人口与15~64岁人口的比例 % 13.92 5.07 城镇化率 UB 区域城镇人口/总人口 % 49.37 16.67 [14 ] 自然条件 农业生产结构 APS 粮食作物播种面积/农作物总播种面积 % 66.34 12.69 [15 ] 粮食总产量 TGO 地区粮食总产量水平 万t 1765.63 1480.10 [10 ] 自然灾害 ND 农作物受灾面积/农作物播种面积 % 23.75 16.33 [20 ] 2.2 研究方法 2.2.1 生命周期评价法 本文借鉴生命周期评价法的研究思路[23 ] ,综合所有类型粮食作物,按照投入—产出的全过程测算粮食生产碳排放量(图1 ).起初投入劳动力、资本和物质资料,随后通过翻耕、灌溉和其他技术措施开展粮食种植管理,该过程中磷肥、钾肥、复合肥和农药等物质资料以及翻耕、灌溉等均直接产生二氧化碳(CO2 ).然而,氮肥与常规物质资料投入存在差异,残留物主要产生氮氧化物(N2 O),破坏土壤环境.粮食作物开始生长发育之后,水稻在该过程中会产生甲烷(CH4 ).最后环节获得粮食产出,也面临秸秆还田处理,该过程产生CO2 、N2 O和CH4 多种污染物.因此,在已有研究[29 -30 ] 基础上并结合污染物类别将上述过程归纳为物质资料投入(包括翻耕和灌溉)、土地利用(氮肥施用)、水稻生长发育过程和秸秆燃烧4个方面.需要说明的是,水稻作为重要的粮食作物之一,近年来生长发育过程中的碳排放占中国农业碳排放的比重高于22.74%[7 ] ,因而在粮食生产碳排放测算过程中仍需考虑该部分.同时,水稻生长发育排放CH4 与品种、灌溉模式和耕作方式等密切相关,但省份内水稻灌溉模式和耕作方式差异较小,已有研究以种植面积为基础同时考虑品种和地区差异确定排放系数的做法已相对成熟[29 ,31 ] ,因而本文也沿用这种测算方法.此外,本文在测算过程中尚未考虑粮食生产碳汇,原因有二:① 粮食生产过程具有正向和负向碳汇机制,正向碳汇多源于光合作用和技术固碳等[32 ] ,而负向碳汇多源于过度耕作和建设用地扩张引发的土地性质调整等[33 -34 ] ,多种作用途径下的碳汇测算系数和方法尚属未知;② 粮食生产吸收CO2 后通过分解作用仍以碳的方式释放到自然环境中[35 ] ,该过程吸收和释放的碳汇测算仍存在较大争议.综上,粮食生产碳源所产生的碳排放测算过程如下: ...
... ,
12 ]
人口密度 PD 农村总人口/地区总人口 % 50.61 15.85 [10 ] 农村老龄化 RA 以乡村老年抚养比表示,即农村老年人口与15~64岁人口的比例 % 13.92 5.07 城镇化率 UB 区域城镇人口/总人口 % 49.37 16.67 [14 ] 自然条件 农业生产结构 APS 粮食作物播种面积/农作物总播种面积 % 66.34 12.69 [15 ] 粮食总产量 TGO 地区粮食总产量水平 万t 1765.63 1480.10 [10 ] 自然灾害 ND 农作物受灾面积/农作物播种面积 % 23.75 16.33 [20 ] 2.2 研究方法 2.2.1 生命周期评价法 本文借鉴生命周期评价法的研究思路[23 ] ,综合所有类型粮食作物,按照投入—产出的全过程测算粮食生产碳排放量(图1 ).起初投入劳动力、资本和物质资料,随后通过翻耕、灌溉和其他技术措施开展粮食种植管理,该过程中磷肥、钾肥、复合肥和农药等物质资料以及翻耕、灌溉等均直接产生二氧化碳(CO2 ).然而,氮肥与常规物质资料投入存在差异,残留物主要产生氮氧化物(N2 O),破坏土壤环境.粮食作物开始生长发育之后,水稻在该过程中会产生甲烷(CH4 ).最后环节获得粮食产出,也面临秸秆还田处理,该过程产生CO2 、N2 O和CH4 多种污染物.因此,在已有研究[29 -30 ] 基础上并结合污染物类别将上述过程归纳为物质资料投入(包括翻耕和灌溉)、土地利用(氮肥施用)、水稻生长发育过程和秸秆燃烧4个方面.需要说明的是,水稻作为重要的粮食作物之一,近年来生长发育过程中的碳排放占中国农业碳排放的比重高于22.74%[7 ] ,因而在粮食生产碳排放测算过程中仍需考虑该部分.同时,水稻生长发育排放CH4 与品种、灌溉模式和耕作方式等密切相关,但省份内水稻灌溉模式和耕作方式差异较小,已有研究以种植面积为基础同时考虑品种和地区差异确定排放系数的做法已相对成熟[29 ,31 ] ,因而本文也沿用这种测算方法.此外,本文在测算过程中尚未考虑粮食生产碳汇,原因有二:① 粮食生产过程具有正向和负向碳汇机制,正向碳汇多源于光合作用和技术固碳等[32 ] ,而负向碳汇多源于过度耕作和建设用地扩张引发的土地性质调整等[33 -34 ] ,多种作用途径下的碳汇测算系数和方法尚属未知;② 粮食生产吸收CO2 后通过分解作用仍以碳的方式释放到自然环境中[35 ] ,该过程吸收和释放的碳汇测算仍存在较大争议.综上,粮食生产碳源所产生的碳排放测算过程如下: ...
Carbon emissions, energy consumption and economic growth: Evidence from the agricultural sector of China's main grain-producing areas
2
2019
... 现有研究主要从宏观视角聚焦于农业整体碳排放测算和影响因素分析.其中,农业碳排放是指农业生产部门(即种植业、畜牧业和渔业)在生产过程中直接或间接导致的碳排放,测算依据和范畴大多涵盖了农地利用、物资资料投入、水稻生长发育、畜禽养殖、渔业养殖、能源利用和废弃物处理等几个方面[7 ⇓ -9 ] .碳排放的驱动力分析包括多因素和单因素两个方面,前者将农业碳排放的影响因素分解为效率、结构和劳动力[9 ] ,或是采用Lasso回归从多维度指标体系筛选关键驱动力[10 ] ;后者涵盖范围更为广泛,涉及个体技术水平[11 -12 ] 、经济增长[13 -14 ] 、农业生产结构[15 -16 ] 、城乡差异[17 ] 、非农兼业[12 ,18 ] 和人口规模等[19 ] .这些相对成熟的研究方法为分析粮食生产碳排放提供了有益借鉴.相比于农业整体碳排放,粮食生产碳排放更具针对性,专指所有粮食作物(即水稻、小麦、玉米、豆类、薯类和其他)生长、发育及其收获处理过程产生的碳排放.目前学术界对粮食生产碳排放的探究相对较少,直到“十二五”末期国家农业部下发《到2020年化肥使用零增长行动方案》才引起学术界的关注.然而,现有粮食生产碳排放研究多是从农业整体碳排放中提取与粮食生产相关的部分,从总量、作物贡献和区域贡献等视角进行探析.从测算内容来看,起初仅评估了农用化肥施用导致的碳排放[20 ] ,随后将农药、农膜、柴油等物资资料投入和秸秆燃烧纳入评估体系[21 ⇓ ⇓ -24 ] .虽然粮食生产碳排放评估所涵盖的内容不断丰富,但其作物选择仍聚焦在小麦、玉米和水稻三大粮食作物.值得注意的是,由于粮食生产物质资料投入的多样性无法精确细分到每一种作物,且秸秆燃烧的范畴不局限于三大粮食作物,仅保留以上三大粮食作物而非所有粮食作物品种的“加总”,将导致碳排放测算结果产生偏差[25 ] . ...
... Selection and descriptive statistics of variables
Tab. 1 一级指标 二级指标 符号 指标描述 单位 均值 标准差 选择依据 粮食生产碳排放 粮食生产碳排放 CC 测算方法详见上文 万t 1431.21 1136.05 经济发展水平 经济增长 EG 人均地区生产总值 元 32415.12 28383.29 [13 -14 ] 农业总产值 TAOV 以1997年为基期,采用农产品生产者价格指数对农业总产值进行折算 亿元 1095.67 1064.93 [10 ] 地区经济结构 RES 农业增加值/地区生产总值 % 7.51 4.39 [10 ] 政府财政投入 GFI 农林水事务支出/地方一般公共预算支出 % 9.54 3.59 [7 ] 人民生活水平 农村居民人均可支配收入 AID 以1997年为基期,采用农村居民消费价格指数分别对农村居民人均可支配收入和农村居民人均消费支出进行折算 元 7275.58 5880.83 [10 , 12 , 15 , 17 ] 农村居民人均消费支出 FC 元 5665.57 4609.77 [10 , 14 ] 城乡收入差距 IG 城镇居民人均可支配收入/农村居民人均纯收入 % 2.82 0.63 [14 , 17 ] 非农兼业水平 NAI 农村居民经营净收入/农村居民可支配总收入 % 51.31 18.15 非农兼业水平代表农村居民从事非农产业收入占比 技术进步水平 劳动节约型技术 LST 农业机械总动力/乡村第一产业就业人员数量 kW/人 3.26 2.11 劳动节约型技术意味着机械化的使用节约的人力资本 个体技术水平 ITL 以农村劳动力平均受教育年限来表示,不识字或识字很少、小学程度、初中程度、高中程度、大专或大专以上程度的受教育年限分别定义为1 a、6 a、9 a、12 a和16 a a 7.32 0.93 [12 ] 科技创新水平 STI IPC中A01类中的发明专利申请量和实用新型专利申请量之和,来表示粮食生产方面的绿色专利量,即科技创新水平 个 106.56 205.35 分类标准见国家知识产权局(www.cnipa.gov.cn/) 人口规模 农村总人口 TRP 农村年末总人口数 万人 2223.33 1625.99 [10 , 12 ] 人口密度 PD 农村总人口/地区总人口 % 50.61 15.85 [10 ] 农村老龄化 RA 以乡村老年抚养比表示,即农村老年人口与15~64岁人口的比例 % 13.92 5.07 城镇化率 UB 区域城镇人口/总人口 % 49.37 16.67 [14 ] 自然条件 农业生产结构 APS 粮食作物播种面积/农作物总播种面积 % 66.34 12.69 [15 ] 粮食总产量 TGO 地区粮食总产量水平 万t 1765.63 1480.10 [10 ] 自然灾害 ND 农作物受灾面积/农作物播种面积 % 23.75 16.33 [20 ]
2.2 研究方法 2.2.1 生命周期评价法 本文借鉴生命周期评价法的研究思路[23 ] ,综合所有类型粮食作物,按照投入—产出的全过程测算粮食生产碳排放量(图1 ).起初投入劳动力、资本和物质资料,随后通过翻耕、灌溉和其他技术措施开展粮食种植管理,该过程中磷肥、钾肥、复合肥和农药等物质资料以及翻耕、灌溉等均直接产生二氧化碳(CO2 ).然而,氮肥与常规物质资料投入存在差异,残留物主要产生氮氧化物(N2 O),破坏土壤环境.粮食作物开始生长发育之后,水稻在该过程中会产生甲烷(CH4 ).最后环节获得粮食产出,也面临秸秆还田处理,该过程产生CO2 、N2 O和CH4 多种污染物.因此,在已有研究[29 -30 ] 基础上并结合污染物类别将上述过程归纳为物质资料投入(包括翻耕和灌溉)、土地利用(氮肥施用)、水稻生长发育过程和秸秆燃烧4个方面.需要说明的是,水稻作为重要的粮食作物之一,近年来生长发育过程中的碳排放占中国农业碳排放的比重高于22.74%[7 ] ,因而在粮食生产碳排放测算过程中仍需考虑该部分.同时,水稻生长发育排放CH4 与品种、灌溉模式和耕作方式等密切相关,但省份内水稻灌溉模式和耕作方式差异较小,已有研究以种植面积为基础同时考虑品种和地区差异确定排放系数的做法已相对成熟[29 ,31 ] ,因而本文也沿用这种测算方法.此外,本文在测算过程中尚未考虑粮食生产碳汇,原因有二:① 粮食生产过程具有正向和负向碳汇机制,正向碳汇多源于光合作用和技术固碳等[32 ] ,而负向碳汇多源于过度耕作和建设用地扩张引发的土地性质调整等[33 -34 ] ,多种作用途径下的碳汇测算系数和方法尚属未知;② 粮食生产吸收CO2 后通过分解作用仍以碳的方式释放到自然环境中[35 ] ,该过程吸收和释放的碳汇测算仍存在较大争议.综上,粮食生产碳源所产生的碳排放测算过程如下: ...
农村人口城镇化对居民生活能源消费碳排放的影响分析
5
2021
... 现有研究主要从宏观视角聚焦于农业整体碳排放测算和影响因素分析.其中,农业碳排放是指农业生产部门(即种植业、畜牧业和渔业)在生产过程中直接或间接导致的碳排放,测算依据和范畴大多涵盖了农地利用、物资资料投入、水稻生长发育、畜禽养殖、渔业养殖、能源利用和废弃物处理等几个方面[7 ⇓ -9 ] .碳排放的驱动力分析包括多因素和单因素两个方面,前者将农业碳排放的影响因素分解为效率、结构和劳动力[9 ] ,或是采用Lasso回归从多维度指标体系筛选关键驱动力[10 ] ;后者涵盖范围更为广泛,涉及个体技术水平[11 -12 ] 、经济增长[13 -14 ] 、农业生产结构[15 -16 ] 、城乡差异[17 ] 、非农兼业[12 ,18 ] 和人口规模等[19 ] .这些相对成熟的研究方法为分析粮食生产碳排放提供了有益借鉴.相比于农业整体碳排放,粮食生产碳排放更具针对性,专指所有粮食作物(即水稻、小麦、玉米、豆类、薯类和其他)生长、发育及其收获处理过程产生的碳排放.目前学术界对粮食生产碳排放的探究相对较少,直到“十二五”末期国家农业部下发《到2020年化肥使用零增长行动方案》才引起学术界的关注.然而,现有粮食生产碳排放研究多是从农业整体碳排放中提取与粮食生产相关的部分,从总量、作物贡献和区域贡献等视角进行探析.从测算内容来看,起初仅评估了农用化肥施用导致的碳排放[20 ] ,随后将农药、农膜、柴油等物资资料投入和秸秆燃烧纳入评估体系[21 ⇓ ⇓ -24 ] .虽然粮食生产碳排放评估所涵盖的内容不断丰富,但其作物选择仍聚焦在小麦、玉米和水稻三大粮食作物.值得注意的是,由于粮食生产物质资料投入的多样性无法精确细分到每一种作物,且秸秆燃烧的范畴不局限于三大粮食作物,仅保留以上三大粮食作物而非所有粮食作物品种的“加总”,将导致碳排放测算结果产生偏差[25 ] . ...
... Selection and descriptive statistics of variables
Tab. 1 一级指标 二级指标 符号 指标描述 单位 均值 标准差 选择依据 粮食生产碳排放 粮食生产碳排放 CC 测算方法详见上文 万t 1431.21 1136.05 经济发展水平 经济增长 EG 人均地区生产总值 元 32415.12 28383.29 [13 -14 ] 农业总产值 TAOV 以1997年为基期,采用农产品生产者价格指数对农业总产值进行折算 亿元 1095.67 1064.93 [10 ] 地区经济结构 RES 农业增加值/地区生产总值 % 7.51 4.39 [10 ] 政府财政投入 GFI 农林水事务支出/地方一般公共预算支出 % 9.54 3.59 [7 ] 人民生活水平 农村居民人均可支配收入 AID 以1997年为基期,采用农村居民消费价格指数分别对农村居民人均可支配收入和农村居民人均消费支出进行折算 元 7275.58 5880.83 [10 , 12 , 15 , 17 ] 农村居民人均消费支出 FC 元 5665.57 4609.77 [10 , 14 ] 城乡收入差距 IG 城镇居民人均可支配收入/农村居民人均纯收入 % 2.82 0.63 [14 , 17 ] 非农兼业水平 NAI 农村居民经营净收入/农村居民可支配总收入 % 51.31 18.15 非农兼业水平代表农村居民从事非农产业收入占比 技术进步水平 劳动节约型技术 LST 农业机械总动力/乡村第一产业就业人员数量 kW/人 3.26 2.11 劳动节约型技术意味着机械化的使用节约的人力资本 个体技术水平 ITL 以农村劳动力平均受教育年限来表示,不识字或识字很少、小学程度、初中程度、高中程度、大专或大专以上程度的受教育年限分别定义为1 a、6 a、9 a、12 a和16 a a 7.32 0.93 [12 ] 科技创新水平 STI IPC中A01类中的发明专利申请量和实用新型专利申请量之和,来表示粮食生产方面的绿色专利量,即科技创新水平 个 106.56 205.35 分类标准见国家知识产权局(www.cnipa.gov.cn/) 人口规模 农村总人口 TRP 农村年末总人口数 万人 2223.33 1625.99 [10 , 12 ] 人口密度 PD 农村总人口/地区总人口 % 50.61 15.85 [10 ] 农村老龄化 RA 以乡村老年抚养比表示,即农村老年人口与15~64岁人口的比例 % 13.92 5.07 城镇化率 UB 区域城镇人口/总人口 % 49.37 16.67 [14 ] 自然条件 农业生产结构 APS 粮食作物播种面积/农作物总播种面积 % 66.34 12.69 [15 ] 粮食总产量 TGO 地区粮食总产量水平 万t 1765.63 1480.10 [10 ] 自然灾害 ND 农作物受灾面积/农作物播种面积 % 23.75 16.33 [20 ]
2.2 研究方法 2.2.1 生命周期评价法 本文借鉴生命周期评价法的研究思路[23 ] ,综合所有类型粮食作物,按照投入—产出的全过程测算粮食生产碳排放量(图1 ).起初投入劳动力、资本和物质资料,随后通过翻耕、灌溉和其他技术措施开展粮食种植管理,该过程中磷肥、钾肥、复合肥和农药等物质资料以及翻耕、灌溉等均直接产生二氧化碳(CO2 ).然而,氮肥与常规物质资料投入存在差异,残留物主要产生氮氧化物(N2 O),破坏土壤环境.粮食作物开始生长发育之后,水稻在该过程中会产生甲烷(CH4 ).最后环节获得粮食产出,也面临秸秆还田处理,该过程产生CO2 、N2 O和CH4 多种污染物.因此,在已有研究[29 -30 ] 基础上并结合污染物类别将上述过程归纳为物质资料投入(包括翻耕和灌溉)、土地利用(氮肥施用)、水稻生长发育过程和秸秆燃烧4个方面.需要说明的是,水稻作为重要的粮食作物之一,近年来生长发育过程中的碳排放占中国农业碳排放的比重高于22.74%[7 ] ,因而在粮食生产碳排放测算过程中仍需考虑该部分.同时,水稻生长发育排放CH4 与品种、灌溉模式和耕作方式等密切相关,但省份内水稻灌溉模式和耕作方式差异较小,已有研究以种植面积为基础同时考虑品种和地区差异确定排放系数的做法已相对成熟[29 ,31 ] ,因而本文也沿用这种测算方法.此外,本文在测算过程中尚未考虑粮食生产碳汇,原因有二:① 粮食生产过程具有正向和负向碳汇机制,正向碳汇多源于光合作用和技术固碳等[32 ] ,而负向碳汇多源于过度耕作和建设用地扩张引发的土地性质调整等[33 -34 ] ,多种作用途径下的碳汇测算系数和方法尚属未知;② 粮食生产吸收CO2 后通过分解作用仍以碳的方式释放到自然环境中[35 ] ,该过程吸收和释放的碳汇测算仍存在较大争议.综上,粮食生产碳源所产生的碳排放测算过程如下: ...
... ,
14 ]
城乡收入差距 IG 城镇居民人均可支配收入/农村居民人均纯收入 % 2.82 0.63 [14 , 17 ] 非农兼业水平 NAI 农村居民经营净收入/农村居民可支配总收入 % 51.31 18.15 非农兼业水平代表农村居民从事非农产业收入占比 技术进步水平 劳动节约型技术 LST 农业机械总动力/乡村第一产业就业人员数量 kW/人 3.26 2.11 劳动节约型技术意味着机械化的使用节约的人力资本 个体技术水平 ITL 以农村劳动力平均受教育年限来表示,不识字或识字很少、小学程度、初中程度、高中程度、大专或大专以上程度的受教育年限分别定义为1 a、6 a、9 a、12 a和16 a a 7.32 0.93 [12 ] 科技创新水平 STI IPC中A01类中的发明专利申请量和实用新型专利申请量之和,来表示粮食生产方面的绿色专利量,即科技创新水平 个 106.56 205.35 分类标准见国家知识产权局(www.cnipa.gov.cn/) 人口规模 农村总人口 TRP 农村年末总人口数 万人 2223.33 1625.99 [10 , 12 ] 人口密度 PD 农村总人口/地区总人口 % 50.61 15.85 [10 ] 农村老龄化 RA 以乡村老年抚养比表示,即农村老年人口与15~64岁人口的比例 % 13.92 5.07 城镇化率 UB 区域城镇人口/总人口 % 49.37 16.67 [14 ] 自然条件 农业生产结构 APS 粮食作物播种面积/农作物总播种面积 % 66.34 12.69 [15 ] 粮食总产量 TGO 地区粮食总产量水平 万t 1765.63 1480.10 [10 ] 自然灾害 ND 农作物受灾面积/农作物播种面积 % 23.75 16.33 [20 ] 2.2 研究方法 2.2.1 生命周期评价法 本文借鉴生命周期评价法的研究思路[23 ] ,综合所有类型粮食作物,按照投入—产出的全过程测算粮食生产碳排放量(图1 ).起初投入劳动力、资本和物质资料,随后通过翻耕、灌溉和其他技术措施开展粮食种植管理,该过程中磷肥、钾肥、复合肥和农药等物质资料以及翻耕、灌溉等均直接产生二氧化碳(CO2 ).然而,氮肥与常规物质资料投入存在差异,残留物主要产生氮氧化物(N2 O),破坏土壤环境.粮食作物开始生长发育之后,水稻在该过程中会产生甲烷(CH4 ).最后环节获得粮食产出,也面临秸秆还田处理,该过程产生CO2 、N2 O和CH4 多种污染物.因此,在已有研究[29 -30 ] 基础上并结合污染物类别将上述过程归纳为物质资料投入(包括翻耕和灌溉)、土地利用(氮肥施用)、水稻生长发育过程和秸秆燃烧4个方面.需要说明的是,水稻作为重要的粮食作物之一,近年来生长发育过程中的碳排放占中国农业碳排放的比重高于22.74%[7 ] ,因而在粮食生产碳排放测算过程中仍需考虑该部分.同时,水稻生长发育排放CH4 与品种、灌溉模式和耕作方式等密切相关,但省份内水稻灌溉模式和耕作方式差异较小,已有研究以种植面积为基础同时考虑品种和地区差异确定排放系数的做法已相对成熟[29 ,31 ] ,因而本文也沿用这种测算方法.此外,本文在测算过程中尚未考虑粮食生产碳汇,原因有二:① 粮食生产过程具有正向和负向碳汇机制,正向碳汇多源于光合作用和技术固碳等[32 ] ,而负向碳汇多源于过度耕作和建设用地扩张引发的土地性质调整等[33 -34 ] ,多种作用途径下的碳汇测算系数和方法尚属未知;② 粮食生产吸收CO2 后通过分解作用仍以碳的方式释放到自然环境中[35 ] ,该过程吸收和释放的碳汇测算仍存在较大争议.综上,粮食生产碳源所产生的碳排放测算过程如下: ...
... [
14 ,
17 ]
非农兼业水平 NAI 农村居民经营净收入/农村居民可支配总收入 % 51.31 18.15 非农兼业水平代表农村居民从事非农产业收入占比 技术进步水平 劳动节约型技术 LST 农业机械总动力/乡村第一产业就业人员数量 kW/人 3.26 2.11 劳动节约型技术意味着机械化的使用节约的人力资本 个体技术水平 ITL 以农村劳动力平均受教育年限来表示,不识字或识字很少、小学程度、初中程度、高中程度、大专或大专以上程度的受教育年限分别定义为1 a、6 a、9 a、12 a和16 a a 7.32 0.93 [12 ] 科技创新水平 STI IPC中A01类中的发明专利申请量和实用新型专利申请量之和,来表示粮食生产方面的绿色专利量,即科技创新水平 个 106.56 205.35 分类标准见国家知识产权局(www.cnipa.gov.cn/) 人口规模 农村总人口 TRP 农村年末总人口数 万人 2223.33 1625.99 [10 , 12 ] 人口密度 PD 农村总人口/地区总人口 % 50.61 15.85 [10 ] 农村老龄化 RA 以乡村老年抚养比表示,即农村老年人口与15~64岁人口的比例 % 13.92 5.07 城镇化率 UB 区域城镇人口/总人口 % 49.37 16.67 [14 ] 自然条件 农业生产结构 APS 粮食作物播种面积/农作物总播种面积 % 66.34 12.69 [15 ] 粮食总产量 TGO 地区粮食总产量水平 万t 1765.63 1480.10 [10 ] 自然灾害 ND 农作物受灾面积/农作物播种面积 % 23.75 16.33 [20 ] 2.2 研究方法 2.2.1 生命周期评价法 本文借鉴生命周期评价法的研究思路[23 ] ,综合所有类型粮食作物,按照投入—产出的全过程测算粮食生产碳排放量(图1 ).起初投入劳动力、资本和物质资料,随后通过翻耕、灌溉和其他技术措施开展粮食种植管理,该过程中磷肥、钾肥、复合肥和农药等物质资料以及翻耕、灌溉等均直接产生二氧化碳(CO2 ).然而,氮肥与常规物质资料投入存在差异,残留物主要产生氮氧化物(N2 O),破坏土壤环境.粮食作物开始生长发育之后,水稻在该过程中会产生甲烷(CH4 ).最后环节获得粮食产出,也面临秸秆还田处理,该过程产生CO2 、N2 O和CH4 多种污染物.因此,在已有研究[29 -30 ] 基础上并结合污染物类别将上述过程归纳为物质资料投入(包括翻耕和灌溉)、土地利用(氮肥施用)、水稻生长发育过程和秸秆燃烧4个方面.需要说明的是,水稻作为重要的粮食作物之一,近年来生长发育过程中的碳排放占中国农业碳排放的比重高于22.74%[7 ] ,因而在粮食生产碳排放测算过程中仍需考虑该部分.同时,水稻生长发育排放CH4 与品种、灌溉模式和耕作方式等密切相关,但省份内水稻灌溉模式和耕作方式差异较小,已有研究以种植面积为基础同时考虑品种和地区差异确定排放系数的做法已相对成熟[29 ,31 ] ,因而本文也沿用这种测算方法.此外,本文在测算过程中尚未考虑粮食生产碳汇,原因有二:① 粮食生产过程具有正向和负向碳汇机制,正向碳汇多源于光合作用和技术固碳等[32 ] ,而负向碳汇多源于过度耕作和建设用地扩张引发的土地性质调整等[33 -34 ] ,多种作用途径下的碳汇测算系数和方法尚属未知;② 粮食生产吸收CO2 后通过分解作用仍以碳的方式释放到自然环境中[35 ] ,该过程吸收和释放的碳汇测算仍存在较大争议.综上,粮食生产碳源所产生的碳排放测算过程如下: ...
... [
14 ]
自然条件 农业生产结构 APS 粮食作物播种面积/农作物总播种面积 % 66.34 12.69 [15 ] 粮食总产量 TGO 地区粮食总产量水平 万t 1765.63 1480.10 [10 ] 自然灾害 ND 农作物受灾面积/农作物播种面积 % 23.75 16.33 [20 ] 2.2 研究方法 2.2.1 生命周期评价法 本文借鉴生命周期评价法的研究思路[23 ] ,综合所有类型粮食作物,按照投入—产出的全过程测算粮食生产碳排放量(图1 ).起初投入劳动力、资本和物质资料,随后通过翻耕、灌溉和其他技术措施开展粮食种植管理,该过程中磷肥、钾肥、复合肥和农药等物质资料以及翻耕、灌溉等均直接产生二氧化碳(CO2 ).然而,氮肥与常规物质资料投入存在差异,残留物主要产生氮氧化物(N2 O),破坏土壤环境.粮食作物开始生长发育之后,水稻在该过程中会产生甲烷(CH4 ).最后环节获得粮食产出,也面临秸秆还田处理,该过程产生CO2 、N2 O和CH4 多种污染物.因此,在已有研究[29 -30 ] 基础上并结合污染物类别将上述过程归纳为物质资料投入(包括翻耕和灌溉)、土地利用(氮肥施用)、水稻生长发育过程和秸秆燃烧4个方面.需要说明的是,水稻作为重要的粮食作物之一,近年来生长发育过程中的碳排放占中国农业碳排放的比重高于22.74%[7 ] ,因而在粮食生产碳排放测算过程中仍需考虑该部分.同时,水稻生长发育排放CH4 与品种、灌溉模式和耕作方式等密切相关,但省份内水稻灌溉模式和耕作方式差异较小,已有研究以种植面积为基础同时考虑品种和地区差异确定排放系数的做法已相对成熟[29 ,31 ] ,因而本文也沿用这种测算方法.此外,本文在测算过程中尚未考虑粮食生产碳汇,原因有二:① 粮食生产过程具有正向和负向碳汇机制,正向碳汇多源于光合作用和技术固碳等[32 ] ,而负向碳汇多源于过度耕作和建设用地扩张引发的土地性质调整等[33 -34 ] ,多种作用途径下的碳汇测算系数和方法尚属未知;② 粮食生产吸收CO2 后通过分解作用仍以碳的方式释放到自然环境中[35 ] ,该过程吸收和释放的碳汇测算仍存在较大争议.综上,粮食生产碳源所产生的碳排放测算过程如下: ...
农业机械化的环境效应: 来自农机购置补贴政策的证据
4
2021
... 现有研究主要从宏观视角聚焦于农业整体碳排放测算和影响因素分析.其中,农业碳排放是指农业生产部门(即种植业、畜牧业和渔业)在生产过程中直接或间接导致的碳排放,测算依据和范畴大多涵盖了农地利用、物资资料投入、水稻生长发育、畜禽养殖、渔业养殖、能源利用和废弃物处理等几个方面[7 ⇓ -9 ] .碳排放的驱动力分析包括多因素和单因素两个方面,前者将农业碳排放的影响因素分解为效率、结构和劳动力[9 ] ,或是采用Lasso回归从多维度指标体系筛选关键驱动力[10 ] ;后者涵盖范围更为广泛,涉及个体技术水平[11 -12 ] 、经济增长[13 -14 ] 、农业生产结构[15 -16 ] 、城乡差异[17 ] 、非农兼业[12 ,18 ] 和人口规模等[19 ] .这些相对成熟的研究方法为分析粮食生产碳排放提供了有益借鉴.相比于农业整体碳排放,粮食生产碳排放更具针对性,专指所有粮食作物(即水稻、小麦、玉米、豆类、薯类和其他)生长、发育及其收获处理过程产生的碳排放.目前学术界对粮食生产碳排放的探究相对较少,直到“十二五”末期国家农业部下发《到2020年化肥使用零增长行动方案》才引起学术界的关注.然而,现有粮食生产碳排放研究多是从农业整体碳排放中提取与粮食生产相关的部分,从总量、作物贡献和区域贡献等视角进行探析.从测算内容来看,起初仅评估了农用化肥施用导致的碳排放[20 ] ,随后将农药、农膜、柴油等物资资料投入和秸秆燃烧纳入评估体系[21 ⇓ ⇓ -24 ] .虽然粮食生产碳排放评估所涵盖的内容不断丰富,但其作物选择仍聚焦在小麦、玉米和水稻三大粮食作物.值得注意的是,由于粮食生产物质资料投入的多样性无法精确细分到每一种作物,且秸秆燃烧的范畴不局限于三大粮食作物,仅保留以上三大粮食作物而非所有粮食作物品种的“加总”,将导致碳排放测算结果产生偏差[25 ] . ...
... Selection and descriptive statistics of variables
Tab. 1 一级指标 二级指标 符号 指标描述 单位 均值 标准差 选择依据 粮食生产碳排放 粮食生产碳排放 CC 测算方法详见上文 万t 1431.21 1136.05 经济发展水平 经济增长 EG 人均地区生产总值 元 32415.12 28383.29 [13 -14 ] 农业总产值 TAOV 以1997年为基期,采用农产品生产者价格指数对农业总产值进行折算 亿元 1095.67 1064.93 [10 ] 地区经济结构 RES 农业增加值/地区生产总值 % 7.51 4.39 [10 ] 政府财政投入 GFI 农林水事务支出/地方一般公共预算支出 % 9.54 3.59 [7 ] 人民生活水平 农村居民人均可支配收入 AID 以1997年为基期,采用农村居民消费价格指数分别对农村居民人均可支配收入和农村居民人均消费支出进行折算 元 7275.58 5880.83 [10 , 12 , 15 , 17 ] 农村居民人均消费支出 FC 元 5665.57 4609.77 [10 , 14 ] 城乡收入差距 IG 城镇居民人均可支配收入/农村居民人均纯收入 % 2.82 0.63 [14 , 17 ] 非农兼业水平 NAI 农村居民经营净收入/农村居民可支配总收入 % 51.31 18.15 非农兼业水平代表农村居民从事非农产业收入占比 技术进步水平 劳动节约型技术 LST 农业机械总动力/乡村第一产业就业人员数量 kW/人 3.26 2.11 劳动节约型技术意味着机械化的使用节约的人力资本 个体技术水平 ITL 以农村劳动力平均受教育年限来表示,不识字或识字很少、小学程度、初中程度、高中程度、大专或大专以上程度的受教育年限分别定义为1 a、6 a、9 a、12 a和16 a a 7.32 0.93 [12 ] 科技创新水平 STI IPC中A01类中的发明专利申请量和实用新型专利申请量之和,来表示粮食生产方面的绿色专利量,即科技创新水平 个 106.56 205.35 分类标准见国家知识产权局(www.cnipa.gov.cn/) 人口规模 农村总人口 TRP 农村年末总人口数 万人 2223.33 1625.99 [10 , 12 ] 人口密度 PD 农村总人口/地区总人口 % 50.61 15.85 [10 ] 农村老龄化 RA 以乡村老年抚养比表示,即农村老年人口与15~64岁人口的比例 % 13.92 5.07 城镇化率 UB 区域城镇人口/总人口 % 49.37 16.67 [14 ] 自然条件 农业生产结构 APS 粮食作物播种面积/农作物总播种面积 % 66.34 12.69 [15 ] 粮食总产量 TGO 地区粮食总产量水平 万t 1765.63 1480.10 [10 ] 自然灾害 ND 农作物受灾面积/农作物播种面积 % 23.75 16.33 [20 ]
2.2 研究方法 2.2.1 生命周期评价法 本文借鉴生命周期评价法的研究思路[23 ] ,综合所有类型粮食作物,按照投入—产出的全过程测算粮食生产碳排放量(图1 ).起初投入劳动力、资本和物质资料,随后通过翻耕、灌溉和其他技术措施开展粮食种植管理,该过程中磷肥、钾肥、复合肥和农药等物质资料以及翻耕、灌溉等均直接产生二氧化碳(CO2 ).然而,氮肥与常规物质资料投入存在差异,残留物主要产生氮氧化物(N2 O),破坏土壤环境.粮食作物开始生长发育之后,水稻在该过程中会产生甲烷(CH4 ).最后环节获得粮食产出,也面临秸秆还田处理,该过程产生CO2 、N2 O和CH4 多种污染物.因此,在已有研究[29 -30 ] 基础上并结合污染物类别将上述过程归纳为物质资料投入(包括翻耕和灌溉)、土地利用(氮肥施用)、水稻生长发育过程和秸秆燃烧4个方面.需要说明的是,水稻作为重要的粮食作物之一,近年来生长发育过程中的碳排放占中国农业碳排放的比重高于22.74%[7 ] ,因而在粮食生产碳排放测算过程中仍需考虑该部分.同时,水稻生长发育排放CH4 与品种、灌溉模式和耕作方式等密切相关,但省份内水稻灌溉模式和耕作方式差异较小,已有研究以种植面积为基础同时考虑品种和地区差异确定排放系数的做法已相对成熟[29 ,31 ] ,因而本文也沿用这种测算方法.此外,本文在测算过程中尚未考虑粮食生产碳汇,原因有二:① 粮食生产过程具有正向和负向碳汇机制,正向碳汇多源于光合作用和技术固碳等[32 ] ,而负向碳汇多源于过度耕作和建设用地扩张引发的土地性质调整等[33 -34 ] ,多种作用途径下的碳汇测算系数和方法尚属未知;② 粮食生产吸收CO2 后通过分解作用仍以碳的方式释放到自然环境中[35 ] ,该过程吸收和释放的碳汇测算仍存在较大争议.综上,粮食生产碳源所产生的碳排放测算过程如下: ...
... [
15 ]
粮食总产量 TGO 地区粮食总产量水平 万t 1765.63 1480.10 [10 ] 自然灾害 ND 农作物受灾面积/农作物播种面积 % 23.75 16.33 [20 ] 2.2 研究方法 2.2.1 生命周期评价法 本文借鉴生命周期评价法的研究思路[23 ] ,综合所有类型粮食作物,按照投入—产出的全过程测算粮食生产碳排放量(图1 ).起初投入劳动力、资本和物质资料,随后通过翻耕、灌溉和其他技术措施开展粮食种植管理,该过程中磷肥、钾肥、复合肥和农药等物质资料以及翻耕、灌溉等均直接产生二氧化碳(CO2 ).然而,氮肥与常规物质资料投入存在差异,残留物主要产生氮氧化物(N2 O),破坏土壤环境.粮食作物开始生长发育之后,水稻在该过程中会产生甲烷(CH4 ).最后环节获得粮食产出,也面临秸秆还田处理,该过程产生CO2 、N2 O和CH4 多种污染物.因此,在已有研究[29 -30 ] 基础上并结合污染物类别将上述过程归纳为物质资料投入(包括翻耕和灌溉)、土地利用(氮肥施用)、水稻生长发育过程和秸秆燃烧4个方面.需要说明的是,水稻作为重要的粮食作物之一,近年来生长发育过程中的碳排放占中国农业碳排放的比重高于22.74%[7 ] ,因而在粮食生产碳排放测算过程中仍需考虑该部分.同时,水稻生长发育排放CH4 与品种、灌溉模式和耕作方式等密切相关,但省份内水稻灌溉模式和耕作方式差异较小,已有研究以种植面积为基础同时考虑品种和地区差异确定排放系数的做法已相对成熟[29 ,31 ] ,因而本文也沿用这种测算方法.此外,本文在测算过程中尚未考虑粮食生产碳汇,原因有二:① 粮食生产过程具有正向和负向碳汇机制,正向碳汇多源于光合作用和技术固碳等[32 ] ,而负向碳汇多源于过度耕作和建设用地扩张引发的土地性质调整等[33 -34 ] ,多种作用途径下的碳汇测算系数和方法尚属未知;② 粮食生产吸收CO2 后通过分解作用仍以碳的方式释放到自然环境中[35 ] ,该过程吸收和释放的碳汇测算仍存在较大争议.综上,粮食生产碳源所产生的碳排放测算过程如下: ...
... 对SDM模型进行Hausman检验、Wald检验和似然比(LR)检验发现,时间空间双向固定效应模型最优④ (④地区固定效应和时间固定效应检验均通过了1%的显著性检验(χ 2 = 50.72, P < 0.001; χ 2 = 1497.60, P < 0.001),表明时间空间双向固定效应模型最优;Hausman检验通过了1%的显著性检验(χ 2 = 142.42, P = 0.001),表明应选择固定效应模型而非随机效应模型;Wald(SDM、SAR)和Wald(SDM、SEM)检验均通过了1%的显著性检验(χ 2 = 65.38, P < 0.001; χ 2 = 75.63, P < 0.001),说明拒绝SDM模型退化为空间自回归模型(SAR)和空间误差模型(SEM)的原假设,即选择SDM模型最优.LR(SDM、SAR)和LR(SDM、SEM)检验均通过了1%的显著性检验(χ 2 = 63.72, P < 0.001; χ 2 = 74.46, P < 0.001),说明空间杜宾模型优于SAR和SEM模型.此外,本文还进行了全局空间自相关检验,各年份碳排放的莫兰指数均通过了10%的显著性检验,且均值为0.149,说明中国粮食生产碳排放具有空间相关性.其中,空间权重矩阵选择邻接权重矩阵.).由表3 可知,农业总产值、地区经济结构、劳动节约型技术、农业生产结构和粮食总产量的直接效应和间接效应均显著.其中,农业总产值和粮食总产量的直接效应均为正值而间接效应均为负值,说明两者表现为促增本地—促减邻地粮食生产碳排放,其余3个因素作用方向与之相反.究其原因,耕地资源禀赋优越的地区粮食生产过程投入较多物质资料,促进粮食产量和产值大幅度增长,这种耕地资源的自然属性决定了本地促增效应;同时,耕地资源的空间固定性决定了粮食产能承接的空间关联性和转移效应,尤其是资源禀赋偏差的主销区,粮食生产规模降低并带动碳排放量减少.劳动集约型技术本质上是粮食生产的机械化程度,机械化总量资源的有限性决定了其流动性,即机械化资源不足的地区能够吸引跨区域机械动力的流入,增强了空间关联地区劳动节约型技术水平的提升,呈现明显的正向空间溢出效应[15 ] .地区经济结构表现为农业产值比重对碳排放的影响,农业产值较高的地区主要得益于现代化的粮食生产方式,有利于减少物质资料的过度投入而实现本地粮食绿色生产,本地粮食集约化生产效应增强,对相邻地区尤其是粮食主产区内部挤出效应加强,推广和应用高效粮食生产方式的能力衰减,呈现出显著的正向空间溢出效应.农业生产结构则衡量粮食种植和畜牧业、水产品饲养等其他农业生产活动之间的比较关系,粮食生产的碳排放较其他农业生产活动相对较低,尤其是粮食种植适度规模经营更加有助于促进农业生产系统化学投入品减少[16 ] ,从而实现碳减排. ...
Agricultural eco-compensation may not necessarily reduce chemical inputs
2
2020
... 现有研究主要从宏观视角聚焦于农业整体碳排放测算和影响因素分析.其中,农业碳排放是指农业生产部门(即种植业、畜牧业和渔业)在生产过程中直接或间接导致的碳排放,测算依据和范畴大多涵盖了农地利用、物资资料投入、水稻生长发育、畜禽养殖、渔业养殖、能源利用和废弃物处理等几个方面[7 ⇓ -9 ] .碳排放的驱动力分析包括多因素和单因素两个方面,前者将农业碳排放的影响因素分解为效率、结构和劳动力[9 ] ,或是采用Lasso回归从多维度指标体系筛选关键驱动力[10 ] ;后者涵盖范围更为广泛,涉及个体技术水平[11 -12 ] 、经济增长[13 -14 ] 、农业生产结构[15 -16 ] 、城乡差异[17 ] 、非农兼业[12 ,18 ] 和人口规模等[19 ] .这些相对成熟的研究方法为分析粮食生产碳排放提供了有益借鉴.相比于农业整体碳排放,粮食生产碳排放更具针对性,专指所有粮食作物(即水稻、小麦、玉米、豆类、薯类和其他)生长、发育及其收获处理过程产生的碳排放.目前学术界对粮食生产碳排放的探究相对较少,直到“十二五”末期国家农业部下发《到2020年化肥使用零增长行动方案》才引起学术界的关注.然而,现有粮食生产碳排放研究多是从农业整体碳排放中提取与粮食生产相关的部分,从总量、作物贡献和区域贡献等视角进行探析.从测算内容来看,起初仅评估了农用化肥施用导致的碳排放[20 ] ,随后将农药、农膜、柴油等物资资料投入和秸秆燃烧纳入评估体系[21 ⇓ ⇓ -24 ] .虽然粮食生产碳排放评估所涵盖的内容不断丰富,但其作物选择仍聚焦在小麦、玉米和水稻三大粮食作物.值得注意的是,由于粮食生产物质资料投入的多样性无法精确细分到每一种作物,且秸秆燃烧的范畴不局限于三大粮食作物,仅保留以上三大粮食作物而非所有粮食作物品种的“加总”,将导致碳排放测算结果产生偏差[25 ] . ...
... 对SDM模型进行Hausman检验、Wald检验和似然比(LR)检验发现,时间空间双向固定效应模型最优④ (④地区固定效应和时间固定效应检验均通过了1%的显著性检验(χ 2 = 50.72, P < 0.001; χ 2 = 1497.60, P < 0.001),表明时间空间双向固定效应模型最优;Hausman检验通过了1%的显著性检验(χ 2 = 142.42, P = 0.001),表明应选择固定效应模型而非随机效应模型;Wald(SDM、SAR)和Wald(SDM、SEM)检验均通过了1%的显著性检验(χ 2 = 65.38, P < 0.001; χ 2 = 75.63, P < 0.001),说明拒绝SDM模型退化为空间自回归模型(SAR)和空间误差模型(SEM)的原假设,即选择SDM模型最优.LR(SDM、SAR)和LR(SDM、SEM)检验均通过了1%的显著性检验(χ 2 = 63.72, P < 0.001; χ 2 = 74.46, P < 0.001),说明空间杜宾模型优于SAR和SEM模型.此外,本文还进行了全局空间自相关检验,各年份碳排放的莫兰指数均通过了10%的显著性检验,且均值为0.149,说明中国粮食生产碳排放具有空间相关性.其中,空间权重矩阵选择邻接权重矩阵.).由表3 可知,农业总产值、地区经济结构、劳动节约型技术、农业生产结构和粮食总产量的直接效应和间接效应均显著.其中,农业总产值和粮食总产量的直接效应均为正值而间接效应均为负值,说明两者表现为促增本地—促减邻地粮食生产碳排放,其余3个因素作用方向与之相反.究其原因,耕地资源禀赋优越的地区粮食生产过程投入较多物质资料,促进粮食产量和产值大幅度增长,这种耕地资源的自然属性决定了本地促增效应;同时,耕地资源的空间固定性决定了粮食产能承接的空间关联性和转移效应,尤其是资源禀赋偏差的主销区,粮食生产规模降低并带动碳排放量减少.劳动集约型技术本质上是粮食生产的机械化程度,机械化总量资源的有限性决定了其流动性,即机械化资源不足的地区能够吸引跨区域机械动力的流入,增强了空间关联地区劳动节约型技术水平的提升,呈现明显的正向空间溢出效应[15 ] .地区经济结构表现为农业产值比重对碳排放的影响,农业产值较高的地区主要得益于现代化的粮食生产方式,有利于减少物质资料的过度投入而实现本地粮食绿色生产,本地粮食集约化生产效应增强,对相邻地区尤其是粮食主产区内部挤出效应加强,推广和应用高效粮食生产方式的能力衰减,呈现出显著的正向空间溢出效应.农业生产结构则衡量粮食种植和畜牧业、水产品饲养等其他农业生产活动之间的比较关系,粮食生产的碳排放较其他农业生产活动相对较低,尤其是粮食种植适度规模经营更加有助于促进农业生产系统化学投入品减少[16 ] ,从而实现碳减排. ...
城乡收入差距是否提高了农业化学品投入? 以农药施用为例
4
2019
... 现有研究主要从宏观视角聚焦于农业整体碳排放测算和影响因素分析.其中,农业碳排放是指农业生产部门(即种植业、畜牧业和渔业)在生产过程中直接或间接导致的碳排放,测算依据和范畴大多涵盖了农地利用、物资资料投入、水稻生长发育、畜禽养殖、渔业养殖、能源利用和废弃物处理等几个方面[7 ⇓ -9 ] .碳排放的驱动力分析包括多因素和单因素两个方面,前者将农业碳排放的影响因素分解为效率、结构和劳动力[9 ] ,或是采用Lasso回归从多维度指标体系筛选关键驱动力[10 ] ;后者涵盖范围更为广泛,涉及个体技术水平[11 -12 ] 、经济增长[13 -14 ] 、农业生产结构[15 -16 ] 、城乡差异[17 ] 、非农兼业[12 ,18 ] 和人口规模等[19 ] .这些相对成熟的研究方法为分析粮食生产碳排放提供了有益借鉴.相比于农业整体碳排放,粮食生产碳排放更具针对性,专指所有粮食作物(即水稻、小麦、玉米、豆类、薯类和其他)生长、发育及其收获处理过程产生的碳排放.目前学术界对粮食生产碳排放的探究相对较少,直到“十二五”末期国家农业部下发《到2020年化肥使用零增长行动方案》才引起学术界的关注.然而,现有粮食生产碳排放研究多是从农业整体碳排放中提取与粮食生产相关的部分,从总量、作物贡献和区域贡献等视角进行探析.从测算内容来看,起初仅评估了农用化肥施用导致的碳排放[20 ] ,随后将农药、农膜、柴油等物资资料投入和秸秆燃烧纳入评估体系[21 ⇓ ⇓ -24 ] .虽然粮食生产碳排放评估所涵盖的内容不断丰富,但其作物选择仍聚焦在小麦、玉米和水稻三大粮食作物.值得注意的是,由于粮食生产物质资料投入的多样性无法精确细分到每一种作物,且秸秆燃烧的范畴不局限于三大粮食作物,仅保留以上三大粮食作物而非所有粮食作物品种的“加总”,将导致碳排放测算结果产生偏差[25 ] . ...
... Selection and descriptive statistics of variables
Tab. 1 一级指标 二级指标 符号 指标描述 单位 均值 标准差 选择依据 粮食生产碳排放 粮食生产碳排放 CC 测算方法详见上文 万t 1431.21 1136.05 经济发展水平 经济增长 EG 人均地区生产总值 元 32415.12 28383.29 [13 -14 ] 农业总产值 TAOV 以1997年为基期,采用农产品生产者价格指数对农业总产值进行折算 亿元 1095.67 1064.93 [10 ] 地区经济结构 RES 农业增加值/地区生产总值 % 7.51 4.39 [10 ] 政府财政投入 GFI 农林水事务支出/地方一般公共预算支出 % 9.54 3.59 [7 ] 人民生活水平 农村居民人均可支配收入 AID 以1997年为基期,采用农村居民消费价格指数分别对农村居民人均可支配收入和农村居民人均消费支出进行折算 元 7275.58 5880.83 [10 , 12 , 15 , 17 ] 农村居民人均消费支出 FC 元 5665.57 4609.77 [10 , 14 ] 城乡收入差距 IG 城镇居民人均可支配收入/农村居民人均纯收入 % 2.82 0.63 [14 , 17 ] 非农兼业水平 NAI 农村居民经营净收入/农村居民可支配总收入 % 51.31 18.15 非农兼业水平代表农村居民从事非农产业收入占比 技术进步水平 劳动节约型技术 LST 农业机械总动力/乡村第一产业就业人员数量 kW/人 3.26 2.11 劳动节约型技术意味着机械化的使用节约的人力资本 个体技术水平 ITL 以农村劳动力平均受教育年限来表示,不识字或识字很少、小学程度、初中程度、高中程度、大专或大专以上程度的受教育年限分别定义为1 a、6 a、9 a、12 a和16 a a 7.32 0.93 [12 ] 科技创新水平 STI IPC中A01类中的发明专利申请量和实用新型专利申请量之和,来表示粮食生产方面的绿色专利量,即科技创新水平 个 106.56 205.35 分类标准见国家知识产权局(www.cnipa.gov.cn/) 人口规模 农村总人口 TRP 农村年末总人口数 万人 2223.33 1625.99 [10 , 12 ] 人口密度 PD 农村总人口/地区总人口 % 50.61 15.85 [10 ] 农村老龄化 RA 以乡村老年抚养比表示,即农村老年人口与15~64岁人口的比例 % 13.92 5.07 城镇化率 UB 区域城镇人口/总人口 % 49.37 16.67 [14 ] 自然条件 农业生产结构 APS 粮食作物播种面积/农作物总播种面积 % 66.34 12.69 [15 ] 粮食总产量 TGO 地区粮食总产量水平 万t 1765.63 1480.10 [10 ] 自然灾害 ND 农作物受灾面积/农作物播种面积 % 23.75 16.33 [20 ]
2.2 研究方法 2.2.1 生命周期评价法 本文借鉴生命周期评价法的研究思路[23 ] ,综合所有类型粮食作物,按照投入—产出的全过程测算粮食生产碳排放量(图1 ).起初投入劳动力、资本和物质资料,随后通过翻耕、灌溉和其他技术措施开展粮食种植管理,该过程中磷肥、钾肥、复合肥和农药等物质资料以及翻耕、灌溉等均直接产生二氧化碳(CO2 ).然而,氮肥与常规物质资料投入存在差异,残留物主要产生氮氧化物(N2 O),破坏土壤环境.粮食作物开始生长发育之后,水稻在该过程中会产生甲烷(CH4 ).最后环节获得粮食产出,也面临秸秆还田处理,该过程产生CO2 、N2 O和CH4 多种污染物.因此,在已有研究[29 -30 ] 基础上并结合污染物类别将上述过程归纳为物质资料投入(包括翻耕和灌溉)、土地利用(氮肥施用)、水稻生长发育过程和秸秆燃烧4个方面.需要说明的是,水稻作为重要的粮食作物之一,近年来生长发育过程中的碳排放占中国农业碳排放的比重高于22.74%[7 ] ,因而在粮食生产碳排放测算过程中仍需考虑该部分.同时,水稻生长发育排放CH4 与品种、灌溉模式和耕作方式等密切相关,但省份内水稻灌溉模式和耕作方式差异较小,已有研究以种植面积为基础同时考虑品种和地区差异确定排放系数的做法已相对成熟[29 ,31 ] ,因而本文也沿用这种测算方法.此外,本文在测算过程中尚未考虑粮食生产碳汇,原因有二:① 粮食生产过程具有正向和负向碳汇机制,正向碳汇多源于光合作用和技术固碳等[32 ] ,而负向碳汇多源于过度耕作和建设用地扩张引发的土地性质调整等[33 -34 ] ,多种作用途径下的碳汇测算系数和方法尚属未知;② 粮食生产吸收CO2 后通过分解作用仍以碳的方式释放到自然环境中[35 ] ,该过程吸收和释放的碳汇测算仍存在较大争议.综上,粮食生产碳源所产生的碳排放测算过程如下: ...
... ,
17 ]
非农兼业水平 NAI 农村居民经营净收入/农村居民可支配总收入 % 51.31 18.15 非农兼业水平代表农村居民从事非农产业收入占比 技术进步水平 劳动节约型技术 LST 农业机械总动力/乡村第一产业就业人员数量 kW/人 3.26 2.11 劳动节约型技术意味着机械化的使用节约的人力资本 个体技术水平 ITL 以农村劳动力平均受教育年限来表示,不识字或识字很少、小学程度、初中程度、高中程度、大专或大专以上程度的受教育年限分别定义为1 a、6 a、9 a、12 a和16 a a 7.32 0.93 [12 ] 科技创新水平 STI IPC中A01类中的发明专利申请量和实用新型专利申请量之和,来表示粮食生产方面的绿色专利量,即科技创新水平 个 106.56 205.35 分类标准见国家知识产权局(www.cnipa.gov.cn/) 人口规模 农村总人口 TRP 农村年末总人口数 万人 2223.33 1625.99 [10 , 12 ] 人口密度 PD 农村总人口/地区总人口 % 50.61 15.85 [10 ] 农村老龄化 RA 以乡村老年抚养比表示,即农村老年人口与15~64岁人口的比例 % 13.92 5.07 城镇化率 UB 区域城镇人口/总人口 % 49.37 16.67 [14 ] 自然条件 农业生产结构 APS 粮食作物播种面积/农作物总播种面积 % 66.34 12.69 [15 ] 粮食总产量 TGO 地区粮食总产量水平 万t 1765.63 1480.10 [10 ] 自然灾害 ND 农作物受灾面积/农作物播种面积 % 23.75 16.33 [20 ] 2.2 研究方法 2.2.1 生命周期评价法 本文借鉴生命周期评价法的研究思路[23 ] ,综合所有类型粮食作物,按照投入—产出的全过程测算粮食生产碳排放量(图1 ).起初投入劳动力、资本和物质资料,随后通过翻耕、灌溉和其他技术措施开展粮食种植管理,该过程中磷肥、钾肥、复合肥和农药等物质资料以及翻耕、灌溉等均直接产生二氧化碳(CO2 ).然而,氮肥与常规物质资料投入存在差异,残留物主要产生氮氧化物(N2 O),破坏土壤环境.粮食作物开始生长发育之后,水稻在该过程中会产生甲烷(CH4 ).最后环节获得粮食产出,也面临秸秆还田处理,该过程产生CO2 、N2 O和CH4 多种污染物.因此,在已有研究[29 -30 ] 基础上并结合污染物类别将上述过程归纳为物质资料投入(包括翻耕和灌溉)、土地利用(氮肥施用)、水稻生长发育过程和秸秆燃烧4个方面.需要说明的是,水稻作为重要的粮食作物之一,近年来生长发育过程中的碳排放占中国农业碳排放的比重高于22.74%[7 ] ,因而在粮食生产碳排放测算过程中仍需考虑该部分.同时,水稻生长发育排放CH4 与品种、灌溉模式和耕作方式等密切相关,但省份内水稻灌溉模式和耕作方式差异较小,已有研究以种植面积为基础同时考虑品种和地区差异确定排放系数的做法已相对成熟[29 ,31 ] ,因而本文也沿用这种测算方法.此外,本文在测算过程中尚未考虑粮食生产碳汇,原因有二:① 粮食生产过程具有正向和负向碳汇机制,正向碳汇多源于光合作用和技术固碳等[32 ] ,而负向碳汇多源于过度耕作和建设用地扩张引发的土地性质调整等[33 -34 ] ,多种作用途径下的碳汇测算系数和方法尚属未知;② 粮食生产吸收CO2 后通过分解作用仍以碳的方式释放到自然环境中[35 ] ,该过程吸收和释放的碳汇测算仍存在较大争议.综上,粮食生产碳源所产生的碳排放测算过程如下: ...
... 在直接效应中,农村总人口、农村人口密度和城镇化率均通过了1%的显著性检验,且系数均为正值,说明人口规模效应提升会导致本地粮食生产碳排放的增长;同理,人民生活水平效应和科技创新效应对碳排放的影响与人口规模效应的作用方向相反.从中国的客观事实而言,一方面,自1997年以来中国农村总人口和人口密度的平均递减率分别为32.77%和43.52%,农村人口对粮食生产的需求不断降低,传统小农户的种植和经营方式缩减,带动物质资料投入减少而降低了碳排放.另一方面,随着中国城镇化率快速推进,由1997年的33.35%增加到2020年的63.89%,城镇化进程促进了经济社会的发展,带动大量农村人口进城务工,某种程度上也伴随着农村居民收入水平的增长以及城乡居民收入差距的缩小,在农民承包耕地尚未进行大规模流转的情况下,粮食生产过程中的物质资料投入代替了劳动力投入,粮食增产的同时也诱致了碳排放量的增加.此外,经济发展、科技创新水平以及农村居民收入的提升,均有益于提升消费能力,无论是小农户还是家庭农场在粮食生长过程中更多倾向于使用高效优质的新品种、绿色防控品和秸秆还田等绿色生产技术,在消费端质量需求拉动和供给端利己效应共同驱动下有效地促进了粮食生产的碳减排[17 ] . ...
农户兼业对农业面源污染的影响研究
1
2018
... 现有研究主要从宏观视角聚焦于农业整体碳排放测算和影响因素分析.其中,农业碳排放是指农业生产部门(即种植业、畜牧业和渔业)在生产过程中直接或间接导致的碳排放,测算依据和范畴大多涵盖了农地利用、物资资料投入、水稻生长发育、畜禽养殖、渔业养殖、能源利用和废弃物处理等几个方面[7 ⇓ -9 ] .碳排放的驱动力分析包括多因素和单因素两个方面,前者将农业碳排放的影响因素分解为效率、结构和劳动力[9 ] ,或是采用Lasso回归从多维度指标体系筛选关键驱动力[10 ] ;后者涵盖范围更为广泛,涉及个体技术水平[11 -12 ] 、经济增长[13 -14 ] 、农业生产结构[15 -16 ] 、城乡差异[17 ] 、非农兼业[12 ,18 ] 和人口规模等[19 ] .这些相对成熟的研究方法为分析粮食生产碳排放提供了有益借鉴.相比于农业整体碳排放,粮食生产碳排放更具针对性,专指所有粮食作物(即水稻、小麦、玉米、豆类、薯类和其他)生长、发育及其收获处理过程产生的碳排放.目前学术界对粮食生产碳排放的探究相对较少,直到“十二五”末期国家农业部下发《到2020年化肥使用零增长行动方案》才引起学术界的关注.然而,现有粮食生产碳排放研究多是从农业整体碳排放中提取与粮食生产相关的部分,从总量、作物贡献和区域贡献等视角进行探析.从测算内容来看,起初仅评估了农用化肥施用导致的碳排放[20 ] ,随后将农药、农膜、柴油等物资资料投入和秸秆燃烧纳入评估体系[21 ⇓ ⇓ -24 ] .虽然粮食生产碳排放评估所涵盖的内容不断丰富,但其作物选择仍聚焦在小麦、玉米和水稻三大粮食作物.值得注意的是,由于粮食生产物质资料投入的多样性无法精确细分到每一种作物,且秸秆燃烧的范畴不局限于三大粮食作物,仅保留以上三大粮食作物而非所有粮食作物品种的“加总”,将导致碳排放测算结果产生偏差[25 ] . ...
环境分权、环境规制对农业面源污染的影响
1
2021
... 现有研究主要从宏观视角聚焦于农业整体碳排放测算和影响因素分析.其中,农业碳排放是指农业生产部门(即种植业、畜牧业和渔业)在生产过程中直接或间接导致的碳排放,测算依据和范畴大多涵盖了农地利用、物资资料投入、水稻生长发育、畜禽养殖、渔业养殖、能源利用和废弃物处理等几个方面[7 ⇓ -9 ] .碳排放的驱动力分析包括多因素和单因素两个方面,前者将农业碳排放的影响因素分解为效率、结构和劳动力[9 ] ,或是采用Lasso回归从多维度指标体系筛选关键驱动力[10 ] ;后者涵盖范围更为广泛,涉及个体技术水平[11 -12 ] 、经济增长[13 -14 ] 、农业生产结构[15 -16 ] 、城乡差异[17 ] 、非农兼业[12 ,18 ] 和人口规模等[19 ] .这些相对成熟的研究方法为分析粮食生产碳排放提供了有益借鉴.相比于农业整体碳排放,粮食生产碳排放更具针对性,专指所有粮食作物(即水稻、小麦、玉米、豆类、薯类和其他)生长、发育及其收获处理过程产生的碳排放.目前学术界对粮食生产碳排放的探究相对较少,直到“十二五”末期国家农业部下发《到2020年化肥使用零增长行动方案》才引起学术界的关注.然而,现有粮食生产碳排放研究多是从农业整体碳排放中提取与粮食生产相关的部分,从总量、作物贡献和区域贡献等视角进行探析.从测算内容来看,起初仅评估了农用化肥施用导致的碳排放[20 ] ,随后将农药、农膜、柴油等物资资料投入和秸秆燃烧纳入评估体系[21 ⇓ ⇓ -24 ] .虽然粮食生产碳排放评估所涵盖的内容不断丰富,但其作物选择仍聚焦在小麦、玉米和水稻三大粮食作物.值得注意的是,由于粮食生产物质资料投入的多样性无法精确细分到每一种作物,且秸秆燃烧的范畴不局限于三大粮食作物,仅保留以上三大粮食作物而非所有粮食作物品种的“加总”,将导致碳排放测算结果产生偏差[25 ] . ...
中国农业生态效率的省际差异和影响因素: 基于1996—2015年31个省份的面板数据分析
2
2018
... 现有研究主要从宏观视角聚焦于农业整体碳排放测算和影响因素分析.其中,农业碳排放是指农业生产部门(即种植业、畜牧业和渔业)在生产过程中直接或间接导致的碳排放,测算依据和范畴大多涵盖了农地利用、物资资料投入、水稻生长发育、畜禽养殖、渔业养殖、能源利用和废弃物处理等几个方面[7 ⇓ -9 ] .碳排放的驱动力分析包括多因素和单因素两个方面,前者将农业碳排放的影响因素分解为效率、结构和劳动力[9 ] ,或是采用Lasso回归从多维度指标体系筛选关键驱动力[10 ] ;后者涵盖范围更为广泛,涉及个体技术水平[11 -12 ] 、经济增长[13 -14 ] 、农业生产结构[15 -16 ] 、城乡差异[17 ] 、非农兼业[12 ,18 ] 和人口规模等[19 ] .这些相对成熟的研究方法为分析粮食生产碳排放提供了有益借鉴.相比于农业整体碳排放,粮食生产碳排放更具针对性,专指所有粮食作物(即水稻、小麦、玉米、豆类、薯类和其他)生长、发育及其收获处理过程产生的碳排放.目前学术界对粮食生产碳排放的探究相对较少,直到“十二五”末期国家农业部下发《到2020年化肥使用零增长行动方案》才引起学术界的关注.然而,现有粮食生产碳排放研究多是从农业整体碳排放中提取与粮食生产相关的部分,从总量、作物贡献和区域贡献等视角进行探析.从测算内容来看,起初仅评估了农用化肥施用导致的碳排放[20 ] ,随后将农药、农膜、柴油等物资资料投入和秸秆燃烧纳入评估体系[21 ⇓ ⇓ -24 ] .虽然粮食生产碳排放评估所涵盖的内容不断丰富,但其作物选择仍聚焦在小麦、玉米和水稻三大粮食作物.值得注意的是,由于粮食生产物质资料投入的多样性无法精确细分到每一种作物,且秸秆燃烧的范畴不局限于三大粮食作物,仅保留以上三大粮食作物而非所有粮食作物品种的“加总”,将导致碳排放测算结果产生偏差[25 ] . ...
... Selection and descriptive statistics of variables
Tab. 1 一级指标 二级指标 符号 指标描述 单位 均值 标准差 选择依据 粮食生产碳排放 粮食生产碳排放 CC 测算方法详见上文 万t 1431.21 1136.05 经济发展水平 经济增长 EG 人均地区生产总值 元 32415.12 28383.29 [13 -14 ] 农业总产值 TAOV 以1997年为基期,采用农产品生产者价格指数对农业总产值进行折算 亿元 1095.67 1064.93 [10 ] 地区经济结构 RES 农业增加值/地区生产总值 % 7.51 4.39 [10 ] 政府财政投入 GFI 农林水事务支出/地方一般公共预算支出 % 9.54 3.59 [7 ] 人民生活水平 农村居民人均可支配收入 AID 以1997年为基期,采用农村居民消费价格指数分别对农村居民人均可支配收入和农村居民人均消费支出进行折算 元 7275.58 5880.83 [10 , 12 , 15 , 17 ] 农村居民人均消费支出 FC 元 5665.57 4609.77 [10 , 14 ] 城乡收入差距 IG 城镇居民人均可支配收入/农村居民人均纯收入 % 2.82 0.63 [14 , 17 ] 非农兼业水平 NAI 农村居民经营净收入/农村居民可支配总收入 % 51.31 18.15 非农兼业水平代表农村居民从事非农产业收入占比 技术进步水平 劳动节约型技术 LST 农业机械总动力/乡村第一产业就业人员数量 kW/人 3.26 2.11 劳动节约型技术意味着机械化的使用节约的人力资本 个体技术水平 ITL 以农村劳动力平均受教育年限来表示,不识字或识字很少、小学程度、初中程度、高中程度、大专或大专以上程度的受教育年限分别定义为1 a、6 a、9 a、12 a和16 a a 7.32 0.93 [12 ] 科技创新水平 STI IPC中A01类中的发明专利申请量和实用新型专利申请量之和,来表示粮食生产方面的绿色专利量,即科技创新水平 个 106.56 205.35 分类标准见国家知识产权局(www.cnipa.gov.cn/) 人口规模 农村总人口 TRP 农村年末总人口数 万人 2223.33 1625.99 [10 , 12 ] 人口密度 PD 农村总人口/地区总人口 % 50.61 15.85 [10 ] 农村老龄化 RA 以乡村老年抚养比表示,即农村老年人口与15~64岁人口的比例 % 13.92 5.07 城镇化率 UB 区域城镇人口/总人口 % 49.37 16.67 [14 ] 自然条件 农业生产结构 APS 粮食作物播种面积/农作物总播种面积 % 66.34 12.69 [15 ] 粮食总产量 TGO 地区粮食总产量水平 万t 1765.63 1480.10 [10 ] 自然灾害 ND 农作物受灾面积/农作物播种面积 % 23.75 16.33 [20 ]
2.2 研究方法 2.2.1 生命周期评价法 本文借鉴生命周期评价法的研究思路[23 ] ,综合所有类型粮食作物,按照投入—产出的全过程测算粮食生产碳排放量(图1 ).起初投入劳动力、资本和物质资料,随后通过翻耕、灌溉和其他技术措施开展粮食种植管理,该过程中磷肥、钾肥、复合肥和农药等物质资料以及翻耕、灌溉等均直接产生二氧化碳(CO2 ).然而,氮肥与常规物质资料投入存在差异,残留物主要产生氮氧化物(N2 O),破坏土壤环境.粮食作物开始生长发育之后,水稻在该过程中会产生甲烷(CH4 ).最后环节获得粮食产出,也面临秸秆还田处理,该过程产生CO2 、N2 O和CH4 多种污染物.因此,在已有研究[29 -30 ] 基础上并结合污染物类别将上述过程归纳为物质资料投入(包括翻耕和灌溉)、土地利用(氮肥施用)、水稻生长发育过程和秸秆燃烧4个方面.需要说明的是,水稻作为重要的粮食作物之一,近年来生长发育过程中的碳排放占中国农业碳排放的比重高于22.74%[7 ] ,因而在粮食生产碳排放测算过程中仍需考虑该部分.同时,水稻生长发育排放CH4 与品种、灌溉模式和耕作方式等密切相关,但省份内水稻灌溉模式和耕作方式差异较小,已有研究以种植面积为基础同时考虑品种和地区差异确定排放系数的做法已相对成熟[29 ,31 ] ,因而本文也沿用这种测算方法.此外,本文在测算过程中尚未考虑粮食生产碳汇,原因有二:① 粮食生产过程具有正向和负向碳汇机制,正向碳汇多源于光合作用和技术固碳等[32 ] ,而负向碳汇多源于过度耕作和建设用地扩张引发的土地性质调整等[33 -34 ] ,多种作用途径下的碳汇测算系数和方法尚属未知;② 粮食生产吸收CO2 后通过分解作用仍以碳的方式释放到自然环境中[35 ] ,该过程吸收和释放的碳汇测算仍存在较大争议.综上,粮食生产碳源所产生的碳排放测算过程如下: ...
中国粮食生产环境效率及其影响因素分析
1
2016
... 现有研究主要从宏观视角聚焦于农业整体碳排放测算和影响因素分析.其中,农业碳排放是指农业生产部门(即种植业、畜牧业和渔业)在生产过程中直接或间接导致的碳排放,测算依据和范畴大多涵盖了农地利用、物资资料投入、水稻生长发育、畜禽养殖、渔业养殖、能源利用和废弃物处理等几个方面[7 ⇓ -9 ] .碳排放的驱动力分析包括多因素和单因素两个方面,前者将农业碳排放的影响因素分解为效率、结构和劳动力[9 ] ,或是采用Lasso回归从多维度指标体系筛选关键驱动力[10 ] ;后者涵盖范围更为广泛,涉及个体技术水平[11 -12 ] 、经济增长[13 -14 ] 、农业生产结构[15 -16 ] 、城乡差异[17 ] 、非农兼业[12 ,18 ] 和人口规模等[19 ] .这些相对成熟的研究方法为分析粮食生产碳排放提供了有益借鉴.相比于农业整体碳排放,粮食生产碳排放更具针对性,专指所有粮食作物(即水稻、小麦、玉米、豆类、薯类和其他)生长、发育及其收获处理过程产生的碳排放.目前学术界对粮食生产碳排放的探究相对较少,直到“十二五”末期国家农业部下发《到2020年化肥使用零增长行动方案》才引起学术界的关注.然而,现有粮食生产碳排放研究多是从农业整体碳排放中提取与粮食生产相关的部分,从总量、作物贡献和区域贡献等视角进行探析.从测算内容来看,起初仅评估了农用化肥施用导致的碳排放[20 ] ,随后将农药、农膜、柴油等物资资料投入和秸秆燃烧纳入评估体系[21 ⇓ ⇓ -24 ] .虽然粮食生产碳排放评估所涵盖的内容不断丰富,但其作物选择仍聚焦在小麦、玉米和水稻三大粮食作物.值得注意的是,由于粮食生产物质资料投入的多样性无法精确细分到每一种作物,且秸秆燃烧的范畴不局限于三大粮食作物,仅保留以上三大粮食作物而非所有粮食作物品种的“加总”,将导致碳排放测算结果产生偏差[25 ] . ...
Estimating emissions from crop residue open burning in China based on statistics and MODIS fire products
2
2016
... 现有研究主要从宏观视角聚焦于农业整体碳排放测算和影响因素分析.其中,农业碳排放是指农业生产部门(即种植业、畜牧业和渔业)在生产过程中直接或间接导致的碳排放,测算依据和范畴大多涵盖了农地利用、物资资料投入、水稻生长发育、畜禽养殖、渔业养殖、能源利用和废弃物处理等几个方面[7 ⇓ -9 ] .碳排放的驱动力分析包括多因素和单因素两个方面,前者将农业碳排放的影响因素分解为效率、结构和劳动力[9 ] ,或是采用Lasso回归从多维度指标体系筛选关键驱动力[10 ] ;后者涵盖范围更为广泛,涉及个体技术水平[11 -12 ] 、经济增长[13 -14 ] 、农业生产结构[15 -16 ] 、城乡差异[17 ] 、非农兼业[12 ,18 ] 和人口规模等[19 ] .这些相对成熟的研究方法为分析粮食生产碳排放提供了有益借鉴.相比于农业整体碳排放,粮食生产碳排放更具针对性,专指所有粮食作物(即水稻、小麦、玉米、豆类、薯类和其他)生长、发育及其收获处理过程产生的碳排放.目前学术界对粮食生产碳排放的探究相对较少,直到“十二五”末期国家农业部下发《到2020年化肥使用零增长行动方案》才引起学术界的关注.然而,现有粮食生产碳排放研究多是从农业整体碳排放中提取与粮食生产相关的部分,从总量、作物贡献和区域贡献等视角进行探析.从测算内容来看,起初仅评估了农用化肥施用导致的碳排放[20 ] ,随后将农药、农膜、柴油等物资资料投入和秸秆燃烧纳入评估体系[21 ⇓ ⇓ -24 ] .虽然粮食生产碳排放评估所涵盖的内容不断丰富,但其作物选择仍聚焦在小麦、玉米和水稻三大粮食作物.值得注意的是,由于粮食生产物质资料投入的多样性无法精确细分到每一种作物,且秸秆燃烧的范畴不局限于三大粮食作物,仅保留以上三大粮食作物而非所有粮食作物品种的“加总”,将导致碳排放测算结果产生偏差[25 ] . ...
... 式中: δ c C 2 i n p u t 2 排放量; A c B c D c E c δ c [29 ] ; N O 2 i n p u t 2 O; F c ③ (③《2006年IPCC国家温室气体清单指南》,网址: https://www.ipcc.ch/. ). C H 4 r i c e 4 ; G c [31 ] ; C s t r a w N O 2 s t r a w C H 4 s t r a w 2 、N2 O和CH4 ; H C I C J C K C L C [22 ] 和王晓玉等[36 ] ; C c α 1 α 2
Carbon footprint of grain production in China
2
2017
... 现有研究主要从宏观视角聚焦于农业整体碳排放测算和影响因素分析.其中,农业碳排放是指农业生产部门(即种植业、畜牧业和渔业)在生产过程中直接或间接导致的碳排放,测算依据和范畴大多涵盖了农地利用、物资资料投入、水稻生长发育、畜禽养殖、渔业养殖、能源利用和废弃物处理等几个方面[7 ⇓ -9 ] .碳排放的驱动力分析包括多因素和单因素两个方面,前者将农业碳排放的影响因素分解为效率、结构和劳动力[9 ] ,或是采用Lasso回归从多维度指标体系筛选关键驱动力[10 ] ;后者涵盖范围更为广泛,涉及个体技术水平[11 -12 ] 、经济增长[13 -14 ] 、农业生产结构[15 -16 ] 、城乡差异[17 ] 、非农兼业[12 ,18 ] 和人口规模等[19 ] .这些相对成熟的研究方法为分析粮食生产碳排放提供了有益借鉴.相比于农业整体碳排放,粮食生产碳排放更具针对性,专指所有粮食作物(即水稻、小麦、玉米、豆类、薯类和其他)生长、发育及其收获处理过程产生的碳排放.目前学术界对粮食生产碳排放的探究相对较少,直到“十二五”末期国家农业部下发《到2020年化肥使用零增长行动方案》才引起学术界的关注.然而,现有粮食生产碳排放研究多是从农业整体碳排放中提取与粮食生产相关的部分,从总量、作物贡献和区域贡献等视角进行探析.从测算内容来看,起初仅评估了农用化肥施用导致的碳排放[20 ] ,随后将农药、农膜、柴油等物资资料投入和秸秆燃烧纳入评估体系[21 ⇓ ⇓ -24 ] .虽然粮食生产碳排放评估所涵盖的内容不断丰富,但其作物选择仍聚焦在小麦、玉米和水稻三大粮食作物.值得注意的是,由于粮食生产物质资料投入的多样性无法精确细分到每一种作物,且秸秆燃烧的范畴不局限于三大粮食作物,仅保留以上三大粮食作物而非所有粮食作物品种的“加总”,将导致碳排放测算结果产生偏差[25 ] . ...
... 本文借鉴生命周期评价法的研究思路[23 ] ,综合所有类型粮食作物,按照投入—产出的全过程测算粮食生产碳排放量(图1 ).起初投入劳动力、资本和物质资料,随后通过翻耕、灌溉和其他技术措施开展粮食种植管理,该过程中磷肥、钾肥、复合肥和农药等物质资料以及翻耕、灌溉等均直接产生二氧化碳(CO2 ).然而,氮肥与常规物质资料投入存在差异,残留物主要产生氮氧化物(N2 O),破坏土壤环境.粮食作物开始生长发育之后,水稻在该过程中会产生甲烷(CH4 ).最后环节获得粮食产出,也面临秸秆还田处理,该过程产生CO2 、N2 O和CH4 多种污染物.因此,在已有研究[29 -30 ] 基础上并结合污染物类别将上述过程归纳为物质资料投入(包括翻耕和灌溉)、土地利用(氮肥施用)、水稻生长发育过程和秸秆燃烧4个方面.需要说明的是,水稻作为重要的粮食作物之一,近年来生长发育过程中的碳排放占中国农业碳排放的比重高于22.74%[7 ] ,因而在粮食生产碳排放测算过程中仍需考虑该部分.同时,水稻生长发育排放CH4 与品种、灌溉模式和耕作方式等密切相关,但省份内水稻灌溉模式和耕作方式差异较小,已有研究以种植面积为基础同时考虑品种和地区差异确定排放系数的做法已相对成熟[29 ,31 ] ,因而本文也沿用这种测算方法.此外,本文在测算过程中尚未考虑粮食生产碳汇,原因有二:① 粮食生产过程具有正向和负向碳汇机制,正向碳汇多源于光合作用和技术固碳等[32 ] ,而负向碳汇多源于过度耕作和建设用地扩张引发的土地性质调整等[33 -34 ] ,多种作用途径下的碳汇测算系数和方法尚属未知;② 粮食生产吸收CO2 后通过分解作用仍以碳的方式释放到自然环境中[35 ] ,该过程吸收和释放的碳汇测算仍存在较大争议.综上,粮食生产碳源所产生的碳排放测算过程如下: ...
我国粮食种植碳排放量变化趋势与驱动因素研究
1
2023
... 现有研究主要从宏观视角聚焦于农业整体碳排放测算和影响因素分析.其中,农业碳排放是指农业生产部门(即种植业、畜牧业和渔业)在生产过程中直接或间接导致的碳排放,测算依据和范畴大多涵盖了农地利用、物资资料投入、水稻生长发育、畜禽养殖、渔业养殖、能源利用和废弃物处理等几个方面[7 ⇓ -9 ] .碳排放的驱动力分析包括多因素和单因素两个方面,前者将农业碳排放的影响因素分解为效率、结构和劳动力[9 ] ,或是采用Lasso回归从多维度指标体系筛选关键驱动力[10 ] ;后者涵盖范围更为广泛,涉及个体技术水平[11 -12 ] 、经济增长[13 -14 ] 、农业生产结构[15 -16 ] 、城乡差异[17 ] 、非农兼业[12 ,18 ] 和人口规模等[19 ] .这些相对成熟的研究方法为分析粮食生产碳排放提供了有益借鉴.相比于农业整体碳排放,粮食生产碳排放更具针对性,专指所有粮食作物(即水稻、小麦、玉米、豆类、薯类和其他)生长、发育及其收获处理过程产生的碳排放.目前学术界对粮食生产碳排放的探究相对较少,直到“十二五”末期国家农业部下发《到2020年化肥使用零增长行动方案》才引起学术界的关注.然而,现有粮食生产碳排放研究多是从农业整体碳排放中提取与粮食生产相关的部分,从总量、作物贡献和区域贡献等视角进行探析.从测算内容来看,起初仅评估了农用化肥施用导致的碳排放[20 ] ,随后将农药、农膜、柴油等物资资料投入和秸秆燃烧纳入评估体系[21 ⇓ ⇓ -24 ] .虽然粮食生产碳排放评估所涵盖的内容不断丰富,但其作物选择仍聚焦在小麦、玉米和水稻三大粮食作物.值得注意的是,由于粮食生产物质资料投入的多样性无法精确细分到每一种作物,且秸秆燃烧的范畴不局限于三大粮食作物,仅保留以上三大粮食作物而非所有粮食作物品种的“加总”,将导致碳排放测算结果产生偏差[25 ] . ...
氮元素施用与农户粮食生产效率: 来自全国农村固定观察点数据的证据
1
2019
... 现有研究主要从宏观视角聚焦于农业整体碳排放测算和影响因素分析.其中,农业碳排放是指农业生产部门(即种植业、畜牧业和渔业)在生产过程中直接或间接导致的碳排放,测算依据和范畴大多涵盖了农地利用、物资资料投入、水稻生长发育、畜禽养殖、渔业养殖、能源利用和废弃物处理等几个方面[7 ⇓ -9 ] .碳排放的驱动力分析包括多因素和单因素两个方面,前者将农业碳排放的影响因素分解为效率、结构和劳动力[9 ] ,或是采用Lasso回归从多维度指标体系筛选关键驱动力[10 ] ;后者涵盖范围更为广泛,涉及个体技术水平[11 -12 ] 、经济增长[13 -14 ] 、农业生产结构[15 -16 ] 、城乡差异[17 ] 、非农兼业[12 ,18 ] 和人口规模等[19 ] .这些相对成熟的研究方法为分析粮食生产碳排放提供了有益借鉴.相比于农业整体碳排放,粮食生产碳排放更具针对性,专指所有粮食作物(即水稻、小麦、玉米、豆类、薯类和其他)生长、发育及其收获处理过程产生的碳排放.目前学术界对粮食生产碳排放的探究相对较少,直到“十二五”末期国家农业部下发《到2020年化肥使用零增长行动方案》才引起学术界的关注.然而,现有粮食生产碳排放研究多是从农业整体碳排放中提取与粮食生产相关的部分,从总量、作物贡献和区域贡献等视角进行探析.从测算内容来看,起初仅评估了农用化肥施用导致的碳排放[20 ] ,随后将农药、农膜、柴油等物资资料投入和秸秆燃烧纳入评估体系[21 ⇓ ⇓ -24 ] .虽然粮食生产碳排放评估所涵盖的内容不断丰富,但其作物选择仍聚焦在小麦、玉米和水稻三大粮食作物.值得注意的是,由于粮食生产物质资料投入的多样性无法精确细分到每一种作物,且秸秆燃烧的范畴不局限于三大粮食作物,仅保留以上三大粮食作物而非所有粮食作物品种的“加总”,将导致碳排放测算结果产生偏差[25 ] . ...
农业政策、粮食产量与粮食生产调整能力
1
2010
... 中国省际间粮食生产所依赖的资源禀赋差异大,影响粮食生产碳排放的因素错综复杂,这一点也可以从上述“农业碳排放影响因素多样化”得以证实.不仅如此,粮食生产碳排放及其影响因素还可能会表现出显著的阶段性和区域性特征,一方面纵观中国“五年计划”,战略性引领粮食生产领域经历了相同时间跨度的政策演变,促使粮食种植、管理、收获及处理等生产过程愈发现代化,粮食生产调整能力增强[26 ] ,理论上使得碳减排的驱动力呈现阶段性演变.另一方面地区间横向比较来看,中国依据不同省际间资源要素禀赋、气候条件、粮食产销情况及其形成的比较优势等[27 ] 划分了粮食主产区、主销区和产销平衡区① (①根据2001年《国务院关于进一步深化粮食流通体制改革的意见》、2003年《关于改革和完善农业综合开发政策措施的意见》和2008年《国家粮食安全中长期规划纲要(2008—2020年)》等政策标准将中国31个省份(数据暂未含港澳台)划分为粮食主产区、主销区和产销平衡区,其中主产区包括河北、内蒙古、辽宁、吉林、黑龙江、江苏、安徽、江西、山东、河南、湖北、湖南和四川13个省份;主销区包括北京、天津、上海、浙江、福建、广东和海南7个省份;产销平衡区包括山西、广西、重庆、贵州、云南、西藏、陕西、甘肃、青海、宁夏和新疆11个省份.),也有少数学者依据粮食作物种植制度将中国划分为华北、东北、西北、长江中下游、东南沿海和西南② (②华北地区:北京、天津、河北、山西、山东和河南;东北地区:辽宁、吉林和黑龙江;西北地区:内蒙古、陕西、甘肃、青海、宁夏和新疆;长江中下游地区:上海、江苏、安徽、江西、湖北和湖南;东南沿海地区:浙江、福建、广东、广西和海南;西南地区:重庆、四川、贵州、云南和西藏.)六大地区[28 ] ,粮食生产的区域分工深化,加之碳排放本身的负外部性特征和区域关联效应,使得碳减排驱动力在地理空间上也表现出区域异质性.然而,现有文献鲜少对粮食生产碳排放的时空特征、纵向和横向影响因素的演变进行深入分析. ...
农村劳动力外流、区域差异与粮食生产
1
2013
... 中国省际间粮食生产所依赖的资源禀赋差异大,影响粮食生产碳排放的因素错综复杂,这一点也可以从上述“农业碳排放影响因素多样化”得以证实.不仅如此,粮食生产碳排放及其影响因素还可能会表现出显著的阶段性和区域性特征,一方面纵观中国“五年计划”,战略性引领粮食生产领域经历了相同时间跨度的政策演变,促使粮食种植、管理、收获及处理等生产过程愈发现代化,粮食生产调整能力增强[26 ] ,理论上使得碳减排的驱动力呈现阶段性演变.另一方面地区间横向比较来看,中国依据不同省际间资源要素禀赋、气候条件、粮食产销情况及其形成的比较优势等[27 ] 划分了粮食主产区、主销区和产销平衡区① (①根据2001年《国务院关于进一步深化粮食流通体制改革的意见》、2003年《关于改革和完善农业综合开发政策措施的意见》和2008年《国家粮食安全中长期规划纲要(2008—2020年)》等政策标准将中国31个省份(数据暂未含港澳台)划分为粮食主产区、主销区和产销平衡区,其中主产区包括河北、内蒙古、辽宁、吉林、黑龙江、江苏、安徽、江西、山东、河南、湖北、湖南和四川13个省份;主销区包括北京、天津、上海、浙江、福建、广东和海南7个省份;产销平衡区包括山西、广西、重庆、贵州、云南、西藏、陕西、甘肃、青海、宁夏和新疆11个省份.),也有少数学者依据粮食作物种植制度将中国划分为华北、东北、西北、长江中下游、东南沿海和西南② (②华北地区:北京、天津、河北、山西、山东和河南;东北地区:辽宁、吉林和黑龙江;西北地区:内蒙古、陕西、甘肃、青海、宁夏和新疆;长江中下游地区:上海、江苏、安徽、江西、湖北和湖南;东南沿海地区:浙江、福建、广东、广西和海南;西南地区:重庆、四川、贵州、云南和西藏.)六大地区[28 ] ,粮食生产的区域分工深化,加之碳排放本身的负外部性特征和区域关联效应,使得碳减排驱动力在地理空间上也表现出区域异质性.然而,现有文献鲜少对粮食生产碳排放的时空特征、纵向和横向影响因素的演变进行深入分析. ...
中国粮食作物种植结构调整及其水土资源利用效应
1
2019
... 中国省际间粮食生产所依赖的资源禀赋差异大,影响粮食生产碳排放的因素错综复杂,这一点也可以从上述“农业碳排放影响因素多样化”得以证实.不仅如此,粮食生产碳排放及其影响因素还可能会表现出显著的阶段性和区域性特征,一方面纵观中国“五年计划”,战略性引领粮食生产领域经历了相同时间跨度的政策演变,促使粮食种植、管理、收获及处理等生产过程愈发现代化,粮食生产调整能力增强[26 ] ,理论上使得碳减排的驱动力呈现阶段性演变.另一方面地区间横向比较来看,中国依据不同省际间资源要素禀赋、气候条件、粮食产销情况及其形成的比较优势等[27 ] 划分了粮食主产区、主销区和产销平衡区① (①根据2001年《国务院关于进一步深化粮食流通体制改革的意见》、2003年《关于改革和完善农业综合开发政策措施的意见》和2008年《国家粮食安全中长期规划纲要(2008—2020年)》等政策标准将中国31个省份(数据暂未含港澳台)划分为粮食主产区、主销区和产销平衡区,其中主产区包括河北、内蒙古、辽宁、吉林、黑龙江、江苏、安徽、江西、山东、河南、湖北、湖南和四川13个省份;主销区包括北京、天津、上海、浙江、福建、广东和海南7个省份;产销平衡区包括山西、广西、重庆、贵州、云南、西藏、陕西、甘肃、青海、宁夏和新疆11个省份.),也有少数学者依据粮食作物种植制度将中国划分为华北、东北、西北、长江中下游、东南沿海和西南② (②华北地区:北京、天津、河北、山西、山东和河南;东北地区:辽宁、吉林和黑龙江;西北地区:内蒙古、陕西、甘肃、青海、宁夏和新疆;长江中下游地区:上海、江苏、安徽、江西、湖北和湖南;东南沿海地区:浙江、福建、广东、广西和海南;西南地区:重庆、四川、贵州、云南和西藏.)六大地区[28 ] ,粮食生产的区域分工深化,加之碳排放本身的负外部性特征和区域关联效应,使得碳减排驱动力在地理空间上也表现出区域异质性.然而,现有文献鲜少对粮食生产碳排放的时空特征、纵向和横向影响因素的演变进行深入分析. ...
中国农业碳排放研究: 测算、时空比较及脱钩效应
3
2012
... 本文借鉴生命周期评价法的研究思路[23 ] ,综合所有类型粮食作物,按照投入—产出的全过程测算粮食生产碳排放量(图1 ).起初投入劳动力、资本和物质资料,随后通过翻耕、灌溉和其他技术措施开展粮食种植管理,该过程中磷肥、钾肥、复合肥和农药等物质资料以及翻耕、灌溉等均直接产生二氧化碳(CO2 ).然而,氮肥与常规物质资料投入存在差异,残留物主要产生氮氧化物(N2 O),破坏土壤环境.粮食作物开始生长发育之后,水稻在该过程中会产生甲烷(CH4 ).最后环节获得粮食产出,也面临秸秆还田处理,该过程产生CO2 、N2 O和CH4 多种污染物.因此,在已有研究[29 -30 ] 基础上并结合污染物类别将上述过程归纳为物质资料投入(包括翻耕和灌溉)、土地利用(氮肥施用)、水稻生长发育过程和秸秆燃烧4个方面.需要说明的是,水稻作为重要的粮食作物之一,近年来生长发育过程中的碳排放占中国农业碳排放的比重高于22.74%[7 ] ,因而在粮食生产碳排放测算过程中仍需考虑该部分.同时,水稻生长发育排放CH4 与品种、灌溉模式和耕作方式等密切相关,但省份内水稻灌溉模式和耕作方式差异较小,已有研究以种植面积为基础同时考虑品种和地区差异确定排放系数的做法已相对成熟[29 ,31 ] ,因而本文也沿用这种测算方法.此外,本文在测算过程中尚未考虑粮食生产碳汇,原因有二:① 粮食生产过程具有正向和负向碳汇机制,正向碳汇多源于光合作用和技术固碳等[32 ] ,而负向碳汇多源于过度耕作和建设用地扩张引发的土地性质调整等[33 -34 ] ,多种作用途径下的碳汇测算系数和方法尚属未知;② 粮食生产吸收CO2 后通过分解作用仍以碳的方式释放到自然环境中[35 ] ,该过程吸收和释放的碳汇测算仍存在较大争议.综上,粮食生产碳源所产生的碳排放测算过程如下: ...
... [29 ,31 ],因而本文也沿用这种测算方法.此外,本文在测算过程中尚未考虑粮食生产碳汇,原因有二:① 粮食生产过程具有正向和负向碳汇机制,正向碳汇多源于光合作用和技术固碳等[32 ] ,而负向碳汇多源于过度耕作和建设用地扩张引发的土地性质调整等[33 -34 ] ,多种作用途径下的碳汇测算系数和方法尚属未知;② 粮食生产吸收CO2 后通过分解作用仍以碳的方式释放到自然环境中[35 ] ,该过程吸收和释放的碳汇测算仍存在较大争议.综上,粮食生产碳源所产生的碳排放测算过程如下: ...
... 式中: δ c C 2 i n p u t 2 排放量; A c B c D c E c δ c [29 ] ; N O 2 i n p u t 2 O; F c ③ (③《2006年IPCC国家温室气体清单指南》,网址: https://www.ipcc.ch/. ). C H 4 r i c e 4 ; G c [31 ] ; C s t r a w N O 2 s t r a w C H 4 s t r a w 2 、N2 O和CH4 ; H C I C J C K C L C [22 ] 和王晓玉等[36 ] ; C c α 1 α 2
农业源非二氧化碳温室气体排放及情景模拟
1
2023
... 本文借鉴生命周期评价法的研究思路[23 ] ,综合所有类型粮食作物,按照投入—产出的全过程测算粮食生产碳排放量(图1 ).起初投入劳动力、资本和物质资料,随后通过翻耕、灌溉和其他技术措施开展粮食种植管理,该过程中磷肥、钾肥、复合肥和农药等物质资料以及翻耕、灌溉等均直接产生二氧化碳(CO2 ).然而,氮肥与常规物质资料投入存在差异,残留物主要产生氮氧化物(N2 O),破坏土壤环境.粮食作物开始生长发育之后,水稻在该过程中会产生甲烷(CH4 ).最后环节获得粮食产出,也面临秸秆还田处理,该过程产生CO2 、N2 O和CH4 多种污染物.因此,在已有研究[29 -30 ] 基础上并结合污染物类别将上述过程归纳为物质资料投入(包括翻耕和灌溉)、土地利用(氮肥施用)、水稻生长发育过程和秸秆燃烧4个方面.需要说明的是,水稻作为重要的粮食作物之一,近年来生长发育过程中的碳排放占中国农业碳排放的比重高于22.74%[7 ] ,因而在粮食生产碳排放测算过程中仍需考虑该部分.同时,水稻生长发育排放CH4 与品种、灌溉模式和耕作方式等密切相关,但省份内水稻灌溉模式和耕作方式差异较小,已有研究以种植面积为基础同时考虑品种和地区差异确定排放系数的做法已相对成熟[29 ,31 ] ,因而本文也沿用这种测算方法.此外,本文在测算过程中尚未考虑粮食生产碳汇,原因有二:① 粮食生产过程具有正向和负向碳汇机制,正向碳汇多源于光合作用和技术固碳等[32 ] ,而负向碳汇多源于过度耕作和建设用地扩张引发的土地性质调整等[33 -34 ] ,多种作用途径下的碳汇测算系数和方法尚属未知;② 粮食生产吸收CO2 后通过分解作用仍以碳的方式释放到自然环境中[35 ] ,该过程吸收和释放的碳汇测算仍存在较大争议.综上,粮食生产碳源所产生的碳排放测算过程如下: ...
中国农业生产温室气体排放量的测算
2
2012
... 本文借鉴生命周期评价法的研究思路[23 ] ,综合所有类型粮食作物,按照投入—产出的全过程测算粮食生产碳排放量(图1 ).起初投入劳动力、资本和物质资料,随后通过翻耕、灌溉和其他技术措施开展粮食种植管理,该过程中磷肥、钾肥、复合肥和农药等物质资料以及翻耕、灌溉等均直接产生二氧化碳(CO2 ).然而,氮肥与常规物质资料投入存在差异,残留物主要产生氮氧化物(N2 O),破坏土壤环境.粮食作物开始生长发育之后,水稻在该过程中会产生甲烷(CH4 ).最后环节获得粮食产出,也面临秸秆还田处理,该过程产生CO2 、N2 O和CH4 多种污染物.因此,在已有研究[29 -30 ] 基础上并结合污染物类别将上述过程归纳为物质资料投入(包括翻耕和灌溉)、土地利用(氮肥施用)、水稻生长发育过程和秸秆燃烧4个方面.需要说明的是,水稻作为重要的粮食作物之一,近年来生长发育过程中的碳排放占中国农业碳排放的比重高于22.74%[7 ] ,因而在粮食生产碳排放测算过程中仍需考虑该部分.同时,水稻生长发育排放CH4 与品种、灌溉模式和耕作方式等密切相关,但省份内水稻灌溉模式和耕作方式差异较小,已有研究以种植面积为基础同时考虑品种和地区差异确定排放系数的做法已相对成熟[29 ,31 ] ,因而本文也沿用这种测算方法.此外,本文在测算过程中尚未考虑粮食生产碳汇,原因有二:① 粮食生产过程具有正向和负向碳汇机制,正向碳汇多源于光合作用和技术固碳等[32 ] ,而负向碳汇多源于过度耕作和建设用地扩张引发的土地性质调整等[33 -34 ] ,多种作用途径下的碳汇测算系数和方法尚属未知;② 粮食生产吸收CO2 后通过分解作用仍以碳的方式释放到自然环境中[35 ] ,该过程吸收和释放的碳汇测算仍存在较大争议.综上,粮食生产碳源所产生的碳排放测算过程如下: ...
... 式中: δ c C 2 i n p u t 2 排放量; A c B c D c E c δ c [29 ] ; N O 2 i n p u t 2 O; F c ③ (③《2006年IPCC国家温室气体清单指南》,网址: https://www.ipcc.ch/. ). C H 4 r i c e 4 ; G c [31 ] ; C s t r a w N O 2 s t r a w C H 4 s t r a w 2 、N2 O和CH4 ; H C I C J C K C L C [22 ] 和王晓玉等[36 ] ; C c α 1 α 2
Global variation in soil carbon sequestration potential through improved cropland management
1
2022
... 本文借鉴生命周期评价法的研究思路[23 ] ,综合所有类型粮食作物,按照投入—产出的全过程测算粮食生产碳排放量(图1 ).起初投入劳动力、资本和物质资料,随后通过翻耕、灌溉和其他技术措施开展粮食种植管理,该过程中磷肥、钾肥、复合肥和农药等物质资料以及翻耕、灌溉等均直接产生二氧化碳(CO2 ).然而,氮肥与常规物质资料投入存在差异,残留物主要产生氮氧化物(N2 O),破坏土壤环境.粮食作物开始生长发育之后,水稻在该过程中会产生甲烷(CH4 ).最后环节获得粮食产出,也面临秸秆还田处理,该过程产生CO2 、N2 O和CH4 多种污染物.因此,在已有研究[29 -30 ] 基础上并结合污染物类别将上述过程归纳为物质资料投入(包括翻耕和灌溉)、土地利用(氮肥施用)、水稻生长发育过程和秸秆燃烧4个方面.需要说明的是,水稻作为重要的粮食作物之一,近年来生长发育过程中的碳排放占中国农业碳排放的比重高于22.74%[7 ] ,因而在粮食生产碳排放测算过程中仍需考虑该部分.同时,水稻生长发育排放CH4 与品种、灌溉模式和耕作方式等密切相关,但省份内水稻灌溉模式和耕作方式差异较小,已有研究以种植面积为基础同时考虑品种和地区差异确定排放系数的做法已相对成熟[29 ,31 ] ,因而本文也沿用这种测算方法.此外,本文在测算过程中尚未考虑粮食生产碳汇,原因有二:① 粮食生产过程具有正向和负向碳汇机制,正向碳汇多源于光合作用和技术固碳等[32 ] ,而负向碳汇多源于过度耕作和建设用地扩张引发的土地性质调整等[33 -34 ] ,多种作用途径下的碳汇测算系数和方法尚属未知;② 粮食生产吸收CO2 后通过分解作用仍以碳的方式释放到自然环境中[35 ] ,该过程吸收和释放的碳汇测算仍存在较大争议.综上,粮食生产碳源所产生的碳排放测算过程如下: ...
Carbon sinks/sources' spatiotemporal evolution in China and its response to built-up land expansion
1
2022
... 本文借鉴生命周期评价法的研究思路[23 ] ,综合所有类型粮食作物,按照投入—产出的全过程测算粮食生产碳排放量(图1 ).起初投入劳动力、资本和物质资料,随后通过翻耕、灌溉和其他技术措施开展粮食种植管理,该过程中磷肥、钾肥、复合肥和农药等物质资料以及翻耕、灌溉等均直接产生二氧化碳(CO2 ).然而,氮肥与常规物质资料投入存在差异,残留物主要产生氮氧化物(N2 O),破坏土壤环境.粮食作物开始生长发育之后,水稻在该过程中会产生甲烷(CH4 ).最后环节获得粮食产出,也面临秸秆还田处理,该过程产生CO2 、N2 O和CH4 多种污染物.因此,在已有研究[29 -30 ] 基础上并结合污染物类别将上述过程归纳为物质资料投入(包括翻耕和灌溉)、土地利用(氮肥施用)、水稻生长发育过程和秸秆燃烧4个方面.需要说明的是,水稻作为重要的粮食作物之一,近年来生长发育过程中的碳排放占中国农业碳排放的比重高于22.74%[7 ] ,因而在粮食生产碳排放测算过程中仍需考虑该部分.同时,水稻生长发育排放CH4 与品种、灌溉模式和耕作方式等密切相关,但省份内水稻灌溉模式和耕作方式差异较小,已有研究以种植面积为基础同时考虑品种和地区差异确定排放系数的做法已相对成熟[29 ,31 ] ,因而本文也沿用这种测算方法.此外,本文在测算过程中尚未考虑粮食生产碳汇,原因有二:① 粮食生产过程具有正向和负向碳汇机制,正向碳汇多源于光合作用和技术固碳等[32 ] ,而负向碳汇多源于过度耕作和建设用地扩张引发的土地性质调整等[33 -34 ] ,多种作用途径下的碳汇测算系数和方法尚属未知;② 粮食生产吸收CO2 后通过分解作用仍以碳的方式释放到自然环境中[35 ] ,该过程吸收和释放的碳汇测算仍存在较大争议.综上,粮食生产碳源所产生的碳排放测算过程如下: ...
基于土地利用变化情景的生态系统碳储量评估: 以太行山淇河流域为例
1
2019
... 本文借鉴生命周期评价法的研究思路[23 ] ,综合所有类型粮食作物,按照投入—产出的全过程测算粮食生产碳排放量(图1 ).起初投入劳动力、资本和物质资料,随后通过翻耕、灌溉和其他技术措施开展粮食种植管理,该过程中磷肥、钾肥、复合肥和农药等物质资料以及翻耕、灌溉等均直接产生二氧化碳(CO2 ).然而,氮肥与常规物质资料投入存在差异,残留物主要产生氮氧化物(N2 O),破坏土壤环境.粮食作物开始生长发育之后,水稻在该过程中会产生甲烷(CH4 ).最后环节获得粮食产出,也面临秸秆还田处理,该过程产生CO2 、N2 O和CH4 多种污染物.因此,在已有研究[29 -30 ] 基础上并结合污染物类别将上述过程归纳为物质资料投入(包括翻耕和灌溉)、土地利用(氮肥施用)、水稻生长发育过程和秸秆燃烧4个方面.需要说明的是,水稻作为重要的粮食作物之一,近年来生长发育过程中的碳排放占中国农业碳排放的比重高于22.74%[7 ] ,因而在粮食生产碳排放测算过程中仍需考虑该部分.同时,水稻生长发育排放CH4 与品种、灌溉模式和耕作方式等密切相关,但省份内水稻灌溉模式和耕作方式差异较小,已有研究以种植面积为基础同时考虑品种和地区差异确定排放系数的做法已相对成熟[29 ,31 ] ,因而本文也沿用这种测算方法.此外,本文在测算过程中尚未考虑粮食生产碳汇,原因有二:① 粮食生产过程具有正向和负向碳汇机制,正向碳汇多源于光合作用和技术固碳等[32 ] ,而负向碳汇多源于过度耕作和建设用地扩张引发的土地性质调整等[33 -34 ] ,多种作用途径下的碳汇测算系数和方法尚属未知;② 粮食生产吸收CO2 后通过分解作用仍以碳的方式释放到自然环境中[35 ] ,该过程吸收和释放的碳汇测算仍存在较大争议.综上,粮食生产碳源所产生的碳排放测算过程如下: ...
中国农业净碳汇效率动态演进与空间溢出效应
1
2019
... 本文借鉴生命周期评价法的研究思路[23 ] ,综合所有类型粮食作物,按照投入—产出的全过程测算粮食生产碳排放量(图1 ).起初投入劳动力、资本和物质资料,随后通过翻耕、灌溉和其他技术措施开展粮食种植管理,该过程中磷肥、钾肥、复合肥和农药等物质资料以及翻耕、灌溉等均直接产生二氧化碳(CO2 ).然而,氮肥与常规物质资料投入存在差异,残留物主要产生氮氧化物(N2 O),破坏土壤环境.粮食作物开始生长发育之后,水稻在该过程中会产生甲烷(CH4 ).最后环节获得粮食产出,也面临秸秆还田处理,该过程产生CO2 、N2 O和CH4 多种污染物.因此,在已有研究[29 -30 ] 基础上并结合污染物类别将上述过程归纳为物质资料投入(包括翻耕和灌溉)、土地利用(氮肥施用)、水稻生长发育过程和秸秆燃烧4个方面.需要说明的是,水稻作为重要的粮食作物之一,近年来生长发育过程中的碳排放占中国农业碳排放的比重高于22.74%[7 ] ,因而在粮食生产碳排放测算过程中仍需考虑该部分.同时,水稻生长发育排放CH4 与品种、灌溉模式和耕作方式等密切相关,但省份内水稻灌溉模式和耕作方式差异较小,已有研究以种植面积为基础同时考虑品种和地区差异确定排放系数的做法已相对成熟[29 ,31 ] ,因而本文也沿用这种测算方法.此外,本文在测算过程中尚未考虑粮食生产碳汇,原因有二:① 粮食生产过程具有正向和负向碳汇机制,正向碳汇多源于光合作用和技术固碳等[32 ] ,而负向碳汇多源于过度耕作和建设用地扩张引发的土地性质调整等[33 -34 ] ,多种作用途径下的碳汇测算系数和方法尚属未知;② 粮食生产吸收CO2 后通过分解作用仍以碳的方式释放到自然环境中[35 ] ,该过程吸收和释放的碳汇测算仍存在较大争议.综上,粮食生产碳源所产生的碳排放测算过程如下: ...
大田作物秸秆量评估中秸秆系数取值研究
1
2012
... 式中: δ c C 2 i n p u t 2 排放量; A c B c D c E c δ c [29 ] ; N O 2 i n p u t 2 O; F c ③ (③《2006年IPCC国家温室气体清单指南》,网址: https://www.ipcc.ch/. ). C H 4 r i c e 4 ; G c [31 ] ; C s t r a w N O 2 s t r a w C H 4 s t r a w 2 、N2 O和CH4 ; H C I C J C K C L C [22 ] 和王晓玉等[36 ] ; C c α 1 α 2
A new approach to the decomposition of the Gini income inequality ratio
1
1997
... Introduction to space-time evolution method
Tab. 2 方法名称 模型公式 公式释义 参考文献 Dagum基尼系数 G = ∑ j = 1 k ∑ h = 1 k ∑ i = 1 n h ∑ r = 1 n h y j i - y h r 2 n 2 y - y - h ≤ … ≤ y - j ≤ … ≤ y - k G j j = 1 2 y - j ∑ i = 1 n j ∑ r = 1 n j y j i - y j r n j 2 G w = ∑ j = 1 k G j j P j S j G j h = ∑ i = 1 n j ∑ r = 1 n h y j i - y h r n j n h ( y - j + y - h ) G n b = ∑ j = 2 k ∑ h = 1 j - 1 G j h ( p j s h + p h s j ) D j h G t = ∑ j = 2 k ∑ h = 1 j = 1 G j h ( p j s h + p h s j ) ( 1 - D j h ) G = G w + G n b + G t s . t . p j = n j y - , s j = n j y - j n y - , j = 1,2 , … , k G y - h 、 y - j 、 y - k h 、j 、k 地区内各省份粮食生产碳排放均值; G j j G w j 地区内的基尼系数和区域内差异贡献; G j h G n b j 和h 地区间的基尼系数和地区间净差值差异贡献; G t y j i ( yhr )为j (h )地区中i (r )省份的研究对象值,n 为省份个数,k 为地区个数, n j ( n h ) j (h )地区内的省份个数.[37 ] 标准差椭圆 X - w = ∑ i = 1 n w i x i ∑ i = 1 n w i Y - w = ∑ i = 1 n w i y i ∑ i = 1 n w i δ x = ∑ i = 1 n ( w i x - i c o s θ - w i y - i s i n θ ) 2 ∑ i = 1 n w i 2 δ y = ∑ i = 1 n ( w i x - i s i n θ - w i y - i c o s θ ) 2 ∑ i = 1 n w i 2 t a n θ = ( ∑ i = 1 n w i 2 x - i 2 - ∑ i = 1 n w i 2 y - i 2 ) + ∑ i = 1 n w i 2 x - i 2 - ∑ i = 1 n w i 2 y - i 2 2 + 4 ∑ i = 1 n w i 2 x - i 2 y - i 2 2 ∑ i = 1 n w i 2 x - i y - i x - i y - i x i y i ) 距离分布重心的相对坐标; w i θ 为标准差椭圆的方位角,即正北方向顺时针旋转与标准差椭圆长轴形成的夹角; δ x δ y x 轴和y 轴上标准差.[38 ⇓ -40 ] 核密度 f x = 1 N h ∑ i = 1 N K x i - X - h K x = 1 2 π e x p - x 2 2 l i m x → ∞ K x ∙ x = 0 K x ≥ 0 , ∫ - ∞ + ∞ K x d x = 1 s u p K x < + ∞ , ∫ - ∞ + ∞ K 2 ( x ) d x = 1 f x X 在点x 的概率密度公式; K ∙ N 为样本观测值个数; x i X - h [40 -41 ]
2.2.3 驱动效应评估方法 (1)模型选择.参照已有研究[42 -43 ] ,综合自适应Lasso回归模型和空间杜宾模型揭示中国粮食生产碳排放的驱动力,模型设定分为两步. ...
Measuring geographic concentration by means of the standard deviational ellipse
1
1926
... Introduction to space-time evolution method
Tab. 2 方法名称 模型公式 公式释义 参考文献 Dagum基尼系数 G = ∑ j = 1 k ∑ h = 1 k ∑ i = 1 n h ∑ r = 1 n h y j i - y h r 2 n 2 y - y - h ≤ … ≤ y - j ≤ … ≤ y - k G j j = 1 2 y - j ∑ i = 1 n j ∑ r = 1 n j y j i - y j r n j 2 G w = ∑ j = 1 k G j j P j S j G j h = ∑ i = 1 n j ∑ r = 1 n h y j i - y h r n j n h ( y - j + y - h ) G n b = ∑ j = 2 k ∑ h = 1 j - 1 G j h ( p j s h + p h s j ) D j h G t = ∑ j = 2 k ∑ h = 1 j = 1 G j h ( p j s h + p h s j ) ( 1 - D j h ) G = G w + G n b + G t s . t . p j = n j y - , s j = n j y - j n y - , j = 1,2 , … , k G y - h 、 y - j 、 y - k h 、j 、k 地区内各省份粮食生产碳排放均值; G j j G w j 地区内的基尼系数和区域内差异贡献; G j h G n b j 和h 地区间的基尼系数和地区间净差值差异贡献; G t y j i ( yhr )为j (h )地区中i (r )省份的研究对象值,n 为省份个数,k 为地区个数, n j ( n h ) j (h )地区内的省份个数.[37 ] 标准差椭圆 X - w = ∑ i = 1 n w i x i ∑ i = 1 n w i Y - w = ∑ i = 1 n w i y i ∑ i = 1 n w i δ x = ∑ i = 1 n ( w i x - i c o s θ - w i y - i s i n θ ) 2 ∑ i = 1 n w i 2 δ y = ∑ i = 1 n ( w i x - i s i n θ - w i y - i c o s θ ) 2 ∑ i = 1 n w i 2 t a n θ = ( ∑ i = 1 n w i 2 x - i 2 - ∑ i = 1 n w i 2 y - i 2 ) + ∑ i = 1 n w i 2 x - i 2 - ∑ i = 1 n w i 2 y - i 2 2 + 4 ∑ i = 1 n w i 2 x - i 2 y - i 2 2 ∑ i = 1 n w i 2 x - i y - i x - i y - i x i y i ) 距离分布重心的相对坐标; w i θ 为标准差椭圆的方位角,即正北方向顺时针旋转与标准差椭圆长轴形成的夹角; δ x δ y x 轴和y 轴上标准差.[38 ⇓ -40 ] 核密度 f x = 1 N h ∑ i = 1 N K x i - X - h K x = 1 2 π e x p - x 2 2 l i m x → ∞ K x ∙ x = 0 K x ≥ 0 , ∫ - ∞ + ∞ K x d x = 1 s u p K x < + ∞ , ∫ - ∞ + ∞ K 2 ( x ) d x = 1 f x X 在点x 的概率密度公式; K ∙ N 为样本观测值个数; x i X - h [40 -41 ]
2.2.3 驱动效应评估方法 (1)模型选择.参照已有研究[42 -43 ] ,综合自适应Lasso回归模型和空间杜宾模型揭示中国粮食生产碳排放的驱动力,模型设定分为两步. ...
1928—2017年南京城市户籍人口时空格局演变
1
2022
... Introduction to space-time evolution method
Tab. 2 方法名称 模型公式 公式释义 参考文献 Dagum基尼系数 G = ∑ j = 1 k ∑ h = 1 k ∑ i = 1 n h ∑ r = 1 n h y j i - y h r 2 n 2 y - y - h ≤ … ≤ y - j ≤ … ≤ y - k G j j = 1 2 y - j ∑ i = 1 n j ∑ r = 1 n j y j i - y j r n j 2 G w = ∑ j = 1 k G j j P j S j G j h = ∑ i = 1 n j ∑ r = 1 n h y j i - y h r n j n h ( y - j + y - h ) G n b = ∑ j = 2 k ∑ h = 1 j - 1 G j h ( p j s h + p h s j ) D j h G t = ∑ j = 2 k ∑ h = 1 j = 1 G j h ( p j s h + p h s j ) ( 1 - D j h ) G = G w + G n b + G t s . t . p j = n j y - , s j = n j y - j n y - , j = 1,2 , … , k G y - h 、 y - j 、 y - k h 、j 、k 地区内各省份粮食生产碳排放均值; G j j G w j 地区内的基尼系数和区域内差异贡献; G j h G n b j 和h 地区间的基尼系数和地区间净差值差异贡献; G t y j i ( yhr )为j (h )地区中i (r )省份的研究对象值,n 为省份个数,k 为地区个数, n j ( n h ) j (h )地区内的省份个数.[37 ] 标准差椭圆 X - w = ∑ i = 1 n w i x i ∑ i = 1 n w i Y - w = ∑ i = 1 n w i y i ∑ i = 1 n w i δ x = ∑ i = 1 n ( w i x - i c o s θ - w i y - i s i n θ ) 2 ∑ i = 1 n w i 2 δ y = ∑ i = 1 n ( w i x - i s i n θ - w i y - i c o s θ ) 2 ∑ i = 1 n w i 2 t a n θ = ( ∑ i = 1 n w i 2 x - i 2 - ∑ i = 1 n w i 2 y - i 2 ) + ∑ i = 1 n w i 2 x - i 2 - ∑ i = 1 n w i 2 y - i 2 2 + 4 ∑ i = 1 n w i 2 x - i 2 y - i 2 2 ∑ i = 1 n w i 2 x - i y - i x - i y - i x i y i ) 距离分布重心的相对坐标; w i θ 为标准差椭圆的方位角,即正北方向顺时针旋转与标准差椭圆长轴形成的夹角; δ x δ y x 轴和y 轴上标准差.[38 ⇓ -40 ] 核密度 f x = 1 N h ∑ i = 1 N K x i - X - h K x = 1 2 π e x p - x 2 2 l i m x → ∞ K x ∙ x = 0 K x ≥ 0 , ∫ - ∞ + ∞ K x d x = 1 s u p K x < + ∞ , ∫ - ∞ + ∞ K 2 ( x ) d x = 1 f x X 在点x 的概率密度公式; K ∙ N 为样本观测值个数; x i X - h [40 -41 ]
2.2.3 驱动效应评估方法 (1)模型选择.参照已有研究[42 -43 ] ,综合自适应Lasso回归模型和空间杜宾模型揭示中国粮食生产碳排放的驱动力,模型设定分为两步. ...
中国物流业效率的时空格局及动态演进
2
2021
... Introduction to space-time evolution method
Tab. 2 方法名称 模型公式 公式释义 参考文献 Dagum基尼系数 G = ∑ j = 1 k ∑ h = 1 k ∑ i = 1 n h ∑ r = 1 n h y j i - y h r 2 n 2 y - y - h ≤ … ≤ y - j ≤ … ≤ y - k G j j = 1 2 y - j ∑ i = 1 n j ∑ r = 1 n j y j i - y j r n j 2 G w = ∑ j = 1 k G j j P j S j G j h = ∑ i = 1 n j ∑ r = 1 n h y j i - y h r n j n h ( y - j + y - h ) G n b = ∑ j = 2 k ∑ h = 1 j - 1 G j h ( p j s h + p h s j ) D j h G t = ∑ j = 2 k ∑ h = 1 j = 1 G j h ( p j s h + p h s j ) ( 1 - D j h ) G = G w + G n b + G t s . t . p j = n j y - , s j = n j y - j n y - , j = 1,2 , … , k G y - h 、 y - j 、 y - k h 、j 、k 地区内各省份粮食生产碳排放均值; G j j G w j 地区内的基尼系数和区域内差异贡献; G j h G n b j 和h 地区间的基尼系数和地区间净差值差异贡献; G t y j i ( yhr )为j (h )地区中i (r )省份的研究对象值,n 为省份个数,k 为地区个数, n j ( n h ) j (h )地区内的省份个数.[37 ] 标准差椭圆 X - w = ∑ i = 1 n w i x i ∑ i = 1 n w i Y - w = ∑ i = 1 n w i y i ∑ i = 1 n w i δ x = ∑ i = 1 n ( w i x - i c o s θ - w i y - i s i n θ ) 2 ∑ i = 1 n w i 2 δ y = ∑ i = 1 n ( w i x - i s i n θ - w i y - i c o s θ ) 2 ∑ i = 1 n w i 2 t a n θ = ( ∑ i = 1 n w i 2 x - i 2 - ∑ i = 1 n w i 2 y - i 2 ) + ∑ i = 1 n w i 2 x - i 2 - ∑ i = 1 n w i 2 y - i 2 2 + 4 ∑ i = 1 n w i 2 x - i 2 y - i 2 2 ∑ i = 1 n w i 2 x - i y - i x - i y - i x i y i ) 距离分布重心的相对坐标; w i θ 为标准差椭圆的方位角,即正北方向顺时针旋转与标准差椭圆长轴形成的夹角; δ x δ y x 轴和y 轴上标准差.[38 ⇓ -40 ] 核密度 f x = 1 N h ∑ i = 1 N K x i - X - h K x = 1 2 π e x p - x 2 2 l i m x → ∞ K x ∙ x = 0 K x ≥ 0 , ∫ - ∞ + ∞ K x d x = 1 s u p K x < + ∞ , ∫ - ∞ + ∞ K 2 ( x ) d x = 1 f x X 在点x 的概率密度公式; K ∙ N 为样本观测值个数; x i X - h [40 -41 ]
2.2.3 驱动效应评估方法 (1)模型选择.参照已有研究[42 -43 ] ,综合自适应Lasso回归模型和空间杜宾模型揭示中国粮食生产碳排放的驱动力,模型设定分为两步. ...
... [
40 -
41 ]
2.2.3 驱动效应评估方法 (1)模型选择.参照已有研究[42 -43 ] ,综合自适应Lasso回归模型和空间杜宾模型揭示中国粮食生产碳排放的驱动力,模型设定分为两步. ...
中国城市空气质量的区域差异及归因分析
1
2021
... Introduction to space-time evolution method
Tab. 2 方法名称 模型公式 公式释义 参考文献 Dagum基尼系数 G = ∑ j = 1 k ∑ h = 1 k ∑ i = 1 n h ∑ r = 1 n h y j i - y h r 2 n 2 y - y - h ≤ … ≤ y - j ≤ … ≤ y - k G j j = 1 2 y - j ∑ i = 1 n j ∑ r = 1 n j y j i - y j r n j 2 G w = ∑ j = 1 k G j j P j S j G j h = ∑ i = 1 n j ∑ r = 1 n h y j i - y h r n j n h ( y - j + y - h ) G n b = ∑ j = 2 k ∑ h = 1 j - 1 G j h ( p j s h + p h s j ) D j h G t = ∑ j = 2 k ∑ h = 1 j = 1 G j h ( p j s h + p h s j ) ( 1 - D j h ) G = G w + G n b + G t s . t . p j = n j y - , s j = n j y - j n y - , j = 1,2 , … , k G y - h 、 y - j 、 y - k h 、j 、k 地区内各省份粮食生产碳排放均值; G j j G w j 地区内的基尼系数和区域内差异贡献; G j h G n b j 和h 地区间的基尼系数和地区间净差值差异贡献; G t y j i ( yhr )为j (h )地区中i (r )省份的研究对象值,n 为省份个数,k 为地区个数, n j ( n h ) j (h )地区内的省份个数.[37 ] 标准差椭圆 X - w = ∑ i = 1 n w i x i ∑ i = 1 n w i Y - w = ∑ i = 1 n w i y i ∑ i = 1 n w i δ x = ∑ i = 1 n ( w i x - i c o s θ - w i y - i s i n θ ) 2 ∑ i = 1 n w i 2 δ y = ∑ i = 1 n ( w i x - i s i n θ - w i y - i c o s θ ) 2 ∑ i = 1 n w i 2 t a n θ = ( ∑ i = 1 n w i 2 x - i 2 - ∑ i = 1 n w i 2 y - i 2 ) + ∑ i = 1 n w i 2 x - i 2 - ∑ i = 1 n w i 2 y - i 2 2 + 4 ∑ i = 1 n w i 2 x - i 2 y - i 2 2 ∑ i = 1 n w i 2 x - i y - i x - i y - i x i y i ) 距离分布重心的相对坐标; w i θ 为标准差椭圆的方位角,即正北方向顺时针旋转与标准差椭圆长轴形成的夹角; δ x δ y x 轴和y 轴上标准差.[38 ⇓ -40 ] 核密度 f x = 1 N h ∑ i = 1 N K x i - X - h K x = 1 2 π e x p - x 2 2 l i m x → ∞ K x ∙ x = 0 K x ≥ 0 , ∫ - ∞ + ∞ K x d x = 1 s u p K x < + ∞ , ∫ - ∞ + ∞ K 2 ( x ) d x = 1 f x X 在点x 的概率密度公式; K ∙ N 为样本观测值个数; x i X - h [40 -41 ]
2.2.3 驱动效应评估方法 (1)模型选择.参照已有研究[42 -43 ] ,综合自适应Lasso回归模型和空间杜宾模型揭示中国粮食生产碳排放的驱动力,模型设定分为两步. ...
Estimation and selection of spatial weight matrix in a spatial lag model
1
2020
... (1)模型选择.参照已有研究[42 -43 ] ,综合自适应Lasso回归模型和空间杜宾模型揭示中国粮食生产碳排放的驱动力,模型设定分为两步. ...
西部地区经济增长影响因素分析及其高质量发展的路径选择
1
2019
... (1)模型选择.参照已有研究[42 -43 ] ,综合自适应Lasso回归模型和空间杜宾模型揭示中国粮食生产碳排放的驱动力,模型设定分为两步. ...
西部地区经济增长影响因素分析及其高质量发展的路径选择
1
2019
... (1)模型选择.参照已有研究[42 -43 ] ,综合自适应Lasso回归模型和空间杜宾模型揭示中国粮食生产碳排放的驱动力,模型设定分为两步. ...
The adaptive lasso and its oracle properties
1
2006
... 第一步采用自适应Lasso回归剔除系数被压缩至零的非关键变量.自适应Lasso回归是由Tibshirani首次提出一种机器学习方法,随后Zou针对不同 β ˆ [44 ] ,该方法设有N 个样本量,解释变量和被解释变量分别设定为 X Y . ...
Matlab software for spatial panels
1
2014
... 第二步运用空间杜宾(SDM)模型进一步评估自适应Lasso回归筛选出的变量,分析这些变量在全国、时段和区域内的本地效应和空间溢出效应,参照Elhorst[45 ] 和LeSage等[46 ] 将SDM模型估计结果分解为直接效应、间接效应和总效应,以评估各解释变量的边际效应. ...
1
2009
... 第二步运用空间杜宾(SDM)模型进一步评估自适应Lasso回归筛选出的变量,分析这些变量在全国、时段和区域内的本地效应和空间溢出效应,参照Elhorst[45 ] 和LeSage等[46 ] 将SDM模型估计结果分解为直接效应、间接效应和总效应,以评估各解释变量的边际效应. ...
地理区位、交通基础设施与种植业结构调整研究
1
2006
... 解释变量 X i [47 ] ,而粮食生产地理区位的比较优势取决于气候和耕地资源等自然条件[48 ] ,自然灾害则多源于不可预测的旱灾和水涝等,影响粮食单产水平,限制粮食生产潜能[49 ] ;但由于各省份气候、降水量、旱灾和水涝等长时间序列数据的量化存在一定难度,因此选择与其密切相关的农业生产结构、粮食总产量和自然灾害3个变量作为替代变量.变量指标描述和选择依据详见表1 . ...
地理区位、交通基础设施与种植业结构调整研究
1
2006
... 解释变量 X i [47 ] ,而粮食生产地理区位的比较优势取决于气候和耕地资源等自然条件[48 ] ,自然灾害则多源于不可预测的旱灾和水涝等,影响粮食单产水平,限制粮食生产潜能[49 ] ;但由于各省份气候、降水量、旱灾和水涝等长时间序列数据的量化存在一定难度,因此选择与其密切相关的农业生产结构、粮食总产量和自然灾害3个变量作为替代变量.变量指标描述和选择依据详见表1 . ...
中国农业地域分异与现代农业区划方案
1
2018
... 解释变量 X i [47 ] ,而粮食生产地理区位的比较优势取决于气候和耕地资源等自然条件[48 ] ,自然灾害则多源于不可预测的旱灾和水涝等,影响粮食单产水平,限制粮食生产潜能[49 ] ;但由于各省份气候、降水量、旱灾和水涝等长时间序列数据的量化存在一定难度,因此选择与其密切相关的农业生产结构、粮食总产量和自然灾害3个变量作为替代变量.变量指标描述和选择依据详见表1 . ...
中国农业地域分异与现代农业区划方案
1
2018
... 解释变量 X i [47 ] ,而粮食生产地理区位的比较优势取决于气候和耕地资源等自然条件[48 ] ,自然灾害则多源于不可预测的旱灾和水涝等,影响粮食单产水平,限制粮食生产潜能[49 ] ;但由于各省份气候、降水量、旱灾和水涝等长时间序列数据的量化存在一定难度,因此选择与其密切相关的农业生产结构、粮食总产量和自然灾害3个变量作为替代变量.变量指标描述和选择依据详见表1 . ...
水平衡下黄淮海平原区耕地可持续生产能力测算
1
2018
... 解释变量 X i [47 ] ,而粮食生产地理区位的比较优势取决于气候和耕地资源等自然条件[48 ] ,自然灾害则多源于不可预测的旱灾和水涝等,影响粮食单产水平,限制粮食生产潜能[49 ] ;但由于各省份气候、降水量、旱灾和水涝等长时间序列数据的量化存在一定难度,因此选择与其密切相关的农业生产结构、粮食总产量和自然灾害3个变量作为替代变量.变量指标描述和选择依据详见表1 . ...
水平衡下黄淮海平原区耕地可持续生产能力测算
1
2018
... 解释变量 X i [47 ] ,而粮食生产地理区位的比较优势取决于气候和耕地资源等自然条件[48 ] ,自然灾害则多源于不可预测的旱灾和水涝等,影响粮食单产水平,限制粮食生产潜能[49 ] ;但由于各省份气候、降水量、旱灾和水涝等长时间序列数据的量化存在一定难度,因此选择与其密切相关的农业生产结构、粮食总产量和自然灾害3个变量作为替代变量.变量指标描述和选择依据详见表1 . ...
农民角色分化与农业补贴政策的收入分配效应: 江苏省农业税减免、粮食直补收入分配效应的实证研究
1
2008
... 1997—2020年中国粮食生产年均碳排放总量由36978.35万t增长至49478.19万t,增长了33.80%,年均增长率1.30%,说明中国粮食生产碳排放整体趋于增长(图2a ).从阶段性演进来看,以2003年和2015年为分界点,粮食生产碳排放总量呈“减—增—减”波动,增长率分别为-0.02%、28.86%和-2.38%,这在某种意义上也暗示了样本研究期内中国粮食生产在2017年即实现了“碳达峰”(51753.69万t).究其原因:① 中国早期的粮食生产主要依赖既有耕地资源,化肥和农药等物资资料投入低,粮食产量低但保留了较好的农业环境.② 为了激励粮食生产,中国相继取消了农业税并推行粮食种植补贴政策,这提高了土地价格并增加了地租[50 ] ,通过改变农户种植行为和投资决策行为促使农民粮食生产积极性高涨,而由此引发的农业生产资料价格上涨会通过政府政策调节和粮价上涨等方式稳定粮食生产积极性[51 ] ,已有研究也表明亩均补贴提高1%将导致粮食产量提高0.056%[52 ] ,从中国粮食生产多年连丰的现实来看,粮食增产主要是靠农用物资资料投入,这也诱致了粮食生产领域碳排放的增长.③ 在经历粮食高投入、高产出和高污染后,“十三五”时期中国高度重视农业绿色发展,尤其是耕地流转形成的适度规模经营,使得农用物资质量和使用效率不断提升,粮食集约化生产水平显著提高,粮食生产碳排放量开始呈下降态势. ...
农业补贴改革对粮食适度规模经营的影响
1
2021
... 1997—2020年中国粮食生产年均碳排放总量由36978.35万t增长至49478.19万t,增长了33.80%,年均增长率1.30%,说明中国粮食生产碳排放整体趋于增长(图2a ).从阶段性演进来看,以2003年和2015年为分界点,粮食生产碳排放总量呈“减—增—减”波动,增长率分别为-0.02%、28.86%和-2.38%,这在某种意义上也暗示了样本研究期内中国粮食生产在2017年即实现了“碳达峰”(51753.69万t).究其原因:① 中国早期的粮食生产主要依赖既有耕地资源,化肥和农药等物资资料投入低,粮食产量低但保留了较好的农业环境.② 为了激励粮食生产,中国相继取消了农业税并推行粮食种植补贴政策,这提高了土地价格并增加了地租[50 ] ,通过改变农户种植行为和投资决策行为促使农民粮食生产积极性高涨,而由此引发的农业生产资料价格上涨会通过政府政策调节和粮价上涨等方式稳定粮食生产积极性[51 ] ,已有研究也表明亩均补贴提高1%将导致粮食产量提高0.056%[52 ] ,从中国粮食生产多年连丰的现实来看,粮食增产主要是靠农用物资资料投入,这也诱致了粮食生产领域碳排放的增长.③ 在经历粮食高投入、高产出和高污染后,“十三五”时期中国高度重视农业绿色发展,尤其是耕地流转形成的适度规模经营,使得农用物资质量和使用效率不断提升,粮食集约化生产水平显著提高,粮食生产碳排放量开始呈下降态势. ...
粮食补贴政策的作用路径及产量效应实证分析
1
2013
... 1997—2020年中国粮食生产年均碳排放总量由36978.35万t增长至49478.19万t,增长了33.80%,年均增长率1.30%,说明中国粮食生产碳排放整体趋于增长(图2a ).从阶段性演进来看,以2003年和2015年为分界点,粮食生产碳排放总量呈“减—增—减”波动,增长率分别为-0.02%、28.86%和-2.38%,这在某种意义上也暗示了样本研究期内中国粮食生产在2017年即实现了“碳达峰”(51753.69万t).究其原因:① 中国早期的粮食生产主要依赖既有耕地资源,化肥和农药等物资资料投入低,粮食产量低但保留了较好的农业环境.② 为了激励粮食生产,中国相继取消了农业税并推行粮食种植补贴政策,这提高了土地价格并增加了地租[50 ] ,通过改变农户种植行为和投资决策行为促使农民粮食生产积极性高涨,而由此引发的农业生产资料价格上涨会通过政府政策调节和粮价上涨等方式稳定粮食生产积极性[51 ] ,已有研究也表明亩均补贴提高1%将导致粮食产量提高0.056%[52 ] ,从中国粮食生产多年连丰的现实来看,粮食增产主要是靠农用物资资料投入,这也诱致了粮食生产领域碳排放的增长.③ 在经历粮食高投入、高产出和高污染后,“十三五”时期中国高度重视农业绿色发展,尤其是耕地流转形成的适度规模经营,使得农用物资质量和使用效率不断提升,粮食集约化生产水平显著提高,粮食生产碳排放量开始呈下降态势. ...
Agricultural reforms and production in China: Changes in provincial production function and productivity in 1978-2015
1
2018
... 综上可见,“十一五”时期是中国粮食生产碳排放变化的关键节点,源于“十五”时期为了应对国内外复杂环境,中国粮食生产政策发生重大转变.具体地,自2001年加入WTO后粮食生产保护政策减少且取消了配额采购制度[53 ] ,2004年中国农产品贸易由顺差转向逆差,同年开始取消农业税[54 ] ,2005年中央土地政策制定保护18亿亩(1亩≈666.7 m2 )耕地红线[55 ] .此外,从客观事实来看,中国实施的一些与粮食生产密切相关的政策还存在着一定的时滞效应,粮食生产于“十五”中期开始由大滑坡转为“连丰”,进而导致“十一五”时期前后粮食生产碳排放的驱动效应出现差异. ...
Total factor productivity growth in China's agricultural sector
1
2008
... 综上可见,“十一五”时期是中国粮食生产碳排放变化的关键节点,源于“十五”时期为了应对国内外复杂环境,中国粮食生产政策发生重大转变.具体地,自2001年加入WTO后粮食生产保护政策减少且取消了配额采购制度[53 ] ,2004年中国农产品贸易由顺差转向逆差,同年开始取消农业税[54 ] ,2005年中央土地政策制定保护18亿亩(1亩≈666.7 m2 )耕地红线[55 ] .此外,从客观事实来看,中国实施的一些与粮食生产密切相关的政策还存在着一定的时滞效应,粮食生产于“十五”中期开始由大滑坡转为“连丰”,进而导致“十一五”时期前后粮食生产碳排放的驱动效应出现差异. ...
Local farmland loss and preservation in China: A perspective of quota territorialization
1
2015
... 综上可见,“十一五”时期是中国粮食生产碳排放变化的关键节点,源于“十五”时期为了应对国内外复杂环境,中国粮食生产政策发生重大转变.具体地,自2001年加入WTO后粮食生产保护政策减少且取消了配额采购制度[53 ] ,2004年中国农产品贸易由顺差转向逆差,同年开始取消农业税[54 ] ,2005年中央土地政策制定保护18亿亩(1亩≈666.7 m2 )耕地红线[55 ] .此外,从客观事实来看,中国实施的一些与粮食生产密切相关的政策还存在着一定的时滞效应,粮食生产于“十五”中期开始由大滑坡转为“连丰”,进而导致“十一五”时期前后粮食生产碳排放的驱动效应出现差异. ...
Consolidation of agricultural land can contribute to agricultural sustainability in China
1
2021
... 基于研究发现制定粮食生产绿色转型行动尤为关键,对此提出几点政策启示如下:① 摒弃“一炮轰”的粗放式碳减排管理,有效延续“十三五”时期粮食生产的降碳趋势.具体地,对于主产区、产销平衡区以及长江中下游地区和华北地区,尤其是山东、河南等粮食生产大省以及内蒙古、黑龙江等增碳大省,改变过度依赖物资资料投入的传统粮食生产模式,选择清洁化的秸秆还田方式,促使粮食生产转向降碳阶段.同时,有效发挥农户在粮食生产绿色转型中的主体作用有效解决规模化生产难题[4 ] ,加强化肥、农药等污染源头管理,解决粮食增产与降碳之间的矛盾.② 汲取“十三五”时期粮食生产碳排放空间差距增长的经验,如北京、上海和浙江等地在粮食生产领域已形成降碳之势,但这些地区粮食增产空间有限且多为经济发达地区,劣势省份需在考虑经济社会发展差异的前提下将优势地区的降碳策略本土化;如山东和河南等粮食生产大省通过引进绿色生产技术实现降碳与粮食增产的双赢局面,通过降低这些高值区碳排放能有效形成区域间和省际间优势互补、良性互动格局,避免因粮食生产功能区划分引发“碳泄漏”效应.③ 基于现实碳减排驱动力因地制宜制定粮食总体和区域性碳减排方案.总体上,既有耕地资源一定的情况下,提升落后地区粮食生产的机械化水平,避免耕地撂荒、细碎化或小规模经营导致的增碳,合理引导农户开展耕地流转并协调好城乡要素资源的自由流动等方式[56 ] ,加强粮食适度规模经营以实现本地和邻地双向碳减排目标.同时,充分利用在阶段演变过程中对于粮食生产碳减排具有稳定性的农业总产值、农村总人口和粮食总产量等因素,夯实技术进步的碳减排驱动力.区域共性方面发挥农业结构调整对空间关联地区的碳减排效应,充分发挥主产区粮食生产潜能对绿色生产技术的敏感性,欠发达省份通过政府、企业等平台引进实用性绿色专利,提升绿色技术利用率;以村集体为单位引导产销平衡区农户关注气候和降水等自然灾害,及时传达灾害预防的信息,缩减灾害发生频率;而主销区粮食生产压力大于其降碳压力,采用现代化土壤管理技术,改善耕地肥力,扩大化肥、农药等物资资料投入吸收率以实现粮食增产. ...


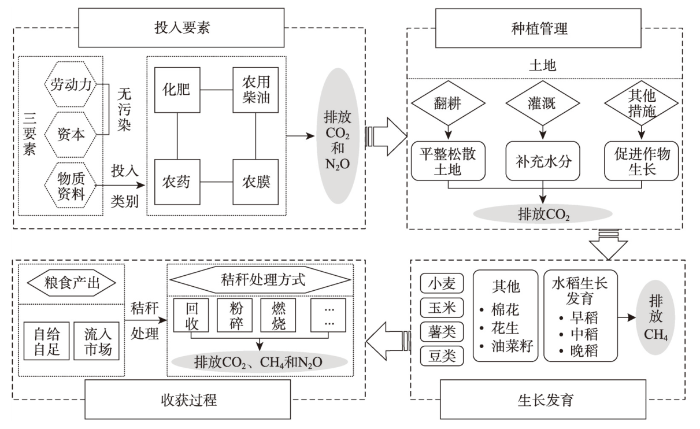
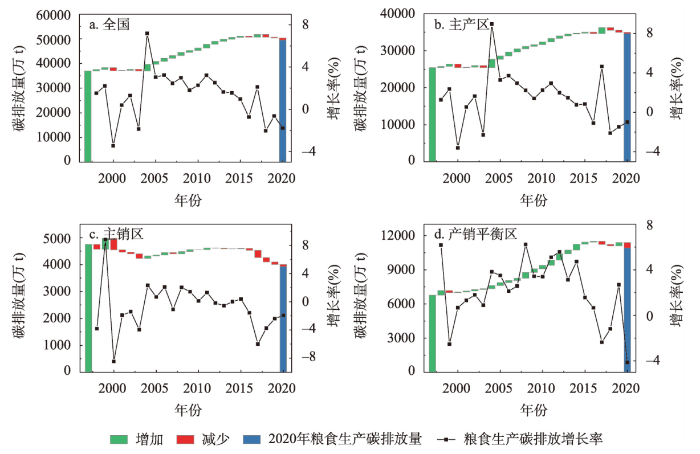
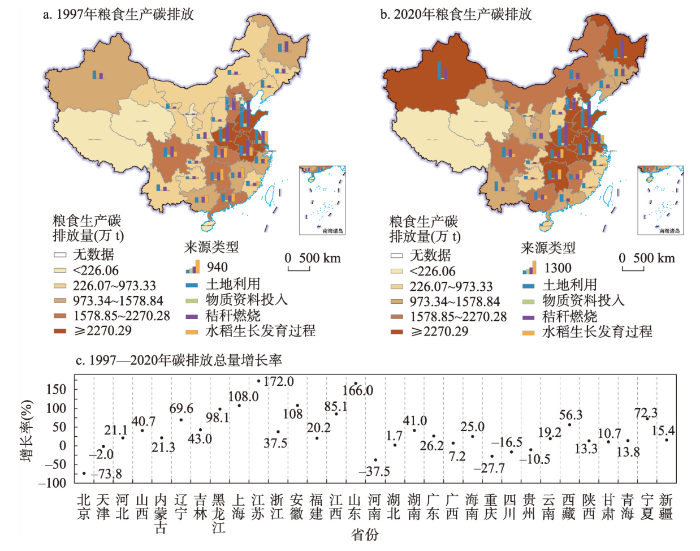

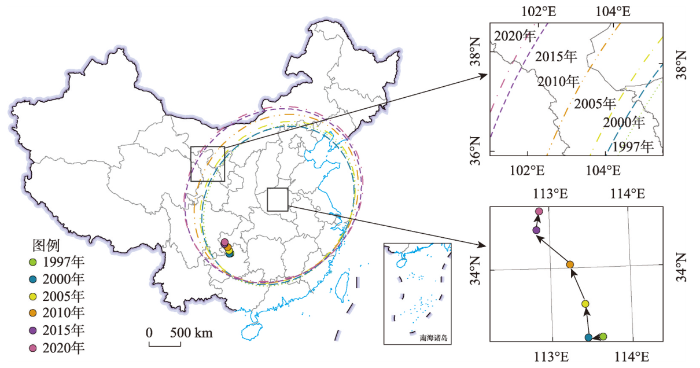
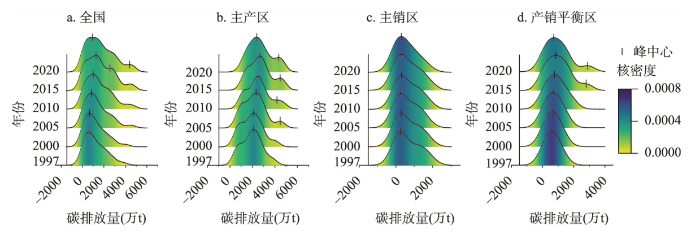
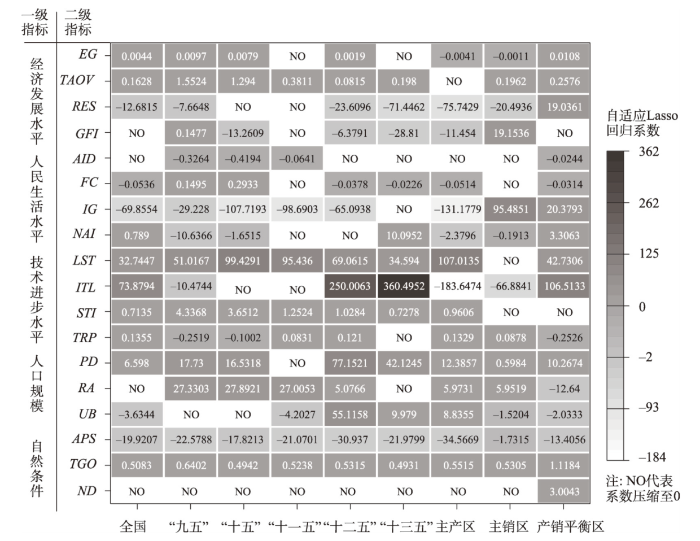

