
1 引言
中国的城市化正处于快速发展阶段,当前也是城市化转型发展的关键时期[1]。中国城市化的区域分异日益为全社会所关注。研究区域城市化发展的空间关系,分析城市化空间极化及扩散的演化规律,对区域城市及城市群的发展规划具有重要的现实指导意义。
在城市化过程中,区域内的城市往往表现出一定的空间极化和扩散现象。空间极化指的是各种经济和社会要素在空间上的分化与集聚,通过资源配置在一定地理区域中形成增长中心的过程,它是一种动态演化,也是区域发展的重要推动力[2]。通常所说的某城市“吸血”或“首位度”即指该城市在一定区域内出现了不同程度的极化现象。而空间扩散则是指区域范围内通过空间的交互作用推动区域协调或同步发展的过程。空间极化与空间扩散是城市化过程中出现的两个截然不同的现象,两者相互作用,共同促进或制约着区域城市发展。
城市化空间关联作用明显,空间极化或扩散现象在全球范围内被广泛关注。无论是发达国家(如美国、德国),还是发展中国家(如俄罗斯等)均存在城市化过程中的极化现象[3,4,5]。有学者发现世界经济在1960—1999年变得更加两极分化,且加入世界贸易组织(World Trade Organization, WTO)后并不能缩小各成员国之间的差异和极化水平[6];另有学者认为不同的城市化水平具有显著的空间依赖性[7,8];还有研究认为高度集中的城市化可能阻碍了区域可持续发展[9]。国外很多研究从城市网络和流动空间理论开展城市网络研究,但是区域城市及城市化过程中的空间关联和相互作用远非简单通过城市网络就能测度[10,11]。中国城市化与经济发展水平之间的省级规模存在显著的区域差异,极化现象在区域上非常明显[12],城市群、城市湾区等的不断扩张也显示出区域城市化对区域发展的引导作用[13,14]。国内学者的相关研究主要表现在两个方面:① 承接国外学者有关城市网络的影响研究,从多尺度(区域城市、城市群、单体城市、城市内部空间等)到多领域(人口、资本、交通、科技流等)均有涉及,尝试从城市网络、中心城市及影响力的角度开展城市空间关联分析[11, 15-18]。虽然网络研究可以通过矢量的点与线来表达各城市化要素的流动性,但很难表达出城市作为面空间的土地城市化。② 针对人口等单一指标开展城市空间相关作用的研究,但当前很少有研究在时空双重维度下,将人口、经济、土地等多项指标,即将空间极化与扩散结合起来系统分析和衡量区域城市的空间关联特征。而区域城市间关系密切,空间关联也不仅体现在单一城市化要素的空间极化上,且空间关联特征伴随时间会不断演化[19]。
本文基于经济、人口、土地空间数据,构建了城市化空间发展指数度量区域城市化下各城市发展规模等级和空间联结强度,并引入空间自相关分析和极化指数,量化长三角地区空间发展的差异性,然后综合城市化空间增长指数,系统分析城市总体发展的空间极化或扩散情况。本文还进一步结合产业升级和产业转移等探讨区域城市空间演化的内在机制。
2 研究区概况及数据来源
2.1 研究区概况
图1

2.2 研究数据及预处理
本文采用长三角地区市级的GDP、户籍人口和城市建成区面积作为衡量长三角地区经济城市化、人口城市化和空间城市化的指标。研究时长为1995—2015年,本文主要以5年为间隔进行时间断面数据分析。所用数据来源于《上海市统计年鉴》(1995—2015年)、《江苏省统计年鉴》(1995—2015年)、《浙江省统计年鉴》(1995—2015年)、《安徽省统计年鉴》(1995—2015年)和《中国城市统计年鉴》(1995—2015年),及国家科技基础条件平台—国家地球系统科学数据共享服务平台的长江三角洲科学数据中心(http://nnu.geodata.cn:8008)。研究期间部分城市数据受行政区划调整或变更影响而缺失,例如2000年安徽省原阜阳市一分为二,成立一个新的省辖市毫州市。针对这类情况,为确保数据的连续性,本文将各市拆分为最小的行政单元,以最小行政单元1995—2015年的数据合并至2015年最新划分的地级市范围。
城市空间关联用综合距离度量,参考地理学第一定律选3个具体指标:直线距离、公路距离和高铁距离。其数据来源和预处理分别如下:直线距离由两地政府驻地的经纬度坐标计算得出,两地之间的公路距离来源于百度地图中两地间用时最短的公路路线长度,两地间的高铁距离数据来源于中国铁路总公司。
3 城市空间关联及演化量化方法
3.1 城市综合发展指数和空间距离关联性
式中:pi表示i城市的总户籍人口;li表示i城市的建成区面积;ei表示i城市的国民经济生产总值;φ1、φ2、φ3为权重指数;rzx表示直线距离;rgl表示公路距离;rgt表示高铁距离;Rij表示i城市和j城市综合距离。UDi越大代表该城市的综合城市化实力水平越强,而UCIij越大表示i、j两城市的空间距离关联性越强。
3.2 城市空间分异性和空间关系
本文采用局部自相关分析中的Moran's I指数、LISA(Local Indicators of Spatial Association)集聚与极化指数相配合来衡量长三角地区空间发展水平的差异及空间关系。局部自相关分析与极化指数二者具有互补性,可测度并指明不同城市发展水平在空间上集聚或分散的变化状况。极化指数可以量化出区域发展的两极分化程度,但其不具指向性,即无法观测出空间上具体的极化区域,而借助LISA集聚图可以观察区域的扩散效应和极化特征。
(1)空间分异性测度。首先采用简单的二进制邻接矩阵来表示n个位置的空间邻近关系;然后用二进制邻接矩阵来确定空间权重矩阵,规定当区域内i与j邻近时用1表示,反之用0表示;最后,通过局部Moran's I指数检测空间分异特征。局部Moran指数Ii被定义为:
式中:Ii检验的标准化统计量为:
式中:
(2)空间极化水平测度。崔王指数(Tsui-Wang index, TW)是在Wolfson指数的基础上,利用“两极分化”和“扩散增加”的两个部分排序公理概括而得,其值越大表示区域空间极化现象越严重[23]。其表达式为:
式中:N为研究区总人口数;θ为i地理区域的人口:k为地理区域的个数;πi为i地理区域的人口数;yi为i地理区域的人均GDP;m为所有i地理区域人均GDP的中间值;θ、r位于0~1之间,本文取θ = 1,r = 0.5。TW指数的值域范围处于0(无极化)和1(完全两极分化)之间。
3.3 空间阶段化发展演变的度量
在城市化进程中,人口、建成区面积、城市产业等因素都对其产生了重要影响。本文从城市间相对发展速率的差异性出发构建城市化空间增长指数(Urbanization Speed, US)。US能在一定程度上反映出城市整体的发展状况:
式中:α1、α2、α3为权重指数;Pi为人口规模发展速度;Li为城市用地规模速度;Ei为城市经济发展速度。
人口规模发展速度(Pi)用Logistic方程表示:
式中:Pi为区域人口数量;P0代表初始时区域人口数量;r表示区域人口增长条件中的限制因子所能推动的区域最大相对增长速度;K表示区域人口增长条件中的限制因子所能推动的区域最高的人口数量,即Pmax = K。
城市用地规模速度(Li)与城市经济发展速度(Ei)分别为:
式中:qn和q0分别为研究时段末年和初始年份的城市建成区面积;en和e0分别为研究时段末年和初始年份的城市国民生产总值;n为研究时长。
4 城市化空间关联特征及演化分析
4.1 城市等级和空间关联特征
城市综合空间发展指数(UD)和空间关联强度指数(UCI)可在时空尺度上反映出区域内城市的相对综合实力和区域内部的发展变化差异。本文运用自然间断对城市UD、UCI进行分类表达。总体来看,长三角地区各省的实力格局没有明显变化。在省级层面上,上海市的UD值逐渐减小,从1995年的0.15降低到2015年的0.12;江苏省呈现先降后增的态势,从1995年的0.38降低到2000年的0.36,后又逐渐升高至0.41;而浙江和安徽省的UD值在1995年至2005年间保持平稳,无明显变化(图2)。在城市尺度上,1995-2015年城市发展的等级结构在空间分布上呈现出5个等级(图3)。其中,上海一直处于第一等级;第二等级则由南京和杭州逐渐转变为南京、杭州、苏州;第三等级以宁波、无锡、温州、南通、合肥、徐州6个城市为主;其余城市处于第四或第五等级。
图2
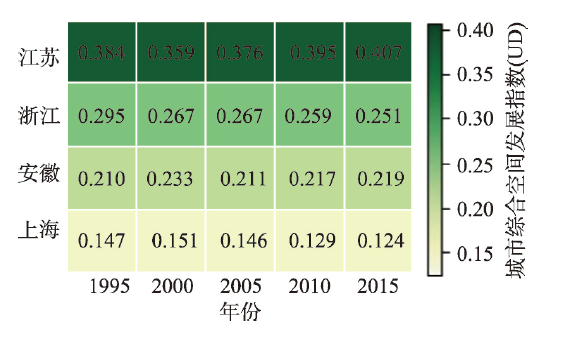
图2
长三角地区各省的城市综合空间发展指数(UD)值
Fig. 2
Urbanization comprehensive development (UD) values of major cities in the Yangtze River Delta region
图3
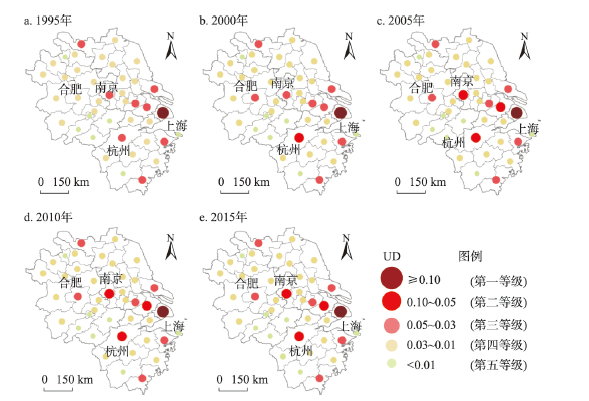
图3
1995—2015年长三角地区城市等级规模结构图
Fig. 3
City level structure map of the Yangtze River Delta region from 1995 to 2015
通过对5期UD值排序发现,持续处于前10的城市是构成区域城市化发展的主要城市(表1)。从这10个城市的所属省份占比情况看,江苏省、浙江省、安徽省分别占50%、30%、10%。这10个城市的UD值在时间上也存在变化,但主要反映在排名的变动上(表1、图3)。其中,上海的排名一直保持在区域内的第1位,但其UD值在不断减小,从1995年的0.147降低至2015年的0.124。南京、杭州、苏州的排名也一直稳定地处于第2到4位,且其UD值在不断增大。其余城市变化最为明显的是温州和合肥,合肥由1995年的第10位(0.029)提升至2015年的第5位(0.042),而温州则从2000年的第5位(0.041)逐渐下降至2015年第10位(0.034)。这种变动从一个侧面说明了城市化发展活力和速率的变化情况。
表1 长三角地区主要城市的综合空间发展指数(UD)值
Tab. 1
| 主要城市* | 1995年UD值 | 2000年UD值 | 2005年UD值 | 2010年UD值 | 2015年UD值 |
|---|---|---|---|---|---|
| 上海市 | 0.147 | 0.151 | 0.146 | 0.129 | 0.124 |
| 南京市 | 0.049 | 0.049 | 0.061 | 0.059 | 0.059 |
| 苏州市 | 0.047 | 0.043 | 0.053 | 0.058 | 0.058 |
| 杭州市 | 0.045 | 0.054 | 0.057 | 0.056 | 0.054 |
| 合肥市 | 0.029 | 0.033 | 0.036 | 0.041 | 0.042 |
| 宁波市 | 0.037 | 0.036 | 0.037 | 0.043 | 0.040 |
| 徐州市 | 0.040 | 0.036 | 0.034 | 0.041 | 0.039 |
| 无锡市 | 0.040 | 0.038 | 0.042 | 0.040 | 0.039 |
| 南通市 | 0.038 | 0.033 | 0.031 | 0.032 | 0.035 |
| 温州市 | 0.038 | 0.041 | 0.037 | 0.034 | 0.034 |
注:*主要城市是指在研究时段内的UD持续排名前10位的城市。
长三角地区城市化的距离关联强度也呈现出明显的空间分布特征,UCI高值等级集中在东部(图4)。其中以上海、苏州、无锡、常州为城市化发展的强联系带,苏州和无锡的城市化发展呈现“双子星”结构,存在着极强的空间联系,这些城市之间的联系处于第一和第二等级。南京和杭州构成以各自为核心的城市化发展局域联系网络,其中杭州和绍兴的关联强度最高,其次是上海和嘉兴;而南京与扬州和镇江构成较强的空间联系。整体上,上海、苏州、南京、杭州等市构成长三角地区最为密集的城市化发展的空间联结网络,说明了长三角地区的发展存在明显的空间集聚联结特征。UCI在展示出研究区各城市空间关联强弱的同时,也暗含着各自的影响或被影响的范围及程度。从这个视角来看,UCI图在一定程度上代表了区域城市空间相互关联和影响的网络。
图4

图4
长三角地区城市化空间关联强度(UCI)图
Fig. 4
Spatial correlation intensity map of urbanization in the Yangtze River Delta region
4.2 城市化空间特征及演化过程
4.2.1 城市化空间分异和等级特征 本文运用局部Moran's I方法得出1995—2015年5个等分时段长三角区域的Moran's I散点图和LISA图。图5显示,长三角地区各年份的人均GDP都呈现空间显著正相关,说明了长三角地区的经济发展存在着空间上的高度集聚特征,即在人均GDP高的地区,其周边区域的人均GDP也高,但这种特征在时间序列上呈减弱趋势:长三角区域内的低—低(L-L)区由1995年的9个逐渐减少至2015年的6个;而高—高(H-H)区由最初的6个增加至7个。
图5
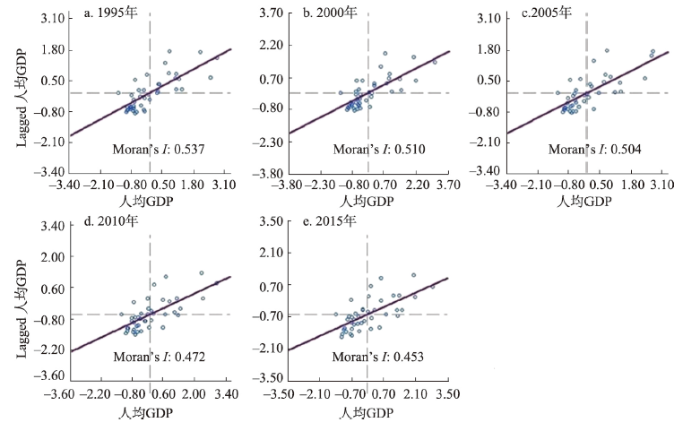
图5
1995—2015年长三角地区的Moran's I散点图
Fig. 5
Moran's I scatter plot in the Yangtze River Delta region from 1995 to 2015
从LISA集聚图(图6)可以看出,长三角地区的西北部为L-L集聚区,这些城市的人均GDP相对与整个长三角地区较低,且呈低值关联;H-H区主要集中在上海周边城市,且这些城市高值关联。H-L区是显著极化区域,主要分布在L-L区周围,且高—低(H-L)区绝大部分是由曾经的L-L区转换而来。L-H区是沉降(可以理解为被辐射)区域,主要分布在H-H区周围,存在L-H区逐渐转换为H-H区的现象。从时间上看,L-L区在不断减少,曾经是L-L区的合肥市逐渐转化为H-L区,成为了安徽省的核心增长城市。而H-H区不断增多,以上海市为中心不断向周边地区增长:比如泰州市逐渐由空间上的低—高(L-H)区转变成不显著区,最后成为H-H区,说明其受到了H-H区城市群的辐射影响。
图6
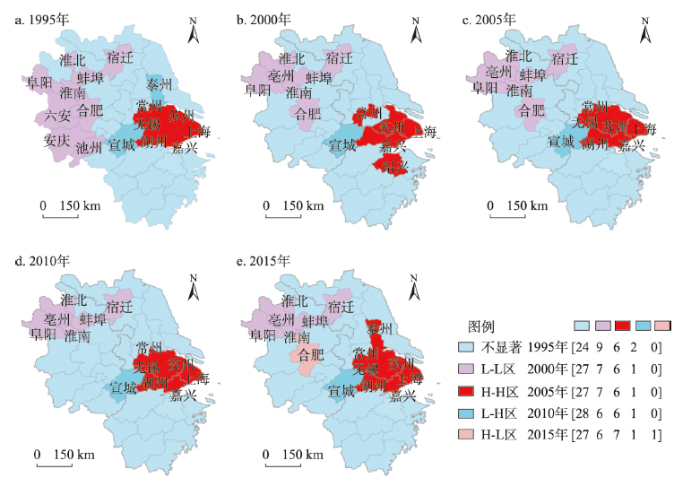
图6
1995—2015年长三角区域LISA集聚图
Fig. 6
LISA agglomeration map of the Yangtze River Delta region from 1995 to 2015
总体上,长三角地区经济发展处于中间段位的城市在迅速增多,从Moran's I指数变化和局部自相关的显著性水平上看,L-L区个数占总数的比例由1995年的52.9%下降至2015年的40.0%,而H-H区的个数比例则由1995年的35.3%上升至2015年的46.7%。说明了长三角地区城市间空间极化程度在降低,朝着空间均衡的方向发展。Moran's I指数由0.54逐渐降低至0.45也反映出长三角地区城市化差异在整体空间上的缩小态势。
4.2.2 空间极化和扩散关系 从长三角地区各省的TW指数趋势看,1995—2015年江苏省的极化水平呈现出“下降—上升—下降”趋势;安徽省的TW指数在这20年间增长态势明显,数值从1995年的0.45逐渐增至2015年的0.65;浙江省的TW指数在1995—2003年间保持平稳,数值停留在0.5左右,而后逐渐增长,到2015年TW值接近0.6,极化水平在三省中最低。值得注意的是,2005年后三省的极化指数差距均逐渐缩小(图7)。
图7
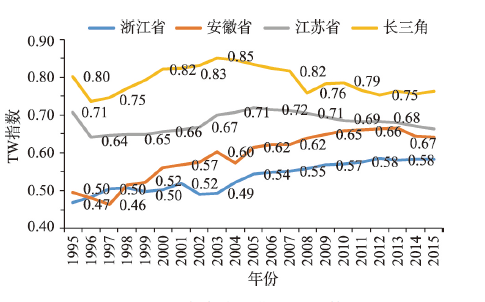
图7
1995—2015年各省极化(TW)指数对比图
Fig. 7
Comparison of Tsui-Wang index (TW) of each province from 1995 to 2015
整体看,区域内部的极化情况较为明显。2003年前后,长三角地区的极化指数达到最高,此后呈降低趋势;2010年之后数值在0.75浮动并趋于平稳。说明长三角地区的城市化空间一体性和联系性日益加强。这种现象是因为经济从沿海沿江城市向内陆地区的层层推进发展。早先上海市在区域内具先发优势,随后部分生产开始向邻近城市布局。苏州、无锡等地由于与上海空间关联度强,最先接受上海市的产业辐射。近年来,长三角地区核心增长极由早期的点状演化为条带状且逐渐向内陆延伸,即核心增长区的辐射作用触及到内陆地区。将长三角地区的TW和Moran's I进行对比,不难看出二者的趋势几乎一致(图8),都是先增后减。1995—2003年长三角地区极化趋势增强;2003年之后,区内的极化趋势走弱,空间发展渐趋均衡。
图8
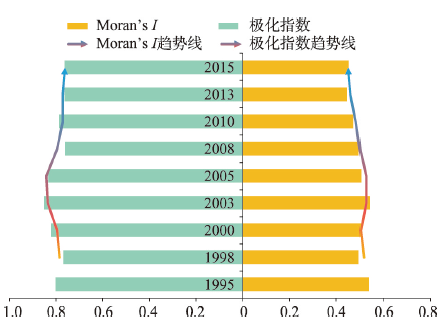
图8
1995—2015年长三角地区极化(TW)指数与Moran's I对比
Fig. 8
Tsui-Wang index (TW) and Moran's I in the Yangtze River Delta region during 1995-2015
4.3 城市化的空间关联特征
各城市发展速率是城市化空间相关作用后的一种结果体现,也是度量区域城市化空间关联的有效工具。长三角地区城市化在空间上大体呈现扩散的特征:高值区由沿海向内陆逐步转移,高值区在空间方向上呈现由东到西,由南到北的变化趋势。1995—2000年城市化空间增长指数(US)的高值区主要分布在江苏北部、杭州、温州以及上海等地;低值区主要分布在安徽中南部和江苏中部;而2010年以后US的高值区则集中分布在安徽及江苏中部和北部;低值区分布在长江以南的大部分地区(图9)。
图9
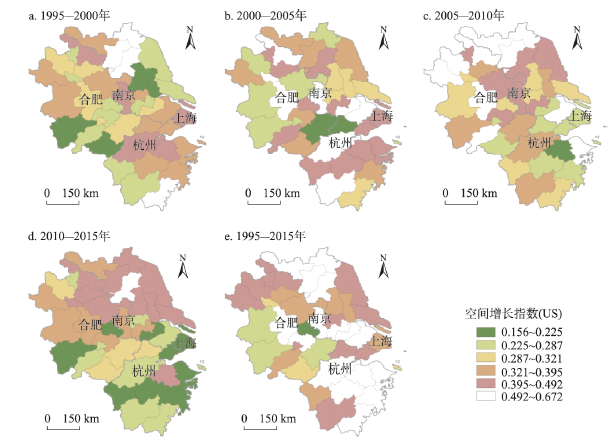
图9
1995—2015年长三角的城市化空间增长指数(US)值
Fig. 9
Urbanization speed (US) values of the Yangtze River Delta region from 1995 to 2015
具体到城市,各城市化发展速率具有明显的阶段特征。合肥市的US值在1995—2010年间增长明显,2010以后合肥的US依然高于周边,说明合肥在安徽省内的极化效应显著,尤其对其周边城市。由于研究时段的局限,这里无法观察出上海对周边极化增强的过程,但能够发现2000年之后上海市的扩散作用十分明显,且这种扩散格局逐渐向内陆递推。杭州、南京、苏州等城市在其城市化发展过程中,均呈现出对周边区域极化先增强后减弱的特征(图9)。
上海、南京、杭州、苏州、合肥是长三角地区5个核心城市,但这5个城市的城市化水平存在明显的差异,但差异在减小。在经济方面:1995—2000年上海、杭州、苏州的经济增速居于前列;2000年以后,合肥、南京的增速又居于前列。人口方面:合肥、杭州、南京及苏州的人口增速一致居于前列。而对城市建成区而言:1995—2000年杭州、上海的建成区面积增速居前;2000年之后上海、苏州、南京、合肥的建成区面积增速居于前列。从综合城市化角度(US)来看,1995—2005年杭州、苏州、合肥的综合城市化发展速度较快;2005—2015年整体速度有所减缓,但南京和合肥增速仍相对较高(图10)。进一步比较发现,在城市化进程中,经济城市化具有先发性,土地城市化与经济增长大体保持一致,而人口城市化则具有一定的滞后性。同时,城市化在空间上存在扩散和递推现象,城市化水平较高的城市带动空间上临近城市的发展。
图10
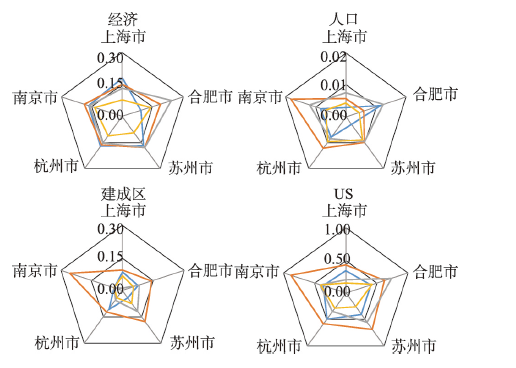
图10
长三角地区核心城市的经济、人口、建成区面积增率与空间增长指数(US)雷达图
Fig. 10
Radar map of economic, population, built-up area growth rate and urbanization speed (US) value of five major cities of the YRD region
5 城市化空间特征及演化的内在机制探讨
长三角地区城市化在空间上的极化或扩散与区域内部的经济活动,特别是与产业升级和转移有着密切的联系。根据韦伯的工业区位论思想,工业活动区位的选择受到交通、人力成本、市场等多重因素的影响,企业会根据自身的定位和盈利不断调整生产经营活动,选择最适的生产地区和市场地[24]。不同类型的产业和企业对各个影响因素的响应不同,会呈现不同的转移次序[25,26,27]。从城市发展的阶段特征可以看出,随着城市化水平的提高,城市内部的产业部门不断升级,在此过程中,相对低端的转型升级难度较大的产业在城区土地和人力成本多重压力下就会逐渐寻求具有比较优势的区位。已有研究揭示出长三角地区的城市要素流动和产业转移已引起了该地区空间结构和产业结构的变动,比如:上海和浙江之间存在的以制造业为中心的产业“雁行形态”,推动了长三角制造业产业重心的迁移[28]。此外,不同城市的工业用地价格对产业扩散规模也具有显著的空间效应。工业用地价格较高的区域,导致高效企业在这些区域落户,而低效率的企业从这些区域扩散[29]。产业转移理论模型也表明中国制造业已经出现由东部向中西部地区的大规模转移,且在转移次序上,按照产业替代弹性的逆序展开。这种情况也表现在本研究区的空间模式上,低替代弹性产业呈现等级扩散模式,高替代弹性产业则呈现了扩散模式[30]。
区域内的产业升级塑造了产业在空间分布上的层次等级或差异性。为阐明产业升级和转移对长三角地区整体发展带来的影响,这里基于第二、三产的产值数据,用三产与GDP的比重减去二产与GDP的比重的差值反映城市的产业结构情况,产业构成差值能反映区域内城市当前的发展阶段(图11)。对比2015年和1995年二三产业差值(简称产业差值)分布特征发现,1995年各市产业差值几乎都分布在0以下,到2015年各市的产业结构发生较大变化,有15个城市的三产比重高于二产。同时,城市的产业层次与差异在拉大。1995年产业差值均值为-0.192,2015年接近于0,反映了区域内的产业升级现象。
图11
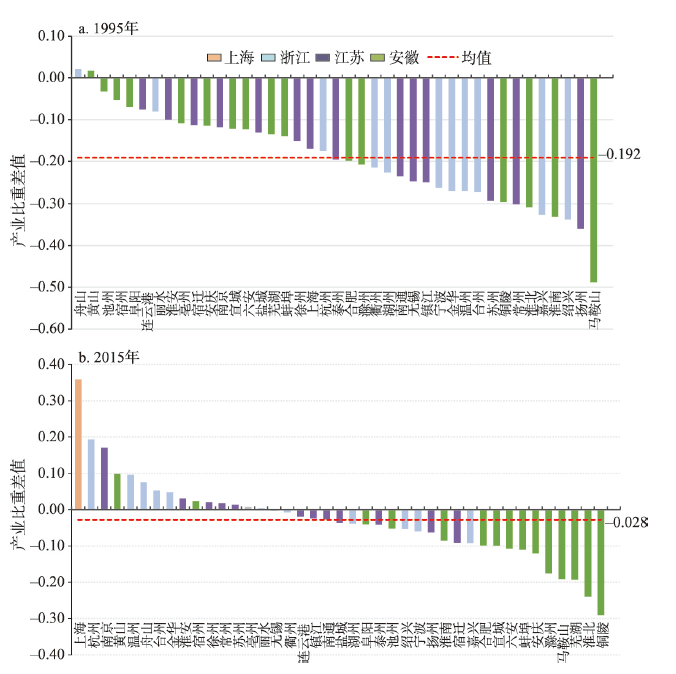
图11
1995年和2015年长三角地区产业构成差异对比
Fig. 11
Comparison of industrial composition differences between 1995 and 2015 in the Yangtze River Delta region
产业升级推动产业在空间上的层次性与差异性,而这又是产业在空间上的转移动力。从区域产业结构的空间变化可以侧面反映产业转移,并揭示城市化特征及其演化的深层原因。如图11所示,1995年各省市产业结构空间上分布较为均匀,总体差异性较小。其中低于均值的城市数量表现为:浙江(8个)>江苏(7个)>安徽(6个);而到2015年,产业结构极大变化,产业总体向上跃迁,且空间上存在梯队性,依次为:浙江、江苏、安徽。需要注意的是,上海大幅度产业跃迁(其排序从19位升至第1位)所带来的影响,由于与周边存在大的产业位差,易于形成产业流动力,推动了产业在区域内的扩散。事实上,产业流动力深刻体现在区域经济发展的过程中,空间增长指数的阶段性变化就是这种动力作用下的反映(图9)。表2统计特征分析显示,二产产值变异系数从1995年的143.41降低到2015年的98.12,三产产值变异系数从162.16降低到145.4;二、三产变异系数的变化幅度分别为-31.58和-10.34,也体现出产业转移动力对空间离散的推动作用。
表2 1995年和2015年长三角城市二、三产业产值指标统计
Tab. 2
| 指标量 | 年份 | 均值 | 标准差 | 变异系数 | Rc(%) |
|---|---|---|---|---|---|
| 第二产业 | 1995 | 165.93 | 237.97 | 143.42 | -31.58 |
| 第二产业 | 2015 | 1775.26 | 1741.10 | 98.13 | |
| 第三产业 | 1995 | 99.47 | 161.30 | 162.16 | -10.34 |
| 第三产业 | 2015 | 2001.46 | 2910.20 | 145.40 |
注:Rc表示变异系数在1995—2015年的变动幅度。
此外,长三角地区城市空间发展格局和演化受到国家宏观政策的影响。上海、宁波等因其在地理位置、经济基础等方面具有优势,成为长三角地区对外经济合作和技术交流的首批沿海开放城市。沿海开放城市的确立逐渐完善了区域经济体系,助推了快速的城市化[34]。此后,长三角地区被开辟为沿海经济开放区,在加快内陆省区对外开放的政策背景下,长三角地区迎来沿海和沿江多层次的发展机遇。南京、杭州、合肥等省会城市在政策推动下相继进入发展的高峰期,逐渐成为所在地区的城市化增长极。由于国家宏观政策的导向性和重点区域发展政策的倾向性[35],势必会在一定时期内加剧部分区域的发展差异;但从长时间尺度来看,城市空间极化与扩散并存的现象、特别是先发地区带动后发地区的扩散和递推现象,将有助于推动区域城市化的全面发展,但是空间极化现象也将持续存在。
6 结论
本文综合经济、人口和土地城市化,研究了城市化空间关联特征及其演化过程。结果表明:1995—2015年间长三角地区城市等级规模分布明显,上海市处于第一等级(0.147~0.124),南京、杭州、苏州处于第二等级(0.045~0.059),其余城市处于三、四、五等级。但从演变趋势可以看出城市间城市化水平的差距在减小。此外,长三角地区城市化的空间联结强度呈现出明显的分布特征,空间关联强度的高值等级集中在长三角东部地区,以上海、苏州、无锡、杭州等10个城市构成长三角地区最为密集的城市化发展空间联系网络。研究时段内,长三角地区城市化整体上经历了从极化增强到极化减弱的动态过程,并逐渐走向均衡发展。同时,长三角地区城市化的空间演化也呈现出极化与扩散并存的特征,且往往是被扩散区域在空间上又快速形成极化,之后极化减弱又转入新的扩散阶段。对其驱动机制分析发现,长三角地区城市化空间特征及其演化过程受区域产业升级与转移的影响,产业升级塑造了产业的空间层次性和差异性,并在此基础上形成区域内的产业空间扩散动力。
中国城市化处在快速发展的过程中,其空间特征和演化规律受区域发展内在机制的影响并将持续发挥作用。而在制定区域发展政策时,要符合地理学规律,同时结合城市自身发展阶段,可以要求区域城市化空间格局的适度协调,但不应过度追求区域内各个城市在同一时期的均衡发展。
参考文献
Transformation strategy and development mode of China's new urbanization
中国新型城镇化转型发展战略与转型发展模式
The evolution of the development space polarization and driving factors in the service industry in Northeast China
From the overall and the partial angles this article values the degree of service industry with added service industry per capita to analyze spatial characteristics of service industry in Northeast China by using the Gene coefficient and Tsui-Wang index. Using the polarization level of added service industry per capita as the dependent variable, and per capita GDP, the added value of the second industry, the actually utilized foreign capital, government expenditure and market development index as the independent variables, this article establishes multiple linear regression model and comprehensively evaluates the driving factors. The results of research are:1) The degree of development of service industry is improved greatly between the year 2000 and 2012 in Northeast China. Difference between them is risen within a narrow range and service industry development pattern is formed with the core in Shenyang, Dalian, Changchun and Harbin. The service industry development is dominated by the geographical location, transportation and resources of these cities. 2) The differences and spatial polarization of service industry development all represent a trend of first increase and then decrease. On the whole, the differences of service industry development are showing the trend of accelerated growth and spatial polarization is showing the trend of diminishing. 3) The role and importance of driving factors is different and per-capita GDP and government finance spending is playing the leading role in the service industry spatial polarization development.
东北三省服务业发展空间极化的演变及驱动因子分析
From the overall and the partial angles this article values the degree of service industry with added service industry per capita to analyze spatial characteristics of service industry in Northeast China by using the Gene coefficient and Tsui-Wang index. Using the polarization level of added service industry per capita as the dependent variable, and per capita GDP, the added value of the second industry, the actually utilized foreign capital, government expenditure and market development index as the independent variables, this article establishes multiple linear regression model and comprehensively evaluates the driving factors. The results of research are:1) The degree of development of service industry is improved greatly between the year 2000 and 2012 in Northeast China. Difference between them is risen within a narrow range and service industry development pattern is formed with the core in Shenyang, Dalian, Changchun and Harbin. The service industry development is dominated by the geographical location, transportation and resources of these cities. 2) The differences and spatial polarization of service industry development all represent a trend of first increase and then decrease. On the whole, the differences of service industry development are showing the trend of accelerated growth and spatial polarization is showing the trend of diminishing. 3) The role and importance of driving factors is different and per-capita GDP and government finance spending is playing the leading role in the service industry spatial polarization development.
The flow of information in a global economy: The role of the American urban system in 1990s
DOI:10.1111/j.1467-8306.1994.tb01730.x URL [本文引用: 1]
Regional inequality and polarization in Russia
DOI:10.1016/S0305-750X(01)00124-3 URL [本文引用: 1]
Deindustrialization and the polarization of household incomes: The example of urban agglomerations in Germany. ERSA Conference Papers
Income polarization and in-equality across countries: An empirical study
DOI:10.1016/S0161-8938(03)00009-7 URL [本文引用: 1]
An extension of a measure of polarization, with an application to the income distribution of five OECD countries
DOI:10.1007/s10888-006-9032-x
URL
[本文引用: 1]

We introduce an extension of the Esteban and Ray [Econometrica, 62:819–851 1994] measure of polarization that can be applied to density functions. As a by-product we also derive the Wolfson [Am. Econ. Rev., 84:353–358 1994] measure as a special case. This derivation has the virtue of casting both measures in the context of a (statistically) unified framework. We study the polarization of the distribution of household income for five OECD countries (LIS database): US, UK, Canada, Germany and Sweden.
Spatio-temporal evolution of population and urbanization in the countries along the Belt and Road 1950-2050
DOI:10.1007/s11442-018-1513-x
URL
[本文引用: 1]
This paper uses data for the period 1950-2050 compiled by the United Nations Population Division together with methods including spatial autocorrelation analysis, hierarchical cluster analysis and the standard deviational ellipse, to analyze the spatio-temporal evolution of population and urbanization in the 75 countries located along the routes of the Silk Road Economic Belt and the 21st-century Maritime Silk Road, to identify future population growth and urbanization hotspots. The results reveal the following: First, in 2015, the majority of Belt and Road countries in Europe, South Asia and Southeast Asia had high population densities, whereas most countries in Central Asia, North Africa and West Asia, as well as Russia and Mongolia, had low population densities; the majority of countries in South Asia, Southeast Asia, Central Asia, West Asia and North Africa had rapid population growth, whereas many countries in Europe had negative population growth; and five Belt and Road countries are in the initial stage of urbanization, 44 countries are in the acceleration stage of urbanization, and 26 are in the terminal stage of urbanization. Second, in the century from 1950 to 2050, the mean center of the study area’s population is consistently located in the border region between India and China. Prior to 2000, the trajectory of the mean center was from northwest to southeast, but from 2000 it is on a southward trajectory, as the population of the study area becomes more concentrated. Future population growth hotspots are predicted to be in South Asia, West Asia and Southeast Asia, and hotspot countries for the period 2015-2030 include India, China, Pakistan and Indonesia, though China will move into negative population growth after 2030. Third, the overall urban population of Belt and Road countries increased from 22% in 1950 to 49% in 2015, and it is expected to gradually catch up with the world average, reaching 64% in 2050. The different levels of urbanization in different countries display significant spatial dependency, and in the hundred-year period under consideration, this dependency increases before eventually weakening. Fourth, between 2015 and 2030, urban population hotspots will include Thailand, China, Laos and Albania, while Kuwait, Cyprus, Qatar and Estonia will be urban “coldspots.” Fifth, there were 293 cities with populations over 1 million located along the Belt and Road in 2015, but that number is expected to increase to 377 by 2030. Of those, 43 will be in China, with many of the others located in India, Indonesia and the eastern Mediterranean.
Challenges of strong concentration in urbanization: The case of Moscow in Russia
DOI:10.1016/j.proeng.2017.07.095 URL [本文引用: 1]
Measuring centrality and power recursively in the World City Network: A reply to Neal
DOI:10.1177/0042098012466599 URL [本文引用: 1]
Characteristics and formation mechanism of China's provincial urbanization spatial correlation based on population flow
DOI:10.11821/dlxb201904003
URL
[本文引用: 3]
Spatial correlation is the link of regional interaction and influence; the urbanization spatial correlation is spatial relationship of urbanization based on population flow, which influences and continuously adjusts the regional economic and social development pattern in China. By analyzing the change of the spatial correlation intensity and the spatial correlation network of provincial urbanization in China during 1990-2015, this paper reveals the spatial correlation characteristics, formation process and influencing factors of China's provincial urbanization since China's reform and opening up. The results show that: (1) 7 types of spatial correlation intensity are identified in the evolution of provincial urbanization of China, among which the dominant type has the highest degree of coincidence with the whole country, and determines the evolution process of the spatial correlation intensity of urbanization in China. The non-dominant types of urbanization spatial correlation intensity evolution feature 2005 as the critical year, and their growth was slow or even negative before the year; then together with the dominant type, they have promoted a continuous increase in the urbanization spatial correlation intensity across the country. (2) Urbanization spatial correlation network structure characteristics are analyzed from national, regional and provincial scales. The structure of the spatial correlation network of urbanization is becoming more and more complicated, and the correlation paths have shifted from centralized to scattered. The differences in the correlation density between regional subgroups with different attributes have begun to shrink, and the high-level nodes have spread from the eastern to the central and western regions. (3) Further, the panel-vector auto-regression and panel quantile regression are used to test the interaction mechanism between urbanization spatial correlation intensity and correlation network centrality, which explains the effect of residents' income level and regional industrial structure on urbanization spatial correlation characteristics. The specialization of urbanization spatial correlation not only deepens the research on urbanization theory and methodology, but also provides a theoretical basis for the development of population urbanization and the adjustment of industrial space in China.
基于人口流的中国省域城镇化空间关联特征及形成机制
DOI:10.11821/dlxb201904003
URL
[本文引用: 3]
Spatial correlation is the link of regional interaction and influence; the urbanization spatial correlation is spatial relationship of urbanization based on population flow, which influences and continuously adjusts the regional economic and social development pattern in China. By analyzing the change of the spatial correlation intensity and the spatial correlation network of provincial urbanization in China during 1990-2015, this paper reveals the spatial correlation characteristics, formation process and influencing factors of China's provincial urbanization since China's reform and opening up. The results show that: (1) 7 types of spatial correlation intensity are identified in the evolution of provincial urbanization of China, among which the dominant type has the highest degree of coincidence with the whole country, and determines the evolution process of the spatial correlation intensity of urbanization in China. The non-dominant types of urbanization spatial correlation intensity evolution feature 2005 as the critical year, and their growth was slow or even negative before the year; then together with the dominant type, they have promoted a continuous increase in the urbanization spatial correlation intensity across the country. (2) Urbanization spatial correlation network structure characteristics are analyzed from national, regional and provincial scales. The structure of the spatial correlation network of urbanization is becoming more and more complicated, and the correlation paths have shifted from centralized to scattered. The differences in the correlation density between regional subgroups with different attributes have begun to shrink, and the high-level nodes have spread from the eastern to the central and western regions. (3) Further, the panel-vector auto-regression and panel quantile regression are used to test the interaction mechanism between urbanization spatial correlation intensity and correlation network centrality, which explains the effect of residents' income level and regional industrial structure on urbanization spatial correlation characteristics. The specialization of urbanization spatial correlation not only deepens the research on urbanization theory and methodology, but also provides a theoretical basis for the development of population urbanization and the adjustment of industrial space in China.
The provincial pattern of the relationship between urbanization and economic development in China
DOI:10.1007/s11442-014-1071-9
URL
[本文引用: 1]
Understanding the relationship between China's urbanization and economic development on a provincial scale is of profound theoretical and practical significance. Based on data from 124 countries or regions throughout the world and 31 provinces or autonomous regions in China, applying improved methods using the quadrant map approach, this paper analyzed the spatial pattern of the relationship between China's urbanization and economic development level. The study identified the following results. (1) The 31 province-level regions fall into six categories: only one region is in the category of sharp over-urbanization, 3 regions are in medium over-urbanization, 11 slight over-urbanization, 8 basic coordination, one medium under-urbanization, and seven slight under-urbanization. (2) There are significant regional differences on a provincial scale in the relationships between urbanization and the level of economic development. (3) The provincial pattern of urbanization and economic development is significantly different between east and west. The eastern coastal areas are mainly over-urbanized, while the central and western regions are mainly under-urbanized. (4) The relationship between urbanization and the level of economic development is similar to the Matthew effect. Hence, two important insights are proposed. First, the phenomenon of over-urbanization in some developed regions should be viewed with some concern and vigilance. Second, urbanization needs to be speeded up moderately in the central and western regions.
Analysis on the process and spatial evolution of economic polarization in the Yangtze River Delta
DOI:10.11820/dlkxjz.2012.12.012
URL
[本文引用: 1]
Based on the studies on economic polarization previously done by others, the ER index and TW index are used to measure the trend of economic polarization in the Yangtze River Delta from 1990 to 2010, and the overall process of economic polarization during the period of the study is analyzed. Then, from the perspective of polarization effect and diffusion effect, the processes of economic polarization in the Yangtze River Delta in four typical turning-point years (1997, 2001, 2006 and 2010) are analyzed, and the ways of economic spatial evolution are preliminarily summarized. The study concludes that: (1) the dynamic process of polarization indexes’evolution indicates that the economic polarization level of the Yangtze River Delta displays a rising trend from 1990 to 2010 with fluctuations, and the conclusion on economic polarization has been supported by the observations confirming the definition of the concept itself:“disappearing middle class”. (2) As far as the two effects of the polarization theory are concerned, the polarization effect of the Yangtze River Delta first expands, and then shrinks during the period of the study, whereas the diffusion effect gradually increases throughout the time period. (3) As more and more industrial enterprises are being relocated or transformed, the trend of economic polarization in the whole region begins to be attenuated and economies gradually expand to the periphery areas, hence in recent 10 years the economies of Yangtze River Delta show a transition from“arrow”type to“Z” type to“M”type to“区”type (a Chinese character meaning“zone”). Eventually the spatial pattern of the region ’s economies will be transformed into a network type, driven by the diffusion effects of the development of infrastructure beams.
长三角地区经济极化过程与空间演变分析
DOI:10.11820/dlkxjz.2012.12.012
URL
[本文引用: 1]
Based on the studies on economic polarization previously done by others, the ER index and TW index are used to measure the trend of economic polarization in the Yangtze River Delta from 1990 to 2010, and the overall process of economic polarization during the period of the study is analyzed. Then, from the perspective of polarization effect and diffusion effect, the processes of economic polarization in the Yangtze River Delta in four typical turning-point years (1997, 2001, 2006 and 2010) are analyzed, and the ways of economic spatial evolution are preliminarily summarized. The study concludes that: (1) the dynamic process of polarization indexes’evolution indicates that the economic polarization level of the Yangtze River Delta displays a rising trend from 1990 to 2010 with fluctuations, and the conclusion on economic polarization has been supported by the observations confirming the definition of the concept itself:“disappearing middle class”. (2) As far as the two effects of the polarization theory are concerned, the polarization effect of the Yangtze River Delta first expands, and then shrinks during the period of the study, whereas the diffusion effect gradually increases throughout the time period. (3) As more and more industrial enterprises are being relocated or transformed, the trend of economic polarization in the whole region begins to be attenuated and economies gradually expand to the periphery areas, hence in recent 10 years the economies of Yangtze River Delta show a transition from“arrow”type to“Z” type to“M”type to“区”type (a Chinese character meaning“zone”). Eventually the spatial pattern of the region ’s economies will be transformed into a network type, driven by the diffusion effects of the development of infrastructure beams.
Dividing economic space into urban agglomerations using the marginal K function: A case study of Yangtze River Delta region
DOI:10.11821/dlxb201504002
URL
[本文引用: 1]
In this study, an economic space-dividing method for urban agglomerations is presented to theoretically explore the quantitative measurement of urban agglomeration clustering effects with two parameters (agglomeration degree and marginal agglomeration). A marginal analysis of microeconomics based on Ripley's K function of spatial point pattern analysis is also conducted. The study is novel in the aspect that economic space is divided via urban agglomeration degree and marginal agglomeration multi-scale estimation, and an optimal urban pattern is identified when marginal urban agglomeration reaches its maximum value. Finally, urban agglomeration economic spaces are determined accordingly. The Yangtze River Delta is taken as a case study to validate the proposed method. The results show that: (1) urban agglomeration degree estimates indicate that the urban spatial pattern of the Yangtze River Delta region in 2010 was random, but that of the region has shown a rapid increasing trend with the increase of scales of observation; (2) estimates of marginal agglomeration indicate that clustering effects of urban location and urban size reach peak values when city location and city size agglomeration scales reach 185 km to 173 km, respectively. At this point, the urban spatial pattern of the region achieves an optimized state; (3) results of spatial clustering analysis show that in the optimal spatial urban pattern, the Yangtze River Delta region exhibits a "core-periphery" spatial economic structure, in which highly clustered sub-agglomerations located in the Shanghai economic radiation circle form regional centers of economic development, while poorly clustered sub-agglomerations located along inter-regional administrative borders remain underdeveloped peripheral areas. This suggests that a negative marginal effect still hampers the migration of individuals across such areas.
基于边际K函数的长三角地区城市群经济空间划分
DOI:10.11821/dlxb201504002
URL
[本文引用: 1]
In this study, an economic space-dividing method for urban agglomerations is presented to theoretically explore the quantitative measurement of urban agglomeration clustering effects with two parameters (agglomeration degree and marginal agglomeration). A marginal analysis of microeconomics based on Ripley's K function of spatial point pattern analysis is also conducted. The study is novel in the aspect that economic space is divided via urban agglomeration degree and marginal agglomeration multi-scale estimation, and an optimal urban pattern is identified when marginal urban agglomeration reaches its maximum value. Finally, urban agglomeration economic spaces are determined accordingly. The Yangtze River Delta is taken as a case study to validate the proposed method. The results show that: (1) urban agglomeration degree estimates indicate that the urban spatial pattern of the Yangtze River Delta region in 2010 was random, but that of the region has shown a rapid increasing trend with the increase of scales of observation; (2) estimates of marginal agglomeration indicate that clustering effects of urban location and urban size reach peak values when city location and city size agglomeration scales reach 185 km to 173 km, respectively. At this point, the urban spatial pattern of the region achieves an optimized state; (3) results of spatial clustering analysis show that in the optimal spatial urban pattern, the Yangtze River Delta region exhibits a "core-periphery" spatial economic structure, in which highly clustered sub-agglomerations located in the Shanghai economic radiation circle form regional centers of economic development, while poorly clustered sub-agglomerations located along inter-regional administrative borders remain underdeveloped peripheral areas. This suggests that a negative marginal effect still hampers the migration of individuals across such areas.
Identification of urban agglomerations deformation structure based on urbanflow space: A case study of the Yangtze River Delta urban agglomeration
DOI:10.13249/j.cnki.sgs.2017.09.006
URL
[本文引用: 1]
The expansion of informatization, networking and globalization makes internal communication of urban agglomeration increased sharply. Due to the powerful shaping strength of urban flows, spatial structure of urban agglomeration has suffered dramatic structure deformation. It is meaningful to identify and optimize the structure of urban agglomeration from the prospect of the urban flow. Based on economic-social data and road traffic data of the Yangtze River Delta in 2014, this article carries on a comprehensive measurement of urban flow in the Yangtze River Delta. From the prospects of “Node-contact-pattern”, we try to identify the deformation structure of the Yangtze River Delta urban agglomeration with Multidimensional Scaling Analysis. The results indicate that: 1) At the node level, there is a significant hierarchy change of urban centricity in flow space. 67 cities are divided into four levels, the number of middle level city (including level I and level II) in flow space increased dramatically in contrast to traditional rank-size distribution. 2) The connections between nodes in local districtsare restricted to the law of geographic space distance, but high level flows exist between Nanjing, Shanghai, Hangzhou and some other cities, which characterized by the trans-regional intercourse feature and “7” glyph structure in space. 3) In terms of node spatial pattern identification, Multi-dimensional Scaling Analysis can make multidimensional connection matrixreduce to two-dimensional space matrix, the result is more objective and intuitive. Flow space structure pattern shows a dramatic deformation due to the core node “concentration” and the edgenode “discrete”. On one hand, cities such as Shanghai, Hangzhou, Nanjing, and Suzhou present a group concentration, which formed a “core area” characterized by large-scale, continuous urban space, and closely connection; On the other hand, cities in the north of the Yangtze River and south of Hangzhou bay show a scattered deviating trend from the “core area”. In order to improve the efficiency and integration level of the Yangtze River Delta, urban agglomeration, economic development and transport network construction of those structural deviation cities should be noticed by both state and local governments.
基于城市流空间的城市群变形结构识别: 以长江三角洲城市群为例
DOI:10.13249/j.cnki.sgs.2017.09.006
URL
[本文引用: 1]
The expansion of informatization, networking and globalization makes internal communication of urban agglomeration increased sharply. Due to the powerful shaping strength of urban flows, spatial structure of urban agglomeration has suffered dramatic structure deformation. It is meaningful to identify and optimize the structure of urban agglomeration from the prospect of the urban flow. Based on economic-social data and road traffic data of the Yangtze River Delta in 2014, this article carries on a comprehensive measurement of urban flow in the Yangtze River Delta. From the prospects of “Node-contact-pattern”, we try to identify the deformation structure of the Yangtze River Delta urban agglomeration with Multidimensional Scaling Analysis. The results indicate that: 1) At the node level, there is a significant hierarchy change of urban centricity in flow space. 67 cities are divided into four levels, the number of middle level city (including level I and level II) in flow space increased dramatically in contrast to traditional rank-size distribution. 2) The connections between nodes in local districtsare restricted to the law of geographic space distance, but high level flows exist between Nanjing, Shanghai, Hangzhou and some other cities, which characterized by the trans-regional intercourse feature and “7” glyph structure in space. 3) In terms of node spatial pattern identification, Multi-dimensional Scaling Analysis can make multidimensional connection matrixreduce to two-dimensional space matrix, the result is more objective and intuitive. Flow space structure pattern shows a dramatic deformation due to the core node “concentration” and the edgenode “discrete”. On one hand, cities such as Shanghai, Hangzhou, Nanjing, and Suzhou present a group concentration, which formed a “core area” characterized by large-scale, continuous urban space, and closely connection; On the other hand, cities in the north of the Yangtze River and south of Hangzhou bay show a scattered deviating trend from the “core area”. In order to improve the efficiency and integration level of the Yangtze River Delta, urban agglomeration, economic development and transport network construction of those structural deviation cities should be noticed by both state and local governments.
The spatial structures and organization patterns of China's city networks based on the highway passenger flows
DOI:10.11821/dlxb201702004
URL
The multi-level perspective and multi-scalar city network have gradually become the critical pathways to understand spatial interactions and linkages. The road linkages represent distinguished characteristics of spatial dependence and distance decay, which is of great significance in depicting spatial relationships at regional scale. Based on the data of highway passenger flows between prefecture-level administrative units, this paper tries to identify the functional structures and regional impacts of China's city network, and further explores the spatial organization patterns of the existing functional regions, aiming to deepen the understanding of city network structure and provide new cognitive perspectives for the extant research. The empirical results are shown as follows: (1) It is immediately visible that the highway flows are extremely concentrated on the mega-regions of eastern coastal China and major economic zones in central and western China. And city networks based on highway flows demonstrate strong spatial dependence and hierarchical characteristics, which to a large extent has spatial coupling with the distributions of major mega-regions in China. It is a reflection of spatial relationships at regional scale and core-periphery structure. (2) A total of 19 communities that belong to important spatial configurations are identified through community detection algorithm, and we believe that they are urban economic regions within urban China. Their spatial metaphors can be concluded in three aspects. Firstly, many communities have the same boundaries with provincial level administrative units, which reveals that significant administrative region economy still exists in contemporary China. Secondly, trans-provincial linkages can be formed through spatial spillover effects of mega-regions within specific communities. Thirdly, cities located in the marginal areas of provinces and attracted by powerful center cities in neighboring provinces may become increasingly disconnected with their own provinces and be enrolled into communities of neighboring provinces, which make contribution to the formation of the trans-provincial core-periphery structures. (3) Each community, with its distinguished city network system, demonstrates strong spatial dependence and various spatial organization patterns. Regional patterns have emerged with the features of a multi-level, dynamic and networked system. (4) From the morphology perspective, the spatial pattern of regional city networks can be basically divided into monocentric structure, dual-nuclei structure, polycentric structure and low-level equilibration structure, with the monocentric structure as the major type.
基于公路客流的中国城市网络结构与空间组织模式
DOI:10.11821/dlxb201702004
URL
The multi-level perspective and multi-scalar city network have gradually become the critical pathways to understand spatial interactions and linkages. The road linkages represent distinguished characteristics of spatial dependence and distance decay, which is of great significance in depicting spatial relationships at regional scale. Based on the data of highway passenger flows between prefecture-level administrative units, this paper tries to identify the functional structures and regional impacts of China's city network, and further explores the spatial organization patterns of the existing functional regions, aiming to deepen the understanding of city network structure and provide new cognitive perspectives for the extant research. The empirical results are shown as follows: (1) It is immediately visible that the highway flows are extremely concentrated on the mega-regions of eastern coastal China and major economic zones in central and western China. And city networks based on highway flows demonstrate strong spatial dependence and hierarchical characteristics, which to a large extent has spatial coupling with the distributions of major mega-regions in China. It is a reflection of spatial relationships at regional scale and core-periphery structure. (2) A total of 19 communities that belong to important spatial configurations are identified through community detection algorithm, and we believe that they are urban economic regions within urban China. Their spatial metaphors can be concluded in three aspects. Firstly, many communities have the same boundaries with provincial level administrative units, which reveals that significant administrative region economy still exists in contemporary China. Secondly, trans-provincial linkages can be formed through spatial spillover effects of mega-regions within specific communities. Thirdly, cities located in the marginal areas of provinces and attracted by powerful center cities in neighboring provinces may become increasingly disconnected with their own provinces and be enrolled into communities of neighboring provinces, which make contribution to the formation of the trans-provincial core-periphery structures. (3) Each community, with its distinguished city network system, demonstrates strong spatial dependence and various spatial organization patterns. Regional patterns have emerged with the features of a multi-level, dynamic and networked system. (4) From the morphology perspective, the spatial pattern of regional city networks can be basically divided into monocentric structure, dual-nuclei structure, polycentric structure and low-level equilibration structure, with the monocentric structure as the major type.
Analysis of city network based on innovation cooperation: Case study of Yangtze River economic belt
基于创新合作联系的城市网络格局分析: 以长江经济带为例
Spatial effects of high-speed rails on interurban economic linkages in China
DOI:10.11821/dlxb201412009
URL
[本文引用: 2]
As a new mode of transportation, the rapid development of high-speed rail (HSR) will bring a leap in the history of transportation and have a comprehensive impact on the regional structure, population mobility, geographical division of labors, regional linkages, land use, and so on. Therefore, it is significantly important to study the impacts of HSR on regional spatial interactions, especially under the background of regional economic integration. The paper researches the impact of high speed rail on the reconstruction of spatial economic linkages. Based on the GIS network analysis tools, this paper first calculates the time cost matrix of 333 prefecture-level administrative units and four municipalities, and then uses the gravity model to calculate the interurban economic linkages, and lastly analyzes the distribution of the total economic linkage and the economic linkages between any two cities. In order to analyze the impact of HSR on regional spatial interaction, this paper resumes three scenarios: the current transport network in 2012 without the HSR network (scenario 1), the current transport network in 2012 (scenario 3), and the planning HSR network in 2020 (scenario 3) based on the current transport network, to calculate the time cost matrix of 337 cities. Results indicate that: (1) Cities in the east have the highest economic linkages, and cities with the highest increase of economic linkages are located along the HSR lines, which will lead to regional restructuring; (2) The development of HSR lines will improve the economic linkages between cities, and the increasing rate during the first period (comparing scenario 2 with scenario 1) is much higher than that during the second period (comparing scenario 3 with scenario 2); (3) From different perspectives and regional scales, the development of HSR has different impacts on spatial difference; (4) It is possible for cities in a long distance to have high economic linkages with the construction of HSR lines, which could also change the linkage directions.
高速铁路对中国城市空间相互作用强度的影响
DOI:10.11821/dlxb201412009
URL
[本文引用: 2]
As a new mode of transportation, the rapid development of high-speed rail (HSR) will bring a leap in the history of transportation and have a comprehensive impact on the regional structure, population mobility, geographical division of labors, regional linkages, land use, and so on. Therefore, it is significantly important to study the impacts of HSR on regional spatial interactions, especially under the background of regional economic integration. The paper researches the impact of high speed rail on the reconstruction of spatial economic linkages. Based on the GIS network analysis tools, this paper first calculates the time cost matrix of 333 prefecture-level administrative units and four municipalities, and then uses the gravity model to calculate the interurban economic linkages, and lastly analyzes the distribution of the total economic linkage and the economic linkages between any two cities. In order to analyze the impact of HSR on regional spatial interaction, this paper resumes three scenarios: the current transport network in 2012 without the HSR network (scenario 1), the current transport network in 2012 (scenario 3), and the planning HSR network in 2020 (scenario 3) based on the current transport network, to calculate the time cost matrix of 337 cities. Results indicate that: (1) Cities in the east have the highest economic linkages, and cities with the highest increase of economic linkages are located along the HSR lines, which will lead to regional restructuring; (2) The development of HSR lines will improve the economic linkages between cities, and the increasing rate during the first period (comparing scenario 2 with scenario 1) is much higher than that during the second period (comparing scenario 3 with scenario 2); (3) From different perspectives and regional scales, the development of HSR has different impacts on spatial difference; (4) It is possible for cities in a long distance to have high economic linkages with the construction of HSR lines, which could also change the linkage directions.
Regional disparity and the influencing factors of land urbanization in China at the county level, 2000-2015
DOI:10.11821/dlxb201812005
URL
[本文引用: 1]
In the unprecedented urbanization process in China, urbanized land has expanded quickly at the same pace or even faster than the growth of the urban population. Employing both the ordinary least square and geographical weighted regression, we analyzed the spatial patterns and factors influencing land urbanization at the county level in 2000 and 2015. This analysis was assisted by land-use data for China acquired from the resource and environment data cloud platform. The research reveals the following points: (1) The annual growth rate of land urbanization experienced 2.77 percentages on average from 2000 to 2015. About 40% of the counties witnessed an annual increase of 3% or above. Land urbanization was manifested in a pattern of diffusion, which differed from the continued spatial polarization of demographic urbanization in China. (2) Geographically, the north-south differentiation of land urbanization was clearer than the east-west differentiation. And the high-value regions tended to be located to the southeast of "Hu Line". Counties surrounding those metropolitan areas were detected as hotspots of land urbanization. In general, there was a convergent trend of land urbanization among regions in China. (3) The factors of population growth, economic development, industrial structure, city/county features, and geographical location have played significant roles in the spatial disparities of land urbanization at the county level. Besides, the spatio-temporal dependence of their influences were also explored. This study on land urbanization and its influencing factors at the county level advances our theoretical and practical understandings of the new-type urbanization, urban and rural integration, and rural revitalization strategies in contemporary China.
中国县域土地城镇化的区域差异及其影响因素
DOI:10.11821/dlxb201812005
URL
[本文引用: 1]
In the unprecedented urbanization process in China, urbanized land has expanded quickly at the same pace or even faster than the growth of the urban population. Employing both the ordinary least square and geographical weighted regression, we analyzed the spatial patterns and factors influencing land urbanization at the county level in 2000 and 2015. This analysis was assisted by land-use data for China acquired from the resource and environment data cloud platform. The research reveals the following points: (1) The annual growth rate of land urbanization experienced 2.77 percentages on average from 2000 to 2015. About 40% of the counties witnessed an annual increase of 3% or above. Land urbanization was manifested in a pattern of diffusion, which differed from the continued spatial polarization of demographic urbanization in China. (2) Geographically, the north-south differentiation of land urbanization was clearer than the east-west differentiation. And the high-value regions tended to be located to the southeast of "Hu Line". Counties surrounding those metropolitan areas were detected as hotspots of land urbanization. In general, there was a convergent trend of land urbanization among regions in China. (3) The factors of population growth, economic development, industrial structure, city/county features, and geographical location have played significant roles in the spatial disparities of land urbanization at the county level. Besides, the spatio-temporal dependence of their influences were also explored. This study on land urbanization and its influencing factors at the county level advances our theoretical and practical understandings of the new-type urbanization, urban and rural integration, and rural revitalization strategies in contemporary China.
Research on the evaluation of Yangtze River Delta central city based on hierarchy and network
基于等级—网络分析框架的泛长江三角洲中心城市评价研究
Evolution analysis of the unbalanced and polarized economic development in the Yangtze River Delta Region
长三角区域经济发展不均衡和极化的演化分析
Polarization orderings and new classes of polarization indices
DOI:10.1111/1097-3923.00073 URL [本文引用: 1]
Globalization and the inequality of nations
DOI:10.2307/2946642 URL [本文引用: 1]
The spread of industry: Spatial agglomeration in economic development
DOI:10.1006/jjie.1996.0025 URL [本文引用: 1]
The risa and fall of regional inequalities
DOI:10.1016/S0014-2921(98)00061-0 URL [本文引用: 1]
The development of industrial and spatial structures in the Yangtze River Delta
长江三角洲地区产业结构与空间结构的演变
How do industrial land price variations affect industrial diffusion? Evidence from a spatial analysis of China
DOI:10.1016/j.landusepol.2017.12.018 URL [本文引用: 1]
Migration of manufacturing industries in China: Whether, how and where
中国制造业转移的机制、次序与空间模式
Discrimination method and its application analysis of regional transport superiority
DOI:10.11821/xb200808001
URL
[本文引用: 1]
Transport infrastructure has the inherent functions to shape the regional spatial structure and determine the accessibility of all the regions,which consequently formed into the spatial configuration with different transport superiorities. Based on the review of domestic and overseas research progress, this paper presented the concept of transportation superiority from three aspects- "quality", "quantity" and "field" to reflect the scale, technical level and relative advantage of transport infrastructure. Then the paper set up the expression structure for transport superiority degree, including transport network density, influence degree of transport trunk line and transport superiority degree of location. Moreover, this paper constituted the spatial m athem atical model to evaluate transport superiority degree at the county level by utilizing GIS technology. Based on the theoretical analysis and the spatial mathem atical evaluation model, this paper studied 2,365 counties in China to analyze the spatial patterns of transport superiority degree. This study reveals that, firstly, the distribution characteristic of transport superiority degree obeys the "partial normal distribution".Few regions,which m erely account for 1.4% of the total number of counties, have prominent transport superiority degree and the traffic environment in these regions is superior for social and economic development. By contrast, one eighth of all the regions have inferior transport superiority degree and the traffic environment there is poor and im pedes local social and econom ic developm ent.The rem aining regions, which are about 70% of the country's total area, have the middle level or barely better than the middle level in transport superiority degree. Secondly, the spatial characteristic show s that the transport superiority degree decreases gradually from coast areas to inland areas. The regions of the highest transport superiority degree centralize in the Y angtze River Delta, Beijing-Tianjin-Hebei Metropolitan Area, and Pearl River Delta. The regions of the second highest transport superiority degree concentrate in Chengdu, Chongqing, and Wuhan metropolises. How ever, the spatial distribution of the second highest regions is discontinuous and the coverage of these regions is relatively sm aller than the regions w ith the highest transport superiority degree. The provincial capitals and some high-density cities/counties/towns enjoy the third highest transport superiority and follow the same spatial patterns as the regions of the second highest transport superiority. Through the above analysis, we could recognize the spatial m echanism of transport infrastructure and better understand how to leverage the advantages or circuit/change the disadvantages of transport infrastructure in regional development. Also this research may provide scientific guidance to all kinds of planning activities.
中国区域交通优势的甄别方法及应用分析
DOI:10.11821/xb200808001
URL
[本文引用: 1]
Transport infrastructure has the inherent functions to shape the regional spatial structure and determine the accessibility of all the regions,which consequently formed into the spatial configuration with different transport superiorities. Based on the review of domestic and overseas research progress, this paper presented the concept of transportation superiority from three aspects- "quality", "quantity" and "field" to reflect the scale, technical level and relative advantage of transport infrastructure. Then the paper set up the expression structure for transport superiority degree, including transport network density, influence degree of transport trunk line and transport superiority degree of location. Moreover, this paper constituted the spatial m athem atical model to evaluate transport superiority degree at the county level by utilizing GIS technology. Based on the theoretical analysis and the spatial mathem atical evaluation model, this paper studied 2,365 counties in China to analyze the spatial patterns of transport superiority degree. This study reveals that, firstly, the distribution characteristic of transport superiority degree obeys the "partial normal distribution".Few regions,which m erely account for 1.4% of the total number of counties, have prominent transport superiority degree and the traffic environment in these regions is superior for social and economic development. By contrast, one eighth of all the regions have inferior transport superiority degree and the traffic environment there is poor and im pedes local social and econom ic developm ent.The rem aining regions, which are about 70% of the country's total area, have the middle level or barely better than the middle level in transport superiority degree. Secondly, the spatial characteristic show s that the transport superiority degree decreases gradually from coast areas to inland areas. The regions of the highest transport superiority degree centralize in the Y angtze River Delta, Beijing-Tianjin-Hebei Metropolitan Area, and Pearl River Delta. The regions of the second highest transport superiority degree concentrate in Chengdu, Chongqing, and Wuhan metropolises. How ever, the spatial distribution of the second highest regions is discontinuous and the coverage of these regions is relatively sm aller than the regions w ith the highest transport superiority degree. The provincial capitals and some high-density cities/counties/towns enjoy the third highest transport superiority and follow the same spatial patterns as the regions of the second highest transport superiority. Through the above analysis, we could recognize the spatial m echanism of transport infrastructure and better understand how to leverage the advantages or circuit/change the disadvantages of transport infrastructure in regional development. Also this research may provide scientific guidance to all kinds of planning activities.
The coupling coordination evaluation between population urbanization and land urbanization in Zhejiang Province
浙江省人口城市化与土地城市化的耦合协调关系评价
Structural change and aggregate growth. WIFO Working Paper
Policy implication process and prospect of Chinese urban agglomerations formation and development
Urban agglomerations are the most dynamic and potential core areas for the future economic develop-ment of China. As the key and optimal development zones of major function oriented zoning in China, urban agglomerations play the roles of strategic support points, growth poles and core nodes in national productivity layout. To begin with, the formation and development of Chinese urban agglomerations indeed dates back to the initial stage of China’s reform and opening-up in the 1980s. It has gone through three stages, namely the embryonic development stage in the 1980s, the rapid growth stage in the 1990s and the sustained development stage in the 2010s. Moreover, there are distinct government-led characteristics for the formation and develop-ment of Chinese urban agglomerations, mainly resulted from national and local macro-regulation policies and regional development policies. They involve in both the guidance of national macro-regulation policies and the propensity of key regions’development policies. Specifically, the related supportive policies and their imple-mentation impact on the formation and development of Chinese urban agglomerations from the 6 th Five-Year Plan to the 11th Five-Year Plan can be concluded as follows. Firstly, the policy about regional cooperation and economic zone in the 6th Five-Year Plan is to be the start the construction of Chinese urban agglomerations. Secondly, the policy about three levels of economic zone network in the 7th Five-Year Plan builds the prelimi-nary framework for the construction of Chinese urban agglomerations. Thirdly, the policy about horizontal alli-ance and balancing urban and rural development in the 8th Five-Year Plan puts forward the integration outlook to the construction of Chinese urban agglomerations. Fourthly, the policy to promote balanced development among regions in the 9th Five-Year Plan drives the formation and development of urban agglomerations in the central and western regions of China. Fifthly, the urbanization strategy in the 10th Five-Year Plan points out the overall direction for the construction of Chinese urban agglomerations. Finally, the policy, which first time em-phasizes urban agglomerations to be a primary pattern to accelerate urbanization in the 11th Five-Year Plan, es-tablishes the spatial layout for the construction of Chinese urban agglomerations. In addition, in view of the ur-ban agglomerations in different regions, different spatial patterns and different development degree, national government successively implements at least 22 supported policies with the principle of adaptation to local conditions. The policies actively guide Chinese urban agglomerations to ensure their sound and steady develop-ment.
中国城市群形成发育的政策影响过程与实施效果评价
Urban agglomerations are the most dynamic and potential core areas for the future economic develop-ment of China. As the key and optimal development zones of major function oriented zoning in China, urban agglomerations play the roles of strategic support points, growth poles and core nodes in national productivity layout. To begin with, the formation and development of Chinese urban agglomerations indeed dates back to the initial stage of China’s reform and opening-up in the 1980s. It has gone through three stages, namely the embryonic development stage in the 1980s, the rapid growth stage in the 1990s and the sustained development stage in the 2010s. Moreover, there are distinct government-led characteristics for the formation and develop-ment of Chinese urban agglomerations, mainly resulted from national and local macro-regulation policies and regional development policies. They involve in both the guidance of national macro-regulation policies and the propensity of key regions’development policies. Specifically, the related supportive policies and their imple-mentation impact on the formation and development of Chinese urban agglomerations from the 6 th Five-Year Plan to the 11th Five-Year Plan can be concluded as follows. Firstly, the policy about regional cooperation and economic zone in the 6th Five-Year Plan is to be the start the construction of Chinese urban agglomerations. Secondly, the policy about three levels of economic zone network in the 7th Five-Year Plan builds the prelimi-nary framework for the construction of Chinese urban agglomerations. Thirdly, the policy about horizontal alli-ance and balancing urban and rural development in the 8th Five-Year Plan puts forward the integration outlook to the construction of Chinese urban agglomerations. Fourthly, the policy to promote balanced development among regions in the 9th Five-Year Plan drives the formation and development of urban agglomerations in the central and western regions of China. Fifthly, the urbanization strategy in the 10th Five-Year Plan points out the overall direction for the construction of Chinese urban agglomerations. Finally, the policy, which first time em-phasizes urban agglomerations to be a primary pattern to accelerate urbanization in the 11th Five-Year Plan, es-tablishes the spatial layout for the construction of Chinese urban agglomerations. In addition, in view of the ur-ban agglomerations in different regions, different spatial patterns and different development degree, national government successively implements at least 22 supported policies with the principle of adaptation to local conditions. The policies actively guide Chinese urban agglomerations to ensure their sound and steady develop-ment.
