

1 引言
耕地细碎化是与耕地规模经营相悖的一种资源利用格局,包含区域尺度景观格局细碎与微观尺度地块权属细碎两种形态[1⇓-3],二者之间既紧密联系又有显著区别。尤其在耕地资源聚集度、规模化程度总体较低及人多地少、资源匮乏的背景下,耕地景观细碎是导致产权细碎的基础,而产权细碎是景观细碎的进一步拓展和延伸[1,4]。同时,相较以同一地块的共有人数量较多或同一农户拥有多块空间互不相邻的分散地块为主要表现形式的权属细碎化[4-5],中国幅员辽阔,各地自然地理、农业发展、土地利用等区域差异显著,导致不同区域间的耕地景观格局特征更为复杂多样[5]。因此,中国耕地景观细碎化的特征及其发展愈发引起学界关注和重视[6⇓-8],并已成为耕地细碎化治理与可持续利用研究的重要课题,对因地制宜地制定国家农业空间管制策略、促进农地适度规模经营等具有重要意义。
作为中国耕地资源利用的典型特征,耕地细碎化具有显著的时空异质性和尺度依赖性[11-12],其在不同尺度下的格局分异、特征表现及演变态势等不尽相同。但受计算效率、数据获取等因素限制,已有耕地细碎化研究多集中在特定省市、县乡、村户等中小尺度[13-14],有限的全国尺度研究仅基于特定时间截面探讨单一行政尺度(如地级市)下的耕地景观总体特征及其与种植业发展、生态系统服务等之间的关系[5,8],但对不同尺度下耕地景观细碎化发展的特征差异、时空过程及其演变态势尚不清晰,对耕地细碎化特征表现的多维性、系统性认识也存在进一步提升空间,亟需从长时间序列、多空间尺度加强对中国耕地景观细碎化的理论认知、特征解析与趋势预测研究。
鉴于此,区别于以往研究多聚焦微观尺度的产权细碎化或单一行政尺度的耕地景观格局探索,本文立足多时空尺度,基于对耕地景观细碎化的理论认知,从资源规模、空间集聚、边界形状等方面构建耕地景观细碎化综合测度模型;继而,基于1990—2020年中国土地利用数据,集成泰尔指数、尺度方差及分解、马尔可夫链等数理统计和空间分析方法,按照国家、农业区、省域、市域、县域5级尺度,系统揭示近30年中国耕地景观细碎化的多尺度时空演进规律及其尺度嵌套效应,并据此预测其长期演变趋势,以期为深化国家层面、不同空间尺度耕地利用的特征、过程等机理性认识,优化耕地资源利用与管理、推进农业适度规模经营等提供有益借鉴。
2 理论认知、数据来源与研究方法
2.1 耕地景观细碎化理论认知
目前,学界就耕地景观细碎化的内涵理解已达成初步共识,即耕地在自然地理、社会经济、人类活动等因素影响下,在空间上呈现资源规模大小不一、空间分布聚散不同、边界形状各异的景观分异现象[1⇓-3,7 -8,11 -12,14⇓⇓ -17],包含对耕地景观细碎化特征认识的4个关键方面:① 指示意义。耕地景观细碎化本质上反映了区域耕地在资源规模、空间分布、边界形状等方面的景观格局特征[11,18],包括斑块面积、数量、密度等资源规模条件,地块间距离关系、连通状况、团聚程度等空间分布格局,以及斑块个体、景观整体的形状分化特征等[19-20]。② 参照标准。耕地景观细碎化是在既定资源禀赋、自然地理、社会经济等条件支持或限制下,以能体现利益相关者(如国家、政府、公民等)理想或期望耕地资源规模条件、空间集聚程度与形状规整水平的耕地景观为参照[21-22],反映区域间耕地景观“相对细碎程度”的相对概念[19-20]。“理想参照”[21,23]指示了区域内与利益相关者就耕地利用的目标、愿景等意识形态相契合,益于耕地规模利用与高效耕作的景观格局特征及状态。针对特定区域,其耕地资源规模条件越差、空间集聚度越低、形状规整性越差,耕地景观的规模特征越弱,细碎程度越高,耕地越难实现规模利用,易耕性也越差[5,13,15⇓ -17]。③ 测度评价。耕地景观细碎化测评旨在选取能够反映耕地资源规模、空间分布、边界形状等相应景观格局特征的定量指标(即景观指数)以全面刻画其细碎程度[17,20,24]。因此,若将区域耕地景观规模特征的强弱表示为“SI”,则相同时点同一区域耕地景观细碎特征的弱强可表征为“1-SI”[1,5,13]。④ 演进形态。耕地景观的“细碎化”过程即为耕地由连续整体向破碎斑块演进的过程,这一过程将导致耕地景观面积减少、斑块数量增多、规模减小、密度增大,地块间距离增大、空间阻隔增强、连通性减弱,以及地块边缘趋向复杂和无序、形状规整性下降等[13-14,16 -17],致使耕地愈发细碎、分散,景观细碎度增强。
2.2 研究对象与数据来源及处理
按照国家、农业区、省域、市域、县域5级尺度揭示中国耕地景观细碎化的特征演进规律与未来发展趋势。其中,国家、省域、市域、县域边界矢量取自自然资源部标准地图服务网站提供的标准地图。农业区数据依据中国科学院资源环境科学数据中心公布的农业区划方案,将全国划分为东北平原区、北方干旱半干旱区、黄淮海平原区、黄土高原区、青藏高原区、长江中下游地区、四川盆地及周边地区、华南区、云贵高原区等9个农业区①(① 数据来源:中国科学院资源环境科学数据中心(
2.3 研究方法
2.3.1 耕地景观细碎化评价
表1 耕地景观细碎化多维评价指标体系
Tab. 1
| 目标层 | 维度层 | 指标层 | 指标含义 | 属性 | 权重 |
|---|---|---|---|---|---|
| 耕地景观细碎化 | 资源 规模性 | 平均斑块面积 | 表征平均耕地斑块面积大小 | + | 0.300 |
| 斑块总面积 | 表征一定区域范围内的耕地景观的斑块规模 | + | 0.261 | ||
| 斑块密度 | 表征单位面积的耕地斑块数 | - | 0.264 | ||
| 细碎度指数 | 表征斑块在数量、大小等方面的离散细碎程度 | - | 0.175 | ||
| 空间 集聚性 | 平均邻近度 | 表征特定空间范围内耕地斑块间的邻近程度 | + | 0.237 | |
| 欧式平均最近邻距离 | 反映耕地斑块整体平均邻近状况 | - | 0.320 | ||
| 斑块数量 | 表征特定区域内的耕地斑块数量及空间连接状况 | - | 0.210 | ||
| 景观分割度 | 表征耕地景观的空间分割程度及延展水平 | - | 0.233 | ||
| 形状 规整性 | 平均形状指数 | 反映耕地斑块形状边缘的规整程度 | - | 0.492 | |
| 景观形状指数 | 表征耕地景观形状边界的规整性及复杂性 | - | 0.508 |
注:各指数具体计算公式请参考 Fragstats软件用户指南。
式中:wi、wr、wk分别代表资源规模、空间集聚、形状规整维度下指标i、r、k的权重;Eij、Prj、Rkj依次为评价单元j的指标i、r、k标准化值。
2.3.2 耕地景观细碎化特征演进分析方法
式中:△CLFIjik为不同尺度下研究单元j在期初i、期末k之间的耕地景观细碎化变化率;CLFIjk、CLFIji分别为j在期末k、期初i的耕地景观细碎化观测值。
表2 耕地景观细碎化及其分维属性等级划分标准
Tab. 2
| 等级 | 耕地景观细碎化范围 | 资源规模性范围 | 空间集聚性范围 | 形状规整性范围 | |
|---|---|---|---|---|---|
| 1 | 低 | ≤ 0.279 | ≤ 0.266 | ≤ 0.456 | ≤ 0.429 |
| 2 | 较低 | (0.279, 0.377] | (0.266, 0.419] | (0.456, 0.574] | (0.429, 0.561] |
| 3 | 中等 | (0.377, 0.465] | (0.419, 0.526] | (0.574, 0.703] | (0.561, 0.665] |
| 4 | 较高 | (0.465, 0.557] | (0.526, 0.660] | (0.703, 0.836] | (0.665, 0.771] |
| 5 | 高 | > 0.557 | > 0.660 | > 0.836 | > 0.771 |
2.3.3 耕地景观细碎化多尺度差异演化分析方法
式中:T为泰尔指数,T值越大,表示耕地景观细碎化的区域差异越大;p、uy、yi分别表示不同尺度的研究单元数量、平均耕地景观细碎化指数、研究单元i的耕地景观细碎化指数。
相较泰尔指数,尺度方差是将研究对象方差按尺度等级进行分解,以各尺度的尺度方差大小反映尺度梯级变化对研究对象变异性的贡献[28],继而判识最能体现研究对象异质性差异、最具研究价值的空间尺度。其基本模型为:
式中:Xijk...z表示最低尺度(即县域)组成单元的取值;μ为整个尺度系统所有组成单元的总体平均值;αi、βij、γijk、φijk…z分别表示农业区、省域、市域、县域尺度差异对区域总体方差的影响,计算公式见表3。
表3 耕地景观细碎化平均尺度方差估计与尺度方差构成
Tab. 3
| 尺度 | 自由度 | 平均方差估计 | 尺度方差分解 |
|---|---|---|---|
| 农业区(α) | I-1 | ||
| 省域(β) | |||
| 市域(γ) | |||
| 县域(φ) |
注:SV表示各尺度的尺度方差;
2.3.4 耕地景观细碎化趋势预测模型
采用马尔可夫预测法[29-30]研判适宜尺度下耕地景观细碎化的未来演变趋势,包括传统马尔可夫链、空间马尔可夫链、马尔可夫链稳态分布等关键内容。其中,传统马尔可夫链是将量化随机事件的连续数值离散为K种状态类型,并按时间序列构造类型转移概率矩阵,据此预测其未来趋势。依据2.3.2节,本文包括低、较低、中等、较高、高等5种耕地景观细碎化状态类型(K=5),分别用k =1, 2, …, 5表示,由此可构建研究期内类型转移的K×K阶概率矩阵M(表4)。表4中,Pij代表某研究单元由t年的类型i转化为t+1年类型j的概率,并可根据细碎化等级的“向上”“稳定”和“向下”变化定义转移方向。例如,P12表示“向上”转移,细碎度增强;P11表示“稳定”不变;P21表示“向下”转移,细碎度减弱。
表4 马尔可夫链状态转移概率矩阵M (K=5)
Tab. 4
| t t+1 | 1 | 2 | 3 | 4 | 5 |
|---|---|---|---|---|---|
| 1 | P11 | P12 | P13 | P14 | P15 |
| 2 | P21 | P22 | P23 | P24 | P25 |
| 3 | P31 | P32 | P33 | P34 | P35 |
| 4 | P41 | P42 | P43 | P44 | P45 |
| 5 | P51 | P52 | P53 | P54 | P55 |
空间马尔可夫链即以划分的K种类型作为空间滞后条件,将传统的K×K阶转移概率矩阵M分解为K种空间滞后类型约束下的K个K×K阶条件转移概率矩阵,以揭示地理背景对事件发展演化的影响。以第K个条件矩阵为例,Pij|K表示在类型K的邻域背景下,研究单元由t年的类型i转化为t+1年类型j的转移概率。通过与表4中的Pij比较,可深入探讨邻域背景对耕地景观细碎化发展演化的空间溢出效应。如若P12>P12|1,表示研究单元在与类型1为邻的情况下,其由类型1转为类型2的概率小于不考虑邻域背景情形;若邻域背景无影响,则P12=P12|1。
随机事件经过长时间转移,系统将存在一种平衡状态,即系统处于同一状态的概率始终相同,此时的概率分布即为稳态分布,对应的概率称为终极状态概率[29]。据此,稳态分布的基本预测模型可表示为:
式中:
若
3 结果与分析
3.1 中国耕地景观细碎化多尺度时空特征演变
为节省篇幅,选取1990年、2000年、2010年、2020年4个时间截点,依据表2中的耕地景观细碎化及其分维属性等级划分标准,对省域、市域、县域尺度进行空间制图以分析其时空演变特征。
3.1.1 国家尺度
中国耕地景观细碎化指数由1990年的0.416上升至2020年的0.430,增长3.16%,1990—2000年、2000—2010年、2010—2020年不同时段内的增幅分别为0.52%、2.60%、0.03%,表明尽管中国耕地景观细碎度持续增强,但随时间推移增幅放缓,并在2017年以后表现出较明显的减弱态势(图1),这充分体现了近年来国家及地方政府通过深入实施国土综合整治、积极推进土地流转和适度规模经营等系列资源管理政策对减轻中国耕地细碎度发挥的积极作用。分维属性来看,研究期内耕地景观特征均表现为“空间集聚性>形状规整性>资源规模性”,降幅依次为2.87%、2.28%和1.42%,但在不同时段的发展演化存在一定差异。
图1
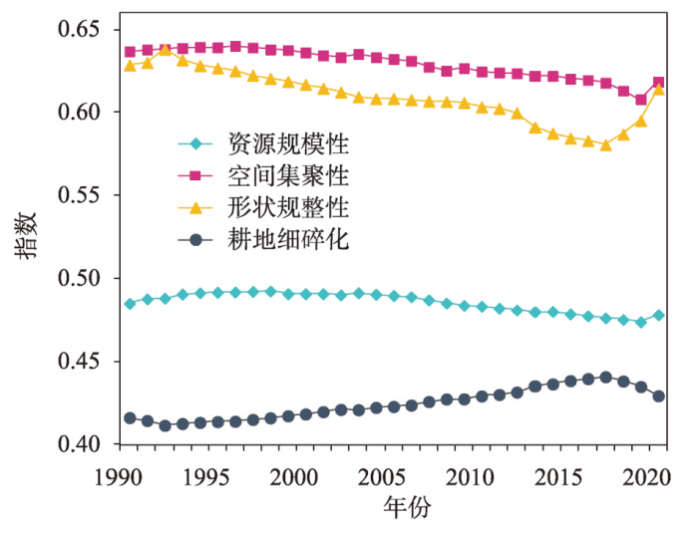
图1
1990—2020年中国耕地景观特征变化与总体细碎格局
Fig. 1
Changes and overall fragmentation pattern of cultivated land landscape in China from 1990 to 2020
3.1.2 农业区尺度
1990—2020年中国不同农业区耕地景观细碎特征及变化差异明显(图2)。经统计,云贵高原区耕地景观细碎度最高,黄淮海平原区最低,各农区平均细碎化指数排序为“云贵高原区>青藏高原区>华南区>北方干旱半干旱区>黄土高原区>四川盆地及周边地区>长江中下游地区>东北平原区>黄淮海平原区”。分维属性来看,资源规模性在黄淮海平原区、长江中下游地区持续降低,在东北平原区、四川盆地及周边地区均由1990—2000年提高演变为2000—2020年持续降低;空间集聚性在东北平原区、黄淮海平原区、长江中下游地区、华南区呈持续降低,其他农区随时间推移也多以降低为主;形状规整性在黄淮海平原区持续降低,其他农区多由1990—2010年降低转为2010—2020年提高。上述结果表明,尽管黄淮海平原区、长江中下游地区、东北平原区等农区的耕地景观细碎度较低,但随时间推移耕地愈发分散、细碎;相比之下,云贵高原区、青藏高原区、黄土高原区等农区内的耕地细碎现象呈轻微减缓,但细碎程度较严峻。
图2
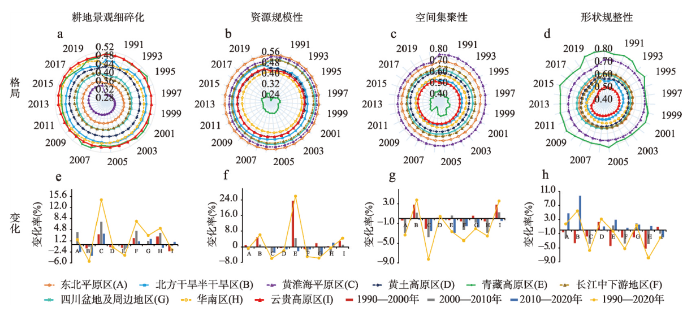
图2
1990—2020年中国九大农业区耕地景观细碎特征及演变
Fig. 2
Evolution of farmland landscape fragmentation in nine major agricultural areas of China from 1990 to 2020
3.1.3 省域尺度
省域尺度下,耕地景观细碎化呈现以山东、江苏、安徽、河南、黑龙江等省形成的低值集聚带为核心,由东向西、自东北至西南逐级提高的同心圆圈层式格局(图3)。其中,云南省耕地细碎度最高,山东省最低。1990—2020年间,耕地细碎度增强的省份在空间上形成沿东部海岸带分布、北起辽宁、南至广西壮族自治区、西延四川的北—南向与东—西向交汇“T”型格局,经济发达且农业资源禀赋优越的江苏、山东、浙江等省份耕地细碎化增强态势长期位居全国前列,增幅均在14.18%以上,而细碎度减弱的省份主要分布在西南、西北及北方干旱半干旱地带,平均降低3.23%。分维属性来看,耕地资源规模性、空间集聚性、形状规整性均下降的省份高达11个,均为东部沿海经济发达省或中部粮食生产关键省,包括上海、江苏省、天津、浙江省、北京、山东省、河北省、安徽省、河南省、广东省和辽宁省,其中上海市三者平均下降幅度最大,高达14.72%,其次为江苏省,为10.81%,辽宁省最低,为4.84%。
图3
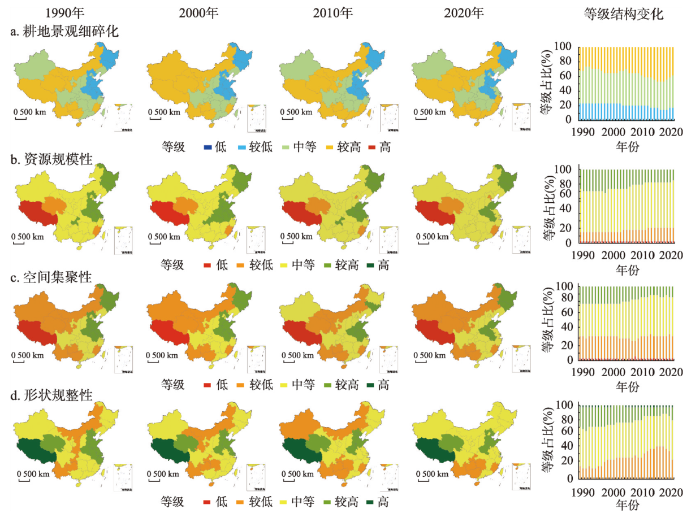
图3
1990—2020年中国省域耕地景观细碎化时空格局
注:基于自然资源部标准地图服务网站GS(2016)1549号标准地图制作,底图边界无修改,后同。
Fig. 3
Spatio-temporal pattern of farmland landscape fragmentation at provincial scale in China from 1990 to 2020
图4

图4
1990—2020年中国省域耕地景观细碎化时空演变
Fig. 4
Spatio-temporal changes of farmland landscape fragmentation at provincial scale in China from 1990 to 2020
3.1.4 市域尺度
市域尺度下,“胡焕庸线”塑造了耕地景观细碎化显著的空间异质性(图5),形成以东北平原区中西部、长江中下游地区东北部与黄淮海平原区为核心的两大低值集聚区,向四周延展形成两大中等细碎度延伸群,及沿“北方干旱半干旱区—青藏高原区—四川盆地及周边地区西部—云贵高原区”西北—东南走向,长江中下游地区与华南区交界地带形成两大较高细碎度带状连片区,呈现以“双核心—环核群—带状区”为依托的集中连片分布格局。在时空变化方面,1990—2020年市域耕地景观细碎化总体表现为“东增西减”(图6),耕地细碎度增强的城市集中分布在东部沿海地带,山东、河南、河北、江苏、安徽、浙江等成为细碎化增强的高值集聚区;细碎化减弱的城市广泛分布在“胡焕庸线”西北侧,并在黑龙江北部、新疆维吾尔自治区西北部等地区形成了相对独立且规模较小的减弱高值集聚点。研究期内耕地资源规模性、空间集聚性、形状规整性均下降的城市有120个,占比34.38%,多集中分布在东部沿海经济发达区、直辖市、省会城市、城市群及其周边区域。
图5
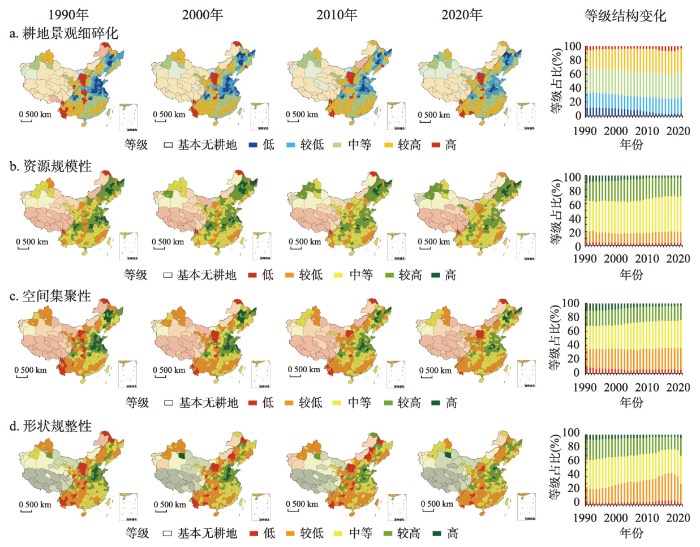
图5
1990—2020年中国市域耕地景观细碎化时空格局
注:基于统一的等级划分标准和色带对省域、市域、县域尺度进行耕地景观细碎化空间制图,但考虑到青海、西藏、新疆等省份内的部分地区“基本无耕地”,故在市域、县域制图中增加了“基本无耕地”范围,主要有两方面原因:一是,弱化可能因“基本无耕地”范围干扰导致对中国市/县域耕地景观细碎化整体格局的认知偏差;二是,统筹考虑“基本无耕地”范围,增强对青海、西藏、新疆等局域耕地景观细碎格局的特征认识。“基本无耕地”范围依据研究基期基层尺度(即1990年,县域)下几乎无耕地分布的县域及其隶属市域确定,后同。
Fig. 5
Spatio-temporal pattern of farmland fragmentation at municipal scale in China from 1990 to 2020
图6
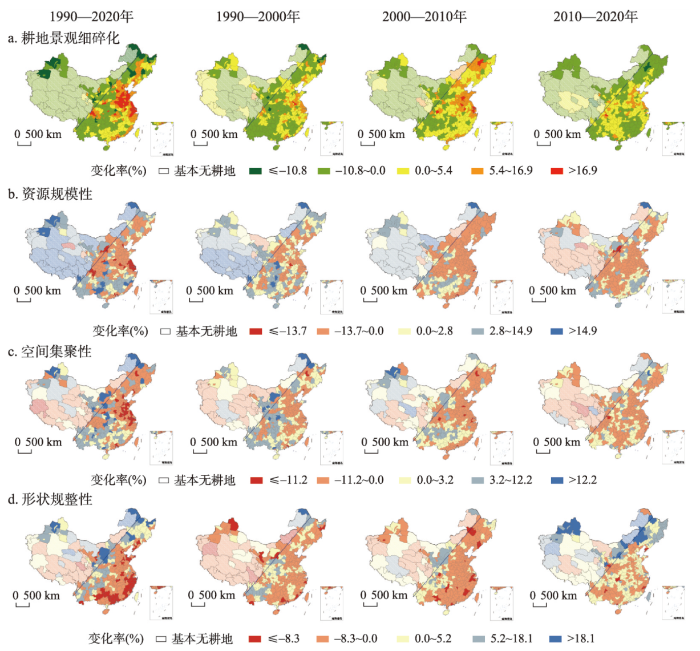
图6
1990—2020年中国市域耕地景观细碎化时空演变
Fig. 6
Spatio-temporal changes of farmland fragmentation at municipal scale in China from 1990 to 2020
3.1.5 县域尺度
县域尺度下,耕地景观细碎化格局以中国地势三级阶梯分界线成梯状分布,第二级阶梯耕地细碎度最高,第一级阶梯次之,第三级阶梯最低(图7)。研究期内,县域耕地景观细碎化呈现“一片区、一组团、五聚点”的时空演变特征。其中,“一片区”主要指二、三级地势阶梯分界线以西县域,是耕地细碎度减弱的集中连片分布区,平均降低6.97%;“一组团”主要指太行山脉东侧,由华北平原、黄淮平原、长江中下游平原东部县域形成的细碎化高幅增长核心组团,增幅多高于16.90%;“五聚点”是指自北向南由哈长城市群、辽中南城市群、成渝城市群、武汉城市圈、珠三角城市群县域形成的相对独立的细碎化中高幅增长集聚点。分维属性方面,耕地资源规模性、空间集聚度、形状规整性均下降的县域有918个,占比33.16%,基本为省会城市及其周围城市县域。
图7
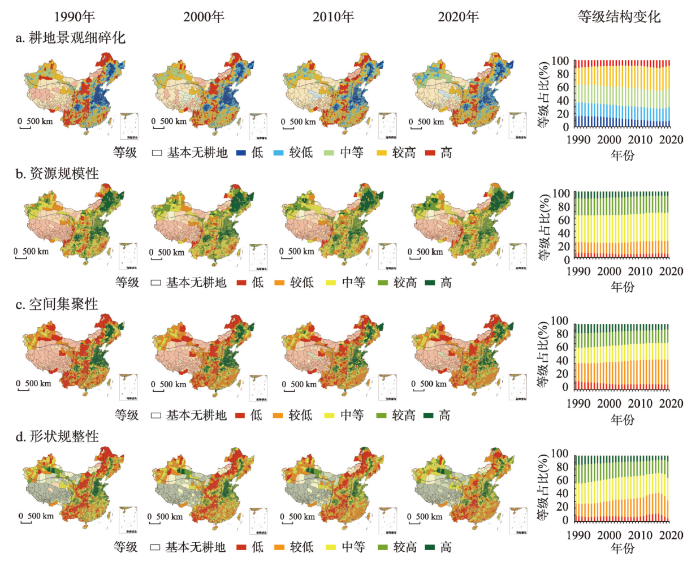
图7
1990—2020年中国县域耕地景观细碎化时空格局
Fig. 7
Spatio-temporal pattern of farmland fragmentation at county level in China from 1990 to 2020
图8
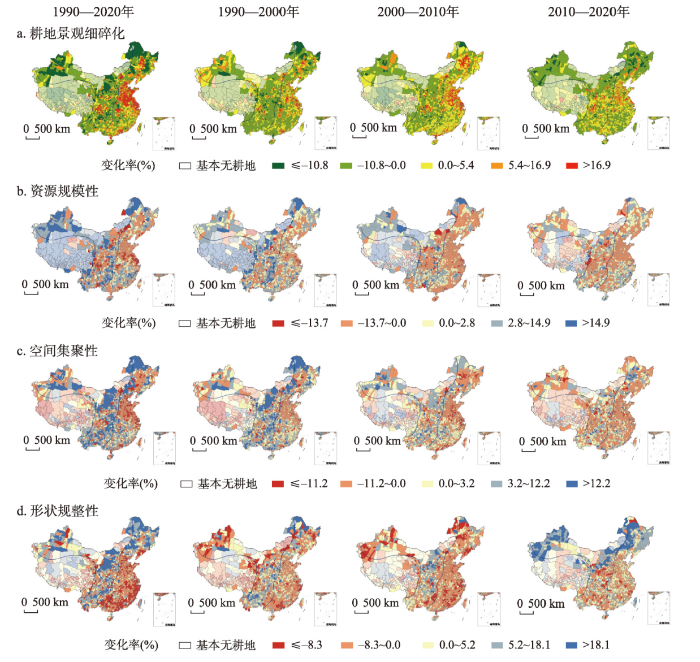
图8
1990—2020年中国县域耕地景观细碎化时空变化
Fig. 8
Spatio-temporal changes of farmland fragmentation at county level in China from 1990 to 2020
综上,1990—2020年间中国耕地景观细碎化在多尺度上均表现出增强态势,但随时间推移增速明显减缓,这与细碎化分维属性在不同时段的变化差异密切相关:即1990—2000年、2000—2010年、2010—2020年间,耕地资源规模性呈现“提高—降低—降低”的倒“V”型演变,空间集聚性表现出“降低—降低—降低”的持续态势,形状规整性则呈现“降低—降低—提高”的“V”型变化。这表明,不同时段下导致细碎化增强的耕地景观特征表现并非相同,即1990—2000年主要由耕地空间分布日趋离散和边界形状愈发不规整所致,2000—2010年是耕地在资源规模、空间分布、边界形状等方面均趋向细碎的多维驱动过程,2010—2020年则是耕地资源规模细碎与空间分布细碎双维驱动。同时,2000—2010年是中国耕地景观细碎化发展最为剧烈的时期,在不同尺度下均表现出细碎度增长幅度最大、覆盖范围最广、涉及维度最多等特点。
3.2 中国耕地景观细碎化差异的空间尺度效应
3.2.1 多尺度耕地景观细碎化差异比较
图9展示了1990—2020年中国不同尺度下耕地景观细碎化的相对差异及演化。30年间耕地细碎化的泰尔指数均呈“县域>市域>省域>农业区”梯级排列,且随时间推移均呈减小态势,同时,不同尺度下耕地景观分维属性的泰尔指数均表现为“资源规模性>空间集聚性>形状规整性”。这表明,不同尺度下,中国耕地景观细碎化的区域差异随空间尺度上升而减小,聚焦本文,县域尺度差异最大,农业区层面差异最小;同一尺度下,耕地细碎化的区域差异随时间推移而减小,耕地景观特征日趋均质,且分维属性上,耕地资源规模条件的区域间差异最大,空间聚散程度差异次之,边界形态特征的区域差异最小。
图9
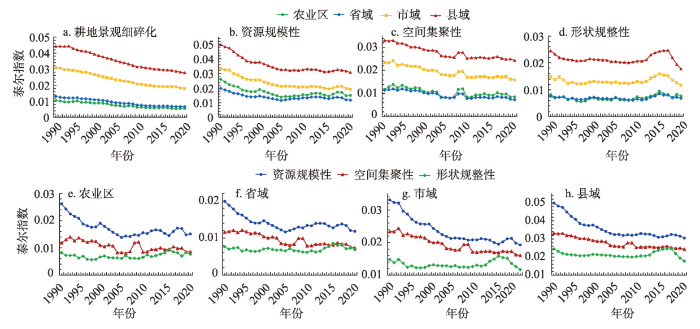
图9
1990—2020年中国不同尺度耕地景观细碎化的泰尔指数
Fig. 9
Theil Index of cultivated land landscape fragmentation at different scales in China from 1990 to 2020
3.2.2 耕地景观细碎化差异尺度效应分解
图10展示了中国耕地景观细碎化差异形成的尺度嵌套效应。研究期内县域、市域、省域、农业区尺度耕地景观细碎化的尺度方差均随时间推移波动减小,但在曲线形态、变化幅度等方面存在显著差异,说明空间尺度及选择对耕地景观细碎化的特征分析具有重要影响。方差分解结果表明,1990—2020年,县域、市域、省域、农业区尺度耕地细碎化差异对中国耕地细碎化总体差异的平均贡献分别为84.87%、14.64%、0.31%、0.18%,县域差异贡献远高于其他3级尺度水平。分维属性的尺度方差分解结果亦突出了县域差异对中国耕地资源规模性、空间集聚性、形状规整性各自总体差异的主导贡献,历年平均贡献分别为85.70%、85.62%、84.87%。可见,空间尺度越小,耕地细碎化及其分维属性差异对总体差异的贡献越大,越能反映耕地景观格局的时空异质特征。聚焦本文,县域是揭示耕地景观特征的关键尺度,尤应值得关注和研究。为此,以下内容将基于县域耕地细碎化的时空过程规律预测其长期演变趋势。
图10
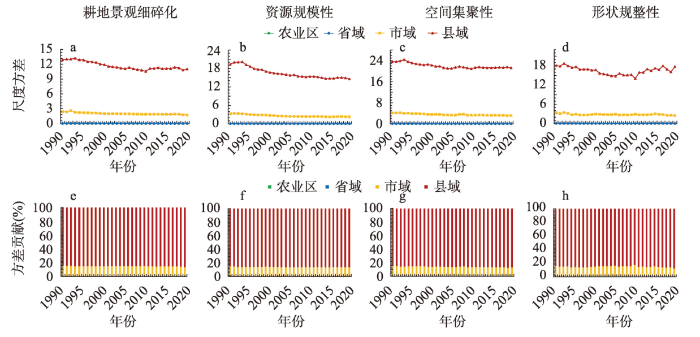
图10
1990—2020年中国不同空间尺度耕地景观细碎化的尺度方差及分解
Fig. 10
Scale variances and percentage sums of farmland landscape fragmentation at agricultural, provincial, municipal and county scales in China from 1990 to 2020
3.3 中国耕地景观细碎化趋势预测
3.3.1 传统马尔可夫概率转移
表5展示了1990—2020年中国县域耕地景观细碎化的传统马尔可夫链概率转移矩阵。结果表明:① 对角线元素取值介于0.9279~0.9598之间,远大于非对角线元素,表明研究期内县域类型不发生变化的最小概率为92.79%,耕地细碎化发展具有维持原有状态的高稳定性。② 以对角线元素为界,相同初始类型下,右上非对角线元素均大于左下非对角线元素,表明耕地细碎化整体上具有向高细碎度方向转移的趋势,普遍发生于类型1向2、2向3、3向4、4向5的转移中。③ 紧邻对角线两侧的元素显著大于远离对角线两侧的元素,表明县域耕地细碎化转移通常为相邻等级之间的递次转移,跨等级转移的可能性较小。
表5 1990—2020年中国县域耕地景观细碎化传统马尔可夫概率转移矩阵
Tab. 5
| t t+1 | n | 1 | 2 | 3 | 4 | 5 |
|---|---|---|---|---|---|---|
| 1 | 10543 | 0.9598 | 0.0372 | 0.0015 | 0.0013 | 0.0002 |
| 2 | 16952 | 0.0121 | 0.9487 | 0.0391 | 0.0001 | 0.0000 |
| 3 | 23166 | 0.0005 | 0.0205 | 0.9443 | 0.0347 | 0.0000 |
| 4 | 27168 | 0.0006 | 0.0002 | 0.0169 | 0.9578 | 0.0245 |
| 5 | 7979 | 0.0001 | 0.0000 | 0.0000 | 0.0720 | 0.9279 |
注:n代表研究期内隶属各细碎化等级的县域总数量,下同。
3.3.2 空间马尔可夫概率转移
依据耕地细碎化的空间马尔可夫概率转移矩阵(表6)与分异格局(图11)可知:① 耕地景观细碎化发展存在显著的空间溢出效应,相同类型的状态转移因滞后类型不同而存在显著差异。具体地,与细碎化较高的县域为邻,其向上转移的概率将增大,且伴随邻域细碎度提高,其向高细碎度转移的可能性也将依次增加,如P23|1 =0.0079<P23|2 =0.0384<P23|3 =0.1084<P23|4 =0.1523<P23|5 =0.3685;相反,与细碎化较低的县域为邻,会促进其向下转移。② 邻域背景影响下,特定类型的细碎化状态保持也因空间滞后类型差异而不尽相同。具体地,低细碎度县域(如类型1~2)伴随其邻域细碎度提高其仍保持低细碎度的可能性依次降低,如P11|1 =0.9695>P11|2 =0.8727>P11|3 =0.7241>P11|4 =0.7079>P11|5 =0.4000;相反,高细碎度县域(如类型4、类型5)伴随其邻域细碎度提高其仍保持高细碎度的可能性依次增强。③ 耕地景观细碎化的类型演化具有显著的时空异质性。京津冀、山东半岛、长三角、珠三角等东部经济发达区是县域自身和其邻近县域耕地细碎化等级同时向上转移的集中分布区,表明这些区域耕地细碎化增强的空间溢出效应尤为显著,未来应尤其重视区域耕地景观的保护与管理。
表6 1990—2020年中国县域耕地景观细碎化的空间马尔可夫概率转移矩阵
Tab. 6
| t t+1 | 空间滞后 | n | 1 | 2 | 3 | 4 | 5 |
|---|---|---|---|---|---|---|---|
| 1 | 1 | 9705 | 0.9695 | 0.0305 | 0.0000 | 0.0000 | 0.0000 |
| 2 | 3415 | 0.0231 | 0.969 | 0.0079 | 0.0000 | 0.0000 | |
| 3 | 230 | 0.0000 | 0.0591 | 0.9322 | 0.0087 | 0.0000 | |
| 4 | 11 | 0.0000 | 0.0000 | 0.0909 | 0.9091 | 0.0000 | |
| 5 | 0 | 0.0000 | 0.0000 | 0.0000 | 0.0000 | 0.0000 | |
| 1 | 2 | 715 | 0.8727 | 0.1245 | 0.0028 | 0.0000 | 0.0000 |
| 2 | 11917 | 0.0095 | 0.9521 | 0.0384 | 0.0000 | 0.0000 | |
| 3 | 4860 | 0.0000 | 0.0430 | 0.9467 | 0.0103 | 0.0000 | |
| 4 | 384 | 0.0000 | 0.0000 | 0.0644 | 0.9349 | 0.0052 | |
| 5 | 11 | 0.0000 | 0.0000 | 0.0000 | 0.0909 | 0.9091 | |
| 1 | 3 | 29 | 0.7241 | 0.1725 | 0.1034 | 0.0000 | 0.0000 |
| 2 | 1513 | 0.0053 | 0.8863 | 0.1084 | 0.0000 | 0.0000 | |
| 3 | 16181 | 0.0002 | 0.0146 | 0.9519 | 0.0333 | 0.0000 | |
| 4 | 4908 | 0.0000 | 0.0002 | 0.044 | 0.9544 | 0.0014 | |
| 5 | 61 | 0.0000 | 0.0000 | 0.0000 | 0.0656 | 0.9344 | |
| 1 | 4 | 89 | 0.7079 | 0.2337 | 0.0584 | 0.0000 | 0.0000 |
| 2 | 92 | 0.0543 | 0.7717 | 0.1523 | 0.0217 | 0.0000 | |
| 3 | 1864 | 0.0048 | 0.0107 | 0.8718 | 0.1127 | 0.0000 | |
| 4 | 18409 | 0.0007 | 0.0003 | 0.0171 | 0.9708 | 0.0111 | |
| 5 | 967 | 0.0000 | 0.0000 | 0.0000 | 0.0601 | 0.9399 | |
| 1 | 5 | 5 | 0.4000 | 0.378 | 0.0220 | 0.2000 | 0.0000 |
| 2 | 15 | 0.0000 | 0.6315 | 0.3685 | 0.0000 | 0.0000 | |
| 3 | 31 | 0.0000 | 0.0032 | 0.8700 | 0.1268 | 0.0000 | |
| 4 | 3456 | 0.0006 | 0.0000 | 0.0035 | 0.9853 | 0.0706 | |
| 5 | 6940 | 0.0001 | 0.0000 | 0.0000 | 0.0568 | 0.9431 |
图11
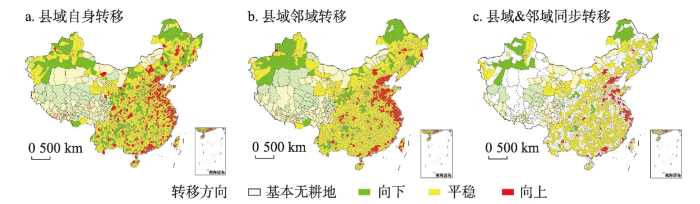
图11
1990—2020年中国县域及其邻域耕地景观细碎化类型转移的空间格局
Fig. 11
Spatial pattern of farmland landscape fragmentation type transfer in counties and their adjacent areasin China from 1990 to 2020
3.3.3 中国耕地景观细碎化时空演变趋势预测
以3.3.1节、3.3.2节的概率转移结果为基础,基于全样本测算县域耕地细碎化等级类型转移的未来稳态分布(图12)。同时,针对3.1节中黄淮海平原区、长江中下游地区、东北平原区、四川盆地及周边地区等粮食主产区耕地细碎化时空演变的突出性,深入探讨上述农业区耕地细碎化发展的未来趋势差异。
图12
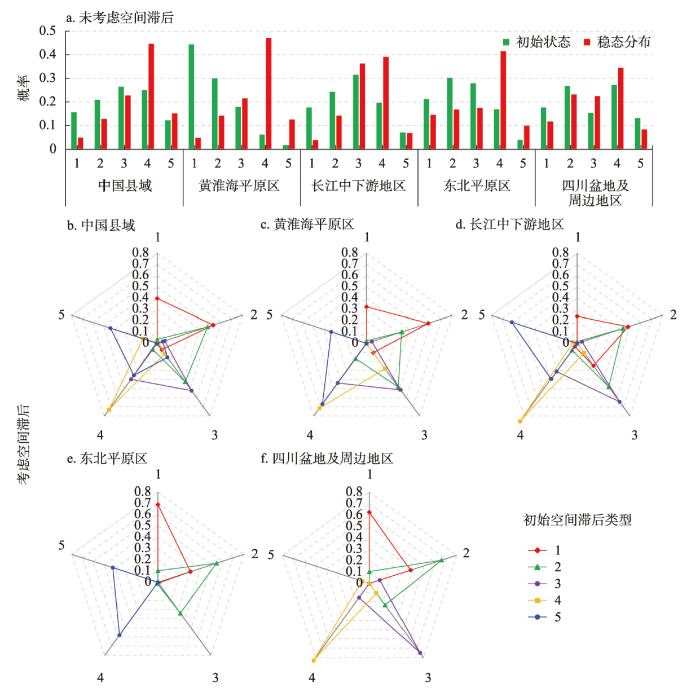
图12
中国及典型粮食主产区县域耕地景观细碎化类型转移的趋势预测
注:五边形顶点代表耕地景观细碎化到达稳态时的等级类型;彩色多边形代表该稳态分布时不同等级类型的概率分布。
Fig. 12
Prediction on the evolutionary trend of farmland landscape fragmentation type transfer at county level in China and typical grain-producing areas
在不考虑空间滞后的情况下,与初始状态(即1990年)相比,中国耕地景观细碎化在稳态分布时处于类型1~5的县域将分别达到4.84%、12.77%、22.69%、44.56%、15.14%。在粮食主产区层面,黄淮海平原区、长江中下游地区、东北平原区、四川盆地及周边地区耕地景观细碎化的未来稳态也将遵循与上述中国县域相似的类型结构演变规律,稳态分布时四区处于类型1~5的平均县域占比分别为8.69%、17.03%、24.42%、40.49%和9.37%。尤其是,黄淮海平原区隶属类型1~5的县域占比将分别达到4.72%、14.19%、21.49%、47.07%、12.53%,将成为类型1~2县域减少幅度最大,类型4~5增幅最大的农业区。可见,无论是中国县域全域还是典型粮食主产区,耕地景观细碎化的长期演变将遵循由低向高渐次递增的发展过程,低、较低等级细碎度县域将大幅减少,较高、高等级的县域将明显增加,细碎化增强态势较显著。
在考虑空间滞后的影响下,针对全国层面,当与低、中细碎化县域(类型1、类型2或类型3)为邻时,耕地细碎化的稳态将继续保持低、中水平(类型1~3)或顺次向上递增一级(类型2~4),两种稳态的县域数量在类型1~3邻域背景下的累计占比将分别达到92.28%、89.67%和91.95%;与高细碎化县域(类型5)相邻,其长期演变将逐渐形成较高、高水平集聚(类型4~5)的偏“双峰”式分布,累计占比高达79.31%。在粮食主产区层面,黄淮海平原区在维持相应邻域状态的稳定性上较全国水平有所降低,但在低、中细碎度邻域背景下的向上稳态与较高、高细碎度邻域背景下的向下稳态均显著高于相同邻域背景的全国极限分布。例如,当与类型1相邻时,黄淮海平原区未来处于类型1、类型2的县域占比将分别达到32.30%、57.42%,前者低于全国层面的39.77%,后者高于全国层面的52.51%。与之相反,东北平原区、四川盆地及周边地区耕地细碎化的长期演变表现出维持相应邻域状态的更高稳定性,同时,向上稳态显著低于、向下稳态显著高于全国极限分布。
4 讨论
4.1 不确定性分析
尽管学界对耕地景观细碎化的内涵理解已达成初步共识(2.1部分),但也有学者倡议应将道路、沟渠、田坎等精细要素纳入其内涵范畴。为此,本文分析了耦合上述精细要素前、后中国耕地景观细碎格局的变化及其原因。
将农村道路、沟渠、田坎等精细要素集成为“设施完备度”,探讨将耕地细碎化分析框架由当前侧重耕地景观自身的“资源规模性、空间集聚性、形状规整性”调整为统筹考虑“资源规模性、空间集聚性、形状规整性、设施完备度”耦合视域下中国耕地景观细碎格局的变化。鉴于本文研究时段较长、空间范围较广,上述精细要素在当前依托卫星影像,基于训练样本、图形编译等技术手段生成且共享的土地利用数据产品中均难以实现有效刻画和提取,需依托无人机航拍、土地调查等技术手段获取高精度数据支持,但在实践应用中面临数据获取难度大、成本高、覆盖空间范围小、时序短等诸多挑战,尤其对面向国家尺度、长时间序列的资源要素特征解析支撑作用相对有限。为此,以课题组前期数据积累为基础,针对特定年份,依托第二次全国土地调查数据(2011年)、江苏省土地利用变更调查数据(2014年)、四川省第三次全国土地调查数据(2020年),对中国、四川省、江苏省县域尺度融合上述精细要素前、后的耕地景观细碎化格局特征进行对比(图13)。结果发现,无论是对中国全域还是典型省域,农村道路、沟渠、田坎等精细要素的引入的确在一定程度上细化了耕地景观细碎化的格局分异特征,但仅在局域存在细微差异,且这些差异在一定程度上也受到数据来源、数据生产技术手段、数据精度等不同的影响。
图13
图13
中国(2011年)、四川(2020年)、江苏(2014年)耦合精细要素前后县域耕地景观细碎格局对比
注:依据3.2节,县域是揭示中国耕地景观特征的关键尺度,故仅对该尺度下的耦合结果进行空间可视化展示。
Fig. 13
Comparison of spatial pattern of farmland landscape fragmentation at county scale in China (2011), Sichuan province (2020), and Jiangsu province (2014) before and after integrated facility construction
引入精细要素并未导致耕地景观细碎格局发生重大变化的原因在于耕地细碎化是包含微观产权细碎与中宏观景观格局细碎两种形态的复合体系[5,11,17],二者在研究视角、分析对象等方面存在巨大差异。其中,前者多立足农户视角,以农户经营的“耕作田块”为分析对象[12,31],强调因产权主体细分导致的田块权属分散现象;后者立足景观视角,以中宏观区域的“耕地图斑”为分析对象[4,17],更关注区域耕地在资源规模、空间分布、边界形状等方面的景观形态特征。由于“耕作田块”是农户实践应用中为便利其生产且清晰界定权属范围,通过修筑沟渠、田间道、田坎等途径对“耕地图斑”细分、切割而成[17,32](图14),导致上述精细要素对耕地细碎化的影响也具备较明显的尺度依赖[1,12,19,31,33 -34,36],表现为其对中宏观区域尺度耕地景观细碎化地域分异格局的影响微弱甚至不显著,但对微观农户尺度的产权细碎化影响显著。例如,大量研究证实上述精细要素对江苏省[1]、常州市[33]、上海市[34]等区域尺度的耕地景观细碎化均无显著影响,但对贵州省亚鱼村[12,31]、重庆市潼南区柏梓镇水头社区[35]、江苏宝应县小官庄镇某高标准基本农田整治项目[19]、广西龙州县弄农屯[36]等农户尺度的产权细碎化影响显著,且引入道路、沟渠、水系等能显著提高产权细碎化测度精度。可见,基于实证计算、相关成果佐证等途径均证实精细尺度下的线状地物、农业设施等对中宏观区域尺度耕地景观的整体格局特征影响较小。因此,本文能反映中国耕地景观发展的细碎格局、时空过程及其演变趋势。
图14
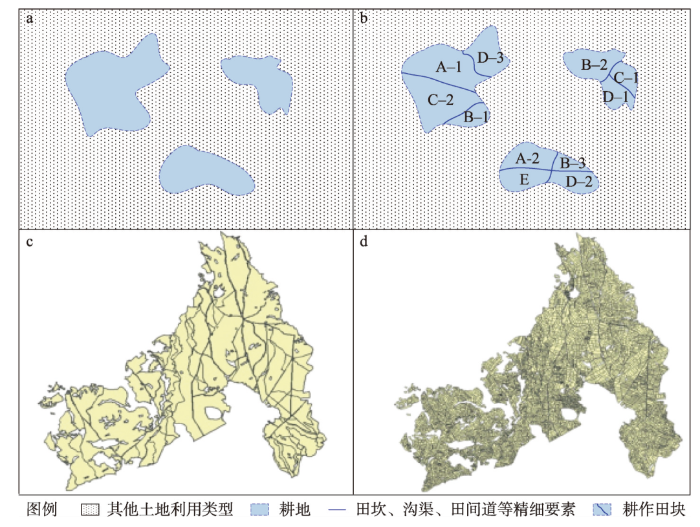
图14
“耕地图斑”与“耕作田块”示意
注:图a~b描述了耕地图斑与耕作田块的空间关系及形态变化,其中,A~D代表不同农户,1~4表示隶属不同农户的地块及编号;图c~d数据源自文献[32],分别示意了依托高分辨率遥感影像、土地调查等手段获取的地理空间数据库中的耕地图斑、耕作田块。
Fig. 14
Conceptual diagram of cultivated land patches and plots
4.2 中国耕地景观细碎化特征演进的原因剖析
1990—2020年中国耕地景观细碎化呈增强态势,但随时间推移增速变缓,并在黄淮海平原、长江三角洲、珠江三角洲等地区形成增强高值区,而黄土高原、云贵高原、内蒙古高原、青藏高原等西部地区耕地细碎度的减弱趋势明显。上述时空特征充分体现了中国社会经济转型对耕地景观格局的影响以及为缓解或强化这些影响在耕地利用与保护制度、农业发展路径与政策、资源利用模式等方面做出的调适和优化。
20 世纪90年代以来,国家相继实行占用耕地与开发、复垦挂钩政策并积极推进土地整理。在此背景下,1990—2000年中国耕地增加2.83×10⁶ hm2 [26],但建设扩张导致的耕地空间分布离散、形状分割等仍使耕地景观细碎化的整体水平呈现一定提高。2000年以后,中国城镇化进入加速提档期,城乡建设占用耕地的速率与规模激增[26],且新增建设用地多以插花、无序、分散的方式分布在连续耕地中[13],导致农田景观细碎现象突出。同时,黄淮海、长三角、东南沿海等地区始终是建设占用耕地的热点区域,导致区域耕地规模减少、空间集聚度降低、形态规整度减弱,耕地景观细碎度高幅增长。相比之下,受绿洲农业发展、未利用地垦荒等政策影响,黄土高原、云贵高原、内蒙古高原等西部地区的耕地资源规模呈一定增加[10],且新增耕地多集中在地势低缓的平原地带[9],空间分布相对集聚且形状规整,一定程度上促进了区域耕地景观细碎度下降。2010年以来,中国建立了基于“18亿亩耕地红线、15.46亿亩永久基本农田、10.58亿亩‘两区’面积和10亿亩高标准农田”的综合性耕地资源保障体系[37],为严守耕地数量平衡和布局稳定、促进耕地集中连片和高效利用提供了有力支撑。同时,国家相继出台系列政令法规鼓励土地流转和农地适度规模经营,为缓解耕地细碎态势、提高农业效率发挥了重要作用。此外,决策者先后采取城乡建设用地增减挂钩、低丘缓坡荒滩等未利用地开发试点等政策措施,力图保障建设用地有效供给的同时减少良田占用,缓解土地空间矛盾[38]。在系列资源管理政策和改革措施的推动下,尽管2010年以后中国耕地景观细碎度总体增强的态势仍在继续,但增幅已由2000—2010年的2.60%锐减至0.03%,并在2017年以后呈现出明显的减弱态势。
4.3 对中国耕地利用和管理的启示
细碎化作为中国耕地资源利用的典型特征,对资源利用、农业生产、景观生态等影响广泛且复杂,并通过多尺度全方位、差异性和不确定性、交互式级联传导等作用路径成为影响耕地可持续集约利用的核心和关键[11]。而本文结果表明,1990—2020年中国耕地利用不仅经历了持续、多维的细碎化过程,呈现出广泛、普遍的细碎化发展格局,还在资源规模、空间分布、边界形状等方面面临着多元化的潜在威胁,这为当前乃至未来中国耕地利用与管理政策的制定、调整及优化提供了关键着力点,即中国耕地保护需从当前单纯的资源供给保护向资源供给、格局优化、利用提升协同保护转变,构建由全局到局域的耕地保护系统观。主要包括:① 坚守耕地数量红线,筑牢耕地保护及边界控制的空间基底。仍需坚定贯彻和落实耕地占补平衡、永久基本农田划定等基本耕地保护制度,确保耕地资源供给处于绝对安全空间。② 坚持数量管控与格局优化并重,促进耕地集中连片亦应成为耕地保护的重要方向。一方面,需深入推进国土综合整治,通过农用地整治、农村建设用地整理等统筹规划耕地、居民点、道路等生产要素空间布局[1],为促进耕地集中连片分布、推进规模化经营创造条件。另一方面,有关耕地格局管控的目标要求、措施路径、奖惩策略等应在国家相关政令法规中明确体现并强化,尤其严令杜绝和禁止非农建设、城镇扩张等对连片耕地的空间挤占与分割,切实保护耕地资源的空间完整性。③ 高度重视粮食主产区耕地资源的监测、保护及管理。需充分利用现代信息技术、高空遥感技术以及云技术等,针对违法占用、空间肆意分割等威胁耕地景观完整性问题,建立快速精准的全方位耕地利用动态监测系统,实时获取其空间变化信息。同时,结合空间规划、政策设计等行政手段,加强法律法规对粮食主产区耕地利用的行为约束,多手段、多途径遏制其耕地细碎化态势。
5 结论
以理论认知—多维评价—时空演化—趋势预测为主线,本文探讨了1990—2020年中国耕地景观细碎化在国家、农业区、省域、市域、县域5级尺度上的动态变化特征及未来发展趋势。结论如下:
(1)中国耕地景观细碎化的格局特征具有明显的尺度差异,细碎化指数在省域呈由东向西、自东北至西南逐级提高的同心圆圈层式结构,在市域依托“胡焕庸线”形成“双核心—环核群—带状区”分异格局,在县域则以地势三级阶梯分界线成梯状分布。总体上,耕地景观细碎化的区域差异随空间尺度上升而减小,尺度越小,越能反映其空间异质特征。
(2)1990—2020年中国耕地景观细碎化呈增强态势,但随时间推移增速减缓,且不同时段下导致细碎化增强的耕地景观特征表现并非相同。其中,1990—2000年主要由耕地空间分布日趋离散和边界形状越发不规整所致,2000—2010年是耕地在资源规模、空间分布、边界形状等方面均趋向细碎的多维驱动过程,2010—2020年则是耕地资源规模细碎与空间分布细碎双维驱动。其中,2000—2010年是耕地景观细碎化发展最为剧烈的时期。
(3)1990—2020年中国不同尺度下耕地景观细碎化时空演变的格局、趋势、强度等存在较大差异。其中,在省域呈沿东部海岸带分布、北起辽宁、南至广西、西延四川的北—南向与东—西向交汇“T”型增强,西南、西北及北方干旱半干旱地带减弱;在市域表现为“东增西减”;在县域则呈现“一片区、一组团、五聚点”的时空演变格局。黄淮海平原、长江中下游平原中东部及四川盆地等地区是1990—2020年中国耕地景观细碎化增强的高值集聚区,增幅多高于16.90%;黄土高原、云贵高原、内蒙古高原等西部地区耕地细碎化减弱趋势明显,平均降低6.97%。
(4)中国耕地景观细碎化的长期发展将遵循由低向高渐次递增的演变过程,低、较低等级细碎度县域将大幅减少,较高、高等级的县域将明显增加。邻域背景对耕地细碎化的动态演进发挥重要作用,特定类型的细碎化状态保持、不同类型的状态转移皆因空间滞后类型的不同而存在显著差异。
参考文献
Influential factors and classification of cultivated land fragmentation, and implications for future land consolidation: A case study of Jiangsu province in eastern China
Farmland fragmentation concourse: Analysis of scenarios and research gaps
Trends in land ownership fragmentation during the last 230 years in Czechia, and a projection of future developments
DOI:10.1016/j.landusepol.2017.06.030 URL [本文引用: 2]
Evaluation of cultivated land fragmentation and guidance of land consolidation at provincial level
DOI:10.13249/j.cnki.sgs.2019.05.013
[本文引用: 5]

The macro social security function of cultivated land resources and the livelihood maintenance function of micro farmers determine that the connotation and characteristics of the fragmentation of cultivated land are quite different in different spatial scales. In view of the fact that the connotation of cultivated land fragmentation is single, the spatial index measurement is limited, and few attention has been paid to the regional differences in land consolidation, such as the characteristics and spatial distribution of cultivated land resources. This study takes a case study in Jiangsu Province, and constructs an evaluation system of cultivated land fragmentation from aspects such as resource scale, spatial agglomeration and production convenience which based on the definition of spatial scale characteristics of the connotation of cultivated land fragmentation. The results show that: 1) The value of resource scale is generally low, showing a pattern of gradual decline from north to south in Jiangsu; The value of spatial agglomeration is generally high, but the regional differences are obvious, and the high value areas are mainly distributed in Xuhuai Plain and Lixiahe Plain; The value of convenience property was significantly higher in southern than that in central and northern of Jiangsu Province, and the regional differences are obvious; 2) At the township scale, the fractal dimension of cultivated land was coupled to form the index of cultivated land fragmentation in Jiangsu Province. The index showed a gradually increasing pattern from north to south under the provincial scale, which was characterized by the low value aggregation areas in the north and the high value aggregation areas in the southwest; 3) Combined with the characteristics of different attributes of cultivated land fragmentation, Jiangsu Province has been classified into six categories: the utilization efficiency improvement area, the intensive merging area, the facility reformation area, the scale circulation area, the resource optimization area and the comprehensive consolidation area. The study can provide a useful reference for identifying the problems of regional cultivated land resource, determining the key direction of land consolidation, and making the consolidation plans for the stage.
江苏省耕地细碎化评价与土地整治分区研究
DOI:10.13249/j.cnki.sgs.2019.05.013
[本文引用: 5]
在明确耕地细碎化内涵空间尺度特征的基础上,从资源规模性、空间集聚性和生产便利性3方面构建耕地细碎化空间测度体系,以江苏省为例,综合运用地理空间分析、数理统计分析等方法,开展了省域尺度耕地细碎化多维评价及相应的土地整治协同探讨。研究表明:① 江苏省资源规模属性值总体偏低,呈现苏北-苏中-苏南逐级递减的分异格局;空间集聚属性值总体较高,但区域差异明显,高值区主要集中在徐淮平原及里下河平原地区;利用便利属性值总体呈现与资源规模及集聚状况相反的格局特征,苏南明显高于苏中和苏北地区,两极分化明显,地域差异较大;② 在乡镇尺度对各分维属性进行耦合形成江苏省耕地细碎化指数,省域尺度下该指数呈现从北到南逐渐增加的格局特征,表现为北部的低值聚集区和西南部的高值聚集区;③ 基于区域耕地细碎化不同属性特征的层次组合特点,全省可划分为利用提升区、集约归并区、设施改造区、规模流转区、资源优配区和综合整治区6种类型分区,据此提出不同分区土地整治的主要整治方向及关键问题。
Impact of cultivated land fragmentation on spatial heterogeneity of agricultural agglomeration in China
DOI:10.1007/s11442-020-1800-1
[本文引用: 9]
Systematically revealing the impact of cultivated land fragmentation (CLF) on the geographical agglomeration pattern of agricultural specialization (AS) has positive significance for national agricultural production management. Based on the data of the second national land survey and agricultural production, this study has explored the impact of CLF on spatial heterogeneity of agricultural agglomeration in China by comprehensively using the Theil index, ordinary least square model and geographically weighted regression. Results showed that: (1) the regional differentiation of the CLF in China is obvious, and the cultivated land fragmentation index is generally characterized by increasing pattern from northwest to southeast. (2) Spatially, the development level of AS in China has formed three high-value clusters in the Northeast China Plain, the Qinghai-Tibet Plateau, and the middle of the Middle-lower Yangtze Plain; and the low-value contiguous areas centered on the Yunnan-Guizhou Plateau and the Sichuan Basin and surrounding regions, with significant spatial differences. The contribution of grain crops, economic crops, and vegetables and melon to the level of AS was 74.63%, 9.09%, and 16.28%, respectively, and the pattern of agricultural geographical aggregation dominated by grain crops has primarily taken in shape. (3) CLF is significantly negatively correlated with AS, and every 1% increase in the degree of CLF will result in a decrease of about 0.2% in AS. However, the impact of CLF on the geographic agglomeration of different crop categories or groups varies significantly. Among them, CLF has a prominent impact on the specialization level of grain crops and vegetables and melon. Each 1% increase in the CLF will reduce the specialization level of grain crops by 0.38%, and increase the level of vegetables and melon by about 0.22%. (4) According to the landscape characteristics of cultivated land, the degree of spatial division and agglomeration of cultivated land patches have a significant impact on the formation of geographical agglomeration pattern of AS, and the intensity and direction of influence show significant regional differentiation, while the patch size has no significant impact.
Land fragmentation and other determinants of agricultural farm productivity: The case of Estonia
DOI:10.1016/j.landusepol.2018.08.021 URL [本文引用: 2]
Changes in cultivated land loss and landscape fragmentation in China from 2000 to 2020
Cultivated land area and fragmentation are two crucial elements that influence food production in China. However, few studies have analyzed the fine-grained changes in both the area and the fragmentation of cultivated land from a national perspective. Using a 30 m annual land-cover dataset with the help of cultivated land area (CA) and a newly constructed coupling landscape fragmentation index (CLFI), this research identified the spatial distribution characteristics of both the area and the landscape fragmentation of cultivated land in Chinese counties and simultaneously analyzed the changes in the above two elements since the beginning of the 21st century. The results showed that the distribution pattern of CA in China’s counties was large in the north and small in the south. During the first two decades of the 21st century, the total CA of China decreased, but the decrease rate decreased from 2.91% in 2000–2010 to 0.41% in 2010–2020; in contrast, the CLFI of China showed an increasing trend, but the increase rate also decreased, from 4.06% in 2000–2010 to 0.51% in 2010–2020. Spatially, from 2000 to 2010, there was an obvious reverse distribution pattern between counties with large CA changes and those with large CLFI changes; however, this pattern became less obvious from 2010 to 2020. Urban expansion, sloping land conversion programs and other ecological protection programs, and land development and consolidation programs were major causes of changes in the CA and CLFI across China. The findings of this research provide a data basis and scientific support for the protection and large-scale utilization of cultivated land, where this information is necessary to ensure food security.
Essential fragmentation metrics for agricultural policies: Linking landscape pattern, ecosystem service and land use management in urbanizing China
Remotely sensed mapping and analysis of spatio-temporal patterns of land use change across China in 2015-2020
DOI:10.11821/dlxb202205002
[本文引用: 1]
The continuous remote sensing monitoring of land use/cover change at the national scale is of great scientific significance for land spatial planning and blueprint drawing of "Beautiful China" in the new era. Landsat 8 OLI, GF-2 and other satellite remote sensing data were used to develop the data of land use change across China during 2015-2020 and China Land Use/Cover Dataset in 2020 (CLUD 2020) by integrating remote sensing big data and expert knowledge-assisted human-computer interaction interpretation methods. Long time series land use dynamic database at a 30-m resolution in China was established at 5-year interval in the end of 1980s-2020. On this basis, the general trend, regional differences and main characteristics of land use change in 2015-2020 were revealed from national and regional scales. The research indicated that integrating vegetation cover change at a 30-m resolution and land change information generated by remotely sensed big-data cloud calculation into the expert human-computer interaction interpretation can effectively improve the efficiency of mapping and the accuracy of land use change detection. The overall accuracy of CLUD 2020 first-level type mapping reaches 95%. In general, the intensity of territorial development entered a stable state compared with 2010-2015. During the period, the cropland continued to decrease. Nationwide farmland was encroached by urban development and construction, paddy fields in Northeast China continued to decrease, and cultivated land in Xinjiang was reclaimed in the south and abandoned in the north. The built-up land continued to increase, showing a spatial pattern that "the expansion of built-up land changed from the agglomeration of coastal areas and mega and large cities in 2010-2015 to the surrounding sprawl of large, medium and small towns in the central and western regions in 2015-2020". Although the area of natural ecological land for forest and grass continued to decrease nationwide, the intensity decreased compared with 2010-2015. Under the continuous impact of climate change, the area of water in the Qinghai-Tibet Plateau increased significantly. The pattern of land use change is closely related to the national macro strategy for high-quality development during the "13th Five-Year Plan" period (2016-2020) and ecological civilization construction, as well as the impact of climate change.
2015—2020年中国土地利用变化遥感制图及时空特征分析
DOI:10.11821/dlxb202205002
[本文引用: 1]
持续地开展国家尺度土地利用/覆盖变化遥感监测对于新时代国土空间规划和“美丽中国”蓝图绘制具有重要的科学价值。本文采用Landsat 8 OLI、GF-2等卫星遥感数据,融合遥感大数据云计算和专家知识辅助人机交互解译方法,研发了中国土地利用变化(2015—2020年)和2020年土地利用现状矢量数据(CLUD 2020),建立了完整的30 a(20世纪80年代末—2020年)每隔5 a的30 m分辨率中国土地利用动态数据库。基于CLUD 2020数据,从全国和区域两个尺度揭示了2015—2020年中国土地利用变化的总体规律、区域分异和主要特征。研究表明:将遥感大数据云计算生成的30 m分辨率植被覆盖变化和地表类型变化检测信息融入到人机交互遥感解译方法,可有效地提高大范围土地利用变化遥感制图的效率和变化图斑辨识的准确性;精度评价表明,CLUD 2020一级类型制图的综合精度达95%。总体上,全国范围内国土空间开发强度与2010—2015年比较进入相对稳定状态。期间全国耕地面积仍保持减少态势,空间分异特征为耕地南减北增,东北松嫩平原及其与三江平原交界区大规模的旱地向水田转移,西北新疆南部开垦和北部退耕/撂荒并存;全国城乡建设用地持续增加,空间分异特征表现为由以往的沿海地区和超大、大城市集聚转向中西部地区的大中小城镇周边蔓延为主。全国范围的林草自然生态用地面积持续减少,但强度与2010—2015年比较有所下降;受气候变化的持续影响,青藏高原地区的河流湖泊等水域面积显著增加。以上土地利用变化格局与“十三五”期间国家高质量发展、生态文明建设宏观战略和气候变化的影响密切相关。
Spatio-temporal patterns and characteristics of land-use change in China during 2010-2015
DOI:10.11821/dlxb201805001
[本文引用: 1]
Land use/cover change is an important theme on the impacts of human activities on the earth systems and global environment change. National land-use changes of China during 2010-2015 were acquired by the digital interpretation method using high-resolution remotely sensed images, i.e. the Landsat8 OLI, and GF-2 remote sensing images. The spatio-temporal characteristics of land-use changes across China during 2010-2015 were revealed by the indexes of dynamic degree model, annual land-use changes ratio, etc. The results indicated that built-up land increased by 24.6×10³ km2, while cropland decreased by 4.9×10³ km2, and the total area of woodland and grassland decreased by 16.4×10³ km2. The spatial pattern of land-use changes in China during 2010-2015 was concordant with that of the period 2000-2010. Specially, new characteristics of land-use changes emerged in different regions of China in 2010-2015. The built-up land in eastern China expanded continually, and the total area of cropland decreased, both at decreasing rates. The rates of built-up land expansion and cropland shrinkage were accelerated in central China. The rates of built-up land expansion and cropland growth increased in western China, while the decreasing rate of woodland and grassland accelerated. In northeastern China, built-up land expansion slowed down continually, and cropland area increased slightly accompanied by the conversions between paddy land and dry land. Besides, woodland and grassland area decreased in northeastern China. The characteristics of land-use changes in eastern China were essentially consistent with the spatial governance and control requirements of the optimal development zones and key development zones according to the Major Function-oriented Zones Planning implemented during the 12th Five-Year Plan (2011-2015). It was a serious challenge for the central government of China to effectively protect the reasonable layout of land use types dominated with the key ecological function zones and agricultural production zones in central and western China. Furthermore, the local governments should take effective measures to strengthen the management of territorial development in future.
2010-2015年中国土地利用变化的时空格局与新特征
DOI:10.11821/dlxb201805001
[本文引用: 1]
土地利用/覆被变化是人类活动对地球表层及全球变化影响研究的重要内容。本文基于Landsat 8 OLI、GF-2等遥感图像和人机交互解译方法,获取的土地利用数据实现了中国2010-2015年土地利用变化遥感动态监测。应用土地利用动态度、年变化率等指标,从全国和分区角度揭示了2010-2015年中国土地利用变化的时空特征。结果表明:2010-2015年中国建设用地面积共增加24.6×10<sup>3</sup> km<sup>2</sup>,耕地面积共减少4.9×10<sup>3</sup> km<sup>2</sup>,林草用地面积共减少16.4×10<sup>3</sup> km<sup>2</sup>。2010-2015年与2000-2010年相比,中国土地利用变化的区域空间格局基本一致,但分区变化呈现新的特征。东部建设用地持续扩张和耕地面积减少,变化速率有所下降;中部建设用地扩张和耕地面积减少速度增加;西部建设用地扩张明显加速,耕地面积增速进一步加快,林草面积减少速率增加;东北地区建设用地扩展持续缓慢,耕地面积稳中有升,水旱田转换突出,林草面积略有下降。从“十二五”期间国家实施的主体功能区布局来看,东部地区的土地利用变化特征与优化和重点开发区的国土空间格局管控要求基本吻合;中部和西部地区则面临对重点生态功能区和农产品主产区相关土地利用类型实现有效保护的严峻挑战,必须进一步加大对国土空间开发格局的有效管控。
Influence mechanism of cultivated land fragmentation on sustainable intensification and its governance framework
DOI:10.11821/dlxb202211002
[本文引用: 5]
Scientifically regulating cultivated land fragmentation (CLF) to make sustainable intensification conducive to and adaptive to the local contexts is the goal of long-term efforts in the research and practice of CLF governance. Starting from the theoretical connotation of CLF and sustainable intensification of cultivated land use (SICLS), this study analyzed the theoretical mechanism of CLF affecting SICLS, and then attempted to construct a sustainable intensification-oriented CLF governance framework from the coupling perspective of "feature-influence-environment", and systematically discussed key issues, scenario decision-making mechanisms, spatial scale effects and operating mechanisms in CLF governance. The results show that: (1) CLF is a composite system covering multi-dimensional attributes such as resources, space, utilization and ownership, which has extensive and complex impacts on resource utilization, agricultural production, and landscape ecology, etc. CLF has become the core factor affecting SICLS through action pathways such as multi-scale and omni-direction, difference and uncertainty, and interaction. (2) The situation and extent to which CLF becomes a problem or a benefit depends on its impacts, the local contexts of physical geography, agroecology, social economy, etc., and the orientation of agricultural development. (3) The CLF comprehensive governance framework from the perspective of "feature-influence-environment" deconstructs five key issues, two relationships, two tendencies and three-level spatial scale interconnection mechanisms in complex CLF scenarios. This framework can provide new ideas for scientifically judging the governance orientation of CLF and optimizing the governance model, which is beneficial to improving the governance system of CLF and promoting the SICLS.
耕地细碎化对可持续集约利用的影响机理与治理框架
DOI:10.11821/dlxb202211002
[本文引用: 5]
科学调适耕地细碎现象使其益于耕地可持续集约利用且与环境背景相适应是细碎化治理研究及实践长期努力的目标。从耕地细碎化与耕地可持续集约利用的理论内涵出发,剖析细碎化影响耕地可持续集约利用的理论机理,构建面向可持续集约利用的耕地细碎化“特征—影响—环境”综合治理分析框架,探讨细碎化治理中的关键问题、情景决策机理及空间尺度效应,希冀为优化细碎化治理提供理论借鉴。结果表明:① 耕地细碎化是涵盖资源、空间、利用及权属等多维属性特征的复合体系,对资源利用、农业生产、景观生态等影响广泛且复杂,并通过多尺度全方位、差异性和不确定性、交互式级联传导等作用路径成为影响耕地可持续集约利用的核心和关键。② 耕地细碎化本身并不具备明显的问题/价值倾向,其成为问题或有益的情形和程度取决于其影响及当地自然地理、农业生态、社会经济等环境背景及农业发展定位。③ 以细碎化特征表现为基础,以其对耕地可持续集约利用多维影响为依据,以其与地方环境背景相适应为准则的耕地细碎化“特征—影响—环境”综合治理框架通过解构复杂细碎化情景治理决策中的5个关键问题、两个关系、两个倾向及3级空间尺度互联互通机理,为从多维度、复合视角科学诊断细碎化治理导向、优化治理模式提供新思路,有益于完善细碎化治理体系、促进耕地可持续集约利用。
Cultivated land fragmentation in mountainous areas based on different resolution images and its scale effects
DOI:10.11821/dlyj020190863
[本文引用: 6]
Studying the scale effect of cultivated land fragmentation is of great significance for remote sensing monitoring, remediation and sustainable use of cultivated land in mountainous areas. This paper selects three types of typical landforms with different geomorphological backgrounds as the case area, namely, Sunjia village in the dam area, Yayu village in the hilly area and Xiaoba village in the mountain area. The fragmentation measurement model is constructed to quantitatively analyze the scale effect of the degree of cultivated land fragmentation at the five resolutions of 0.1 m, 1 m, 2 m, 5 m and 10 m in Guizhou mountainous areas. The main conclusions are as follows: (1) with the decrease of image resolution, the characteristics of cultivated plots under different landscapes have obvious scale effects. (2) There are differences in the degree of cultivated land fragmentation under different geomorphological backgrounds. The fineness of the hilly area is the highest, followed by the dam area, and the mountain area is the lowest. The degree of cultivated land fragmentation at different image resolutions has obvious scale effect, and the index of cultivated farmland fragmentation in all the three typical villages show a power function decline. In addition, the degree of cultivated farmland fragmentation with different geomorphological backgrounds is different in response to scale changes. The grain size response of cultivated land in the dam area is the strongest, followed by the hilly area and that of the mountain area is the weakest. (3) With the previous scale as a reference to calculate the loss accuracy, the degree of cultivated land fragmentation in the dam and hilly areas is the most sensitive when the image resolution is changed from 2 m to 5 m, while the sensitivity of the mountain area to the scale change is increasing. When the basic scale is used as the reference, the degree of cultivated land fragmentation in the hilly area is the most sensitive to the scale change, followed by the mountain area, and the lowest is in the dam area. The study aims to provide reference for the investigation, evaluation and treatment of cultivated land fragmentation in mountainous areas.
基于不同分辨率影像的山区耕地细碎化评价及其尺度效应
DOI:10.11821/dlyj020190863
[本文引用: 6]
研究耕地细碎化的尺度效应对山区耕地细碎化遥感监测、耕地整治与可持续利用具有重要意义。选取贵州省坝区孙家村、丘陵区亚鱼村和山地区小坝村3个不同地貌背景的典型村为案例区,在构建细碎化测度模型基础上,量化分析0.1 m、1 m、2 m、5 m、10 m分辨率下耕地细碎化程度的尺度效应。研究结论:① 随着影像分辨率下降,不同地貌背景下的耕作地块特征有明显的尺度效应。② 不同地貌背景下的耕地细碎化程度存在差异,丘陵区的细碎化程度最高,坝区次之,山地区最低。不同影像分辨率下的耕地细碎化程度具有明显的尺度效应,3个典型村的耕地细碎化指数均呈现幂函数式下降;且不同地貌背景的耕地细碎化程度对尺度变化响应程度不同,坝区的耕地细碎化粒度响应最为强烈,丘陵区次之,山地区最弱。③ 以前1个尺度为参照计算耕地细碎化程度的损失精度时,坝区和丘陵区的耕地细碎化程度在影像分辨率由2 m变为5 m时最敏感,山地区小坝村对尺度变化的敏感度从2 m处呈现升高趋势;以基础尺度为参照时,丘陵区的耕地细碎化程度对尺度变化的敏感度最高,山地区次之,坝区最低。研究旨在为山区的耕地细碎化调查、评价以及治理提供借鉴。
Evolution of cultivated land fragmentation and its driving mechanism in rural development: A case study of Jiangsu Province
DOI:10.1016/j.jrurstud.2022.02.011 URL [本文引用: 7]
Spatio-temporal patterns and driving mechanism of farmland fragmentation in the Huang-Huai-Hai Plain
DOI:10.1007/s11442-022-1983-8
[本文引用: 3]
Exploring the spatio-temporal variations of farmland landscape patterns in a traditional agricultural region can provide scientific support for decision-making on sustainable rural land use and rural vitalization development. This study established a comprehensive evaluation index for farmland fragmentation with multiple aspects (dominance, integrity, aggregation, regularity, and connectivity) at the county scale. The goal was to identify the evolution of farmland fragmentation in the traditional agricultural region of the Huang-Huai-Hai Plain during 2000-2015 and investigate underlying drivers using panel data of 359 counties. Results showed an accelerating but fluctuating fragmentation pattern of the farmland landscape. The indexes of dominance, integrity, and aggregation of farmland decreased most sharply, while the index of connectivity increased. Furthermore, the evolution of the farmland fragmentation pattern showed significant spatio-temporal heterogeneity, which is similar to the trajectory of urbanization and land use transition. Farmland fragmentation in municipal districts also emerged earlier and was more severe than in county-level cities and counties. Factors influenced by advancing urbanization include the proportion of artificial land, population density, and proportion of primary industry; these factors drove the evolution of farmland fragmentation. In contrast, the increase in income of rural residents and production efficiency of farmland were the key factors contributing to the improvement in farmland connectivity.
The impact of land fragmentation on farmer's chemical fertilizer use efficiency
DOI:10.31497/zrzyxb.20191216
[本文引用: 2]
In the background that China strongly advocated the chemical fertilizer use reduction and zero growth, how to improve chemical fertilizer use efficiency by farmers has become a crucial issue. This paper measures the chemical fertilizer use efficiency from the perspective of technical efficiency and analyzes the influence direction and degree of land fragmentation on the chemical fertilizer use efficiency through regression analysis and Shapley value framework based on R2. The results show that: (1) The technical inefficiency is high in the use of chemical fertilizers. In the case of other inputs such as unchanged labor and land, about 52.51% of fertilizer input can be reduced with no effect on the yield. Therefore, this could sufficiently achieve the aim of fertilizer reduction with no effect on the yield by improving the management level of farmer's fertilizer use. (2) The land fragmentation has a significant negative impact on chemical fertilizer use efficiency. All other factors being equal, each block of land increase could lead to a fertilizer use efficiency decrease of 0.002. This conclusion is robust to different variable definitions, estimating methods and winsorized sample. In addition, the Shapley value decomposition result shows that land fragmentation is also an important reason for low chemical fertilizer use efficiency of Chinese farmers. On the whole, land fragmentation can conduct 12.15% of farmer's chemical fertilization efficiency variance which is fourth in all the factors only next to village dummy variables, paddy field ratio and food crop planting ratio. Moreover, the contribution of the land fragmentation to chemical fertilizer use efficiency difference is stronger in the western region where the fragmentation is relatively high. (3) The difference in the chemical fertilization efficiency mainly depends on local village characte-ristics and the characteristics of production and management including the management scale, plantation structure, land quality, and whether or not to join the cooperative. However, the explanation of farmer's individual characteristics influenced by collective decision to chemical fertilizer use efficiency is relatively weak.
耕地细碎化对农户化肥使用效率的影响
DOI:10.31497/zrzyxb.20191216
[本文引用: 2]
在国家提倡化肥使用零增长、减量化的背景下,如何提高农户化肥使用效率变得至关重要。论文从技术效率角度衡量化肥使用效率,使用回归分析和基于R<sup>2</sup>的夏普里值分解方法考察了耕地细碎化对农户化肥使用效率的影响方向及程度。结果表明:(1)农户在化肥使用上存在着较高的技术无效率,在保持劳动力、土地等其他要素投入数量不变的情况下,约52.51%的化肥投入可以削减且不影响产出。通过提高农户对化肥的使用和管理水平完全可以做到化肥减量而作物不减产。(2)耕地细碎化对农户化肥使用效率具有显著负影响,是导致农户化肥使用效率低下的一个重要原因,能够解释农户间化肥使用效率差异12.15%,在所有决定因素中位居第四,仅次于村虚拟变量、水田比例和粮食作物种植比例。而且,在细碎化程度越高的西部地区,耕地细碎化对农户化肥使用效率差异的贡献越强。(3)农户在化肥使用效率上的差异主要源于所在村特征和包括经营规模、种植结构、土地质量、是否加入合作社等因素在内的生产经营特征的不同;而农户个体特征受集体决策影响,解释力较弱。
Spatiotemporal characteristics and influencing factors of landscape fragmentation of cultivated land in China
中国耕地景观细碎度时空变化特征及其影响因素
Theoretical explanation and research framework of cultivated land fragmentation in China
中国耕地细碎化的理论解析与研究框架
Land reform and land fragmentation in central and eastern Europe
DOI:10.1016/j.landusepol.2013.08.016 URL [本文引用: 1]
Multidimensional evaluation of the influence of agricultural land consolidation on the fragmentation of cultivated land: Method and demonstration
农用地整治对耕地细碎化影响的多维评价: 方法与实证
Applicability analysis of indices in assessment on effect of land consolidation on cultivated land fragmentation
土地整治对耕地细碎化影响评价指标适用性分析
A new framework of land use efficiency for the coordination among food,economy and ecology in regional development
Spatial-temporal changes and driving factors of the coordinated relationship among multiple land use effciencies integrating stakeholders' vision in eastern China
The methods of evaluation ecosystem quality: Ideal reference and key parameters
生态系统质量评估方法: 理想参照系和关键指标
Progressive landscape fragmentation in relation to cash crop cultivation
DOI:10.1016/j.apgeog.2014.06.002 URL [本文引用: 1]
The 30 m annual land cover dataset and its dynamics in China from 1990 to 2019
Spatiotemporal characteristics, patterns, and causes of land-use changes in China since the late 1980s
DOI:10.1007/s11442-014-1082-6 URL [本文引用: 3]
Spatio-temporal coupling evolution and zoning regulation of grain-to-arable value ratio and cropping structures in China
DOI:10.11821/dlxb202211003
[本文引用: 1]
Both the food production value on arable land and the structure of food crop cultivation have impacted on national food security. Therefore, exploring changes in their spatial and temporal coupling patterns can help us to understand their relationships and to further improve food security. In this research, we took provincial-level regions in China as the object, and based on an in-depth interpretation of the connotation of the grain-to-arable value ratio and cropping structure, Simpson's index model, coupling coordination model and spatial auto-correlation are comprehensively used to study the spatial and temporal evolution patterns of grain-to-arable value ratio and cropping structure in the study area from 2004 to 2020, and the spatial and temporal dynamics between them in different regions are revealed in consequence. The results show that: (1) The spatial distribution of the grain-to-arable value ratio in all the provincial-level regions from 2004 to 2020 shows a double-decreasing characteristic, one from north to south and the other from west to east; (2) The spatial pattern of cropping structure shows a Hu-Huanyong-line-ridge in terms of spatial distribution, where Northeast, North and East China witness a significant decrease in crop diversity; (3) The degree of coupling coordination between the grain-to-arable value ratio and cropping structure is found between barely coupled and coordinated and highly coupled and coordinated, showing regular spatial clustering characteristics. In the central, western and northeastern China, there is a high-high concentration with matching advantage; in the southeast coastal region, there is a low-low concentration for matching improvement; and the overall distribution presents a pattern of high in the northeast and central regions, and low in the southeast. The study believes that, based on the heterogeneous characteristics of the spatial concentration and diffusion of factors, the synergistic evolution of food quality and diversity on arable land should be encouraged according to the local conditions, so as to promote the harmonious development of food structure and efficiency.
中国粮耕价值比与种植结构时空耦合演化及分区调控
DOI:10.11821/dlxb202211003
[本文引用: 1]
耕地粮食产出价值与种植结构均深刻影响着国家粮食安全,探讨耕地粮食产出价值与种植结构的时空耦合变化,可理清两者关系,助力粮食安全保障能力的提升。本文以中国省级行政单元为研究对象,在深刻解读粮耕价值比和种植结构内涵的基础上,综合利用Simpson指数、耦合协调度模型和空间自相关等方法,分析2004—2020年中国粮耕价值比和种植结构耦合时空演化,以揭示其时空动态关系。结果表明:① 2004—2020年各省份粮耕价值比空间分布特征表现为“由北向南”和“由西向东”的双重递减态势;② 种植结构空间格局呈现由“胡焕庸线”沿线区域向两侧递减的空间分布形态,东北、华北和华东地区多样性递减明显;③ 粮耕价值比与种植结构耦合协调度介于勉强耦合协调与高度耦合协调之间,表现为规律性空间集聚,中西部及东北地区呈高高集聚,具有“匹配性优势”,东南沿海地区呈低低集聚,有待“匹配性改良”,总体表现为:“东北、中部高,东南部低”的态势。本文认为应依据要素空间集聚和扩散的分异特征,因区施策引导耕地粮食品质化与多元化协同演进,促进粮食结构与效益匹配发展。
Regional inequalities in China at different scales
DOI:10.11821/xb201208007
[本文引用: 2]
Analyzing regional inequality is of great significance to both academic enquiry and government policy. The recent literature on economic geography implies that scale has been playing a significant role in the economic geographical processes. Although regional inequality in China has also attracted tremendous scholarly interests since China started to implement policies of economic reforms in the late 1970s, the current work ignores the scalar effects in studying the regional inequality. With the increasing availability of data, this paper employs Coefficient Variance, Theil Index, spatial autocorrelation and scale variance based on the per capita GDP to examine the changing trends and spatial patterns of regional inequalities in China at four different spatial scales, i.e. region, province, prefecture and county. First, we use CV, Theil Index and Moran's I to explore the changing trends of regional inequalities in China and find that they all experienced increasing regional inequalities and significant spatial autocorrelation in regional development at all the four scales. Both of the prefecture and county levels have experienced a process of intensifying spatial autocorrelation. Second, with the scale variance and its component statistic techniques, we discover that there is an increasing sequence according to the scale variances and their components, i.e. county, prefecture, province and region, which indicates that the scalar variance is lower at the smaller scale and the regional inequality at smaller scale contributes more to the whole regional inequality. Third, by using spatial analysis techniques, we find that local spatial autocorrelation patterns have been stable since 1998. The HH type units tend to concentrate in the east coastal area of China. And the significant spatial autocorrelation is largely due to the concentration of LL clusters in central and western China. This paper also concludes that the regional inequality in China merits more investigation at the county level as the county unit is the most stable one in the history of China's regional administrative system.
基于不同尺度的中国区域经济差异
DOI:10.11821/xb201208007
[本文引用: 2]
采用变异系数、泰尔指数、空间自相关和尺度方差等统计方法从地带、省级、地级和县级4 个尺度对1998-2009 年中国区域经济差异进行测度和空间格局比较分析。① 差异测度研究表明, 自1998 年以来, 中国区域经济差异在4 个尺度上均表现出扩大的趋势;省级、地级和县级单元人均GDP具有显著的空间自相关性, 其中地级和县级人均GDP的空间自相关程度呈扩大趋势。② 尺度方差及其分解研究表明, 尺度方差及其构成大小依次排列均为县级、地级、省级、地带, 即尺度越小, 尺度方差越大, 对区域经济差异的贡献份额也越大。③ 空间格局研究表明, 不同尺度区域经济空间关联格局总体相对稳定, HH类型集聚区大多分布于东部沿海地区, LL类型在中西部地区的大规模集聚是不同尺度区域经济空间自相关性的主要原因;各尺度显著空间关联类型对总体空间自相关和区域经济差异的影响各不相同。
Spatial-temporal evolution and trend prediction of agricultural eco-efficiency in China: 1978-2016
DOI:10.11821/dlxb201811009
[本文引用: 2]
Based on the panel data of 30 provinces in China from 1978 to 2016, the super efficiency SBM model was used to measure the inter-provincial agricultural eco-efficiency in our study. On the basis of time series analysis and spatial correlation analysis, traditional and spatial Markov probability transfer matrices were constructed to explore the spatial and temporal evolution of agricultural eco-efficiency of China, and the long-term trends were also predicted. The result shows that: (1) The agricultural eco-efficiency in China presents a "double-peak" distribution with stable rise in fluctuation, and the gap between peak heights is narrowing, but the overall level is still relatively low. Therefore, there is still room for improvement in agricultural eco-efficiency. Besides, the agricultural eco-efficiency improvement in the eastern region is more significant than that in the central and western regions. (2) The trend of China's agricultural eco-efficiency shifting to a higher level is significant, but the evolution of agricultural eco-efficiency has maintained the stability of the original state, and it is difficult to achieve a leap-forward shift. The geospatial structure plays an important role in the spatial-temporal evolution of agricultural eco-efficiency and the spatial agglomeration is significant. The provinces with higher agricultural eco-efficiency have positive spillover effects, while those with lower agricultural eco-efficiency have negative spillover effects. As a result, the "club convergence" phenomenon of "high agglomeration, low concentration, high radiates low, and low inhibits high" has been gradually formed in the spatial pattern. (3) From the long-term trend prediction, the agricultural eco-efficiency in most provinces gradually shifts upward to a relatively high level, and gradually evolves from a low-to-high incremental pattern. In the context of the low agricultural eco-efficiency, its long-term stable evolution is manifested as a "partial unimodal" distribution; while under the geographical background of higher agricultural eco-efficiency, it has evolved into a "double-peak" distribution of higher-level agglomeration for a long time. Finally, we analyze the shortcomings and what needs to be improved for current research. What's more, we propose that controlling agricultural pollution emissions, inter-regional agro-ecological policy linkages, and strengthening inter-regional agro-ecological cooperation, exchange, and learning can effectively improve China's agricultural eco-efficiency and narrow the gap between provinces.
1978—2016年中国农业生态效率时空演变及趋势预测
DOI:10.11821/dlxb201811009
[本文引用: 2]
基于1978-2016年中国各省市面板数据,采用超效率SBM模型测算省际农业生态效率,在时间序列分析和空间相关性分析的基础上,构建传统和空间马尔可夫概率转移矩阵,探讨中国农业生态效率的时空动态演变特征,并预测其长期演变的趋势。研究发现:① 中国农业生态效率呈现出在波动中稳定上升的“双峰”分布特征,且波峰高度的差距在缩小,但整体仍处于较低水平,农业生态效率仍存在较大提升空间,东部地区农业生态效率提升较中西部地区更加显著;② 中国农业生态效率整体上向高水平方向转移的趋势显著,但农业生态效率的演变具有维持原有状态的稳定性,且较难实现跨越式转移。地理空间格局在农业生态效率时空演变过程中发挥着重要作用,空间集聚特性显著,农业生态效率较高的省市具有正向的溢出效应,而农业生态效率较低的省市具有负的溢出效应,从而在空间格局上逐渐形成“高高集聚、低低集聚、高辐射低、低抑制高”的“俱乐部收敛”现象;③ 从长期演变的趋势预测来看,多数省市农业生态效率逐渐向上转移为较高水平,并逐渐演变为由低到高渐次递增的格局,在农业生态效率较低的地理背景下,其长期演变的稳定状态表现为偏“单峰”分布,而在农业生态效率较高的地理背景下,其长期演变为较高水平集聚的偏“双峰”分布。最后,分析当前研究需要改进的方向,并提出控制农业污染排放量、地区间农业生态政策联动、加强地区间农业生态合作交流与借鉴等能够有效提升中国农业生态效率及缩小省市间差距。
Spatio-temporal evolution and trend prediction of urban carbon emission performance in China based on super-efficiency SBM model
DOI:10.11821/dlxb202006016
[本文引用: 1]
Climate change caused by CO2 emissions has become an environmental issue globally in recent years, and improving carbon emission performance is an important way to reduce carbon emissions. Although some scholars have discussed the carbon emission performance at the national scale and industry level, literature lacks studies at the city- level due to a limited availability of statistics on energy consumptions. In this study, based on China's city-level remote sensing carbon emissions from 1992 to 2013, we used the super-efficiency SBM model to measure the urban carbon emission performance, and the traditional Markov probability transfer matrix and spatial Markov probability transfer matrix are constructed to explore the spatio-temporal dynamic evolution characteristics of urban carbon emission performance in China for the first time and to predict its long-term evolution trend. The study shows that urban carbon emission performance in China presents a trend of steady increase in the fluctuation, but the overall level is still at a low level, so there is still a great improvement space in urban carbon emission performance, with huge potential for energy conservation and emission reduction. The spatial pattern of national urban carbon emission performance shows the characteristics of "high in the south and low in the north", and there is a significant difference in the level of carbon emission performance between cities. The spatial Markov probabilistic transfer matrix results show that the transfer of carbon emission performance type in Chinese cities is stable, thus it forms the "club convergence" phenomenon, and the geographical background plays an important role in the process of the transfer. From the perspective of long-term trend prediction, the future evolution of urban carbon emission performance in China is relatively optimistic. The carbon emission performance will gradually improve over time, and the distribution of carbon emission performance presents a trend of high concentration. Therefore, in the future, China should continue to strengthen research and development to improve the performance level of urban carbon emissions and achieve the national target of energy conservation and emission reduction. At the same time, neighboring cities with different geographical backgrounds should establish a sound linkage mechanism of economic cooperation to pursue coordinated development between economic growth, energy conservation and emission reduction, so as to realize low-carbon city construction and sustainable development.
基于超效率SBM模型的中国城市碳排放绩效时空演变格局及预测
DOI:10.11821/dlxb202006016
[本文引用: 1]
由CO<sub>2</sub>排放所引起的气候变化是当今社会所关注的热点话题,提高碳排放绩效是碳减排的重要途径。目前关于碳排放绩效的研究多从国家尺度和行业尺度进行探讨,由于能源消耗统计数据有限,缺乏城市尺度的研究。基于遥感模拟反演的1992—2013年中国各城市碳排放数据,采用超效率SBM模型对城市碳排放绩效进行测定,构建马尔可夫和空间马尔可夫概率转移矩阵,首次从城市尺度探讨了中国碳排放绩效的时空动态演变特征,并预测其长期演变的趋势。研究表明,中国城市碳排放绩效均值呈现波动中稳定上升的趋势,但整体仍处于较低的水平,未来城市碳排放绩效仍具有较大的提升空间,节能减排潜力大;全国城市碳排放绩效空间格局呈现“南高北低”特征,城市间碳排放绩效水平的差异性显著;空间马尔科夫概率转移矩阵结果显示,中国城市碳排放绩效类型转移具有稳定性,且存在“俱乐部收敛”现象,地理背景在中国城市碳排放绩效类型转移过程中发挥重要作用;从长期演变的趋势预测来看,中国碳排放绩效未来演变较为乐观,碳排放绩效随时间的推移而逐步提升,碳排放绩效分布呈现向高值集中的趋势。因此未来中国应继续加大节能减排力度以提高城市碳排放绩效,实现国家节能减排目标;同时不同地理背景的邻域城市之间应建立完善的经济合作联动机制,以此提升城市碳排放绩效水平并追求经济增长与节能减排之间协调发展,从而实现低碳城市建设和可持续发展。
The effect of farmland fragmentation on the intensity of farmland in different utilization ways
DOI:10.11867/j.issn.1001-8166.2020.011
[本文引用: 3]
The agricultural development of mountainous areas in China is undergoing the transformation from the traditional agricultural land use mode dominated by single and inefficient grain production to the new agricultural land use mode such as high-yield and efficient horticultural crops. The research on the impact of farmland fragmentation on the agricultural land intensity degree is the basis of agricultural modernization and land remediation in mountainous areas. Based on the UAV high-resolution remote sensing image data of two typical villages in Guizhou Province and the questionnaire survey data of farmers, using the road accessibility index of farmers' plot, the area index and the shape index to measure the degree of farmland fragmentation, we analyzed the impact of different degrees of farmland fragmentation on the traditional and new types of farmland use intensification. The research showed that the farmland fragmentation had a significant negative impact on the intensive degree of agricultural land, but the impact on the intensive degree of agricultural land in different ways of use was different. With the intensification of the degree of farmland fragmentation, the impact on the input and output of horticultural crops and other new-type agricultural land utilization was less than that of grain crops and other traditional agricultural land utilization. Adjusting agricultural structure and transformation of farmland utilization greatly alleviated the negative impact of farmland fragmentation on farmland intensity in mountainous areas.
山区耕地细碎化对不同利用方式农地集约度的影响
DOI:10.11867/j.issn.1001-8166.2020.011
[本文引用: 3]
我国山区农业发展正经历着从单一、低效的粮食生产为主的传统农地利用方式向高产、高效的园艺作物等新型农地利用方式转型,研究耕地细碎化对农地集约度的影响是山区农业现代化和开展土地整治的基础。基于贵州省2个典型村的无人机高分辨率遥感影像和农户调查数据,采用农户地块道路通达性指数、地块面积指数和地块形状指数3个指标测度耕地细碎化程度,并分析耕地细碎化对传统和新型两类农地利用集约度的影响。研究表明:耕地细碎化对农地集约度产生了显著负面影响,但对不同利用方式农地集约度影响程度存在差异;随着耕地细碎化程度的加剧,其对园艺作物等新型农地利用方式的投入、产出的影响均小于粮食作物等传统农地利用方式。大力调整农业结构和农地利用转型可缓解山区耕地细碎化对农地集约度的负面影响。
Application of high resolution remote sensing image in the feasibility stage of land consolidation projects
高分辨率遥感影像在土地整治项目可研阶段的应用
Farmland landscape fragmentation evolution and its driving mechanism from rural to urban: A case study of Changzhou City
DOI:10.1016/j.jrurstud.2021.01.004 URL [本文引用: 2]
Effect analysis of road structure on multidimensional fragmentation of cultivated land: A case study in the international metropolis of Shanghai city
Analysis of the characteristics and motivation of arable land fragmentation in Yuxi Hill District: Taking Shuitou Community in Bozi Town, Tongnan District as an example
渝西方山丘陵区耕地细碎化的特征及动因分析: 以潼南区柏梓镇水头社区为例
Farmer-dominated pattern land consolidation to solve arable land fragmentation and its effectiveness evaluation in Guangxi
广西农民自主型细碎化耕地归并整治模式及效果评价
Transformation of arable land protection in China: Objectives, approaches and policies
中国耕地保护转型: 目标、路径与政策
Evolution characteristics of slope spectrum and slope-climbing effects of built-up land in China
DOI:10.11821/dlxb202107013
[本文引用: 1]
The changes in the scale and structure of built-up land is the basis for spatial development and planning of the national territory. Previous studies mainly focused on the characteristics and patterns of the horizontal expansion of built-up land, but little attention has been given to the "three-dimensional" gradient characteristics and effects of built-up land (such as slope-climbing). Therefore, based on Google Earth Engine, this study, for the first time as far as we know, uses DEM and land use data to draw built-up land slope spectrums and calculates the average built-up land climbing index (ABCI). The gradient characteristics and laws of the slope climbing of China's built-up land from 1990 to 2018 at the national, regional, provincial, and urban scales are systematically analyzed and the various spatial effects are explored. The results show that: (1) From 1990 to 2018, the area of built-up land with slope angle above 5° in China increased by 1.43 times, and the proportion of the total built-up land area rose from 10.25% to 14.81%. Particularly, the 2010-2015 period witnessed the fastest and largest slope-climbing development of built-up land in China. Moreover, the slope-climbing intensities in the central and western regions are higher than that in other regions. (2) According to the average built-up land climbing index (ABCI) and the upper limited slope angle change (ULSC), the 34 provinces (autonomous regions and municipalities) in China can be divided into three types: high-climbing, low-climbing, and horizontally expanding. Among them, the number of high-climbing provinces accounts for more than 50% of the total. And seven horizontally-expanding provinces present the distribution characteristics of "southeast-northwest" in space. (3) Before 2010, the cities with slope-climbing phenomenon were mainly mountainous cities. However, ethnic minority settlements and low-hill and gentle slope development pilot cities became the main force for the slope-climbing of built-up land after 2010. (4) The slope-climbing of built-up land can reduce the occupation of plain arable land and ecological land by built-up land expansion to a certain extent, and thus alleviate the contradiction between supply and demand of build-up land. However, it is worth noting that development and construction without reasonable plans and bulldozing mountains to build cities driven by real estate can also lead to increased geological disasters and ecological risks.
中国建设用地的坡谱演化规律与爬坡影响
DOI:10.11821/dlxb202107013
[本文引用: 1]
城镇建设用地规模与结构变化是国土空间开发与规划研究的基础。以往相关研究更关注建设用地水平空间扩张格局特征与模式,极少关注建设用地三维梯度上的“爬坡”特征规律与影响。因此,本文基于Google Earth Engine(GEE),并结合高精度地形数据与土地利用数据,在建设用地坡谱概念基础上,首次构建了平均建设用地爬坡指数(ABCI),系统地分析了1990—2018年中国建设用地坡谱在国家、区域、省级和城市4个尺度上的变化特征与规律并深入剖析建设用地爬坡的空间影响。结果显示:① 1990—2018年中国坡度5°以上地区建设用地面积增长了1.43倍,比例由10.25%上升至14.81%。其中2010—2015年是建设用地爬坡发展最迅速与规模最大的时期,且中西部地区建设用地爬坡最为显著。② 依据平均建设用地爬坡指数与上限坡度变化,可将中国34个省(自治区、直辖市)划分为高爬坡型、低爬坡型和水平扩展型3类,其中高爬坡型省份占50%以上,水平扩展型省份仅有7个,在空间上呈现“东南—西北”的两极分布特征。③ 1990—2010年爬坡型城市以山地与丘陵地貌城市为主,2010年后少数民族聚居区及低丘缓坡开发试点城市成为建设用地爬坡的主力。④ 建设用地爬坡在一定程度上能够减少建设用地扩张对平原优质耕地与生态用地的胁迫和侵占,缓解建设用地供需矛盾,但是无规划约束的开发和房地产驱动的“削山造地”则会导致地质灾害和生态环境风险的增加。
