

1 引言
随着全球化和信息化的深入,城市间的要素联系和基础设施联系日益深入,“网络思想”被广泛用于分析全球、国家和区域尺度的城市体系问题。大量研究基于企业内和企业间联系探讨不同空间尺度上的城市网络联系[5⇓⇓⇓-9]。早期关于城市网络的研究围绕先进生产者服务业的空间组织分析企业内部在城市间的网络联系[5,10],Sassen[10]的“全球城市”理论描述了以全球城市为中心的跨国城市系统,其中先进生产者服务业在全球城市联系中发挥重要作用。Taylor等进一步基于跨国公司的企业内分支机构的联系构建了全球服务网络[5-6,11]。但这种基于APS企业内联系构建城市网络的方法难以全面反映城市网络的特点,大量的城市联系发生在企业之间或经济机构和非经济机构之间[7]。一些研究从各角度分析了企业间联系形成的城市网络,例如Pan等[9]以中国企业上市过程的服务联系为例刻画了城市网络及演化;Zhang等[12]分析了文化企业及先进生产者服务业企业之间的城市网络特征。这些研究从不同侧面反映了城市网络的多样化特征,有助于为城市体系的组织演化理论提供互补性的视角。
2 理论框架
专利申请是一个知识编码化的过程,专利代理服务机构通过与创新主体之间对技术信息与知识的反复沟通交流,凝练创新主体的创新方案,设计权利保护范围,从而实现专利质量和创新绩效的提升[18-19]。但知识产权服务很少被纳入城市网络研究的视野,当前对创新网络的研究较多地强调创新活动本身在城市间的合作关系[13-14,20],忽视创新产出的编码化和市场化过程。基于专利代理机构和创新机构形成的专利代理服务网络有助于将技术创新产出进行编码化和市场化[21]。这种服务网络可能发生在城市间和区域间,位于网络核心的城市不仅仅是知识流动和创新的重要节点,同时也是促进创新知识编码化和市场化的重要节点。这种由知识产权服务企业和创新活动之间形成的城市间的企业间联系可以从一个侧面体现创新的“流空间”[22]。
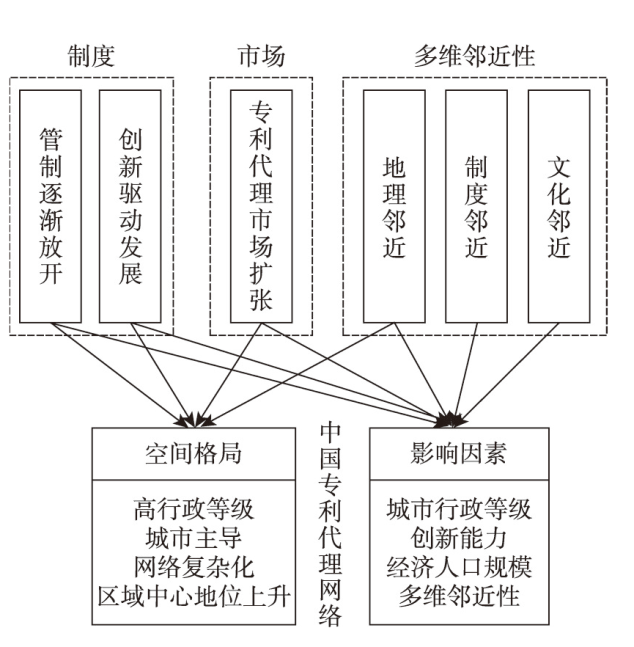
制度环境、市场规模和空间邻近性因素共同作用塑造专利服务网络格局及演化。从服务城市的角度,专利代理服务是受到行政管制的行业,政府监管对行业发展发挥重要作用;从被服务城市的角度,创新驱动发展的制度导向使得城市创新能力不断提升,中小城市的专利服务需求也不断增长,推动专利服务需求市场空间不断扩张;关系邻近性要求使得越来越多的专利服务交易发生在区域中心和地级市之间,区域中心城市的地位上升。
首先,城市行政等级影响专利代理机构的空间分布,从而影响专利服务网络。改革开放以来,专利代理机构经历了管制逐渐放松的过程。由于体制原因,中国专利代理机构在历史上一段时期内附属于行政机构或事业单位[23]。加入世贸组织后,中国开始实行社会中介机构与政府部门的脱钩改制工作,专利代理机构逐渐市场化,随着《国家知识产权战略纲要》颁布实施,专利代理机构市场主体地位进一步增强[1]。但是在经济转型过程中,知识产权管理体制深度影响专利代理机构的发展,特别是在职业资格考试、专利代理人资格审查、实施惩戒规则、行业协会管理等方面,政府监管仍然对行业发展发挥重要作用,行政等级高的城市享有更大的行业发展优势,但专利代理机构的市场化转型可能提升次一级的区域性中心城市在网络中的作用。
其次,市场规模影响专利服务网络格局。专利代理机构的服务对象是创新机构,城市创新产出和创新增长在一定程度上决定了城市的知识产权服务需求。创新活动高度集聚在创新资源丰富的东部地区大城市,进一步促进专利服务网络向高等级城市的集聚。另一方面,随着创新驱动发展战略的实施,中小城市的创新活动及专利服务需求不断增长,推动专利服务网络格局的复杂化。
创新导向的国家和区域政策以及专利代理的管制放松过程共同塑造了中国城市间专利代理服务网络格局。同时,市场规模变化和多维邻近性要求也不断推动专利代理服务网络格局演化。本文试图融合社会网络、城市等级及空间邻近性理论(图1),以专利代理服务为例探讨知识产权服务网络的时空演化过程以及影响因素。以国家知识产权局中2001—2018年中国城市发明专利的代理服务记录为基础,采用社会网络分析方法和计量模型,构建中国知识产权服务网络并分析其时空演化格局,揭示中国知识产权服务网络的空间布局模式、时空演化规律及影响机制。
图1
3 数据来源与研究方法
3.1 数据来源
本文选取国家知识产权局专利信息服务平台公布的发明专利及相应的专利代理服务数据构建中国知识产权服务关系数据库,字段包括专利号、申请人及地址、申请时间、专利代理机构名称及地址等信息,该信息能够反映知识产权服务的方向向量(专利代理机构—专利产出所在地)、时间和空间属性信息。
数据处理过程为:① 考虑到专利数据的可获得性和完整性,本文提取2001—2018年中国所有地级及以上行政单元的专利信息,最终获得1637163项发明专利信息。② 将专利所在地与专利代理服务所在地之间的关系转换为服务—被服务城市间的联系,用专利服务次数反映城市创新网络各节点的网络地位和联系强度。③ 为平滑专利申请的波动性的影响,将2001—2018年划分为每5年一个时间段,即2001—2005年、2006—2010年、2011—2015年、2016—2018年4个时间段分析知识产权服务空间格局的变化情况。由于2016—2018年申请的专利授权存在数据不全的情况,本文在前后两个时间段的比较分析中,采用2001—2005年和2011—2015年比较分析,在连续时间段的变化分析以及计量分析中,仍采用4个时段进行分析。
3.2 网络分析方法
借助Gephi、Cytoscape、ArcGIS等可视化软件,运用社会网络分析法从网络整体和具体节点两个层面,定量计算中国知识产权服务网络中的拓扑指标、节点关系并绘制其拓扑结构图、等级层次图和空间结构图。首先,以地级及以上城市为节点(N),以城市之间的专利代理服务为边(E),建立专利代理服务的加权非对称矩阵R,其中Rij为第i城市向第j城市提供专利代理服务的数量。该矩阵体现了网络关联和连接强度以及服务流向信息。其次,运用社会网络分析方法,基于有向加权网络,构建网络密度、加权度等指标刻画专利代理服务网络的复杂性(表1)。
表1 有向加权网络指标及含义
Tab. 1
| 指标 | 计算公式 | 公式解释 | 含义 |
|---|---|---|---|
| 网络密度 | 网络实际边数与最大边数的比值 | 网络整体的连接程度 | |
| 平均聚类系数 | 网络内节点与其相连点的实际边数与最大边数之比的平均值 | 反映网络整体的集聚程度 | |
| 平均度 | 各城市节点中存在专利代理服务关系的平均城市数 | 反映网络整体的连接程度 | |
| 加权出度 | 城市节点i提供的专利代理服务总量 | 反映网络节点的服务提供能力 | |
| 加权入度 | 城市节点i接受的专利代理服务总量 | 反映网络节点的服务需求量 |
注:L为网络有向边总数;N为网络节点总数;ei为与节点i相连的实际边数;Ei为与节点i相连的点的个数;Rij为城市节点i向城市节点j的连接关系;xij为城市节点i向城市节点j的连接关系;aij为城市节点i向城市节点j提供或接受的专利代理服务总量。
3.3 计量分析与变量选取
借鉴已有的研究[27⇓⇓⇓⇓-32],本文认为服务城市和被服务城市的行政等级、经济社会属性和关系属性影响专利服务联系网络。选取城市之间专利代理服务量作为因变量,并从城市行政等级、城市社会经济属性和城市关系属性等方面构建相应的解释变量和控制变量。其中,城市经济社会属性包括城市经济发展水平、城市人口规模、专利服务城市的金融要素发展程度、经济外向度、科技投入强度。其次,城市行政等级可能影响城市的专利服务,等级越高的城市其专利服务供给和需求越大,将直辖市赋值为2,副省级和省会城市赋值为1,其他城市赋值为0。再次,城市间的关系属性影响城市间的专利服务联系,其中地理邻近、经济发展水平的相似性、文化和制度邻近均影响城市间的服务关系[25]。因此,引入服务城市i和被服务城市j的地理距离衡量地理邻近性,采用1-服务城市和被服务城市的GDP之比衡量经济邻近性,引入是否属于同一人文地理综合区[33]衡量文化邻近度,采用是否属于同一省区衡量制度邻近度。具体变量及定义见表2。数据主要来自2001—2018年《中国城市统计年鉴》《中国区域经济统计年鉴》以及各省统计年鉴和国民经济社会发展统计公报。
表2 变量定义与解释
Tab. 2
| 变量名称 | 符号 | 指标解释 | |
|---|---|---|---|
| 被解释变量 | 专利代理服务提供量 | Serviceij | 服务城市i向被服务城市j提供的专利代理服务数量 |
| 解释变量 | 经济发展水平 | PGDPi | 服务城市i的人均地区生产总值 |
| PGDPj | 被服务城市j的人均地区生产总值 | ||
| 城市规模 | Popi | 服务城市i的年平均人口数 | |
| Popj | 被服务城市j的年平均人口数 | ||
| 科技投入程度 | Techit | 服务城市i的科学技术支出与地方一般公共预算支出之比 | |
| 经济外向度 | Fdiit | 服务城市i的实际利用外资额占GDP的比重 | |
| 金融要素发展程度 | Financei | 服务城市i的年末金融机构各项贷款余额与地区生产总值之比 | |
| 城市等级 | Hierarchyi | 服务城市i的城市等级,北京为3,其他直辖市为2,省会和副省级城市为1,其余城市为0 | |
| Hierarchyj | 被服务城市j的城市等级,定义同上 | ||
| 地理距离 | Distij | 服务城市i和被服务城市j的地理距离 | |
| 经济发展差距 | Econgapij | ||
| 文化邻近度 | Cultproxij | 如果服务城市i和被服务城市j来自同一人文地理综合区[33],赋值为1,反之为0 | |
| 制度邻近度 | Instproxij | 如果服务城市i和被服务城市j来自同一省份,此变量即赋值为1,反之为0 | |
皮尔逊相关系数结果表明各解释变量不存在明显共线性。基于2001—2018年中国专利代理服务关系数据构建城市专利代理服务空间演化影响因素的计量模型。由于因变量城市专利代理服务次数属于离散型非负整数,且方差明显大于期望值,本文选择负二项回归模型,构建“服务城市—被服务城市—时间段”面板数据,引入时间和区域虚拟变量控制时间和区域因素固定效应,具体回归模型如下:
式中:因变量和自变量的定义见表1,i为提供专利代理服务的城市;j为被服务城市;t为时间;θt为年份固定效应;εijt表示随机误差项;β为待估参数。Breusch-Pagan检验和怀特检验结果显示解释变量存在异方差,本文使用聚类稳健的标准误并对连续性变量取对数,以降低异方差的影响并获得弹性的结果。
4 中国专利代理服务网络的空间演化
4.1 中国专利代理服务网络中专利代理机构的空间分布
基于ArcGIS绘制2018年中国提供专利服务的全部专利代理机构的空间分布图(图2)。中国专利代理机构的空间分布呈现“东密西疏”“东强西弱”的整体格局。东部地区集中了75%以上的专利代理机构;专利代理机构的空间集聚具有显著的区域差异性,主要集中于京津冀、长三角、珠三角地区;中西部地区的代理机构集中在长江中游城市群、成渝地区、郑州、西安等区域性核心城市和城市群。
图2
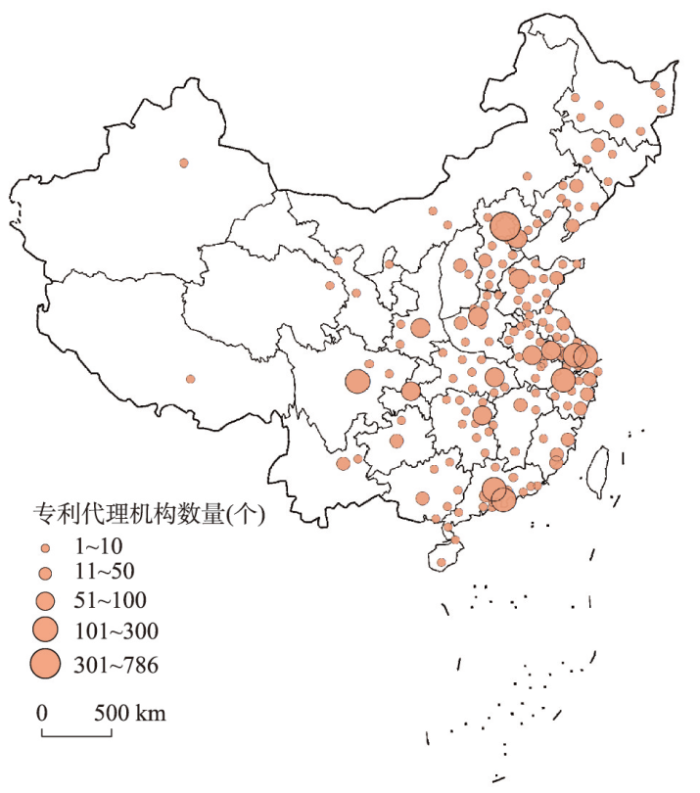
图2
2018年中国专利代理机构的空间分布
注:基于自然资源部标准地图服务系统GS(2019)1823号的标准地图制作,底图边界无修改。
Fig. 2
Spatial patterns of patent agencies in China in 2018
4.2 中国专利代理服务网络的演化特征
借助Gephi对中国专利代理服务网络拓扑结构特征进行了定量分析(表3),可以发现,无论从规模上还是从密度上,中国专利代理服务网络均呈现不断密集化趋势,专利代理服务联系日趋紧密,平均集聚系数明显上升,进入网络的边数、网络密度、平均度和平均加权度均呈现快速上升趋势,表明中心城市的重要性提升,专利代理服务网络内部节点联系强度不断增强,越来越多的创新主体开始寻求专利代理服务资源。加入世界贸易组织(WTO)后,中国企业的知识产权保护意识迅速提高,对专利代理服务的需求随之快速上升,2011年以后,随着《国家知识产权战略纲要》的颁布实施,市场主体的创新活力进一步被激发,知识产权服务被纳入高技术服务范畴,促进专利代理服务网络结构的复杂化。
表3 2001—2018年中国专利代理服务网络属性特征统计
Tab. 3
| 阶段 | 节点数 | 边数 | 网络密度 | 平均聚类系数 | 平均度 | 平均加权度 |
|---|---|---|---|---|---|---|
| 2001—2005 | 292 | 1320 | 0.015 | 0.55 | 4.52 | 92.62 |
| 2006—2010 | 295 | 2360 | 0.027 | 0.59 | 8.04 | 396.31 |
| 2011—2015 | 295 | 4786 | 0.055 | 0.65 | 16.22 | 1425.89 |
| 2016—2018 | 294 | 2915 | 0.034 | 0.64 | 9.92 | 247.78 |
4.3 中国专利代理服务网络的拓扑结构特征
图3
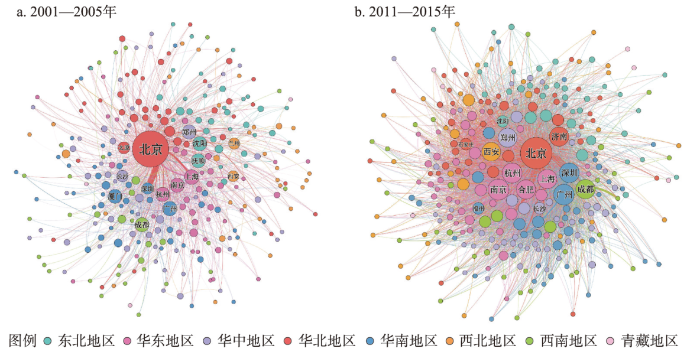
图3
2001—2005年和2011—2015年中国专利代理服务网络的拓扑结构
Fig. 3
Topological structure of innovation service network of China in 2001-2005 and 2011-2015
由图3可知,中国专利代理服务网络拓扑结构有以下特征:① 专利代理服务网络从北京作为单一核心向“一核多强”的网络结构转变。2001—2005年北京是唯一的服务中枢型城市和网络核心,2001—2005年提供的专利代理服务总量达15029次,占据全国专利代理服务总量的53.49%,规模远超其他城市。北京—深圳和北京—上海这两条关系流占据了绝大部分的服务份额。2011—2015年专利服务网络呈现“一核多强”的整体格局,北京占全国总量的比重下降至44.11%。其余服务中枢型城市在全国总量占比从2006—2010年的17.6%增长至42.5%,其中南京的专利代理服务总量增长率达384%。未来专利代理服务网络可能从以北京“一家独大”的网络结构,逐渐过渡到以北京、上海、深圳、广州、南京等多座大城市为中心的多核心多层级的拓扑结构。
② 城市节点的层级和相对大小发生变化,区域核心城市的地位不断上升,高服务层级之间的网络更加稠密。华东、华南地区非省会地级市开始成为区域内重要节点,如苏州、宁波、东莞和泉州;而东北、华中、西北和西南地区的重要节点仍以区域性中心城市为主,且相对于次级地级市的服务规模和服务范围优势明显,如沈阳、武汉、西安、成都等市。
③ 各城市节点之间关系流的连通度和强度明显增强,区域内部服务关系优势显现。中国专利代理服务网络的服务关系流动呈现区域化趋势。北京作为专利代理服务网络核心的相对优势下降,区域中心城市作为专利代理服务提供者的地位上升。广州、南京、杭州等区域中心城市与同区域内次级地级市相连接的关系流逐渐增强,其中南京—苏州、广州—深圳、杭州—湖州、成都—攀枝花的服务关系流均达到了年均1000次以上。知识产权管理体制的市场化改革以及区域专利代理需求的提升是区域性中心城市在网络中地位上升的重要原因,越来越多的区域性中心城市成为地区专利服务重要节点。
4.4 中国专利服务网络的地理空间特征
以2001—2005年和2011—2015年时间段为例分析专利代理服务网络的空间流向变化(图4)。分析发现:① 网络整体结构演变有明显的梯度推移趋势,专利服务网络从2001—2005年的“北京—广州”和“北京—上海”相对单一的双线格局,向2011—2015年的“以北京为核心,长三角、珠三角、长江中游城市群和成渝多节点并存”的复杂结构转变,反映全国区域性核心城市向周边提供知识产权服务的能力逐渐增强,以区域中心城市为核心,新的服务关系流不断涌现,如南京—镇江、广州—佛山、成都—攀枝花。城市之间专利代理服务的空间关系表现出从沿海发达地区到内陆地区的梯度推移过程,与中国经济格局变迁过程相吻合。② 地区不平衡性显著,整体呈现“东强西弱”的空间格局。规模较大的服务节点主要集中在京津冀、长三角、珠三角和发达的省会城市,东北、西北地区的专利代理服务联系较弱,这与城市服务能力及创新能力的空间格局[34]高度一致。③ 服务关系流具有明显的路径依赖特征。两个时间段内,流量较大的服务关系流一部分为北京—深圳、北京—上海等连接全国网络核心的城市组,一部分为广州—深圳、南京—苏州、杭州—湖州、广州—东莞等连接区域核心城市和区域内城市的关系流,这两类专利代理服务流动的规模和强度增长迅速,并呈现自我强化的趋势。
图4
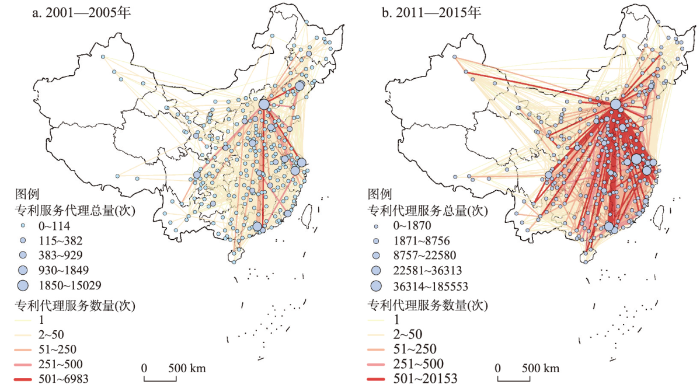
图4
2001—2005年和2011—2015年中国专利代理服务网络的空间流向
注:基于自然资源部标准地图服务系统GS(2019)1823号的标准地图制作,底图边界无修改。
Fig. 4
Spatial flows of Chinese patent agency service networks in 2001-2005 and 2011-2015
4.5 中国专利代理服务网络的等级层次特征
图5
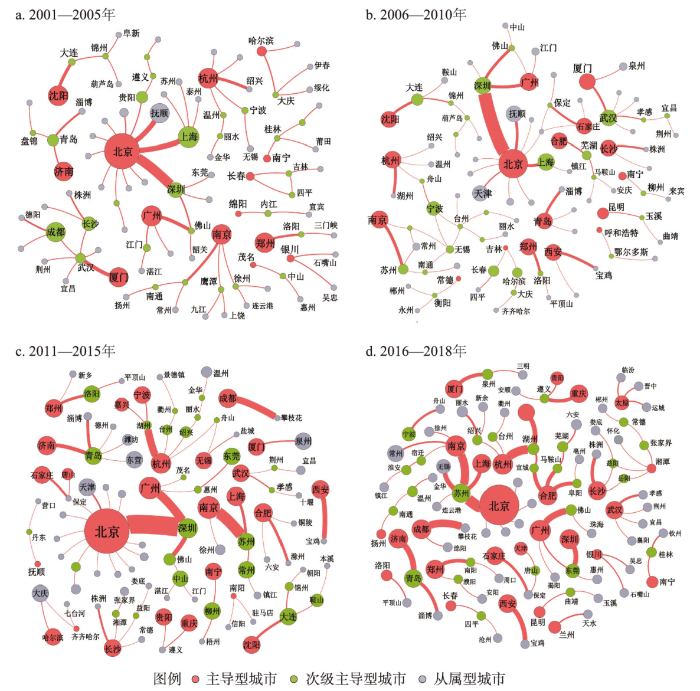
图5
2001—2018中国专利代理服务网络的等级层次图
Fig. 5
Hierarchical structure of Chinese patent agency network in 2001-2018
由图5可知:① 4个时间段内的服务网络都属于非连通网络,且网络节点和层级不断增加,说明有更多城市参与到中国专利代理服务交易网络中,形成复杂的等级关系。② 主导型节点的区域性特征显著。总体上,北京一直是核心性主导型节点,整体规模和服务关系流在网络中均处于核心地位。而区域性主导型节点从2001—2005年的6个逐渐增加到2016—2018年的28个,说明网络中区域性服务中心数量不断增长。③ 专利代理服务扩散体现为等级扩散和传染扩散,大致符合梯度转移规律。其中,一部分规模较大的区域性主导型节点为华北、华东和华南地区的区域中心城市,其优势流导向省内或省际次级地级市并形成较完整的区域网络体系,如南京、杭州、广州等;一部分规模较小的区域性主导型节点为华中、东北、西北或西南地区的中心城市,其优势流导向省内次级或相邻规模的地级市并以弱关系网络形式存在,如南宁、昆明、银川等。总体上,相较于服务等级的复杂化,专利代理服务的区域化趋势更加显著。这种演化趋势是由专利管理体制的市场化变革以及专利服务需求的空间扩张共同塑造的。
4.6 专利代理服务半径和服务类型
服务半径反映城市服务的空间范围,进一步计算高服务层级城市的加权服务半径,计算公式为:
式中:
经计算,4个时间段所有城市的平均加权服务半径分别为503 km、374 km、413 km和435 km,平均值为431 km。图6是4个时间段内高服务层级城市加权服务半径和年平均提供的专利代理服务总量散点图及具体城市统计图,红线为各时间段各城市的平均服务半径和平均服务量。可以发现以下特征:高服务层级城市的平均服务范围呈“先减后增”的趋势,且年均提供的专利代理服务总量也呈增长趋势。2001—2005年的平均服务半径最大,是由于早期为全国提供专利代理服务的城市集中在北京、上海等少数城市,2006年以后,随着市场化改革的深化,各区域中心逐渐引入专利代理机构,且服务范围不断扩大,区域性代理服务量显著提高,服务半径不断降低。
图6
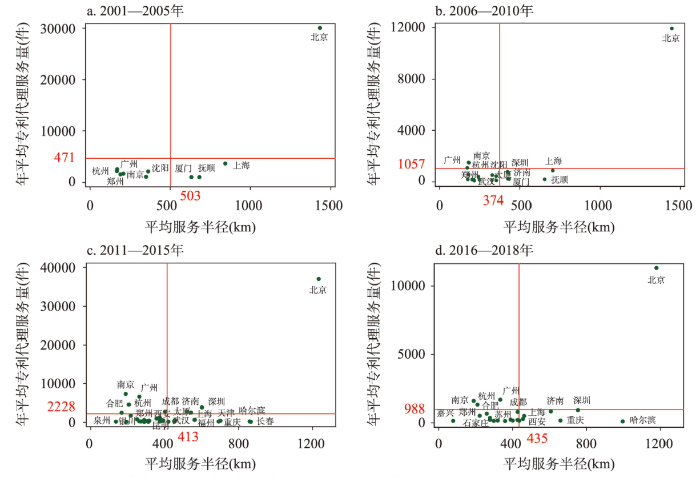
图6
2001—2018年高层级服务城市的服务半径与专利代理服务量散点图
Fig. 6
Scatter plot of service radius and service number of high-level service cities, 2001-2018
高服务层级城市的专利代理服务范围和服务总量存在4种组合模式,具体如下:
(1)“一枝独秀”型。北京占据全国专利代理服务输出的绝对的中心地位,服务半径在1200 km以上,是上海服务半径的2.27倍(2010—2015年),远高于其他城市。北京不仅是全国的科技创新中心,对专利代理服务的需求量巨大,且是政治中心,知识密集型服务业的发展远超其他城市。
(2)服务半径大和服务量高的全国性服务城市。主要包括上海、深圳、济南,这些城市在几个时间段中,服务半径在500~800 km之间,年均服务总量超过2200件,服务半径和服务总量均较高,属于辐射量大和服务总量高的全国性服务城市,在全国的服务等级体系中低于北京,但是高于其他城市。
(3)服务量高,但是服务范围较小的区域性服务城市。主要包括广州、南京、杭州,2011年后,这几个城市的年均服务量超过2000件,但服务半径多在300 km以内,服务对象主要面向珠三角和长三角的创新企业。
(4)服务规模相对较低,但辐射半径较大的区域性服务城市。主要包括哈尔滨、长春、抚顺等东北城市以及重庆、武汉、西安等中西部的区域性中心城市。其中,哈尔滨和长春主要由于所在的东北地区与区外地理位置相隔较远,服务对象为东北地区的创新企业以及区外的创新企业,导致服务半径较大。抚顺的专利代理服务机构包括机械工程、化学、冶金等专利类型,长期为北京的大型石油化工公司提供专利代理服务。重庆、西安作为西部地区的区域中心面向广大西部地区创新机构提供服务,因此半径较大,由于东北和西部地区创新能力仍然较弱,其专利代理服务量相对较小。
(5)服务辐射半径和服务量均较小的城市。这类城市以一部分省会城市和较发达的地级市为主,如合肥、郑州、泉州、南昌、石家庄、苏州等城市,这些城市主要是为省内或市区的专利代理需求提供服务,专利服务规模较小。
进一步以2011—2015年的城市专利服务范围和服务规模的平均值与标准差为基础,确定城市专利代理服务的等级类型,城市专利代理服务体现为“金字塔式”的服务等级体系,北京位于金字塔尖,为具备绝对优势的知识密集型服务业的中心;上海、深圳位于第二层次,为全国性服务中心,属于“大规模、远距离”型;其次基于服务半径和服务规模划分为区域Ⅰ类服务城市和区域Ⅱ类服务城市,分别为“大规模、近距离”和“小规模、远距离”型;最后为服务范围和规模均较小的“小规模、近距离”型的省级服务城市。具体划分结果如表4所示。
表4 高层级服务城市类型划分
Tab. 4
| 城市类型 | 分类标准 | 城市名 | 变量解释 |
|---|---|---|---|
| 国家级服务城市: “大规模、远距离” | 加权服务半径 年平均提供的专利代理服务总量 | 北京、深圳、上海 | |
| 区域Ⅰ类服务城市: “大规模、近距离” | 加权服务半径 年平均提供的专利代理服务总量 | 南京、广州、杭州、成都、合肥、济南 | |
| 区域Ⅱ类服务城市: “小规模、远距离” | 加权服务半径 年平均提供的专利代理服务总量 | 福州、天津、哈尔滨、重庆、长春 | |
| 省级服务城市: “小规模、近距离” | 加权服务半径 年平均提供的专利代理服务总量 | 郑州、西安、沈阳、石家庄、长沙、福州、青岛、太原、武汉、苏州、厦门、天津、兰州、宁波、南昌、东莞、昆明、常州、无锡、南宁、泉州、大连、长春、银川、贵阳、洛阳 |
5 中国专利代理服务网络演化的影响因素
表5 负二项回归结果
Tab. 5
| (1) | (2) | (3) | (4) | (5) | |
|---|---|---|---|---|---|
| lnPGDPi | 6.446*** | 8.293*** | 12.901*** | ||
| lnPGDPj | 13.495*** | 15.023*** | 4.051*** | ||
| lnPopi | 8.452*** | 11.315*** | -0.062 | ||
| lnPopj | 2.151*** | 3.382*** | 3.364*** | ||
| Tech | 77.197*** | 118.483*** | 170.463*** | ||
| Fdi | -20.468*** | -17.431*** | -24.535*** | ||
| Finance | 9.757*** | 10.962*** | 5.612*** | ||
| Hierachyi | 4.410*** | 14.016*** | 22.795*** | 18.278*** | |
| Hierachyj | 1.468*** | 7.067*** | 16.366*** | 13.887*** | |
| lnDist | -2.822*** | -3.113*** | |||
| Econgap | -11.606*** | -11.899*** | |||
| Cultprox | 2.727*** | 3.583*** | |||
| Instprox | 42.884*** | 43.212*** | |||
| 时间段固定效应 | Yes | Yes | Yes | Yes | Yes |
| 服务城市所在区域固定效应 | Yes | Yes | Yes | Yes | Yes |
| 被服务城市所在区域固定效应 | Yes | Yes | Yes | Yes | Yes |
| 观测值 | 24315 | 24315 | 24322 | 24322 | 24315 |
| chi2 | 9917 | 9812 | 8219 | 21267 | 23393 |
| Prob > Chi2 | 0.000 | 0.000 | 0.000 | 0.000 | 0.000 |
| Log Likelihood | -86125 | -86177 | -85151 | -80471 | -79387 |
注:***:p < 0.01,**:p < 0.05,*:p < 0.1。
首先,服务和被服务城市的经济发展水平和人口规模显著影响专利代理服务,以第(5)列为基准,控制其他因素的情况下,输出服务的城市人均GDP增加10%,代理服务量增加1.3个,输入服务的城市人均GDP增加10%,专利代理服务量增加0.4个,表明知识密集型服务业多发生在经济发达的城市之间。不考虑城市间关系的情形下,服务输出城市和输入城市的人口规模均显著影响专利代理服务量,但在考虑城市间的多维邻近性的情况下,服务城市的人口规模变量变得不显著,被服务城市的人口规模能够显著增加专利代理服务量。
其次,服务城市的技术投入显著影响专利服务量,其他条件一定的情况下,城市技术投入比重增加10%,对外专利服务量增长17件。技术投入在一定程度代表城市的创新能力,创新能力强的城市将增加对知识产权服务的需求,也在一定程度上提高其对外知识产权服务的规模。经济外向度(Fdi)的影响显著为负,表明外商直接投资不利于城市的专利代理服务增长,这可能是因为与国外的经济联系可能会对国内城市间的知识密集型服务业的联系形成挤出效应,降低国内城市间的专利服务联系;另一方面,外资进入可能抑制本土企业提升创新水平[36],从而进一步抑制城市的专利服务需求。城市金融业发展水平能够显著提升城市对外的专利代理服务数量,金融业代表知识密集型产业发展水平,也间接提升了城市创新能力和知识产权服务能力。
再次,城市等级能够显著提升服务城市和被服务城市的专利代理服务数量,由于专利代理服务业属于受知识产权政策影响大的产业,其供给和需求主要集中在高等级城市中,城市等级越高意味着越接近相关政策信息,同时有更高的创新能力、创新需求及高端服务的供给能力。城市等级提高一个层级,其对外专利服务代理量增加18件,被服务城市对其他城市的专利代理需求增加14件。这与对其他知识密集型产业的研究一致[37]。
城市间关系邻近性显著影响城市间专利服务规模,首先,地理距离的系数显著为负,表明距离越近的城市之间其专利服务量越多,其他条件一定的情况下,地理距离增加一倍,城市间专利代理服务量减少3项。表明空间距离是仍然是服务联系的重要阻碍。城市间经济差距(Econgap)的增加显著降低了城市间专利代理服务联系。这是由于重要的专利代理服务需求和供给多来自于高等级城市,多数服务联系发生在经济差距较小的高等级城市之间;另一方面,城市间的经济差距越大,其对服务的需求越不一致,越不容易形成服务联系。结果也证实文化邻近性(Cultprox)和制度邻近性(Instprox)有利于提升城市间的服务,相同或相近文化的城市有助于增进人们之间的知识转移和技术交换[38],从而为知识产权服务提供条件;同样,相同的制度环境也有利于服务企业和被服务企业规避可能面临的政策风险,从而更容易达成交易。
6 结论与讨论
专利服务是高质量发展背景下促进知识产权创造、运用和保护的重要支撑。本文采用社会网络分析方法、空间分析和计量分析等手段,探讨中国专利代理服务空间网络演化及影响因素,探讨市场机制、城市行政等级、空间距离在网络演化过程中的作用机制。主要结论如下:
(1)从中国专利代理服务网络的时序演化特征角度来看,专利代理服务网络呈规模扩张化及结构复杂化的趋势。2001年以来,网络节点之间的关系流数量和强度不断增长,网络整体规模和结构不断扩张和深化。
(2)从中国专利代理服务网络的拓扑结构特征来看,专利代理服务网络核心从以北京为单一核心,逐渐过渡到以北京、广州、南京等中心城市为中心的多核心拓扑结构。发达地区的中心城市占据着网络优势地位,区域内服务关系流逐渐成为服务关系流的主体。知识产权管理体制的市场化改革以及区域专利代理需求的提升是区域性中心城市在网络中地位上升的重要原因。
(3)从中国专利代理服务网络的地理空间特征来看,专利服务网络的整体结构有明显的梯度推移趋势,表现为从“北京—广州”和“北京—上海”相对单一的双线格局向“以北京为核心发散,长三角、珠三角、中部和成渝多节点”的复杂结构的转变。网络节点和服务关系流呈现出“东强西弱”的空间格局明显的路径依赖性。
(4)从中国专利代理服务网络演变影响因素来看,城市行政等级、创新能力、关系邻近性和经济人口规模能显著提升服务和被服务城市之间的专利服务联系。因此,要融入专利代理服务网络,从服务城市看,需要提高市场潜力和创新投入,增强知识产权服务产业发展水平;从被服务城市看,需要增进与区域中心的服务联系,提升本地经济发展水平和人口规模。
本文的研究结论有助于提升对中国专利代理服务网络的认识,为知识产权服务业的发展和空间布局提供经验借鉴。对于专利代理机构而言,其空间扩张需要考虑接近市场和行政资源,保证客户资源基础,从而获取竞争优势。对于知识产权管理机构,需要进一步深化市场化改革,增强区域中心城市在知识产权服务中的引领作用,优化知识产权服务的空间配置,促进知识产权服务机构的均衡发展。与已有研究相比,本文首次从知识产权服务的视角探讨了城市网络特征及演化机制,强调行政等级、市场规模以及关系邻近性共同作用于城市网络体系及演化,从服务联系的视角拓展了创新地理的研究。本文也存在一些局限与不足,首先,服务企业与被服务创新主体的特征有待进一步探讨;其次,本文仅限于专利代理服务,对于其他知识产权服务如知识产权保护诉讼、交易、版权服务等未能涉及,有待于未来进一步深入研究。
参考文献
Thinking of the present situation and development of China's intellectual property service industry
我国知识产权服务业现状与发展目标思考
Improving the patent agency system and management in accordance with the development of the market economy in China
Research on the influence path of patent agents' competency to patent quality
专利代理人胜任特征对专利质量的影响路径研究
On development of intellectual property service systems from the perspective of the cultivation of intellectual property services
知识产权服务业培育视角下的知识产权服务体系发展研究
Advanced producer service firms as strategic networks, global cities as strategic places
DOI:10.1111/ecge.2014.90.issue-3 URL [本文引用: 3]
The shifting geography of corporate headquarters in Australia: A longitudinal analysis
DOI:10.1080/00343404.2011.624511 URL [本文引用: 2]
Unpacking urban network as formed by client service relationships of law firms in China
Behind the scenes: The evolving urban networks of film production in China
DOI:10.1080/02723638.2018.1477297 URL [本文引用: 1]
Mapping urban networks through inter-firm service relationships: The case of China
DOI:10.1177/0042098016685511
URL
[本文引用: 2]

Literature on how cities get connected through networks of firms has been increasing in recent years. In particular, advanced producer service (APS) firms are being widely used to build intra-firm linkages to establish urban networks. In contrast to studies applying intra-firm networks, this study proposes an alternative strategy to build urban networks based on inter-firm service provision relationships during the process of initial public offering (IPO) in which APS firms – including securities, law firms and accounting firms – provide professional services for firms aiming to be publicly listed. Based on service provision connections between APS firms and their clients, this study provides fresh insights on urban networks in China. The results show that Beijing, Shenzhen and Shanghai strategically hold dominant positions within Chinese urban networks and they are the lead command and financial centres within the country. Particularly, Beijing has overwhelmingly more influence over other cities. The urban networks are embedded in China’s unique institutional context where market and state power together have shaped these networks. Since the urban network is built up based on real economic linkages, the findings might have further implications for policy-making and could contribute to ongoing debates regarding financial centres in China. It implies that connections between firms based on real economic activities can be an effective way to construct urban networks in future research.
City-dyad analyses of China's integration into the world city network
DOI:10.1177/0042098013494419
URL
[本文引用: 1]
The business connections between Beijing, Hong Kong and Shanghai and other major world cities are investigated using the interlocking network model based upon the location strategies of advanced producer service firms. This approach emphasises non-hierarchical relations between cities. A key new finding is that city-dyad analysis enhances the prominence of these China cities compared with simple ranking by total global network connectivity. This suggests that Hong Kong, Shanghai and Beijing have developed more strategically important roles in the world city network than previously understood. Yet the geographies of these links are distinctive, with Shanghai shown to be better connected to the more important world cities such as London and New York than Beijing; and Beijing is found to be better connected to political world cities such as Washington and Brussels, and to other Pacific Asian cities, than Shanghai. The results are interpreted as suggestions for developing a new research programme.
Serving the culture: Spatial interactions between cultural industries and advanced producer services in mainland China
DOI:10.1177/0308518X18789697
URL
[本文引用: 1]
The location patterns and organizational networks of both advanced producer services (APS) and cultural industries have attracted extensive attention in geography and other related disciplines. However, most research on these two sectors has examined each one in isolation, without paying attention on how they are engaged with each other. Drawing on a network analysis of the inter-firm service provision relationships between 245 cultural firms and their APS providers during the firms’ public listing processes in mainland China, this paper presents a pilot study of the functional interactions between cultural industries and APS from a geographical perspective. Our purpose is to expand the research on these two economic sectors from the simple mapping and ranking of their individual industrial activities to an investigation of the city-based spatial relationships between them. The outcome reveals that while the leading cultural firms and their APS intermediaries have demonstrated similar location patterns across major Chinese cities, the spatial interactions and connections between them are much more complicated than their co-location tends to suggest. This paper enriches our understanding of the functions of local clusters and trans-local networks in the establishment of inter-industrial linkages between the different sectors of knowledge economies. The paper also sheds light on the impacts of institutional context on the (spatial) development of cultural industries in a transitional economy.
Spatial pattern and influential mechanism of interurban technology transfer network in China
DOI:10.11821/dlxb201808006
[本文引用: 2]
On the basis of patent transaction data in 2015, spatial pattern of interurban technology transfer network in China was portrayed by integrating big data mining, social network, and GIS, from the perspectives of nodal strength and centrality, linkage intensity, and modular divisions. Then, its key influencing factors were identified as well using the Negative Binominal Regression Analysis. Some findings were ontained as follows. First of all, the intensity of interurban technology transfers in China is not well distributed with obvious polarization. Those cities with higher-level technology transfers are concentrated in the three urban clusters, namely, the Yangtze River Delta, the Pearl River Delta and Beijing-Tianjin-Hebei urban agglomeration. Secondly, a typical core-periphery structure with hub-and-spoke organization is evidently observed, which consists of several hubs and the majority of cities with far lower technology transfers. Beijing, Shenzhen, Shanghai and Guangzhou are acting as the pivot of the technology transfer network and playing a critical role in aggregating and dispersing technology flows. Thirdly, technology linkage intensities of urban pairs appear to be significantly uneven with hierarchies, centralizing in the three edges from Beijing to Shanghai, from Shanghai to Guangzhou and Shenzhen, and from Beijing to Guangzhou and Shenzhen, which shapes a triangle pattern. Fourthly, the technology transfer network is divided into four communities or plates, with prominent reflexivity and spillover effects, which is resulted from geographical proximity and technological complementary. Last but not least, spatial flows of technology are co-organized by a variety of spatial diffusion modes such as hierarchical diffusion, contact diffusion and leapfrog diffusion, owing to economic and administrative powers. They are greatly influenced by urban economic scale, foreign linkage, policy making, as well as multiple proximity factors related to geographical, technological, social and industrial proximities.
中国城际技术转移网络的空间格局及影响因素
DOI:10.11821/dlxb201808006
[本文引用: 2]
基于2015年专利交易数据,融合数据挖掘、社会网络、空间分析等方法,从节点、关联、模块及影响因素4个方面揭示中国城际技术转移的空间格局及其影响因素:① 技术转移整体强度偏低,空间极化严重,长三角、珠三角、京津冀城市群成为技术转移的活跃地带。② 北京、深圳、上海、广州是全国技术转移网络的“集线器”,发挥城际技术流的集散枢纽和中转桥梁作用,中西部大部分城市处于网络边缘,整个网络发育典型的核心—边缘式和枢纽—网络式结构。③ 技术关联的空间层级和马太效应凸显,形成以北京、上海、广深为顶点的“三角形”技术关联骨架结构,技术流集聚在东部地带经济发达的城市之间和具有高技术能级的城市之间,中西部技术结网不足,呈现碎片化。④ 技术转移网络形成明显的四类板块(子群),具明显自反性和溢出效应,其空间聚类既有“近水楼台先得月”式块状集聚,也有“舍近求远”式点状“飞地”镶嵌。⑤ 城际技术流呈现等级扩散、接触扩散、跳跃扩散等多种空间扩散模式,其流向表现出经济指向性和行政等级指向性特征。⑥ 城市经济发展水平、对外开放程度、政策支持等主体属性和地理、技术、社会、产业邻近性的城市主体关系均会影响其技术转移强度。
The theoretical construction and network simulation of intercity innovative relationships in knowledge flow space
DOI:10.11821/dlxb202004004
[本文引用: 2]
The interactive relationships between cities in the knowledge economy era have attracted much attention. Researchers have applied a range of methods to explore intercity innovative relationships and associated network characteristics. It nevertheless remains unclear just how intercity innovative relationships can be theoretically constructed based on knowledge flow space and how further scientific simulation methods can be designed. Research questions in this area have rarely been explored in detail, an issue which has inevitably placed obstacles on further exploration. A framework for the theoretical construction of intercity innovative relationships is presented in this study; the basis for this research is that an intercity innovation network is essentially a 'soft network', distinct from a 'hard network'. These interconnections are founded on a subjective relationship construction process and therefore necessitate scale transformation from 'point-point' connections between innovative subjects in different cities with respect to 'city-city' interactions. At the same time, this transformation process is prone to exaggerations and deviations from objective intercity innovative relationships and therefore exerts considerable influence on the accuracy of results such that constructions must be entirely theoretical. Four construction methods for intercity innovative relationships and network simulation are summarized in this study, including an intercity undirected network based on cross-city co-operations between scientific and technological achievements, an intercity directed network based on the cross-city transfer of scientific and technological achievements, an intercity innovation network based on the cross-city flow of high-end talents, and an intercity innovation network based on the multi-city distribution of innovative enterprises and institutions. Simulation tests were then undertaken using relevant data to reflect aspects of these relationships. The results of this analysis are conducive to further exploration of global and regional innovative spatial patterns from the perspective of urban geography and intercity relationships and provide a theoretical and methodological foundation for further research on intercity innovation networks.
知识流动空间的城市关系建构与创新网络模拟
DOI:10.11821/dlxb202004004
[本文引用: 2]
知识经济时代城市间的创新关系是新时代城市间相互作用关系的新内涵,研究者尝试采用各种方法探索城市间创新关系及其网络特征。然而,如何从理论上建构知识流动空间的城市间创新关系?如何设计更加合理的城市间创新网络模拟方法?这些问题却少有专门探讨。基于相关研究,本文提出了城市间创新关系构建的理论框架,认为城市间创新网络本质上是区别于“硬网络”的“软网络”,是一种主观的关系建构过程,需要经过异城创新主体间的点—点关系向城—城之间关系的尺度转换,这一转换过程容易发生夸大或偏离城市间客观存在的创新关系,对结果的精确度产生很大影响,应对关系建构给予充分理论论证;本文论述了4种城市间创新关系建构和网络模拟方法,包括科技成果异城合作的城市间无向网络构建方法、科技成果转让转移的城市间有向网络构建方法、高端人才跨城移动的城市间创新网络建构方法和创新企业机构多城分布的城市间创新网络建构方法,并运用相关数据进行了模拟试验与结果展示,来反映城市间创新关系的不同方面。本研究有助于推动从城市地理学视角和城市关系的维度探讨全球/区域的创新空间格局,为城市间创新网络研究提供理论和方法支撑。
Shanghai's position in global science and technology innovation network
DOI:10.3969/j.issn.1004-9479.2023.02.2021071
[本文引用: 1]
Based on the global patent cooperation data in WIPO database, we construct global science and technology innovation network of Shanghai from 2010 to 2019 and the global science and technology innovation network of 32 first level science and technology cities in the world in 2019. On this basis, we use social network analysis and functional polycentric iterative analysis to explore the evolution and status of Shanghai's participation in global science and technology cooperation. The results show that: in the past 10 years, Shanghai has played a relatively important role in the global science and technology innovation network, but it has not improved its position in the science and technology innovation network to a great extent. Among the 32 cities in the world, Shanghai ranks the sixth in the strength of innovation connection, and the first in the breadth of innovation connection. At present, the science and technology innovation connection between Shanghai and other cities can be characterized as wide diversity but not in-depth. Ranking the 32 cities through polycentric iterative analysis, we can find that the innovation status of each city in the global science and technology innovation local network is characterized by polycentricity high-low distribution; Shanghai, London and Rotterdam are in the third level; among the top six cities in the innovation strength connection, Shanghai has become "marginal", and there is a big gap between Shanghai and the top five cities.
上海参与全球科技创新网络地位研究: 基于WIPO专利合作数据
Research on China's urban innovation network based on top 1000 high technology enterprises
DOI:10.3969/j.issn.1004-9479.2021.05.2020071
[本文引用: 1]
Under the background of China's innovation-driven development strategy, the innovation elements in urban development have become more important than ever. The research on urban innovation networks based on innovative enterprise contact data has become an important topic in today's urban development. Based on the kernel density estimation and the chain network model, this paper will study the enterprise layout and the urban innovation network structure based on the information of the high technology enterprise headquarters and branches in China's top 1000 innovation capacity in 2018. The research shows that: (1) High technology enterprises are mainly concentrated in China's three major coastal cities and some midwest central cities; (2) China's urban innovation network generally presents a diamond-shaped structure. Moreover the urban's abilities of innovation is significantly different and hierarchical, and the innovative connections between cities are mainly formed by hierarchical diffusion; (3) The structure of urban innovation networks vary greatly among different industries. According to industry attributes, innovative cities can be divided into technological innovation city, industrial innovation city and service innovation city. The research aims to promote the transformation and upgrading of traditional industries, realize the development of urban innovation, and provide scientific reference for the development of targeted development models for innovative cities.
基于千强高新技术企业的中国城市创新网络研究
DOI:10.3969/j.issn.1004-9479.2021.05.2020071
[本文引用: 1]
在我国创新驱动发展战略的背景下,城市发展中的创新要素变得空前重要,基于创新型企业联系数据研究城市创新网络成为当今城市发展的重要议题。选取2018年中国创新能力1000强的高新技术企业总部和分支机构信息,基于核密度分析法和连锁网络模型,对企业布局和城市创新网络结构进行研究。研究表明:(1)高新技术企业主要聚集于中国三大沿海城市群及部分中西部中心城市;(2)中国城市创新网络大致呈现出菱形结构,城市创新能力差异显著且具有等级性,城市间的创新联系主要通过等级扩散形成;(3)不同行业视角下的城市创新网络结构差异性显著,依据行业属性可将创新型城市划分为科技创新型城市、工业创新型城市和服务创新型城市。研究以期推动传统产业转型升级,实现城市创新发展,为创新型城市制定针对性发展模式提供科学参考。
Research on technological innovation flow in Guangdong-Hong Kong-Macao Greater Bay Area based on patent measurement
基于专利计量的粤港澳大湾区技术创新流动研究
Review of research on patent agency service
专利代理服务的相关研究综述
A review on the research of cooperative innovation behavior in intellectual property service
知识产权服务中合作创新行为的相关研究综述
Structural characteristics and influencing factors of the global inter-city knowledge flows network
DOI:10.11821/dlyj020200443
[本文引用: 1]
In the age of globalizing science and technology, urban economic development increasingly rests on knowledge production and knowledge flows. Inter-city scientific collaborations, as the most potent aspect of modern knowledge production, are more and more frequent, which produces some of the highest quality science. However, there is a paucity of analysis of the world city system from the knowledge flows perspective. Using highly cited papers data from the Web of Science database in 2017, this study applies social network analysis, a Bayesian-inference weighted stochastic block model (WSBM), the dominant flow analysis and spatial interaction model to explore the topological structure, spatial pattern and influencing factors of global inter-city scientific collaboration. Results show that the science hotspots are highly concentrated in three regions: North America, East Asia and Western Europe, and the whole network is dominated by a tri-polar world. The two seemingly paradoxical trends, star-shaped and triangulated structure, coexist in the global inter-city knowledge flows network. The spatial pattern of inter-city collaboration network forms a quadrilateral graph with four vertexes in Western Europe, North America, East Asia and Australia, particularly on the trans-Atlantic axis between North America and Western Europe. The network has a distinctive multicore-periphery structure, which can be divided into five categories: global core, macro-region core, strong semi-periphery, semi-periphery, and periphery, and identifies New York, London, Boston, San Francisco-San Jose, Washington, Los Angeles, Paris and Beijing as eight global core cities and forty-one macro-region cores. The network is characterized as hierarchical “hub-and-spoke” structures, and the hierarchy of the network is obvious, New York, Beijing and Jeddah are dominant nodes in the three subnetworks. In addition, the gravity model indicates the spatial distance impedes inter-city scientific collaboration, while the amount of science output and the number of urban residents, the number of world-class universities, institutional proximity and social proximity have positive and significant effect on inter-city scientific collaboration. In order to further our understanding of world city network, this paper calls for more attention to inter-city knowledge flows.
全球城市知识流动网络的结构特征与影响因素
DOI:10.11821/dlyj020200443
[本文引用: 1]
在科技全球化时代,城市之间的知识流动日益频繁,成为当代知识生产的重要特征。然而,鲜有从知识流动的视角开展全球城市体系的研究。基于2017年的高被引论文合作数据,采用社会网络分析方法和空间计量模型系统地刻画了全球城际科研合作网络的拓扑结构和空间格局及其影响因素。研究发现:① 拓扑结构呈现出以北美、欧洲和亚太城市的三极格局,轴辐式和分布式结构特征并存。② 世界城市科研合作网络形成以北美、西欧、东亚和澳大利亚为顶点的四边形格局。③ 多核心-边缘结构显现,纽约、伦敦和北京等8个城市为全球核心,芝加哥等41个城市为区域核心。④ 全球城市科研合作网络的等级层次特征显著,纽约、北京和吉达分别是三大子网的主导型城市。⑤ 空间相互作用模型表明地理距离阻碍了城市间的科研合作,城市的科研规模、人口规模、世界一流大学数量、制度邻近性和社会邻近性促进了城际联系。
Codification, patents and the geography of knowledge transfer in the electronic musical instrument industry
DOI:10.1111/j.1541-0064.2006.00143.x URL [本文引用: 1]
On the perfection of China's patent agency system
论我国专利代理制度的完善
Specialization, centralization, and the distribution of patent intermediaries in the USA and Japan
DOI:10.1080/00343400701874255 URL [本文引用: 1]
The proximity and dynamics of intercity technology transfers in the Guangdong-Hong Kong-Macau Greater Bay Area: Evidence from patent transfer networks
DOI:10.1177/0308518X221104822
URL
[本文引用: 2]
The patent transfer provides an important indication of technology flows and knowledge diffusion across space. Drawing on patent transfer data, we modeled intercity technology transfer networks in the Guangdong–Hong Kong–Macau Greater Bay Area, a city region special for its “one country, two systems” structure, in the periods 2007–2011 and 2012–2016. We then explored the evolutionary characteristics of the networks and further examined the impact of, and interaction between, different forms of proximities in relation to technology transfer over time. Our results show that some kinds of proximities (institutional, cognitive, and social) are able to promote technology transfers, while others (geographical and cultural) do not exert significant impacts. Of the latter category, geographical proximity can, however, indirectly affect technology transfer by acting on the proximity of other dimensions (institutional, cognitive, and social). For instance, cognitive proximity can compensate for the lack of geographical proximity and social proximity frequently accompanies geographical proximity—and both relationships are reinforced over time. In contrast, the interrelatedness of geographical and institutional proximities have transformed from a relation of substitution to complementarity.
Proximity and innovation: A critical assessment
DOI:10.1080/0034340052000320887 URL [本文引用: 1]
Spatial evolution and factors of interurban technology transfer network in Northeast China from national to local perspectives
DOI:10.11821/dlxb201910010
[本文引用: 1]
Interurban technology transfer becomes an essential channel for regions or cities to obtain external knowledge. Based on patent transaction data among cities during 2005-2015, this study investigates the interurban technology transfer network of Northeast China, aiming to explore spatial evolution of technology transfer network in this region from national to local perspectives based on social network analysis (SNA). A negative binomial regression analysis further reveals the factors of interurban technology transfer network. The results of the study are as follows: (1) From the national perspective, the interurban technology transfer network of Northeast China presents a core-periphery structure. The spatial pattern of "divergence in the northeast region" and "convergence in the coastal areas" has been formed. (2) From the local perspective, the technology transfer network of Northeast China shows a centripetal contraction situation, and its four hubs, namely, Harbin, Changchun, Shenyang and Dalian, play the role of technology gatekeeper. The interurban technology transfer flows present the characteristic of strengthening nationalization and weakening localization, which are more likely to emerge between the Northeast-Southeast China rather than among the Northeast China. (3) Both path-dependence and path-creation exist in the spatial dynamics of intercity technology flows in Northeast China. From the national perspective, technology flows from Northeast China to the Beijing-Tianjin-Hebei, Yangtze River Delta and Pearl River Delta urban agglomerations with Beijing, Shanghai and Shenzhen as the core respectively, while the local intercity technology transfer in Northeast China presents a mixed diffusing mode including hierarchical, contagious and jump diffusions. In addition, the local network mainly focuses on intra-provincial technology flows which centered on Haibin, Changchun, Shenyang and Dalian. (4) Some drivers, such as geographical proximity, the similarity of industrial structure, economic differences, the similarity of innovation capability, technology absorptive capacity, foreign direct investment, are evidenced to play a significant or determining role in interurban technology transfer of Northeast China.
东北三省城际技术转移网络的空间演化及影响因素
DOI:10.11821/dlxb201910010
[本文引用: 1]
从全国—本地视角,以东北三省为研究区,基于2005-2015年的专利权转移数据,融合社会网络、GIS空间分析和计量方法,定量刻画东北三省技术转移网络的空间演化规律。结果显示:① 全国视角下东北三省城际技术转移网络呈现“核心—边缘”等级层次性结构,形成了专利技术由东北辐散向全国沿海辐合的空间格局。② 本地视角下东北三省技术转移网络呈现出向心收缩结网态势,“哈长沈大”四大核心城市在本地网络中扮演“技术守门者”角色。技术转移表现出“强全国化,弱本地化”特征。③ 东北三省城际技术流动既存在路径依赖,也不断涌现路径创造。全国视角下,技术转移以东北三省核心城市为流源,基本流向以北京、上海和深圳分别为枢纽的京津冀、长三角和珠三角城市群。本地城际技术转移以哈尔滨、长春、沈阳、大连为集散中心,集中于省内转移,呈现等级、接触和跳跃式混合扩散空间模式。④ 地理距离接近度、产业结构相似度、经济水平差异度、创新能力相似度、技术吸收能力、外商直接投资对东北三省城际技术转移存在一定影响。
The innovation linkage among Chinese major cities
DOI:10.13249/j.cnki.sgs.2015.01.30
[本文引用: 1]
Inter-urban linkage is traditional research field of urban geography. With the increasing importance of innovation in city, inter-urban linkage of innovation has aroused the interesting of numerous sholars, some of which have examined the field through direct surveyed approach by co-author published papers or co-author patents granted, however, this approach is limited because it lacks data of the inter-urban and the rusults of survey may not present the comprensive inter-urban innovation situation of the cities. Therefore, we employ a indrect approach, using revised gravity model to map the pattern of inter-urban innovation linkage of Chinese major cities. China takes constructing the innovation country as the core strategy, and urban innovation as the core contents of national innovation system, so urban innovation linkage is an important part of China’s national innovation system. However, a number of issues, such as the current sitation of urban innovaiton linkage, and the pattern and laws of inter urban innovation have rarely been studied. This article will try to study the inter urban innovation linkage among major Chinese cities so as to find innovation source cities and innovation nodes cities in urban innovation system and the general pattern of the inter urban innovation, to promote the complementary and optimization of urban innovation function and to plan the circle of China urban innovation. Based on the review of the literatures of innovation linkage and theoretical analysis, through establishing a set of measureement of index, this article defines ourward innovation linkage of scale and measures innovation linkage and innovation pattern among Chinese major cities. The research shows: 1) the general pattern of urban innovation linkage in East China is stronger and that in West China is weak, and a "Golden Triangle innovation linkage" pattern has formed in the coastal area of China, which takes Shanghai, Nanjing and Hangzhou as the vertex, while Beijing-Tianjin and Guangzhou-Shenzhen as two points. 2) the city innovation linkage presents obvious hierarchy, the cities, such as Beijing, Shanghai, Guangzhou, Shenzhen, Tianjin and Chongqing have national innovation influence with extensive innovative linkage with the other cities in China, while cities, such as Nanjing, Hangzhou, Wuhan, Zhengzhou, Jinan, Qingdao, Dalian and Xi'an have regional innovation influence. 3) in terms of the East Coastal main economic circle in China, the Zhujiang River Delta economic circle has the strongest internal innovation linkage, but less outward innovation radiation; the Changjiang River Delta economic circle has very strong internal innovation linkage with strong external innovation linkage with the cities of Huan Bohai economic circle, while the cities of Beijing, Tianjin and Tangshan have very strong innovation linkage, and with strong outward radiation to the Changjiang River Delta economic circle. This article examines the general innovation linkage pattern among Chinese major cities considering two important elements of distance among cites and scale of urban innovation, but some elements, such institution and policies which may influence the innovation linkage have not been examined, it will be put consideration in future studies.
中国主要城市间的创新联系研究
DOI:10.13249/j.cnki.sgs.2015.01.30
[本文引用: 1]
对国内外城市创新联系综述及理论分析的基础上,通过一组测度指标,界定了城市外向创新联系规模,采用引力模型,测度了中国主要城市间的创新联系强度及格局。研究表明:中国主要城市创新联系格局基本为东强西弱,东部地区城市创新联系格局显现出以上海、南京、杭州为顶角,以北京、天津,以广州、深圳为2个底角的创新联系“金三角”。城市创新联系在空间上呈现明显的等级性:北京、上海、广州、深圳、天津、重庆等与中国的许多城市有广泛的创新联系,具有全国创新影响力;南京、杭州、武汉、郑州、济南、青岛、大连、西安等成为地区性的城市创新联系节点,具有区域性的创新影响力。在创新联系较强的东部沿海主要的经济圈,珠江三角洲经济圈城市间创新联系最强,但外向辐射力有限;长江三角洲经济圈内部创新联系较强,并与环渤海经济圈有较强的创新联系, 环渤海经济圈内部北京、天津、唐山具有较强的创新联系,外向辐射以长江三角洲的城市为主。对中国创新联系格局规律的揭示,更进一步强化了中国创新城市体系中城市的作用,并为规划与建立中国创新都市圈提供依据。
The impact of KIBS' location on their innovation behaviour
DOI:10.1080/00343404.2019.1684463
[本文引用: 1]
Knowledge-intensive business services (KIBS) are widely perceived as being important drivers of technological progress and innovation. They generally depend on knowledge exchanges and, therefore, geographical proximity to markets, customers and suppliers would be expected to be a critical factor in their performance. This paper investigates how the innovation performance of German KIBS firms is related to their distance and size from the nearest city. The analysis largely conforms to a textbook type of spatial urban hierarchy and, indeed, finds that there are very strong distance-decay and city size effects, and these also vary according to the innovation type.
The geography of knowledge revisited: Geographies of KIBS use by a new rural industry
DOI:10.1080/00343404.2020.1800628 URL [本文引用: 1]
The agglomeration and reasons of knowledge-intensive business service in Yangtze River Delta region
长三角知识密集型服务业集聚特征与成因
Spatial correlation characteristics and dynamic mechanism of knowledge intensive business service: A spatial econometric analysis of Guangdong province
DOI:10.13249/j.cnki.sgs.2014.010.1193
[本文引用: 1]
This article explored the exploratory spatial data analysis(ESDA) and spatial econometric model to check the spatial distribution of KIBS as well as its spatial dynamics factors across Guangdong Province. There are four main findings. First, it is described that the spatial distribution of KIBS which shows that cities in the Pearl River Delta(PRD) have the highest level across Guangdong Province, though there are discrepancy among different sectors in KIBS.Second, there is a spatial positive correlation relationship and spatial uneven distribution of KIBS among cities of Guangdong Province, which has a location of general dispersion and local concentration across this region. Third, most cities in PRD are KIBS hot spots with a high value agglomeration area, while the rest other cities in the eastern, western and northern of Guangdong are located incold area of KIBS, and the diffusion effect which come from the high level area(the PRD)remains limited to these adjacent cities, this lead to the regional lock-up effect of these cities to be low-low concentration for a couple of years. Fourth, a number of dynamic factors were used to interpret the spatial distribution of KIBS across Guangdong Province, result shows that urbanization, industrialization, ICT, economic openness and transport facilities play a positive role in promoting the development of KIBS, amongst which urbanization factor is the most important factor.While market demand factor has a negative influence on the development of knowledge intensive business service. Therefore, promoting urbanization level, improving the level of new industrial development and popularization of ICT infrastructure construction, increasing foreign investment, and revising the negative effect of market demand, all can effectively promote the development of KIBS in Guangdong Province.
知识密集型服务业空间关联特征及其动力机制分析: 基于广东省21个地级市的实证
DOI:10.13249/j.cnki.sgs.2014.010.1193
[本文引用: 1]
以转型中的经济大省广东为例,运用探索性空间数据分析法和空间常系数模型,分析广东省知识密集型服务业(KIBS)发展水平的地区差异、空间关联特征及其动力机制,研究结论表明:① 广东省各地级市KIBS产出总体上以珠三角城市最高,但各行业存在空间差异;② 广东省地级市KIBS呈空间正相关特点,但空间结构极不平衡,呈“总体分散、局部集中”分布格局,珠三角内诸城市属于KIBS热点区域,是高值集聚区,粤东西北的大部分城市是位于冷点区域,4 a间没有突破低值集聚的现状,也揭示了珠三角地区内相邻城市的KIBS具有竞争性,尚未形成有效的扩散-协同的发展格局;③ 广东省KIBS空间格局的动力因子分析表明:城市化、工业化、信息化、经济外向度和交通通达性均对KIBS发展有促进作用,而市场需求对KIBS发展产生负向影响。
Comprehensive regionalization of human geography in China
DOI:10.11821/dlxb201702001
[本文引用: 3]
The comprehensive regionalization of Chinese human geography is based on the rules governing regional differentiation of Chinese physical geography factors. Based on regional differences and similarities in human factors, this study divides the whole country into two levels of relatively independent, complete and organically linked human geographic units. As a fundamental, comprehensive, cutting-edge, practical and important task, the comprehensive regionalization of human geography highlights the characteristics, regional and sub-regional features, complexity and variety of spatial differences between factors of Chinese human geography. It is capable of promoting the development of human geography based on local conditions, providing basic scientific support to national and local development strategies, such as the Belt and Road Strategy, new urbanization and environmental awareness, and creating a sound geopolitical environment in key areas. Using results from existing physical and human geography zoning studies, and in accordance with the principles of synthesis, dominant factors, the relative consistency of the natural environment, the relative consistency of economic and social development, the consistency of the regional cultural landscape, the continuity of spatial distribution and the integrity of county-level administrative divisions, and taking as its basis the division of human geography into 10 major factors (natural condition, the economy, population, culture, ethnicity, agriculture, transportation, urbanization, the settlement landscape and administrative divisions), this paper constructs an index system for the comprehensive regionalization of Chinese human geography through a combination of top-down and bottom-up zoning and spatial clustering analysis. In this study, Chinese human geography is divided into eight regions (first level) and 66 sub-regions (second level). The eight human geography regions are (I) Northeast China, (II) North China, (III) East China, (IV) Central China, (V) South China, (VI) Northwest China, (VII) Southwest China, and (VIII) Qinghai and Tibet. This zoning proposal fills gaps in studies involving the non-comprehensive regionalization of Chinese human geography. Each human geography region and sub-region has different topographical, climatic, ecological, population, urbanization, economic development, settlement landscape, regional cultural and ethno-religious attributes. This proposal on the comprehensive regionalization of Chinese human geography dovetails closely with previous studies on comprehensive regionalization in Chinese physical geography, Chinese economic zoning, and Chinese agriculture zoning. It shows that, under the dual roles of nature and humans, there are certain rules of regional differentiation that govern the comprehensive regionalization of Chinese human geography.
中国人文地理综合区划
DOI:10.11821/dlxb201702001
[本文引用: 3]
中国人文地理综合区划是以中国自然地理要素的地域分异规律为基础,充分考虑全国人文要素的地域分异性和相似性,将全国划分为不同空间层级、相对独立完整、并具有有机联系的特色人文地理单元。是一项基础性、综合性、前沿性与实用性的重要工作。通过人文地理综合区划,将突出中国人文地理要素的地域分异性、地方特色性和复杂多样性,因地制宜地推动人文地理学科发展,为面向国家和地方发展战略需求推动“一带一路”建设、新型城镇化和生态文明建设、为营造重点地区良好的地缘政治环境提供基础性的科学支撑。本文在吸纳已有的各类自然和人文地理区划成果的基础上,按照综合性、主导性、自然环境相对一致性、经济社会发展相对一致性、地域文化景观一致性、空间分布连续性与县级行政区划完整性等原则,以自然、经济、人口、文化、民族、农业、交通、城镇化、聚落景观和行政区划10大要素为基础划分依据,构建中国人文地理综合区划指标体系,采用自上而下与自下而上相结合的区划思路和空间聚类分析方法,将中国人文地理划分为东北人文地理大区Ⅰ、华北人文地理大区Ⅱ、华东人文地理大区Ⅲ、华中人文地理大区Ⅳ、华南人文地理大区Ⅴ、西北人文地理大区Ⅵ、西南人文地理大区Ⅶ和青藏人文地理大区Ⅷ共8个人文地理大区和66个人文地理区。该区划方案填补了中国人文地理没有综合区划的空白。各个人文地理大区和各个人文地理区之间呈现出不同的地形地貌属性、气候属性、生态属性、人口属性、城镇化属性、经济发展属性、聚落景观属性、地域文化属性和民族宗教属性。中国人文地理综合区划方案与已经划出的中国自然地理综合区划、中国经济区划、中国农业区划等有较大程度的吻合性,体现出在自然与人文要素双重作用下的中国人文地理综合区划的地域分异规律。
Spatial pattern and determinants of Chinese urban innovative capabilities based on spatial panel data model
DOI:10.13249/j.cnki.sgs.2017.01.002
[本文引用: 1]
<p>The article explored the spatial pattern and determinants of Chinese urban innovative capabilities based on Gini index, trend surface analysis, spatial panel data model methods using urban patents data during 2003 to 2013. The results show that: 1) Spatial pattern of Chinese urban capabilities is highly agglomerated in center cities in three coastal metropolitan areas and regional center cities inland. The hot spots of innovation are highly agglomerated in regions around Beijing, Shanghai, and Shenzhen. Innovation abilities are spreading to inland cities with the time goes, although high innovative cities still agglomerated in coastal region. The Gini index of three patent output have decreased since 2011. 2) The technology level decreases with the invention patent, design patent, utility-patent, while the agglomeration level proxy by the Gini index, rises in sequence. 3) Spatial correlation of three kinds of patents is all significantly positive, and the correlation has been strengthened especially for appearance patent and utility patent. The correlation of appearance patent, utility patent and invention patent decrease in turn which indicates that lower technology can be spread and spillover more easily. The spatial trend surface analysis shows that there are high east and low west trend of innovative abilities, the north-south trend is not obvious, except for the utility patent show the inverse U shape of “high middle and low end” trend. 4) The results of spatial panel econometric models show that there are significant spillovers among urban innovative capabilities. The main influential factors include government support, industrial foundation, higher education sources, innovation input and economic openness, in which the influences of government support and higher education resources have been reinforced. The results show that dependent and independent variables have significant spatial dependence, indicates that urban abilities are heavily affected by the surrounding areas, the higher innovative surrounding areas can promote local innovative abilities. The spatial lag effect denotes that the high education resources and industrial foundation of neighboring cities have positive effects on cities innovation output, while the government support of neighboring cities have negative effect on urban innovation output. 5) Therefore, to promote urban innovation capabilities, government should still put forward the concept of innovation-driven concept, try to attract and nurture innovative enterprises; second, to promote urban higher education qualities and manufacture foundations, encourage enterprises to promote R&D input, and encourage the cooperation between industry, school and research; third, government should induce the innovation cooperation among cities, regions, and universities, drive the free flow of talents and innovative elements and promote the innovative spillovers among cites.</p>
中国城市技术创新能力的空间特征及影响因素: 基于空间面板数据模型的研究
DOI:10.13249/j.cnki.sgs.2017.01.002
[本文引用: 1]
基于2003~2013年城市专利数据采用基尼系数、趋势面分析、空间动态面板数据模型等方法探讨了中国城市技术创新能力的空间分布和影响因素。研究发现:① 中国创新能力高的城市高度集聚在沿海三大区域及内地的区域中心城市,随着时间推移,创新能力在空间上呈现扩散的趋势。城市技术创新能力的空间相关性逐渐增强,推动了创新的区域扩散和空间溢出。② 发明专利、外观专利和实用新型专利的创新水平依次降低,空间集聚程度依次提高,空间相关性依次提高。③ 固定效应面板数据的空间滞后模型和空间Durbin模型的计量结果发现,城市技术创新能力存在显著的空间溢出效应,邻近城市技术创新能力的提升有助于提升该市的创新能力。政府支持、工业基础、高等教育资源、创新投入、经济外向度显著影响城市技术创新能力水平的提升,且政府支持和城市高等教育资源对城市技术创新能力的影响出现增强趋势。
Spatio-temporal evolution and factors influencing international student mobility networks in the world
DOI:10.11821/dlxb202004002
[本文引用: 1]
Based on the data released by UNESCO on international student mobility in tertiary education from 2001 to 2015, this paper draws on network science to construct a multidimensional weighted directed network heterogeneity model. This model combines the GIS spatial analysis method and the negative binomial regression model to study spatiotemporal evolution and factors influencing international student mobility networks. The results are as follows. First, in terms of the evolutionary characteristics of time series, the linkages of international student mobility networks have increased from 4921 to 9137, and its average weighted degree centrality has rapidly increased from 8004 to 20,834, which indicates that both the number of international students and the choices of overseas routines are mounting. Second, in terms of the topological structure, it has evolved from a single core comprising the United States into dual cores comprising the United States and China. Gradually, Asian countries have become the main body of international student mobility networks, while the centrality of European countries has reduced. Thirdly, in terms of spatial structure, the international student mobility network has a significant core-periphery structure and hierarchical characteristics. The countries in the core, strong semi-periphery and semi-periphery alternate with countries from other tiers. The spatial patterns of the international student mobility network "from east to west, and from south to north" are changing. China and Australia have become the new regional centers of international student mobility networks, meaning that regionalization has become an important trend. Finally, regression analysis shows that the flow of international students correlates positively with the quality of higher education in destination countries, the number of students in colleges and universities, the per capita GDP, the historical links connection between the destination country and the country of origin, and the level of globalization. Geographical distance and linguistic proximity have a significant negative correlation with the flow of international students, indicating that the impediment of language is rapidly weakening, while geographical distance still hinders student mobility.
全球留学生留学网络时空演化及其影响因素
DOI:10.11821/dlxb202004002
[本文引用: 1]
基于联合国教科文组织公布的全球高等学校留学生流动数据,借鉴网络科学,利用社会网络分析方法和负二项回归模型,对2001—2015年全球留学网络时空演化及其影响因素进行研究。主要结论为:① 时序演化特征上,全球留学网络关系流从4921个增加到9137个,平均加权度从8004迅速增加到20834,表明全球留学网络不仅学生数量在增加,且留学路径数量也在不断增加。② 拓扑结构上,从以美国为单一核心,演变成以美国、中国为双核心的拓扑结构,亚洲国家逐渐成为全球留学网络的主体,欧洲国家的中心性逐渐萎缩。③ 空间结构上,全球留学网络具有明显的等级层次性,美国是全球性主导型节点,德国、捷克是区域性主导型节点,次级主导型节点从25个增加到32个,全球留学网络“东向西、南到北”的地理空间格局正在发生变化,中国、澳大利亚等国成为新的区域性中心,区域化成为全球留学网络一个重要趋势。④ 回归分析发现,留学目的地国高等教育质量、高校在校生数量、人均GDP、留学目的地国与留学生来源国间的历史联系及全球化水平与留学生流量呈显著正相关关系,地理距离、语言临近性与留学生流量呈显著负相关关系,表明语言差异的阻抗作用在迅速减弱,地理距离仍然是阻碍学生流动的一个重要因素。
Analysis on the spillover effect of foreign direct investment on China enterprises: A report from the data of the first national economic census in China
外国直接投资对中国企业的溢出效应分析: 来自中国第一次全国经济普查数据的报告
Exploring financial centre networks through inter-urban collaboration in high-end financial transactions in China
DOI:10.1080/00343404.2018.1475728 URL [本文引用: 1]
Between spilling over and boiling down: Network-mediated spillovers, local knowledge base and productivity in European regions
DOI:10.1093/jeg/lby058
[本文引用: 1]
Productivity across European regions is related to three types of networks that mediate R&D-related knowledge spillovers: trade, co-patenting and geographical proximity. Both our panel and instrumental variable estimations for European regions suggest that network relations are crucial sources of R&D spillovers, but with potentially different features. Both import and co-patenting relations affect local productivity directly, but spillovers from innovation-leading regions are effective only when they are import-mediated and when recipient regions have a solid knowledge base. From a policy perspective, this may frustrate recent European policy initiatives, such as Smart Specialization, which are designed to benefit all regions in Europe.
