

1 引言
中国已步入新型城镇化和乡村振兴深度融合、高质量发展的新阶段,协同推进城乡基础设施一体化、基本公共服务均等化已成为促进城乡融合发展的基本前提[1,2]。其中,能源作为城乡居民生存与发展的基础要素,通过能源转型实现更合理的城乡能源配置、更平等的城乡能源消费是缩小城乡发展水平差距、推动农村现代化的重要标志,受到政府决策者和学者的广泛关注。既有研究显示,中国家庭使用固体燃料做饭的比重从2010年的50%迅速下降到2012年的39%,城市与农村家庭由固体燃料转型为清洁能源的比重分别为9%和18%[3]。对中国34489个家庭的调查还发现,农村地区木材、农作物残渣等传统能源消费量显著下降,能源转型现象在农村地区更为显著[4]。此外,2013年以来中国大气污染治理进程全面提速,推动能源清洁化、低碳化转型的多项行动计划与工作方案相继出台并实施,能源结构优化调整措施进一步加快城乡家庭能源转型。
随着中国“碳达峰、碳中和”目标行动计划不断推进,能源供需体系的系统性变革将引起大范围的城乡家庭能源转型。为此,探究地区间家庭能源平等的时空特征、能源转型效果及其影响因素,是一项客观评价城乡能源资源配置均衡程度、揭示绿色生活方式转变差异以及民生福祉提升水平的基础性研究,对缩小城乡家庭能源消费差距、实现能源平等具有重要的科学价值与政策启示。鉴于此,本文基于地理学综合视角,以城乡家庭生活能源支出为切入点,测度2013—2017年间城乡家庭能源平等的空间分异规律及其影响因素,并讨论地区间能源转型效果,以期为促进城乡家庭能源平等的政策制定、差异化的能源转型路径设计提供科学依据。
2 理论基础与研究方法
2.1 能源平等
能源平等是指能源数量和质量满足不同时空人群生存发展消费需求的均衡性[5]。地区或城乡间发展差距是各类要素在空间上非均衡分布及再生产的结果[2, 6-7],为此,从区域发展差距和能源要素时空配置角度,城乡间能源平等性的演变过程可概括如下(图1):在低水平均衡阶段,柴薪、木材等遍在性生物质能源在城乡空间均匀分布,能源要素空间配置呈现低水平均衡特征;伴随能源供给与消费市场的发展、能源基础设施差别化布局以及城乡收入差距扩大,现代商品能源的空间分布加速失衡,地区间能源不平等程度加大;而当城乡发展进入融合化、均等化发展阶段,现代能源基础设施持续向农村地区延伸,农村能源系统加快转型,城乡家庭能源消费最终达到高水平均衡的状态。
图1
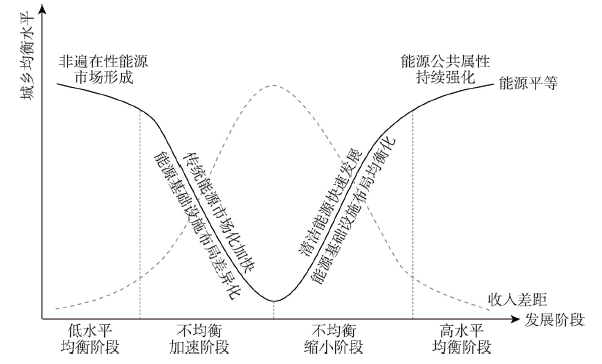
通过对发达和发展中国家城乡家庭能源消费特征进行对比分析,进一步佐证了上述理论路径,即随着发达国家的现代化能源基础设施以及供给服务实现均衡化布局,家庭能源消费水平的空间差异已基本消除[8,9,10];而就发展中国家而言,能源市场发育的不均衡、不充分深刻影响着城乡间能源平等性[11,12,13,14,15]。正如Zheng等调查发现,中国城乡家庭在能源消费总量和能源消费结构均存在明显差异,2015年城镇与农村家庭平均能源消费水平为1275 kgce/户和1153 kgce/户[16],其中城镇家庭柴薪、煤炭等固态初级能源消费量占家庭能源消费总量的比重仅为3.3%,而在农村家庭则高达51.3%,而同期美国城乡家庭的平均消费水平为2729 kgce/户、2966 kgce/户,且能源消费结构无明显差异[17]。
基于乡村振兴及城乡融合理念,实现城乡能源平等实质上是实现能源要素在城乡之间的人本化、协同化与可持续化配置(图2)。其中,人本化主要体现在城乡居民平等享有消费同质且足量能源的机会与权益,是城乡能源均衡配置的出发点与落脚点;协同化则体现在城乡现代化能源设施网络的均衡布局,主要表达协同高效的能源供给网络体系对城乡能源平等的支撑作用;可持续化则体现在家庭能源绿色、低碳转型,以此降低能源消费对生态环境的胁迫程度,是全面实现城乡能源公平的基本前提。
图2
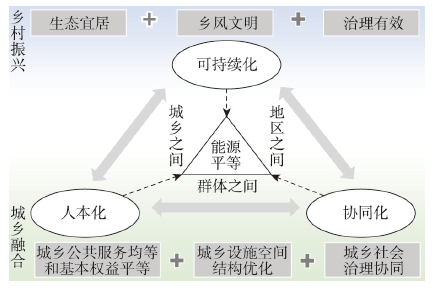
图2
乡村振兴和城乡融合发展理念与实现城乡能源平等的内在关联
Fig. 2
The essential links between strategies of rural revitalization, urban-rural integration development and achieving energy equality in urban and rural households
尽管国内对能源平等理论与评价的相关研究尚不多见,但国外已从能源需求和能源负担两个维度对能源公平性(Energy Justice)开展了评价。其中,能源公平被定义为能源在满足人类生存基本需求和推动社会进步中的分配公平性,并认为对能源需求受到抑制的发展中国家开展能源公平研究尤为重要[18]。此外,能源公平除强调能源基础设施在发展中国家的均衡性、充分性配套布局之外,还涵盖能源消费的可负担性[19],以及家庭能源消费对其他基本需求(如住房、食物、学习、工作和医疗保健等)影响程度的差异性[20,21]。如已有对拉丁美洲国家、越南、印度的调查均发现,城乡家庭能源消费存在着明显差距[22,23,24]。此外,已有研究普遍认为当某一家庭无法获得现代能源[25,26,27,28,29,30,31]或能源负担超过10%[10, 32-34]时则可认为该家庭处于能源贫困,还提出LIHC(Low Income High Cost)判断准则,即把低收入、高能源消费的家庭视为能源贫困家庭[35]。但值得注意的是,采用能源负担进行能源公平评价更适合于对经济社会相对发达、现代化能源市场相对成熟、消费理念相对先进的高收入国家研究之中,而对发展中国家而言,结合已有研究成果[36,37],这一指标则存在以下两个局限:① 现代能源基础设施的短缺与空间布局的不均衡明显限制了局部地区家庭能源基本需求;② 大量免费生物质初级燃料的广泛使用降低了家庭能源负担,在一定程度上影响着这一指标的科学性。为此,评价发展中国家地区或城乡能源平等性应根据其社会发展阶段,提出更能客观反映地区间能源消费规模与质量差异的技术方法。
2.2 数据来源
由于现行农村家庭能源消费统计数据的不确定性和不充分性[3-4, 38-39],家庭能源消费相关统计数据往往低于实际情况。例如,在华北地区农村家庭的抽样调查中发现,家庭平均煤炭消费实际量是年鉴统计数据的3倍[40];通过对中国183个县17000个家庭的调研及估算,2010年农村地区家庭煤炭消费量比相应统计数据高出62%[41]。因此,本文以北京大学中国社会科学调查中心提供的中国家庭追踪调查(China Family Panel Studies, CFPS)为主要数据来源,采用该调查中城乡家庭能源支出的相关数据进行城乡家庭能源平等研究。选用该数据集的优势如下:作为全国性、综合性的社会追踪调查项目之一,该调查能够较好追踪收集家庭数据,反映当前中国家庭能源转型特征;该数据集现势性较优,有利于刻画能源政策推动下城乡家庭能源转型经济负担的变化趋势;相较于能源消费数据,能源支出数据更能综合反映家庭在商品能源结构或品质上的差异性,从而更适用于能源平等性测度。故本文尝试利用家庭人均能源支出数据刻画区域及城乡间的家庭能源平等关系。此外,行政边界数据从国家基础地理信息系统网站获取,各地区人口、社会经济数据主要来自相应省份的统计年鉴。
考虑到中央及各级地方政府在2013年以来纷纷出台相关政策措施推动城乡家庭能源转型,为评估政策实施对城乡家庭能源消费支出的影响,采用2013年和2017年两期截面数据进行家庭人均能源支出估算,如公式(1)所示:
式中:Per_cost表示某一家庭人均能源支出;Feeelec、Feefuel分别表示该家庭月均电费、燃料费支出;Feeheat表示家庭供暖费支出;Fam_size表示家庭成员数量。
图3
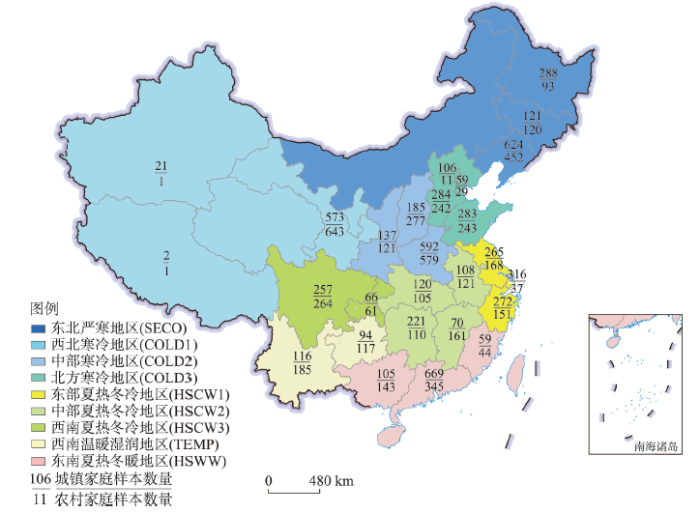
图3
调查样本分布与分区
注:基于自然资源部标准地图服务网站审图号为GS(2019)1823号的标准地图制作,底图边界无修改。
Fig. 3
Geographical distribution of sample size and divisions according to economic and climatic conditions
2.3 研究方法
基于城乡地域界面,测度不同区域城乡家庭能源(不)平等程度是本文主要研究内容之一。为此,采用基尼系数(Gini Coefficient)及其分解技术综合测度地区和城乡间的家庭生活能源平等性及其构成。为进一步识别地区和城乡间差距的主要群体,采用洛伦茨不对称系数(Lorenz Asymmetry Coefficient, LAC)进行判别;为定量刻画城乡家庭能源支出随家庭收入变化的耦合关系,应用局部加权回归模型(Locally Weighted Regression, LOESS)进行测算;还采用多元线性逐步回归模型(Stepwise Regression)分析家庭能源消费支出分异的驱动力。
式中:G为基尼系数;N是对样本均等化分组后的组数;X是家庭累计比例;Y是人均家庭能源支出的累计比例,并按照从小到大进行排序。基尼系数处于0~1之间,0代表样本间家庭人均能源消费支出绝对均衡,1代表绝对不均衡。一般来讲,若基尼系数低于0.2为高度均衡,0.2~0.3为比较均衡,0.3~0.4为相对合理,0.4~0.6为差距较大;当基尼系数高于0.6时,则表示差距悬殊。
式中:
式中:S为洛伦茨不对称系数;
(3)局部加权回归。基于R Studio平台[49],应用LOESS模型对人均家庭收入、人均能源支出进行曲线拟合。该模型作为非参数性回归方法,其主要优点是不需要指定适合所有数据的全局函数,而是对局部子集执行最小二乘回归,从而有效避免欠拟合、减小较远数据干扰。此外,这一模型可以使用span参数(范围介于0~1之间)控制平滑度,本文选择0.75作为span值,以控制邻域的大小并平滑散点图。
(4)多元线性逐步回归。为解析影响地区和城乡间家庭能源平等的驱动力,采用多元线性逐步回归进行分析[50]。同时,参考既有研究经验[3, 51-52],构建了用以反映家庭经济社会状况、气候条件、能源禀赋以及现代化能源可获得性的影响因素测度指标体系(表1)。其中,人均家庭生活能源支出为被解释变量(Per_cost);人均年家庭收入(Per_inco)、家庭人数(Fam_size)、居住聚落形态(城镇或乡村)(Urb)为解释变量,用以表征家庭社会经济状况;考虑到通电率在中国城乡间均已达到较高水平,地区间、城乡间差异性较小,分别选取城镇、农村天然气普及率作为衡量城乡能源可获得性的测度指标(Gas_acce)。
表1 变量定义及描述性统计
Tab. 1
| 变量 | 含义 | 单位与赋值 | 均值 | 标准差 | |||
|---|---|---|---|---|---|---|---|
| 2013年 | 2017年 | 2013年 | 2017年 | ||||
| Per_cost | 家庭人均能源支出 | 元/人,2010年不变价 | 670.50 | 867.45 | 535.15 | 693.75 | |
| Per_inco | 家庭人均收入 | 元/人,2010年不变价 | 14666.39 | 20559.83 | 17901.02 | 29455.53 | |
| Fam_size | 家庭人口规模 | 人 | 3.77 | 3.73 | 1.79 | 1.86 | |
| Urb | 城镇家庭或农村家庭 | 农村家庭,Urb=1 城镇家庭,Urb=2 | 1.49 | 1.51 | 0.50 | 0.50 | |
| Wea | 气候条件 | 严寒地区,Wea=1 寒冷地区,Wea=2 夏热冬冷地区,Wea=3 夏热冬暖地区,Wea=4 温暖湿润地区,Wea=5 | 2.50 | 2.53 | 1.06 | 1.07 | |
| Per_ener | 所在地区能源资源禀赋 | 吨标准煤/人 | 5.42 | 3.39 | 4.92 | 2.94 | |
| Gas_acce | 城乡天然气普及率 | % | 54.26 | 59.51 | 40.77 | 39.84 | |
3 结果分析
3.1 整体差异
整体来看,中国家庭人均能源支出呈现明显非均衡性,家庭能源不平等特征明显。2013年,中国家庭人均能源支出670.50元,全国基尼系数达0.466,且不对称洛伦兹系数为0.963(图4),表明低能源支出家庭是导致中国家庭能源不平等的主要群体。同期,城镇、农村家庭人均能源支出分别为825.01元、522.42元,其内部基尼系数分别为0.409、0.497,说明相较于城镇地区,农村地区的人均能源支出不平等特征更为突出。伴随地区间现代能源设施建设日益均衡,社会经济持续发展以及能源转型政策有效推动,到2017年,中国家庭人均生活能源支出增长至867.45元,而全国基尼系数却下降至0.440,家庭能源整体不平等程度有所缓和,但城乡之间的绝对差异依然较大,同期城镇、农村人均家庭的商品能源支出基尼系数分别为0.400、0.459。
图4
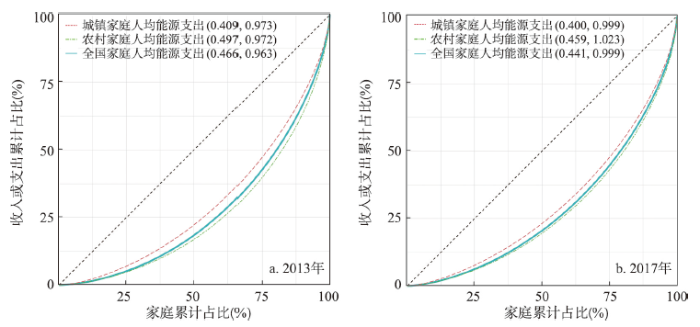
图4
2013年和2017年中国城乡家庭人均能源支出洛伦茨曲线
注:括号中第一个数字为基尼系数(G),第二个是数字为洛伦茨不对称系数(S)。
Fig. 4
Lorenz curve of per capita residential energy cost in urban and rural households in 2013 and 2017
为刻画城乡家庭能源支出与家庭收入的变化特征,进一步对人均能源支出和人均家庭收入进行曲线拟合(图5)。2013—2017年间,在同等人均收入条件下,农村家庭人均能源支出较城镇家庭表现出更显著的增长态势。值得注意的是,人均收入低于10000元的城镇家庭能源支出增长明显,当人均收入超过30000元之后,人均能源支出趋于平稳;而人均收入高于20000元的农村家庭能源支出增幅最为显著。
图5
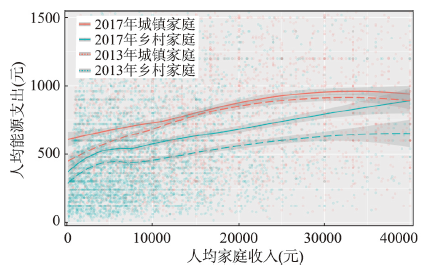
图5
城乡家庭人均能源支出与人均家庭收入拟合曲线
Fig. 5
Fitting curves between per capita energy cost and per capita income
人均能源消费支出的基尼系数分解结果如表2所示,2013年城乡之间家庭能源不平等是导致全国性不平等的主要原因,其贡献率达26.8%;其次是城镇家庭组内的差异,其对总体能源不平等的贡献率为26.2%。到2017年,城乡之间家庭能源支出的差距缩小,对全国总差异的贡献度下降至24.0%;而城镇家庭组内差距小幅增加,已成为影响全国性家庭能源不平等的主因。
表2 城乡家庭人均能源支出基尼系数分解
Tab. 2
| 比较项 | 2013年 | 2017年 | |||
|---|---|---|---|---|---|
| 基尼系数 | 贡献率(%) | 基尼系数 | 贡献率(%) | ||
| 城镇内部 | 0.122 | 26.2 | 0.125 | 28.3 | |
| 农村内部 | 0.096 | 20.6 | 0.087 | 19.7 | |
| 城乡之间 | 0.125 | 26.8 | 0.106 | 24.0 | |
| 交叠项 | 0.123 | 26.4 | 0.123 | 27.9 | |
| 总体样本 | 0.466 | 100.0 | 0.441 | 100.0 | |
3.2 区域差异
(1)地区经济发展水平与家庭生活能源不平等程度呈负相关。经济发展水平相对滞后的西南温暖湿润地区(TEMP)能源不平等程度最高,2013年和2017年基尼系数均超过0.5且呈增长态势(图6),洛伦茨不对称系数均大于1,表明能源不平等主要是由高能源支出家庭引起的。经济发展水平相对较高的长三角地区(HSCW1),其人均家庭能源支出分布相对合理,两期基尼系数分别为0.351、0.357。此外,2013年西北寒冷地区(COLD1)、中部寒冷地区(COLD2)、西南夏热冬冷地区(HSCW3)3个地区基尼系数也均超过了0.450,说明各区域内部家庭能源不平等问题较为突出。但到2017年,上述3个地区的基尼系数均显著下降,区内能源不平等问题明显改善。其中西北寒冷地区(COLD1)和中部寒冷地区(COLD2)的洛伦茨不对称系数均小于1,说明低能源消费支出家庭造成地区内部能源不平等的主要群体,而同期西南夏热冬冷地区(HSCW3)的洛伦茨不对称系数大于1,说明高能源支出家庭导致地区内部的能源不平等。
图6
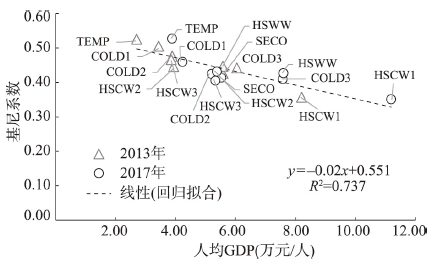
图6
不同地区人均GDP与人均能源基尼系数散点图
Fig. 6
Scatters of per capita GDP and per capita household energy cost by region
(2)城镇家庭生活能源不平等程度普遍低于农村家庭。就城镇家庭而言,除西南温暖湿润地区(TEMP)、西北寒冷地区(COLD1)两个经济发展水平相对滞后区外,其他地区城镇家庭人均能源支出差异均处于合理水平(图7)。具体而言,2013—2017年间,西南温暖湿润地区(TEMP)城镇家庭能源不平等特征最为突出,基尼系数由0.480增长至0.500;西北寒冷地区(COLD1)的基尼系数也由0.377增长至0.442。与上述两个地区明显不同的是,中部寒冷地区(COLD2)与北方寒冷地区(COLD3)的城镇家庭能源支出差异显著下降,城镇家庭的现代能源需求逐步均衡,基尼系数分别由2013年的0.458、0.410下降至2017年的0.393、0.385。而就农村家庭而言,除长三角地区(HSCW1)之外,其他地区农村家庭内部不平等性均较为突出。值得注意的是,到2017年,各地区农村家庭能源支出基尼系数均有不同程度的降低,尤其是,西南夏热冬冷地区(HSCW3)和西北寒冷地区(COLD1)的农村家庭基尼系数分别由2013年的0.521、0.532降低至2017年的0.443、0.445,一定程度上反映了近年现代能源基础设施在农村地区大规模建设布局的初步成效。值得注意的是,2017年位于西北、中部寒冷地区(COLD1和COLD2)、东部夏热冬暖地区(HSWW)、中部夏热冬冷地区(HSCW2)和西南温暖湿润地区(TEMP)的农村家庭人均能源支出洛伦茨不对称系数均大于1,显示出局部农村家庭的能源支出大幅增长成为农村家庭能源不平等的主要成因。
图7
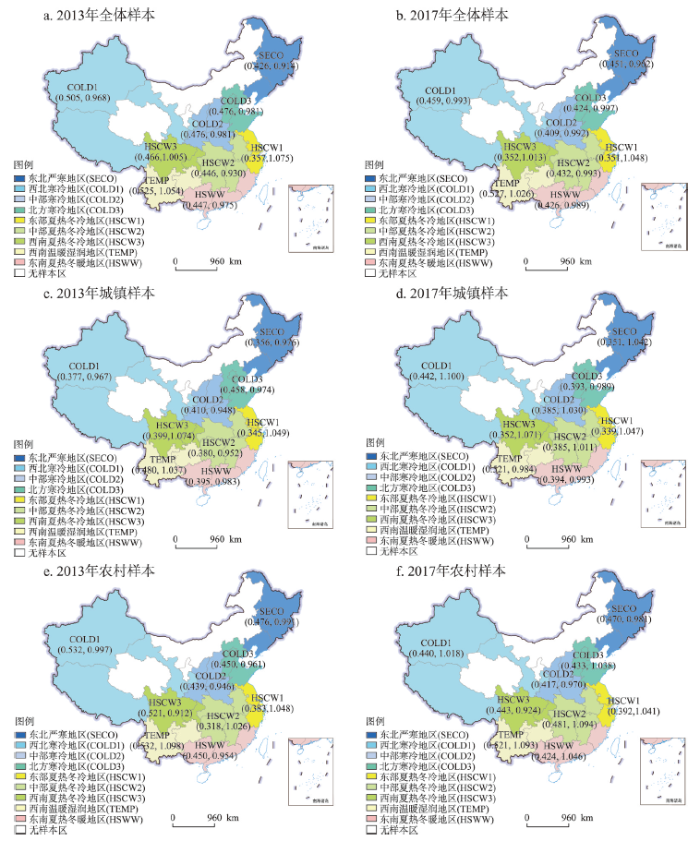
图7
2013—2017年中国不同地区城乡家庭人均能源支出的差异性
注:基于自然资源部标准地图服务网站审图号为GS(2019)1823号的标准地图制作,底图边界无修改;括号第一个数字为基尼系数G,第二个数字为洛伦茨不对称系数S。
Fig. 7
The disparity of per capita household energy cost between regions in China during 2013-2017
(3)城乡之间家庭能源不平等问题显著改善。对各地区基尼系数的分解结果显示(图8),东北严寒地区(SECO)以及东、中部夏热冬冷地区(HSCW1和HSCW2)家庭能源不平等主要由城镇家庭内部差异所致,其贡献率在2013年、2017年均超过了30%。尤其是长三角地区(HSCW1),城镇家庭内部能源不平等对区域总体差异的贡献率在2013年和2017年均超过50%。与之相反,西南夏热冬冷地区(HSCW3)、温暖湿润地区(TEMP)和西北寒冷地区(COLD1)家庭能源不平等则主要是农村家庭能源支出差异所导致,分别贡献了30.0%、42.1%、54.5%。此外,2013年中部寒冷(COLD2)、夏热冬冷地区(HSCW2)、北方寒冷地区(COLD3)以及东部夏热冬暖地区(HSWW)城乡家庭之间能源不平等对区域总体差异的贡献较为明显,其贡献率分别达到了31.1%、30.0%、28.3%、35.1%。受农村地区“煤改气”、“煤改电”行动影响,农村家庭人均能源支出显著增加,上述4个地区农村家庭人均能源支出在2017年的中位数较2013年依次增长了1.67倍、1.75倍、1.42倍、1.38倍,城乡家庭人均能源消费支出差距也随之显著缩小。
图8

图8
2013—2017年中国城乡家庭人均能源支出基尼系数分解
Fig. 8
Decomposition of energy cost-based Gini coefficient by urban-rural household and region during 2013-2017
3.3 驱动因素
如表3所示,逐步回归模型的方差分析F值通过1%检验,表明所有解释变量对模型均有一定解释力;方差膨胀因子VIF均小于10,表明变量之间不存在冗余及多重共线性;而Jarque-Bera 检验结果也通过1%的显著性检验,回归系数残差非正态分布;决定系数R2表明OLS回归能解释约50%的人均家庭能源消费支出。回归结果表明,对家庭能源支出具有显著影响的因素依次为家庭收入、家庭规模、城乡居住区位、气候条件以及现代化能源可获得性,而当地能源资源禀赋的影响并不显著。各因素具体驱动作用如下:
表3 逐步回归估计结果
Tab. 3
| 变量 | 2013年 | 2017年 | ||||||
|---|---|---|---|---|---|---|---|---|
| 未标准化 系数(B) | 标准化 系数(Beta) | t统计量 | VIF | 未标准化 系数(B) | 标准化 系数(Beta) | t统计量 | VIF | |
| 常量 | 5.161*** | - | 57.438 | - | 5.310 | - | 59.152 | - |
| Per_inco | 0.195*** | 0.243*** | 28.444 | 1.124 | 0.178*** | 0.256*** | 28.143 | 1.193 |
| Fam_size | -0.102*** | -0.214*** | -25.466 | 1.091 | -0.099*** | -0.235*** | -27.323 | 1.069 |
| Urb | 0.217*** | 0.127*** | 9.079 | 3.014 | 0.112*** | 0.072*** | 5.069 | 2.887 |
| Wea | -0.116*** | -0.144*** | -17.492 | 1.052 | -0.139*** | -0.190*** | -22.542 | 1.022 |
| Gas_acce | 0.076** | 0.130** | 9.170 | 3.111 | 0.088** | 0.139** | 9.829 | 2.869 |
| Per_ener | -0.024 | -0.015 | -1.120 | 2.739 | -0.018 | -0.003 | -8.954 | 4.156 |
| 模型诊断 | 调整后R2 | F检验 | Jarque-Bera检验 | 调整后R2 | F检验 | Jarque-Bera检验 | ||
| 0.517 | 824.196*** | 25.512*** | 0.527 | 801.643*** | 31.754*** | |||
注:***为通过1%显著性检验,**为通过5%显著性检验。
从家庭社会经济状况的影响来看,人均家庭收入是影响家庭能源支出的主要驱动因素。2013年和2017年两期回归结果显示,人均家庭收入每增加1%,将引起人均家庭能源支出分别增加0.195%、0.178%。从其标准化系数来看,相较于其他驱动因素,人均家庭收入的影响最大,说明在家庭能源消费过程中,家庭收入对家庭能源需求规模、类型具有重要作用。其次,家庭人口规模与人均家庭能源支出呈现负相关,说明家庭人口规模越大家庭人均能源支出相对越小。一方面,受规模经济影响,在相同能源支出条件下,家庭人口越多,人均支出就越少。但更重要的是,相较于经济较发达地区和城镇地区,在家庭平均人口规模相对较大的经济欠发达地区、农村地区,能源消费支出通常较低(图9)。此外,城镇化水平的提升会显著增加人均能源支出。结合地区城乡人均家庭能源支出统计也表明(图10),城镇化对家庭生活能源需求及支出具有明显的促进作用。
图9
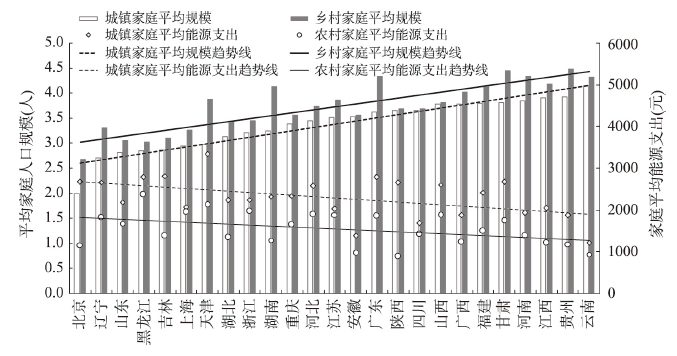
图9
2017年中国各省城乡家庭平均能源支出与平均人口规模
Fig. 9
Distribution of average household energy cost and average family size at the provincial scale in 2017
图10
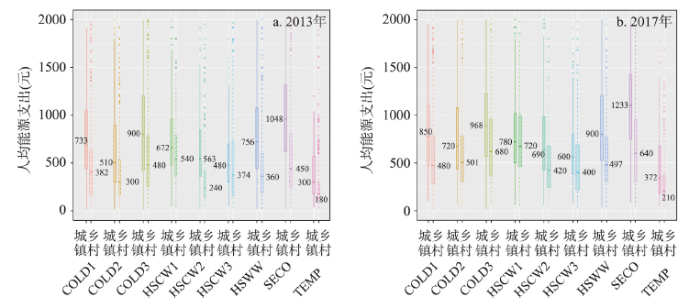
图10
地区城乡家庭人均能源支出分布箱型图
Fig. 10
Boxplots of per capita energy cost of urban and rural households by region
与已有研究结论相一致[3,4],气候条件的地区差异显著影响着家庭人均能源消费及其支出。从东北严寒地区到西南温暖湿润地区,城乡家庭人均能源支出均呈现出整体下降的态势。如图10所示,东北严寒地区(SECO)城乡家庭人均能源支出约是西南云贵地区(TEMP)城乡家庭人均能源支出的2.5倍之多。同时,推进现代清洁能源设施建设明显促进家庭能源转型并加大人均能源支出。2013年燃气普及率每提升1%,家庭人均能源支出将增加0.076%,而到2017年弹性系数为0.088%,说明城乡现代清洁能源设施对家庭能源转型具有显著的推动作用。但是,清洁能源更新也加重了农村家庭能源支出负担(图11),2013—2017年间,各地区农村家庭能源需求的经济负担显著增长,特别是中部与西北寒冷地区以及东北严寒地区,2017年能源支出占家庭收入比重的中位值分别较2013年增长了1.83个、1.30个、1.66个百分点。
图11

图11
地区农村、城镇家庭能源支出占家庭收入占比的中位值
Fig. 11
Medians of the proportion of household energy cost in the household's income by region
3.4 能源转型
采用城乡家庭做饭用能转型刻画城乡家庭能源转型效果,如表4所示,2013—2017年间,以柴草和煤炭为做饭燃料的家庭比重由34.1%下降至23.1%,而天然气和管道煤气用户占比则增长了8.7个百分点。不难看出,由于灌装煤气/液化气、太阳能/沼气、天然气/管道煤气、电力等现代清洁能源的覆盖面大幅提升,极大促进了中国城乡家庭能源转型过程。同时,能源转型效果存在显著的城乡差异。2013年78.7%的城镇家庭以气态燃料与电力为做饭能源,到2017年,这一占比上升到88.1%。而同期,尽管农村家庭能源转型效果较为显著,但农村家庭中选择气态燃料与电力为做饭能源的家庭占比(2017年为60.4%)仍远低于城镇家庭,柴草依然是农村家庭最普遍的能源类型。
表4 城乡家庭能源选择比例(%)
Tab. 4
| 年份 | 样本 | 传统固态燃料 | 现代清洁能源 | 其他 | ||||
|---|---|---|---|---|---|---|---|---|
| 柴草 | 煤炭 | 灌装煤气/液化气 | 太阳能/沼气 | 天然气/管道煤气 | 电力 | |||
| 2013 | 全样本 | 34.1 | 6.2 | 27.3 | 0.8 | 11.3 | 20.1 | 0.2 |
| 城镇样本 | 15.3 | 5.0 | 34.2 | 0.5 | 23.5 | 21.0 | 0.5 | |
| 农村样本 | 49.1 | 7.1 | 21.6 | 1.1 | 1.4 | 19.3 | 0.4 | |
| 2017 | 全样本 | 23.1 | 3.7 | 30.1 | 0.3 | 20.0 | 22.5 | 0.3 |
| 城镇样本 | 9.6 | 1.7 | 32.6 | 0.1 | 34.6 | 20.8 | 0.7 | |
| 农村样本 | 33.8 | 5.3 | 28.0 | 0.4 | 8.2 | 23.8 | 0.5 | |
对调查样本进一步统计显示(图12),2013—2017年间,全国共有2136个家庭实现由传统固态燃料向现代清洁能源的转型,占调查样本总量的17.7%。其中,农村地区实现能源转型的家庭为1526个,占已转型城乡样本的71.4%,表明农村地区是推动中国生活领域能源转型的主体。分地区来看,东部夏热冬冷地区(HSCW1)、夏热冬暖地区(HSWW)家庭生活能源现代化水平较高,现代清洁能源使用家庭占到调查总样本量的80%以上(表5),而西北寒冷地区(COLD1)中仅43.4%的家庭使用现代清洁能源,地区间能源现代化水平差异明显。此外,中国大部分区域现代清洁能源普及率显著提升,除长三角地区(HSCW1)和西南云贵地区(TEMP)之外,其他区域现代清洁能源普及率均提升了10个百分点以上,尤其是中部夏热冬冷地区(HSCW2)、西北寒冷地区(COLD1),其普及率分别提升了17.8个、16.8个百分点。
图12
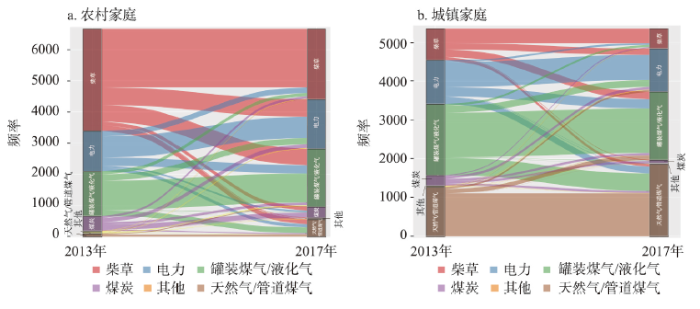
图12
2013—2017年间农村与城镇家庭能源转型示意图
Fig. 12
Transition of household cooking fuels in rural and urban areas during 2013-2017
表5 2013—2017年不同地区城乡家庭清洁能源普及率变化情况
Tab. 5
| 地区(代码) | 普及率(%) | 变化幅度(%) | ||
|---|---|---|---|---|
| 2013年 | 2017年 | |||
| 西北寒冷地区(COLD1) | 26.6 | 43.4 | 16.8 | |
| 中部寒冷地区(COLD2) | 61.7 | 76.2 | 14.5 | |
| 北方寒冷地区(COLD3) | 65.8 | 79.3 | 13.5 | |
| 东部夏热冬冷地区(HSCW1) | 86.5 | 93.8 | 7.3 | |
| 中部夏热冬冷地区(HSCW2) | 54.7 | 72.5 | 17.8 | |
| 西南夏热冬冷地区(HSCW3) | 48.1 | 62.9 | 14.8 | |
| 东部夏热冬暖地区(HSWW) | 67.7 | 83.4 | 15.7 | |
| 东北严寒地区(SECO) | 59.9 | 70.2 | 10.4 | |
| 西南温暖湿润地区(TEMP) | 58.8 | 68.4 | 9.6 | |
为进一步评价能源转型对城乡家庭经济负担的影响,对2136个家庭能源转型前后人均能源支出与人均收入进行了局部加权拟合。如图13所示,当城乡家庭实现能源转型后,人均生活能源支出均呈现不同程度的提升,城乡差距也随之显著缩小。但值得注意的是,相较于城镇家庭,农村家庭在能源转型后要承担更大经济压力。例如,城乡家庭人均收入在达到10000元时,城镇家庭转型前后的人均能源支出仅相差152元,而就农村家庭而言,转型后要比转型前承担额外225元的人均能源消费支出。
图13
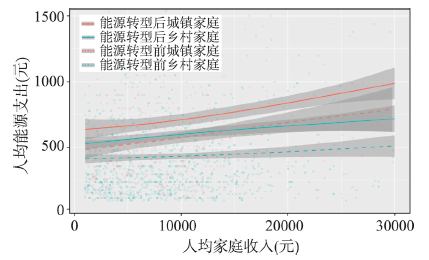
图13
能源转型前后城乡家庭人均能源支出与人均家庭收入线性拟合
Fig. 13
Fitting curves between per capita energy cost and per capita income for both urban and rural households before and after energy transition
4 结论与讨论
本文基于家庭追踪调查和各省区人口社会经济与自然环境数据库,动态解析了近年来城乡家庭能源平等关系的时空特征与驱动因素,并评价了家庭能源转型的成效与经济负担。结果表明:
(1)整体来看,当前中国家庭能源支出呈现出明显的非均衡性。其中,城乡之间的家庭能源不平等是导致2013年全国家庭能源不平等的主导因素,其贡献达26.8%。但伴随近年来中国全面推进能源转型政策的实施以及城乡融合发展的日益深化,到2017年,城乡之间的能源不平等性不断缩小,其对全国整体差异的贡献度也随之下降至24.0%。
(2)从空间上来看,西南云贵高原地区能源不平等现象最为突出,而长三角地区能源平等性相对较高,其他地区也均呈现不同程度的非均衡性。在中国全面实施城乡家庭能源转型政策的推动下,近年来各地区内部能源不平等程度普遍降低,尤其是城乡之间的不平等程度有所减小,其对各地区整体不平等的贡献率不断下降。
(3)从驱动因素来看,家庭收入、家庭规模、城乡居住区位、气候条件以及现代化能源的可获得性显著影响着家庭能源支出,而能源禀赋对其影响则不显著。其中,家庭收入是影响家庭能源支出与家庭能源平等性的主要驱动因素。因此,为进一步促进地区间、城乡间家庭能源平等,仍需关注经济与收入的地区差距。此外,城镇化对家庭生活能源需求及支出具有明显的促进作用,但其作用大小出现了降低的态势,说明农村地区能源设施和服务的日益完善在一定程度上推动了家庭能源需求增长与结构转型,从而削弱了城镇化的拉动效应。
(4)研究期间,相关能源政策对中国城乡家庭能源转型成效明显,使用柴草、煤炭等传统固态燃料的家庭大幅下降,而天然气或管道煤气用户显著增加,现代清洁能源逐渐成为中国家庭最普遍选择的能源类型。同时,除已基本实现能源现代化的长三角地区以及能源现代化水平相对较低的西南云贵地区之外,其他地区现代清洁能源普及率在4年间均提升了10个百分点以上。其中,农村家庭成为当前及今后推动生活领域能源转型的主体,但相对城镇家庭而言,也担负着更大的经济压力。
中国正处于城镇化快速发展的中后期,面临着城乡关系重塑与能源转型两大重要挑战。在此背景下,本文提出了能源平等的概念,并基于数据的可获得性以及测度指标的合理性,定量刻画了新时期城乡家庭能源平等性的时空演化过程,明确了影响家庭能源支出的驱动因素,并进一步评价了近年来城乡家庭能源转型效果的地区差异,为今后持续推动城乡能源公共设施服务均等化发展提供了决策依据与参考。但不可否认,本文也存在不足之处,如表征能源平等的技术方法与数据采集仍需进一步深入完善,特别是全面综合的家庭生活能源调查应纳入当前国家和地区抽样调查范围,以增强能源转型研究的数据基础。此外,由于篇幅所限,本文未就中国城乡家庭能源平等的调适机制进行深入研究,尤其是如何通过有效、有序地开展清洁能源补贴措施来真正实现城乡能源平等,这将是一个值得今后深入研究的科学命题。
参考文献
Approaches to rural transformation and sustainable development in the context of urban-rural integration
城乡融合背景下乡村转型与可持续发展路径探析
The basic theory and methodology of rural revitalization planning in China
DOI:10.11821/dlxb202006002
[本文引用: 2]

Agricultural and rural modernization is the general goal of the implementation of the rural revitalization strategy. The scientific formulation of the rural revitalization planning is related to the implementation effect of the national rural revitalization strategy. How to establish the basic theory of rural revitalization and develop the methods of rural revitalization planning have become important tasks of academic research and government decision-making. This paper constructed the theoretical model and method system of rural revitalization planning, tried to carry out the main function-oriented zoning, dominant type classification and principal purpose classification of rural regional system, and established the spatial system of rural revitalization planning and its optimal adjustment scheme. This system was applied to the overall rural revitalization planning in Yanchi County of Ningxia. By establishing the principle of rural revitalization planning that sticks to ecological priority, adaptation to local condition, industrial support and urban-rural integration, it put forward that the priority should be given to the development of rural professional cooperation organizations and the mixed economy of villages and towns, and the acceleration of the construction of advantageous industrial system characterized by the industrialization of tan-sheep, day lily, and minor cereals, and highlighted by the wisdom of eco-cultural tourism. Moreover, it was encouraged to give prominence to the position of the central town in space, and form the village organism and housing industry coordination body with the county seat and three key towns as the center of integrated industry development. The typical case study of Yanchi County has shown that the main contents and technical points of rural revitalization planning were embodied in the following four aspects: (1) determining the overall orientation of rural revitalization planning, and clarifying the phased development mode, key areas; (2) developing the county area based on the main function-oriented zoning, leading type classification and main purpose classification system, and exploring the territorial pattern and differentiation rules; (3) establishing the county development mode and industrial system, formulating coordination schemes of different main function-oriented zones, and revealing the spatial configuration and structural relationship of different dominant types; (4) exploring the local association and hierarchical system of each dominant type in its scale and level. The main task of implementing the rural revitalization planning is to promote the formation of a new pattern of urban-rural development with factors gathering, reasonable structure and orderly space in accordance with the objective requirements of "industrial prosperity, ecological livability, rural civilization, effective governance and prosperous life". China is facing great differences in rural development and many problems in transformation. Regional disparities and urban-rural differences determine the complexity, diversity and differences of rural governance and rural revitalization planning. China's rural transformation-urban and rural integration-rural revitalization-high quality development will become the major development logic and new normal in the future. The research on rural revitalization planning in the new era should focus on the overall situation of regional coordination and urban-rural integration, and solve the practical problems of "rural disease", so as to serve the national rural revitalization planning and scientific decision-making.
中国乡村振兴规划的基础理论与方法论
Quantifying the rural residential energy transition in China from 1992 to 2012 through a representative national survey
DOI:10.1038/s41560-018-0158-4 URL [本文引用: 4]
Measurement of inequality using household energy consumption data in rural China
DOI:10.1038/s41560-017-0003-1 URL [本文引用: 6]
Urban-rural development problems and transformation countermeasures in the new period in China
DOI:10.2307/142020 URL [本文引用: 1]
新时期中国城乡发展的主要问题与转型对策
Research on the urban-rural integration and rural revitalization in the new era in China
DOI:10.11821/dlxb201804004
[本文引用: 1]
Cities and villages are components of a specific organism. Only the sustainable development of two parts can support the prosperous development as a whole. According to the theory of man-earth areal system, urban-rural integrated system and rural regional system are the theoretical bases for entirely recognizing and understanding urban-rural relationship. To handle the increasingly severe problems of "rural disease" in rapid urbanization, accelerating rural revitalization in an all-round way is not only a major strategic plan for promoting the urban-rural integration and rural sustainable development, but also a necessary requirement for solving the issues related to agriculture, rural areas, and rural people in the new era and securing a decisive victory in building a moderately prosperous society in all respects. This study explores the basic theories of urban-rural integration and rural revitalization and analyzes the main problems and causes of rural development in the new era, proposing problem-oriented scientific approaches and frontier research fields of urban-rural integration and rural revitalization in China. Results show that the objects of urban-rural integration and rural revitalization is a regional multi-body system, which mainly includes urban-rural integration, rural complex, village-town organism, and housing-industry symbiosis. Rural revitalization focuses on promoting the reconstruction of urban-rural integration system and constructs a multi-level goal system including urban-rural infrastructure networks, zones of rural development, fields of village-town space and poles of rural revitalization. Currently, the rural development is facing the five problems: high-speed non-agricultural transformation of agriculture production factors, over-fast aging and weakening of rural subjects, increasingly hollowing and abandoning of rural construction land, severe fouling of rural soil and water environment and deep pauperization of rural poverty-stricken areas. The countryside is an important basis for the socioeconomic development in China, and the strategies of urban-rural integration and rural revitalization are complementary. The rural revitalization focuses on establishing the institutional mechanism for integrated urban-rural development and constructs the comprehensive development system of rural regional system, which includes transformation, reconstruction and innovation in accordance with the requirements of thriving businesses, pleasant living environments, social etiquette and civility, effective governance, and prosperity. Geographical research on rural revitalization should focus on the complexity and dynamics of rural regional system and explore new schemes, models and scientific approaches for the construction of villages and towns, which are guided by radical cure of "rural disease", implement the strategy of rural revitalization polarization, construct the evaluation index system and planning system of rural revitalization, thus providing advanced theoretical references for realizing the revitalization of China's rural areas in the new era.
中国新时代城乡融合与乡村振兴
Energy justice towards racial justice
DOI:10.1038/s41560-020-00681-w URL [本文引用: 1]
Recognition of and response to energy poverty in the United States
DOI:10.1038/s41560-020-0582-0 URL [本文引用: 1]
Racial disparities in energy poverty in the United States
Seasonal variation in food insecurity is associated with heating and cooling costs among low-income elderly Americans
DOI:10.1093/jn/136.11.2939 URL [本文引用: 1]
Living in utility scarcity: Energy and water insecurity in Northwest Alaska
DOI:10.2105/AJPH.2009.160846
PMID:20403886
[本文引用: 1]
This study explored the links between energy and water insecurity in rural Iñupiaq Eskimo villages in Alaska's Northwest Arctic Borough. High energy costs and the need for fuel-based transportation are 2 significant factors in domestic water access for these communities. Dramatic increases in the costs of energy have led to decreased domestic water access, with adverse effects on household hygiene practices. I traced the ways in which the high costs of energy determine water consumption from production to household acquisition and use. Improving sanitation and access to domestic water requires considering the water-energy nexus: the amount and cost of energy required to treat and distribute water as well as manage waste. I use the term utility scarcity to underscore the relationship between domestic water, energy, and health.
Energy and Social Issues//World Energy Council and UNEP. Energy and the Challenge of Sustainability
Cambodia's energy poverty and its effects on social wellbeing: Empirical evidence and policy implications
DOI:10.1016/j.enpol.2019.05.032
[本文引用: 1]
This study aims to quantify the incidence of energy poverty in Cambodia and its potential impact on the social wellbeing of the people of Cambodia. The notion of energy poverty of a household is not well understood in the context of literature as it may refer to either 'energy poor' or 'economically poor' condition of the household. This study defines energy poverty in terms of lack of accessibility and/ or affordability of energy, which may cause the deprivation of a household and affect its wellbeing. The study uses the latest Cambodia SocioEconomic Survey Data 2015 (CSES 2015) to investigate the impacts of energy poverty on the health, education and earning opportunities of the households. The findings of the study suggest that energy poverty of a household is strongly associated with the type of fuel used and low consumption of unaffordable clean energy by the household. The resulting impacts of energy poverty on the wellbeing of households are enormous. Energy poor households have a higher probability of its members suffering from respiratory problems, spending more on medical care, having a higher dropout rate from schools and lower earning opportunities than the households without energy poverty. Based on its findings, the study suggests an urgent need of policy measures focusing on provision of clean and affordable energy to poor households to reduce / eliminate energy poverty in Cambodia.
Household Energy Consumption in China: 2016 Report
Residential Energy Consumption Survey (RECS)
https://www.eia.gov/consumption/residential/.
Energy justice and sustainable development
Energy justice and ethical consumption: Comparison, synthesis and lesson drawing
DOI:10.1080/13549839.2012.748730 URL [本文引用: 1]
Energy Security, Equality and Justice
Energy justice: Conceptual insights and practical applications
DOI:10.1016/j.apenergy.2015.01.002 URL [本文引用: 1]
Household carbon and energy inequality in Latin American and Caribbean countries
Energy transition, poverty and inequality in Vietnam
DOI:10.1016/j.enpol.2019.06.001
[本文引用: 1]
This paper investigates energy transition, energy poverty and energy inequality in Vietnam employing a longitudinal dataset of a nationally representative household survey. We use the data on residential energy expenditure of more than 9,000 households over the period 2004-2016. We find a transition from traditional energy to modem energy but this transition varies across regions, between ethnic and welfare groups and between rural and urban population. The poor and ethnic minority households still rely heavily on traditional energy sources such as coal and biomass to meet their energy demands. Electricity poverty has decreased but energy-cost poverty has increased. In addition, energy inequality tends to decrease at a more significant rate than income and consumption inequalities. We propose a national program for energy poverty alleviation be established to devise policies to lower households' energy costs. Further assistance to the poor and ethnic minority households is also recommended so that they can afford a higher level of electricity consumption.
Are the energy poor also income poor? Evidence from India
Seasonal variation in food insecurity is associated with heating and cooling costs among low-income elderly Americans
DOI:10.1093/jn/136.11.2939 URL [本文引用: 1]
Energy poverty and income inequality: An economic analysis of 37 countries
Energy poverty: An overview
DOI:10.1016/j.rser.2015.03.013 URL [本文引用: 1]
Measuring energy poverty: Focusing on what matters
DOI:10.1016/j.rser.2011.07.150 URL [本文引用: 1]
Measuring energy poverty in Greece
DOI:10.1016/j.enpol.2016.04.004 URL [本文引用: 1]
Energy poverty policies in the EU: A critical perspective
DOI:10.1016/j.enpol.2012.01.033 URL [本文引用: 1]
Invisible energy poverty? Analysing housing costs in Central and Eastern Europe
Concerns over the allocation methods employed in the US low-income home energy assistance program
Getting the Measure of Fuel Poverty: Final Report of the Fuel Poverty Review
Household fuel choice in Zimbabwe: An empirical test of the energy ladder hypothesis
DOI:10.1016/0165-0572(87)90003-X URL [本文引用: 1]
Impacts of residential energy consumption on the health burden of household air pollution: Evidence from 135 countries
DOI:10.1016/j.enpol.2018.12.037 URL [本文引用: 1]
Inequality of household consumption and air pollution-related deaths in China
Transition of household cookfuels in China from 2010 to 2012
DOI:10.1016/j.apenergy.2016.07.136 URL [本文引用: 1]
Air pollutant emission from the underestimated households' coal consumption source in China
DOI:10.1016/j.scitotenv.2016.12.143 URL [本文引用: 1]
Underreported coal in statistics: A survey-based solid fuel consumption and emission inventory for the rural residential sector in China
DOI:10.1016/j.apenergy.2018.11.043 URL [本文引用: 1]
Variabilità e Mutuabilità. Contributo allo Studio delle Distribuzioni e delle Relazioni Statistiche
Urban-biased policies and rising income inequality in China
Calculation and decomposition of the overall gini coefficient in dual economies
二元经济中城乡混合基尼系数的计算与分解
A new decomposition of gini-coefficient by population subgroups
基尼系数组群分解新方法研究: 从城乡二亚组到多亚组
Methods of measuring the concentration of wealth
DOI:10.2307/2276207 URL [本文引用: 1]
Describing inequality in plant size or fecundity
DOI:10.1890/0012-9658(2000)081[1139:DIIPSO]2.0.CO;2 URL [本文引用: 1]
Refined forecast of low cloud cover around Hetao Area based on global weather forecasting system forecast field
基于全球天气预报系统对河套周边地区低云量精细化预报
Changing of energy consumption patterns from rural households to urban households in China: An example from Shaanxi Province, China
DOI:10.1016/j.rser.2007.03.002 URL [本文引用: 1]
Household level fuel switching in rural Hubei
DOI:10.1016/j.esd.2010.07.001 URL [本文引用: 1]
