

1 引言
人口迁移是区域人口结构、城镇化进程和社会经济发展水平的重要影响因素。1978年以来,随着中国改革开放,户籍制度改革不断深化,人口迁移的制度性限制因素逐步放宽,中西部欠发达地区、农村地区、生态脆弱地区人口大量迁入东部地区,推动了东部沿海地区、沿江地区的经济发展和城镇化进程[1]。尽管国家实施新型城镇化后,省内就近迁移逐步成为中国人口城镇化的主要模式[2],但作为中国人口迁移的重要组成部分,跨省人口迁移仍是关系区域经济均衡发展的关键要素[3]。根据第七次全国人口普查数据,1985—2020年中国省际人口迁移规模从约1100万人增加至5168万人,而中国常住人口城镇化率也在2020年末达到63.89%。中国省际人口迁移的地理格局和影响因素在学界受到长期关注[1,3⇓⇓⇓ -7],2015—2020年省际人口迁移的新格局、新特征、新机制亟待探索[8]。
引力模型是地理学、人口学和区域科学等广泛运用的宏观人口迁移模型。1946年Zipf的引力模型中仅包含3个解释变量:迁出地人口规模、迁入地人口规模、迁移距离[19],后来引力模型得到不断拓展。部分学者在引力模型中考虑了迁出地和迁入地的社会经济影响因素,提升了模型的解释能力[20⇓-22];部分学者则致力于提升引力模型的估计效率,降低模型的估计误差,先后提出了对数线性引力模型[23]、多层引力模型[4]、Hurdle引力模型[24],适用于截面数据的泊松及负二项引力模型[25-26]、适用于面板数据的泊松伪最大似然估计引力模型[27]。由于迁移流和相邻迁移流之间常存在网络自相关性,迁移流之间违背了相互独立的基本假设,引起了上述模型的内生性问题及误导性的结论[3]。为克服此类问题,往往采用空间计量交互模型[28]和特征向量空间滤波(ESF)引力模型[29]。其中,ESF引力模型受数据限制小,对人口迁移流中的网络自相关具有更好的处理能力[1,30 -31]。
省际人口迁移格局及影响因素研究是中国人口地理学界长期以来的重要研究方向之一[1,3⇓⇓⇓ -7,24,31⇓⇓⇓⇓⇓⇓⇓ -39]。人口迁移的研究数据主要来自全国人口普查长表数据或1%人口抽样调查数据,研究进展主要表现为:① 从截面分析转向面板研究。围绕当期人口普查或1%人口抽样调查数据,展开截面分析研究[3,4 -5,7,24,38],此类研究缺乏对省际人口迁移格局时空演化特征的认识;随着人口普查数据的不断积累,省际人口迁移研究逐步向演变过程转向,面板分析模型的估计精度得到不断提升[1,6,33,38]。② 研究对象不断细化。从关注省际人口迁移格局[31⇓⇓⇓⇓-36],逐步开始关注高技能人才、高校毕业生、一般劳动力、不同劳动力组别的人口迁移格局和影响因素[37-38]。③ 引力模型逐步精细化,研究结论更为稳健、可信。如多层引力模型[4]、ESF引力模型[37]、空间计量交互模型[7]、空间Hurdle引力模型[24]等逐步得到应用。过往的中国省际人口迁移研究表明,中西部地区人口正在向北京、上海、广东等东部发达地区迁移[33,35]。工资差异、就业市场稳定性等因素是影响中国省际人口迁移的主要力量,公共服务、环境舒适度、消费多样性等因素也已产生一定的影响[1,24,37]。
本文基于第六次、第七次全国人口普查数据和2005年、2015年全国人口1%抽样调查数据,运用特征向量空间滤波泊松伪最大似然估计(ESF PPML)引力模型,探讨了2000—2020年中国省际人口迁移的时空演化格局及影响因素,尤其是全面呈现了2015—2020年中国省际人口迁移地理图景。
2 研究区域、数据和方法
2.1 研究区域和数据来源
本文的研究涉及中国31个省级行政单位(省、自治区、直辖市),暂未含香港特别行政区、澳门特别行政区和台湾地区。2000—2005年、2005—2010年、2010—2015年研究数据分别来源于《2005年全国1%人口抽样调查资料》[40]《2010年第六次全国人口普查主要数据》[41]《2015年全国1%人口抽样调查资料》[42],2015—2020年数据来源于第七次全国人口普查研究课题支持数据。4个时段省际人口迁移规模为“全国按现住地和5年前常住地分的人口”,根据相应的抽样比(1.31%、9.55%、1.55%、9.84%)还原得到,并作四舍五入处理。省际迁移人口被定义为普查时点(2005年、2010年、2015年、2020年11月1日)及5年前常住地(2000年、2005年、2010年、2015年11月1日)不在同一省份的中国公民。研究对象为31个省份之间930条跨省人口迁移流。
文中计量模型所用各省人口规模数据来源于相应年份的全国人口普查及1%人口抽样调查,社会经济发展水平数据来源于1996—2016年的《中国统计年鉴》[43],省会城市间最短铁路旅行时间来源于2000年、2005年、2010年和2015年出版的《全国铁路旅客列车时刻表》[44],省际人口加权PM2.5浓度数据来源于圣路易斯华盛顿大学大气成分分析组(Atmospheric Composition Analysis Group)①(①数据来源网址:
2.2 量化指标和预处理
文中将跨省迁移人口流量设定为被解释变量,并从传统引力模型因素、社会经济发展水平、社会网络联系、环境舒适度、生活成本等5个维度,遴选18个解释变量,解释变量的描述性统计特征见表1。
表1 变量解释及描述性统计
Tab. 1
| 变量类型 | 变量 | 描述 | 均值 | 最小值 | 最大值 |
|---|---|---|---|---|---|
| 被解释变量 | Mij | 2000—2005年、2005—2010年、2010—2015年、2015—2020年按现住地i和5年前常住地j统计的跨省迁移人口流量(人) | 57447.210 | 0 | 3066511 |
| 传统引力模型变量 | POPi /POPj | 2000年、2005年、2010年、2015年各省普查时点常住人口规模(万人,自然对数) | 8.147 | 6.210 | 9.292 |
| DISTij | 2000年、2005年、2010年、2015年各省会城市之间铁路最短旅行时间(h) | 21.875 | 0.300 | 89.100 | |
| 地区社会经济发展水平 | WAGEi /WAGEj | 2000年、2005年、2010年、2015年各省城镇单位在岗职工年平均工资(元,自然对数) | 10.077 | 8.842 | 11.621 |
| GDPGi /GDPGj | 1995—2000年、2000—2005年、2005—2010年、2010—2015年各省GDP平均增长率(%) | 12.864 | 2.380 | 24.165 | |
| HTECi /HTECj | 2000年、2005年、2010年、2015年各省科技及教育发展支出占当年财政总支出比重(%) | 17.353 | 11.511 | 23.153 | |
| DOCi /DOCj | 2000年、2005年、2010年、2015年各省平均每个医院拥有执业医师数量(人,自然对数) | 4.531 | 3.747 | 5.181 | |
| 社会网络因素 | MSTOCKij | 1995—2000年、2000—2005年、2005—2010年、2015—2020年各省迁出人口在各迁出地的构成比(i省流向j省的迁移人数/ i省的总迁出人数,%) | 3.440 | 0.000 | 87.317 |
| 地区环境舒适度 | AIRi /AIRj | 2000年、2005年、2010年、2015年各省人口加权PM2.5浓度(μg/m³,自然对数) | 3.776 | 2.734 | 4.725 |
| TEMPi /TEMPj | 1995—2000年、2000—2005年、2005—2010年、2015—2020年各省1月与7月平均温差(℃) | 25.869 | 10.360 | 42.680 | |
| 地区生活成本 | HPi /HPj | 2000年、2005年、2010年、2015年各省住宅销售价格占当年居民可支配收入的比重(%) | 25.615 | 14.748 | 58.993 |
传统引力变量具体包括迁出省常住人口规模(POPi)、迁入省常住人口规模(POPj)、省会间最短铁路旅行时间(DISTij)。省会间最短铁路旅行时间能刻画省际间人口迁移成本,表征空间压缩效应[1]。社会经济发展水平变量是省际人口迁移的主要影响因子[6]。社会经济发展变量具体包括迁出省/迁入省城镇在岗职工年平均工资(WAGEi /WAGEj)、迁出省/迁入省经济发展平均增速(GDPGi /GDPGj)、迁出省/迁入省科技及教育投入占总财政支出比重(HTECi /HTECj)、迁出省/迁入省平均每个医院拥有执业医师数量(DOCi /DOCj)。在亲缘社会中,社会网络联系是省际人口迁移不可忽视的影响因素[3]。用流动链指数(MSTOCKij),即各省迁出人口在各迁出地的构成比,反映迁出和迁入省份之间的社会网络联系。环境舒适度是影响省际人口迁移的新因素。环境舒适度具体包括迁出省/迁入省人口加权PM2.5浓度(AIRi /AIRj)、迁出省/迁入省1月与7月平均温差(TEMPi /TEMPj)。生活成本越来越成为影响省际人口迁移的重要因素。用迁出省/迁入省住宅销售价格与居民可支配收入的比值(HPi /HPj)来表征生活成本对于人口迁移的影响。
有关模型中可能存在的内生性问题的讨论如下:使用期初变量作为解释变量,一定程度上缓解由反向因果问题导致的内生性;纳入空间滤波算子,减少模型残差中的自相关性,从而降低模型的内生性;数据来源于官方人口普查及人口抽样调查,有力地减少了因抽样误差导致的内生性;变量具有理论和实践经验依据,且模型中纳入时间固定效应,缓解了由于遗漏变量造成的内生性。此外,为检验模型中可能存在的严格多重共线性问题,计算各变量的方差膨胀因子(VIF),发现各变量VIF均低于4,因此不存在严格多重共线性。
2.3 特征向量空间滤波泊松伪最大似然估计(ESF PPML)
式中:
通过以下两个步骤筛选代表性特征向量:① 计算每一个特征向量E1, …, En对应的莫兰指数MI1, …, MIn,并选取特征向量莫兰指数MIn与最大莫兰指数MImax比值不小于0.25的子集;② 使用向前(p < 0.001)的逐步回归方法,进一步筛选最终纳入模型的特征向量。ESF PPML模型表达为:
式中:Ek代表第k个筛选后的特征向量;a6k为对应的回归系数。
3 2000—2020年中国省际人口迁移地理格局演化
3.1 人口跨省迁移规模先升后降
计算2000—2005年、2005—2010年、2010—2015年、2015—2020年中国跨省人口迁移总规模变化趋势,发现2000—2010年跨省迁移人口从3804万人增长为5756万人,达到顶峰,随后持续下降至2010—2015年的5328万人与2015—2020年的5168万人(表2)。该发现表征人口跨省迁移趋势呈现先升后降的特征,该特征与2014年实施的新型城镇化及逐步加深的户籍制度改革存在一定联系[45]。在区域均衡发展政策下,一系列就业机会、政策利好和公共服务均等化往中西部主要迁出地区转移致使原本的外迁务工劳动力转为省内就地、就近务工,同样导致近年来跨省迁移规模的下降[38]。计算省际人口迁移的莫兰指数、变异系数和基尼系数(表2),跨省人口迁移格局在20年间存在持续显著的网络溢出效应,跨省人口迁移流之间的空间关联性较强;变异系数和基尼系数仍然较高,说明跨省人口迁移仍体现出显著的不平衡特性。
表2 2000—2020年中国省际人口迁移特征统计
Tab. 2
| 2000—2005年 | 2005—2010年 | 2010—2015年 | 2015—2020年 | 总时段 | |
|---|---|---|---|---|---|
| 跨省迁移人口总量(万人) | 3804 | 5756 | 5328 | 5168 | 20056 |
| 莫兰指数(MI) | 0.323*** | 0.346*** | 0.350*** | 0.352*** | 0.343*** |
| 变异系数(CV) | 3.642 | 3.213 | 2.558 | 2.236 | 2.917 |
| 基尼系数(GI) | 0.817 | 0.777 | 0.712 | 0.684 | 0.751 |
注:莫兰指数(Moran's I)的公式为
3.2 中国省际人口迁移自中、西、东北部地区往东部地区的总体地理格局保持稳定
以中国各省区、四大地理分区及全国2000—2005年、2005—2010年、2010—2015年、2015—2020年迁出规模与期初人口规模(使用5岁及以上的人口数量,下同)的比值计算人口迁出率,迁入规模与期末人口规模的比值计算人口迁入率,净迁入规模和期初及期末人口规模均值的比值计算人口净迁移率,结果如表3所示。总体来看,中国人口迁移总体趋势在2000—2020年间保持稳定。东部地区具有相对较高的社会经济发展水平,是中国人口迁移的主要目的地:除山东、河北两省外,其余东部省份具有相对较高的迁入率、相对较低的迁出率、以及正的净迁移率。中部地区、西部地区和东北地区是人口外迁的主要地区:中部地区所有省份具有相对较高的迁出率、相对较低的迁入率、以及负的净迁移率;而西部地区和东北地区除新疆、宁夏、辽宁等部分省份在部分时段具有正的净迁移率,大部分地区净迁移率为负。
表3 2000—2020年中国各区域迁出率、迁入率和净迁移率
Tab. 3
| 年份 | 2000—2005年 | 2005—2010 | 2010—2015年 | 2015—2020年 | |||||||||||
|---|---|---|---|---|---|---|---|---|---|---|---|---|---|---|---|
| 地区 | OMR(%) | IMR(%) | NMR(%) | OMR(%) | IMR(%) | NMR(%) | OMR(%) | IMR(%) | NMR(%) | OMR(%) | IMR(%) | NMR(%) | |||
| 全国 | 3.241 | 3.099 | 0.000 | 4.690 | 4.578 | 0.000 | 4.237 | 4.115 | 0.000 | 3.992 | 3.880 | 0.000 | |||
| 东部地区 | 1.898 | 6.765 | 5.131 | 2.638 | 9.256 | 7.046 | 3.039 | 7.418 | 4.551 | 3.206 | 6.094 | 3.223 | |||
| 北京 | 2.513 | 14.901 | 13.588 | 2.820 | 21.168 | 21.070 | 3.929 | 19.399 | 16.441 | 6.265 | 12.401 | 6.275 | |||
| 天津 | 1.127 | 8.939 | 8.166 | 2.197 | 12.558 | 11.870 | 2.662 | 18.403 | 17.552 | 2.796 | 7.077 | 3.730 | |||
| 河北 | 1.569 | 0.936 | -0.588 | 3.231 | 1.442 | -1.728 | 3.747 | 1.663 | -1.980 | 2.821 | 1.662 | -1.137 | |||
| 上海 | 2.356 | 17.333 | 15.882 | 2.405 | 23.077 | 23.738 | 3.703 | 15.270 | 11.941 | 5.584 | 14.428 | 9.224 | |||
| 江苏 | 1.895 | 4.546 | 2.756 | 2.738 | 6.834 | 4.256 | 2.845 | 6.730 | 3.944 | 3.094 | 5.334 | 2.517 | |||
| 浙江 | 2.384 | 10.749 | 8.860 | 2.977 | 16.855 | 14.859 | 3.414 | 10.723 | 7.408 | 4.077 | 11.045 | 8.143 | |||
| 福建 | 6.884 | 1.150 | -5.550 | 9.914 | 1.542 | -8.626 | 7.603 | 1.940 | -5.499 | 6.001 | 3.698 | -2.332 | |||
| 山东 | 1.315 | 1.043 | -0.229 | 2.382 | 1.545 | -0.795 | 2.454 | 1.405 | -0.997 | 1.904 | 1.807 | -0.056 | |||
| 广东 | 2.152 | 13.565 | 12.230 | 1.909 | 14.714 | 13.716 | 2.619 | 10.499 | 8.085 | 3.148 | 7.537 | 5.175 | |||
| 海南 | 2.246 | 2.432 | 0.441 | 3.148 | 4.382 | 1.339 | 3.612 | 4.001 | 0.566 | 3.263 | 4.242 | 1.399 | |||
| 中部地区 | 4.937 | 0.794 | -4.071 | 7.382 | 1.249 | -6.152 | 5.974 | 1.784 | -4.079 | 4.974 | 2.259 | -2.710 | |||
| 山西 | 1.139 | 0.652 | -0.432 | 2.579 | 1.539 | -0.936 | 3.820 | 1.228 | -2.516 | 3.276 | 1.585 | -1.819 | |||
| 安徽 | 6.884 | 1.150 | -5.550 | 9.914 | 1.542 | -8.626 | 7.603 | 1.940 | -5.499 | 6.001 | 3.698 | -2.332 | |||
| 江西 | 6.576 | 1.241 | -5.077 | 9.067 | 1.778 | -7.169 | 6.511 | 2.100 | -4.248 | 5.542 | 2.895 | -2.667 | |||
| 河南 | 3.994 | 0.314 | -3.605 | 6.386 | 0.517 | -5.951 | 5.654 | 0.965 | -4.621 | 5.290 | 0.821 | -4.320 | |||
| 湖北 | 4.758 | 0.909 | -3.947 | 7.225 | 1.627 | -5.667 | 5.605 | 2.794 | -2.734 | 4.340 | 3.311 | -1.063 | |||
| 湖南 | 5.539 | 0.833 | -4.702 | 7.988 | 1.171 | -6.715 | 6.103 | 1.998 | -3.952 | 4.703 | 2.083 | -2.680 | |||
| 西部地区 | 3.668 | 1.201 | -2.355 | 5.242 | 2.093 | -3.181 | 4.678 | 2.523 | -2.039 | 4.377 | 2.698 | -1.575 | |||
| 内蒙古 | 1.884 | 1.710 | -0.102 | 2.942 | 3.673 | 0.808 | 2.681 | 2.822 | 0.188 | 2.679 | 2.720 | -0.074 | |||
| 广西 | 5.171 | 0.908 | -4.069 | 6.745 | 1.472 | -5.393 | 6.170 | 1.941 | -4.062 | 4.876 | 1.916 | -2.792 | |||
| 重庆 | 5.002 | 1.588 | -3.632 | 7.176 | 2.822 | -4.283 | 5.416 | 3.440 | -1.739 | 4.827 | 4.389 | -0.166 | |||
| 四川 | 5.086 | 0.973 | -4.076 | 6.656 | 1.447 | -5.329 | 4.823 | 2.073 | -2.653 | 4.243 | 2.744 | -1.442 | |||
| 贵州 | 5.514 | 1.519 | -3.686 | 8.026 | 1.918 | -6.500 | 7.726 | 3.040 | -4.592 | 7.422 | 2.441 | -4.595 | |||
| 云南 | 1.542 | 1.124 | -0.327 | 2.731 | 1.510 | -1.156 | 3.395 | 1.779 | -1.526 | 3.748 | 1.975 | -1.802 | |||
| 西藏 | 1.326 | 0.991 | -0.242 | 2.548 | 3.493 | 1.159 | 2.276 | 3.305 | 1.283 | 3.558 | 5.153 | 2.041 | |||
| 陕西 | 2.465 | 0.709 | -1.647 | 3.926 | 2.163 | -1.797 | 3.862 | 3.145 | -0.686 | 3.472 | 2.265 | -1.095 | |||
| 甘肃 | 2.103 | 0.475 | -1.560 | 4.425 | 1.126 | -3.364 | 5.132 | 1.572 | -3.497 | 5.588 | 1.525 | -4.246 | |||
| 青海 | 1.917 | 1.439 | -0.246 | 3.069 | 3.634 | 0.657 | 3.237 | 3.709 | 0.638 | 3.598 | 3.072 | -0.516 | |||
| 宁夏 | 1.346 | 1.336 | 0.128 | 2.825 | 4.252 | 1.613 | 3.553 | 3.022 | -0.340 | 3.265 | 3.801 | 0.796 | |||
| 新疆 | 1.062 | 3.050 | 2.195 | 1.585 | 4.340 | 2.955 | 2.107 | 4.044 | 2.141 | 2.546 | 4.635 | 2.536 | |||
| 东北地区 | 1.959 | 1.041 | -0.861 | 3.010 | 1.817 | -1.167 | 2.784 | 1.476 | -1.293 | 3.215 | 1.828 | -1.654 | |||
| 辽宁 | 1.039 | 1.644 | 0.635 | 1.750 | 2.906 | 1.224 | 1.915 | 1.844 | -0.063 | 2.255 | 2.148 | -0.172 | |||
| 吉林 | 2.069 | 0.827 | -1.208 | 3.394 | 1.343 | -2.047 | 3.096 | 1.182 | -1.893 | 3.161 | 2.124 | -1.390 | |||
| 黑龙江 | 2.938 | 0.527 | -2.298 | 4.133 | 0.912 | -3.229 | 3.554 | 1.269 | -2.270 | 4.347 | 1.182 | -3.664 | |||
注:IMR、OMR、NMR分别指代各区域人口迁入率、人口迁出率及人口净迁移率。
3.3 人口跨省迁移的不平衡程度减弱,呈现分散迁移趋势
由表2可知,2000—2020年基尼系数和变异系数的数值持续下降,这说明跨省人口迁移的不平衡程度逐步减弱,而分散迁移逐步加强[1]。这一时期,东部地区跨省人口迁入率先升后降,而跨省人口迁出率则持续增加,导致其跨省人口净迁移率在2010年以来持续降低(表3)。2015—2020年北京、天津两市的人口净迁移率出现大幅度下降,而上海、江苏、福建、广东等地的人口净迁移率也呈现下降趋势。尽管迁出格局没有得到根本性改变,但中部及西部地区在2000—2020年间净迁移率呈现先升后降的趋势,尤其在2010年以后,大部分中西部省份迁入率上升、迁出率下降,净迁移率也呈现回升趋势。在2015—2020年湖北和重庆两地的净迁移率从负值提升为接近0。
3.4 省际人口迁移和人口分布南北分异显现,东北地区人口流失问题日益严峻
表4中对比了2000—2020年4个时段中国南、北方地区人口迁移和人口分布特征。结果显示,中国人口迁移格局的南北分异越发明显,南方地区具有较高的人口迁入率、较低的人口迁出率,是人口净迁入区域;而北方地区则具有较低的人口迁入率、较高的人口迁出率,是人口净迁出区域。正是由于人口迁移长期存在南北分异,从而导致南方和北方人口份额差异逐步加大。其中,2000—2015年南方和北方人口份额基本维持稳定(53∶47),但至2020年末,南方和北方人口份额(55∶45)逐步拉开。
表4 2000—2020年中国南、北方地区人口迁移格局和空间分布
Tab. 4
| 年份 | 2000—2005年 | 2005—2010年 | 2010—2015年 | 2015—2020年 | |||||||
|---|---|---|---|---|---|---|---|---|---|---|---|
| 区域 | 北方地区 | 南方地区 | 北方地区 | 南方地区 | 北方地区 | 南方地区 | 北方地区 | 南方地区 | |||
| OMR(%) | 2.586 | 3.818 | 4.182 | 5.139 | 3.969 | 4.471 | 3.707 | 4.240 | |||
| IMR(%) | 1.462 | 4.549 | 2.546 | 6.351 | 2.753 | 5.303 | 2.497 | 5.012 | |||
| NMR(%) | -1.026 | 0.906 | -1.582 | 1.390 | -1.115 | 0.973 | -1.233 | 1.041 | |||
| 人口占比(%) | 46.963 | 53.037 | 46.580 | 53.410 | 46.612 | 53.388 | 44.985 | 55.015 | |||
注:南方地区与北方地区划分标准为秦岭—淮河线与青藏高原边缘线(南方地区包括:江苏、浙江、上海、湖北、湖南、四川、重庆、云南、贵州、广西、江西、福建、广东、海南、西藏;北方地区包括:北京、天津、内蒙古、新疆、河北、甘肃、宁夏、山西、陕西、青海、山东、河南、安徽、辽宁、吉林、黑龙江);IMR、OMR、NMR分别指代各区域人口迁入率、人口迁出率、人口净迁移率;人口比重以期末5岁及以上人口占全国5岁及以上人口比重计算而得。
东北地区人口净迁移率持续下降,2000—2020年间人口净迁移率已经从-0.861下降至-1.654,2015—2020年间东北地区的人口净迁移率已低于西部地区。近年来,为了推动东北振兴,国家实施了一系列刺激东北经济复苏的人口政策,但从结果上看,并未扭转东北地区人口流失的局面。东北地区人口流失问题已成为推动东北振兴所必须面对的重大难题。
4 2000—2020年中国省际人口迁移驱动因素
4.1 计量模型回归策略
纳入19个代表性滤波算子后,模型残差中的莫兰指数、AIC和BIC呈现下降趋势,而伪R2呈现大幅度提升,说明模型的解释力与数据拟合能力得到增强。ESF PPML引力模型(模型1)能够解释2000—2020年间大约90.8%的真实省际人口迁移变化,具有较强的代表性。本文采取以下计量模型回归策略(表5):① 构建1个ESF PPML面板引力回归模型,纳入对模型中网络自相关的考量,计量2000—2020年省际人口迁移影响机制;② 分别以2000—2005年、2005—2010年、2010—2015年、2015—2020年为子样本构建4个ESF PPML面板引力回归模型,分析不同时期省际人口迁移的影响机制差异(模型2~5)。
表5 中国省际人口迁移ESF PPML分时段回归结果
Tab. 5
| 变量 | 模型1(2000—2020年) | 模型2(2000—2005年) | 模型3(2005—2010年) | 模型4(2010—2015年) | 模型5(2015—2020年) |
|---|---|---|---|---|---|
| Mij | Mij | Mij | Mij | Mij | |
| POPi | 0.866*** (0.057) | 0.906*** (0.064) | 0.981*** (0.065) | 0.873*** (0.083) | 1.199*** (0.073) |
| POPj | 0.438*** (0.054) | 0.299*** (0.077) | 0.513*** (0.076) | 0.353*** (0.083) | 0.475*** (0.063) |
| DISTij | -0.027*** (0.003) | -0.025*** (0.003) | -0.028*** (0.005) | -0.032*** (0.004) | -0.046*** (0.006) |
| WAGEi | -0.832*** (0.174) | -0.914*** (0.209) | -0.179 (0.292) | -0.977*** (0.252) | -0.021 (0.227) |
| WAGEj | 1.822*** (0.148) | 1.645*** (0.266) | 2.177*** (0.233) | 1.670*** (0.304) | 1.749*** (0.206) |
| GDPGi | -0.014* (0.008) | -0.004 (0.026) | -0.074** (0.031) | -0.034* (0.017) | 0.043*** (0.012) |
| GDPGj | 0.007 (0.006) | -0.018 (0.034) | 0.023 (0.019) | 0.008 (0.016) | -0.021 (0.013) |
| HTECi | -0.033*** (0.011) | -0.088*** (0.019) | 0.014 (0.018) | -0.039*** (0.015) | -0.051*** (0.015) |
| HTECj | 0.058** (0.012) | 0.078*** (0.023) | 0.079*** (0.015) | 0.108*** (0.016) | 0.044*** (0.013) |
| DOCi | -0.118 (0.089) | 0.078 (0.163) | -0.655*** (0.200) | -0.352** (0.145) | -0.332*** (0.105) |
| DOCj | 0.374*** (0.103) | 0.650** (0.291) | 0.334* (0.182) | 0.416*** (0.156) | 0.435*** (0.098) |
| MSTOCKij | 0.054*** (0.003) | 0.047*** (0.003) | 0.038*** (0.003) | 0.049*** (0.003) | 0.058*** (0.003) |
| AIRi | 0.397*** (0.075) | 0.570*** (0.078) | 0.345*** (0.121) | 0.373*** (0.086) | -0.303*** (0.096) |
| AIRj | -0.222*** (0.066) | -0.296** (0.126) | -0.472*** (0.105) | -0.225** (0.102) | -0.363*** (0.105) |
| TEMPi | -0.003 (0.005) | -0.015** (0.007) | 0.000 (0.006) | -0.010** (0.005) | 0.034*** (0.005) |
| TEMPj | 0.001 (0.005) | -0.018*** (0.006) | -0.006 (0.006) | -0.009 (0.006) | -0.003 (0.007) |
| HPi | 0.014*** (0.004) | -0.002 (0.008) | -0.022** (0.011) | 0.023*** (0.006) | 0.056*** (0.007) |
| HPj | -0.011*** (0.003) | 0.005 (0.007) | 0.027** (0.012) | -0.015*** (0.005) | -0.013* (0.007) |
| Constant | -12.533*** (2.264) | -9.699*** (3.156) | -19.896*** (3.410) | -7.927** (3.953) | -22.302*** (3.048) |
| 观测量 | 3480 | 870 | 870 | 870 | 870 |
| 时间固定效应 | Yes | Yes | Yes | Yes | Yes |
| 滤波算子数量 | 19 | 16 | 10 | 10 | 15 |
| 残差莫兰指数 | 0.063*** | -0.005 | 0.051*** | 0.096*** | 0.054*** |
| Pseudo R2 | 0.908 | 0.927 | 0.909 | 0.908 | 0.904 |
| AIC | 47909617.91 | 9383046 | 15326732.10 | 11026554.64 | 9888289 |
| BIC | 47909851.79 | 9383213 | 15326870.39 | 11026692.93 | 9888451 |
注:***p < 0.01,**p < 0.05,*p < 0.1;括号中为聚类到地区对的稳健标准误。
4.2 总体回归结果
4.2.1 传统引力模型因素对省际人口迁移产生预期影响
地区人口规模增加会导致迁出和迁入的人口规模产生正向变化,而地理距离的增加则会导致区域人口迁移产生负向变化。模型1显示,地区常住人口规模每提升1%会导致迁出人口和迁入人口分别提升0.866%和0.438%,而区域间最短铁路旅行时间每增加1小时,则会导致区域迁移规模减少0.027%。该结果一方面论证了由人口规模代表的地区社会经济体量和发展水平及对人口迁移的较强解释力,另一方面也说明了即使随着铁路不断提速,时空压缩效应显现,但人口区域迁移仍然呈现十分显著的距离衰减效应。
4.2.2 地区社会经济发展是引起省际人口迁移的主要动因
地区在岗职工年平均工资对迁入人口持续产生显著影响。模型1显示,① 在岗职工年平均工资每增加1%,将会导致迁入人口规模增加1.822%,而迁出人口规模减少0.832%。② 地区经济发展速度对人口迁移也产生一定影响。在纳入滤波算子后,地区GDP对人口迁入的影响不显著,但对人口迁出产生显著的负向影响(-0.014)。③ 地区科技及教育投入占比对人口迁移产生显著影响。更高的科学技术投入份额代表更高的创新实力、更稳定的劳动力市场及更多样化的就业机会,而财政支出中教育投入份额增加往往体现更具优势的基础教育公共服务供给,对于迁移人口的子女教育尤为重要。地区科技及教育投入份额每增加1%,会导致迁入人口规模增加0.058%,而迁出人口规模减少0.033%。④ 地区医疗服务供给对迁入人口产生影响,地区每个医院拥有的执业医师数量每增加1%,会导致迁入人口规模增加0.374%。
4.2.3 社会网络联系持续影响省际人口迁移格局
社会网络联系仍然是中国人口迁移的重要影响因素[3]。在迁入地,以亲缘及同乡为核心的社会网络联系能有效降低迁入人口的社会融入和就业成本,为其安居乐业提供精神和物质保障。模型1显示,省际人口迁移规模在迁出地的构成比每增加1%,将会导致省际人口迁移规模增加0.054%。
4.2.4 以空气质量为核心的环境因素成为影响省际人口迁移的重要因素
以空气质量为核心的环境因素对中国省际人口迁移产生重要影响。具体来说,地区人口加权PM2.5浓度每提升1%,会导致迁入人口规模下降0.221%,而使得迁出人口规模上升0.397%。近年来雾霾等恶劣天气正成为引起居民舒适度下降的重要因素,提升空气质量有利于提高迁入人口的生活质量,增加迁入人口的健康福祉。与既有研究结果不同,以1月及7月平均温差为代表的温度舒适度对人口迁移作用不明显。
4.2.5 以住宅价格为代表的生活成本是影响省际人口迁移不可忽视的因素
有房可居对省际迁移人口具有重要意义。其不仅表现出物质居所的意义,还是迁入人口在迁入地的精神归宿和社会符号[46]。模型1显示,住宅平均销售单价占当地居民可支配收入比重每增加1%,会导致迁入人口规模减少0.011%,迁出人口规模下降0.014%。随着近年来各大城市(如深圳)住宅价格飞涨,传统以追逐更高的收入水平、更多的发展机会和更优的公共服务质量为目标的迁移行为已经受到理性批判,在迁入地收入相同的条件下,对迁入地房屋在当下或未来预期的可购买力越来越受到重视。高昂的房屋价格正驱赶劳动力迁出,已经成为阻碍地区发展和推动高质量城镇化的桎梏。
4.3 分时段回归结果
4.3.1 地区经济差异对省际人口迁移的影响呈现弱化趋势
对比模型2~5可知,以地区平均工资和经济发展增速为代表的地区经济差异对省际人口迁移的影响持续弱化。2000—2005年,地区在岗职工平均工资对迁入和迁出人口产生显著的正向和负向作用;2015—2020年,工资水平仅对迁入人口产生影响,对迁出人口不产生影响。GDP增速在2005—2015年间对迁出人口产生负向影响,而在2015—2020年间对迁出人口产生不符合预期的正向作用。造成上述现象的原因与部分GDP增速较高的地区经济基础相对薄弱有关;另外,新时期中国面临经济增速放缓、社会转型、产业结构调整、新冠肺炎疫情等公共危机的综合挑战,单纯追求经济机会的人口迁移行为面临更高风险。
4.3.2 跨省迁移动机趋于多样化
跨省人口迁移动机已逐步由以单纯追求工资的地区经济差异,逐步转变为兼顾追求高质量公共服务和环境舒适度的多样化需求决策。科技及教育投入对人口迁移产生持续显著影响。医疗公共服务在2000—2005年仅对迁入人口规模产生正向影响。自2005年起,医疗公共服务对迁入及迁出人口均产生显著影响。模型显示,以医疗和教育为核心的地区公共服务供给逐渐成为人口迁移的重要诱因。环境舒适度变量也是影响省际人口迁移的重要因素,在2015—2020年地区空气质量及气温均对人口迁出产生重要影响。
4.3.3 住宅价格因素在2010年后扮演愈发重要的角色
2000—2005年以住宅价格占居民可支配收入比重为表征的生活成本对省际人口迁移的作用不显著。而2005—2010年生活成本对人口迁入产生显著正向影响,而对人口迁出产生显著负向影响。该阶段,以城市建设和土地财政为核心纽带的经济高增速,使得快速上涨的房屋价格成为城市经济发展的指示器,驱动区域人口集聚。然而,2010年后,快速增长的住房价格开始逐渐成为排斥人口迁入和驱赶人口迁出的重要力量。2010—2015年和2015—2020年住宅价格占居民可支配收入比重对人口迁入的影响系数为-0.015和-0.013,对人口迁出的影响系数为0.023和0.056。
4.3.4 地理距离摩擦、社会网络等效应仍然显著
分时段回归模型结果显示地理距离、社会网络等因素在2000—2020年扮演相对稳健的角色。尽管在此期间经历了第五次、第六次铁路大提速和以高速铁路为重要内容的“新基建”阶段,地区间人口迁移的时间成本已经大幅度下降,然而距离摩擦会产生社会融入、文化适应等系列成本,仍然是阻碍人口迁移的重要因素,其影响系数甚至从2000—2005年的-0.025变化至2015—2020年的 -0.046。社会网络因素在过去20年间同样产生十分稳健的影响,其影响系数介于0.038至0.058之间。
4.4 2000—2020年中国省际人口迁移的时空演化机制
如图1所示,总结21世纪前20年中国人口迁移演化机制,必须充分考虑特定历史时期的社会经济发展的宏观背景。中国人口迁移驱动机制及地理格局演化与经济及社会转型、新型城镇化及户籍制度改革、相关区域协调发展政策实施具有紧密联系。影响中国人口迁移的主要宏观驱动效应包括:区域人口规模及区域间距离衰减效应、地区社会经济发展效应、社会网络效应、环境舒适度效应以及生活成本效应。
图1
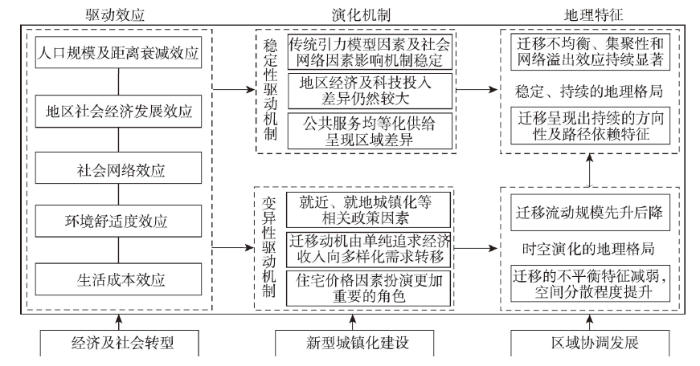
图1
2000—2020年中国省际人口迁移时空演化机制
Fig. 1
Spatiotemporal evolution mechanisms of interprovincial migration of China during 2000-2020
在上述宏观驱动效应综合影响下,中国省际人口迁移驱动机制呈现出稳中有变的演化机制,中国人口迁移格局也呈现出稳定与变化共存的地理特征。稳定性驱动机制体现在:人口规模、距离衰减及社会网络因素的影响持续显著;省际经济发展水平差异显著,导致经济和科技投入及医疗、教育等公共服务供给差异明显[8]。在稳定性驱动机制作用下,中国人口迁移呈现持续的不均衡、集聚的地理格局,中部、西部及东北部欠发达地区的人口源源不断迁移至东部沿海发达地区。变异性驱动机制体现在:在新型城镇化过程中,就近、就地城镇化以及相关区域均衡发展政策导致跨省人口迁移规模呈现先升后降的特征[38]。2000—2020年间跨省人口迁移动机已经由单纯追求经济收入最大化,逐步转为兼顾地方品质、自然环境舒适度、生活成本等多样化考虑。2010年以来,随着住宅价格持续上涨,人口迁移的不平衡特征持续减弱,中西部等欠发达地区开始吸引外来人口就业,部分东部地区的人口迁入势头开始减缓[1⇓-3]。
5 结论与讨论
5.1 结论
基于第七次全国人口普查数据,结合过往相关全国人口普查及1%人口抽样调查数据,构建2000—2020年中国省际人口迁移数据库,运用一系列人口地理空间分析方法和ESF PPML引力模型,探讨中国省际人口迁移的时空演化格局及驱动因素,主要结论为:
(1)2000—2020年间中国省际人口迁移格局呈现稳中有变的总体特征。人口迁移体现出较强的不平衡性和网络溢出效应,东部沿海地区一直是人口迁移的主要目的地,而中部、西部和东北地区则一直是主要迁出地。人口迁移的不平衡程度和空间集聚程度减弱,最近5年显现出空间分散特征。人口迁移和空间分布的南北分异越发明显,东北三省人口迁出的态势尚未减缓。
(2)迁入地和迁出地人口规模对省际人口迁移产生正向影响,而以最短铁路旅行时间为代表的地理距离因素产生负向影响;地区社会经济发展仍是引起人口迁移的主要动因,地区在岗职工年平均工资、科技教育投入占财政支出比重以及医院拥有执业医师数量的提升对人口迁入产生正向影响,而对人口迁出产生负向影响;迁出及迁入省份间的社会网络关联、以PM2.5浓度为代表的地区环境舒适度以及以住宅价格占居民可支配收入为代表的生活成本因素同样是引起人口迁移的重要因素。
(3)随着时间推进,以工资收入和GDP增速为代表的地区经济差异对省际人口迁移的影响呈现弱化趋势,人口迁移动机由单纯追求更高经济收益,逐渐转变为对工资收入、高质量公共服务、环境舒适度、生活成本等因素的多样化考虑。2010年以来,住宅价格导致的生活成本上涨,成为显著抑制人口迁入的重要因素。地理距离摩擦和社会网络效应在20年间保持对人口迁移的显著影响。
5.2 讨论
本文首次揭示出2015—2020年间人口迁移格局的新特征:首先,地区经济收入差异对人口迁移的影响正呈现逐步弱化的趋势,地区的公共服务品质、环境舒适度等有望扮演更加重要的角色;其次,住宅价格逐步成为人口迁移的重要考虑因素,部分东部发达地区持续增长的住宅价格将对未来以人力资本集聚为导向的经济增长和创新能力提升产生一定的抑制作用;此外,中国人口迁移和人口空间分布的南北差异持续加大,南北地区人口分布平衡开始打破;另一方面,虽然中部地区和西部地区在近年来的净迁移率有了较大幅度提升,但东北地区经历连续的净迁移率下降,东北地区人力资本外流问题需要得到更多的关注。尽管如此,地区的科技教育投入对人口集聚的作用在本文中再次被强调,而距离摩擦、社会网络等因素对人口迁移产生持续影响。最后,迁移格局中存在显著网络自相关性,一方面揭示出由于相邻地区的密切经济往来、社会网络联系、政策响应等机制对人口迁移的影响,从而为未来流动人口治理提供参考,另一方面说明基于空间相互作用视角的引力模型建模时需充分考虑网络自相关的影响,减少模型估计偏误[1,6 -7]。
研究显示新型城镇化建设、户籍制度改革和近年来实施的一系列地区均衡发展战略取得了阶段性的成果。在人口城镇化率保持高增长的背景下,中小城市就业机会的增加、户籍的进一步松绑以及公共服务均等化程度的提升导致中国东部地区对人口迁入的垄断性态势开始打破,多地人口净迁移率开始下降。人口跨省迁移规模在2010—2020年开始持续下降,人口城镇化模式已经由传统的跨省迁移模式逐步转为就近、就地迁移模式,也预示着中国新型城镇化建设和经济发展面临的新一轮挑战。随着中国经济增速放缓,产业结构及劳动力市场转型,东部沿海地区经济发展动能开始调整,部分发达地区虽仍然集聚着大量的就业岗位,发挥集聚经济优势,但过快增长的住宅价格等生活成本因素已经成为人口迁入乃至地区经济进一步发展的关键阻碍。如何平衡好地区人口迁入、经济增长和地区生活成本之间的关系,将成为新时期实现地区均衡发展及推动新型城镇化建设的新难题。
本文尚存在以下待改进之处:首先,仅关注省际人口迁移地理格局及演化机制分析,缺乏对地(市)际迁移格局的系统研究。其次,囿于数据,在计量模型构建变量选取方面存在不足。例如,主要使用住宅销售价格代表住房成本,忽视了对租房价格的讨论。在未来,可在精度更高的多源人口迁移数据支持下,构建更为全面的解释性框架和计量模型,对多尺度下人口迁移地理格局及驱动因素展开体系化研究。
参考文献
Understanding the migration of highly and less-educated labourers in post-reform China
Changing spatial patterns of internal migration to five major urban agglomerations in China
DOI:10.11821/dlxb202106002
[本文引用: 2]

Internal migration in China has presented a series of new characteristics recently. The secondary migration and spatial redistribution of existing migrants become increasingly important in determining the future patterns of urbanization. Urban agglomerations (UAs) have long been the major destination of China's internal migration. They are also appointed as the main form of future urbanization in the recently released national planning of new-type urbanization. Five major UAs were selected as a case study, including three coastal ones, namely the Yangtze River Delta (YRD), the Pearl River Delta (PRD), and the Beijing-Tianjin-Hebei region (BTH), and two inland ones, namely the Middle Yangtze River (MYR) and the Chengdu-Chongqing (CC) region. Based on data of the latest population census and the dynamic monitoring survey of floating population in the five major UAs, this paper first examined the spatial patterns of in-migrants from multiple dimensions of destination, origin, and distance of migration. The trends and urbanization effects of migration on the destination and origin were then assessed by comparing the settlement and hukou transfer intentions of migrants with different origins and destinations. The results showed the coexistence of common and distinct features in these mega regions. Although the continuous attractiveness of central cities for migrants was observed in all regions, peripheral cities in the YRD and PRD have become increasingly attractive as well, leading to a moderately dispersing trend in these two pioneering coastal UAs. Moreover, the concentration level and spatial distribution of migrants among cities were generally stable in the YRD and PRD but continuously adjusting in the BTH and two inland UAs. The fastest growth was found in inter-county migration within province and the slowest in intra-county migration. The coastal UAs were strongly preferred by inter-provincial migrants, while the inland ones could only attract migrants from the same or surrounding provinces. Despite this, significant distance attenuation was found in all of them. In terms of the origins of migrants, those from central provinces had flowed mainly to the YRD and PRD, whereas those from the northeast showed a high preference for the BTH region. We can anticipate the future patterns of migration and urbanization from the settlement intentions of migrants from and to different cities. From the destination view, the advantage in public services made central cities considerably more attractive than other cities. Hence, they are expected to be continuously faced with severe contradiction between supply and demand of public services. In the inland UAs, however, central cities and ordinary ones are able to share the pressure of public service provision. From the original view, the high-quality and equally accessible public services are important for inland regions to attract return migrants, and providing high possibility for the return-migration-induced urbanization. However, the population loss in the northeast may become a long-term trend that can hardly be reversed in the visible future.
中国五大城市群人口流入的空间模式及变动趋势
DOI:10.11821/dlxb202106002
[本文引用: 2]
城市群在中国城镇化格局中占有重要地位,也是快速城市化时期的主要人口流入地。本文关注京津冀、长三角、珠三角、长江中游和成渝五大城市群,利用人口普查和流动人口动态监测调查数据,从流入人口分布格局、流动范围和来源地等多维度剖析城市群人口流入的空间模式,并从居留和落户意愿空间差异的视角探讨空间模式的发展趋势及其对流入地和流出地的影响。研究发现,各城市群流入人口向中心城市持续集中,等级和空间分布格局总体稳定;流动范围有所扩大,省内流动增速普遍高于省际;沿海城市群人口吸引范围大但仍服从距离衰减律,不同来源地流入人口的城市群偏好存在差异。在流入地,沿海城市群中心城市面临流动人口管理服务的持续挑战,内陆城市群中心城市和一般城市吸引力并存;在流出地,平等开放的高质量公共服务供给是吸引人口回流的重要途径,少数地区的人口流失可能成为较长期的现象。
Driving mechanism of interprovincial population migration flows in China based on spatial filtering
DOI:10.11821/dlxb201902002
[本文引用: 9]
According to previous studies, not only does the conditional gravity model based on ordinary least squares often bring about poor fitting of migration flows in reality, but also there exists overdispersion in the extended Poisson gravity model. Simultaneously, network autocorrelation usually exists in population migration data (e.g., the spatial interaction among migration flows). The problems mentioned above result in biased estimation. In order to capture network autocorrelation and deal with the issue of overdispersion, we build an eigenvector spatial filtering negative binomial gravity model (ESF NBGM) based on the data of 1% national population sample survey in 2015, to analyze the driving mechanism of interprovincial population migration flows in China. The results are as follows: (1) Positive spatial spillover effect exists in interprovincial population migration flows, and ESF can capture network autocorrelation in data, so as to reduce the estimated deviation of the model. Furthermore, eigenvectors ranking top 1.4% can properly interpret the spatial pattern of high network autocorrelation in data. (2) There exists overdispersion in China's interprovincial migration flows. Considering this problem, a negative binomial regression model is more suitable for the estimation of driving mechanism for population migration, together with statistical enhancement. (3) Network autocorrelation leads to overestimation of distance variables and underestimation of non-distance variables. The results of the improved model reveal that: chief factors the affect driving mechanism are regional population characters, social network, economic development and education level. Meanwhile, living environment and road network gradually become one of the most crucial pulling factors that influence migration flows. (4) Compared to previous studies, social network (i.e. migration stock) plays a more significant role in population migration flows, while the impact of spatial distance keeps weakening.
基于空间滤波方法的中国省际人口迁移驱动因素
DOI:10.11821/dlxb201902002
[本文引用: 9]
人口迁移数据中往往存在较强的网络自相关性,以往基于最小二乘估计的重力模型与迁移数据的拟合度较低,而改进后的泊松重力模型仍存在过度离散的缺陷,以上问题均导致既有人口迁移模型中的估计偏差。本文构建了特征向量空间滤波(ESF)负二项重力模型,基于2015年全国1%人口抽样调查数据,研究2010-2015年中国省际人口迁移的驱动因素。结果表明:① 省际人口迁移流间存在显著的空间溢出效应,ESF能有效地提取数据中的网络自相关性以降低模型的估计偏差,排序在前1.4%的特征向量即可提取较强的网络自相关信息。② 省际人口迁移流之间存在明显的过度离散现象,考虑到数据离散的负二项重力模型更适用于人口迁移驱动因素的估计。③ 网络自相关性会导致模型对距离相关变量估计的上偏与大部分非距离变量估计的下偏,修正后的模型揭示出以下驱动因素:区域人口特征、社会网络、经济发展、教育水平等因素是引发省际人口迁移的重要原因,而居住环境与公路网络等因素也逐渐成为影响人口迁移重要的“拉力”因素。④ 与既有研究相比,社会网络因素(迁移存量、流动链指数)对人口迁移的影响日益增强,而空间距离对人口迁移的影响进一步呈现弱化趋势。
Changing patterns and determinants of interprovincial migration in China 1985-2000
DOI:10.1002/psp.668 URL [本文引用: 5]
Explaining interregional migration changes in China, 1985-2000, using a decomposition approach
DOI:10.1080/00343404.2013.812783 URL [本文引用: 3]
Modelling interprovincial migration in China from 1995 to 2015 based on an eigenvector spatial filtering negative binomial model
Multilateral mechanism analysis of interprovincial migration flows in China
DOI:10.11821/dlxb201602003
[本文引用: 5]
Population migration flows between different regions are related to not only the origin- and destination-specific characteristics, but also to the migration flows to and from neighborhoods. Intuitively, changes in the characteristics of a single region will impact both inflows and outflows to and from other regions. In order to explore the spatial interaction mechanism driving the increasing population migration in China, this paper builds the spatial OD model of interprovincial migration flows based on the sixth national population census data and related social-economic data. The findings are as follows: (1) Migration flows show significant autocorrelation effects among origin and destination regions, which means that the migration behavior of migrants in some region is influenced by that of migrants in other places. The positive effects indicate the outflows from an origin or the inflows to a destination tend to cluster in a similar way. Simultaneously, the negative effects suggest the flows from the neighborhood of an origin to the neighborhood of a destination tend to disperse in a dissimilar way. (2) Multilateral effects of the regional economic and social factors through the spatial network system lead to the clustering migration flows across interrelated regions. Distance decay effect plays the most influential force in shaping the patterns of migration flows among all the factors and the negative spillover effect further aggravates the friction of distance. As for destinations, the influence of wage level and migration stocks is beyond that of GDP and the positive spillover effects of these factors enhance the attraction of neighborhood regions. The spillover effects of unemployment rate and college enrollment of higher education are significantly negative while the effect of population in a destination is not significant. As for origins, population and migration stocks lead to positive spillover effects on the neighborhoods while the effects of other factors are negative. (3) Changes in the regional characteristics will potentially lead to a series of events to the whole migration system, and the flows to and from the center of oscillation and its neighborhoods vibrate greatly compared with other regions. The simulation results of 5% GDP increase in Jiangsu province indicate that the outflows to other regions decrease while the inflows from all others increase to some different extent. Comparatively, the influence on the flows to and from the regions neighboring Jiangsu is significant while that of remote regions is much less, which cannot be explained by the traditional gravity model.
中国省际人口迁移的多边效应机制分析
DOI:10.11821/dlxb201602003
[本文引用: 5]
区际人口迁移不仅与迁出地和目的地的要素特征以及距离有关,而且还受到周边迁移流的影响.基于网络自相关理论,利用"六普"省际人口迁移数据和相关统计资料,在重力模型的基础上考虑迁移流之间可能存在的几种空间依赖形式,构建中国省际迁移流的空间OD模型,初步揭示区域经济社会等因素及其空间溢出效应对省际人口迁移的影响,并就区域要素变化对整个省际人口迁移系统产生的"连锁反应"进行了模拟.结果表明:① 中国省际迁移流之间存在显著的网络自相关效应.目的地和迁出地的自相关效应皆为正,导致迁入和迁出流的空间效仿行为;迁出地和目的地周边则出现负的自相关效应,导致迁移流的空间竞争行为;② 区域经济社会等因素通过网络空间关系对周边地区产生的多边溢出效应导致迁移流在空间上集聚.其中,距离衰减效应位居各要素之首,其溢出效应进一步加剧距离的摩擦作用;对目的地而言,区域工资水平和迁移存量超过GDP的影响并产生正的溢出效应,促进周边地区吸引更多的外来人口;对迁出地而言,人口规模和迁移存量产生正的溢出效应,推动周边地区人口外迁;③ 区域要素变化潜在地对整个省际人口迁移系统产生一系列"连锁反应",震荡中心及其周边区域的迁移流波动较大.江苏省GDP增长5%的模拟结果表明,江苏迁往全国其他省份的人口数量都有不同程度地减少,而其他省份入迁人口均有所增加.相对而言,江苏周边省份的迁入或迁出流受到的波动较大,偏远省份波及较小,这是传统的重力模型所无法解释的.
Demographic transition, demographic dividend, and Lewis turning point in China
DOI:10.1080/17538963.2010.511899 URL [本文引用: 3]
A model of labor migration and urban unemployment in less developed countries
The costs and returns of human migration
DOI:10.1086/258726 URL [本文引用: 1]
The new economics of labor migration
Increasing returns and economic geography
DOI:10.1086/261763 URL [本文引用: 1]
A reexamination of migration, economic opportunity, and the quality of life
DOI:10.1111/j.1467-9787.1976.tb00954.x URL [本文引用: 1]
Consumer city
DOI:10.1093/jeg/1.1.27 URL [本文引用: 1]
Amenities drive urban growth
DOI:10.1111/1467-9906.00134 URL [本文引用: 1]
The P 1 P 2/D hypothesis: On the intercity movement of persons
DOI:10.2307/2087063 URL [本文引用: 1]
Describing migration spatial structure
Modelling skilled and less-skilled internal migrations in China, 2010-2015: Application of an eigenvector spatial filtering hurdle gravity approach
On the specification of the gravity model of trade: Zeros, excess zeros and zero-inflated estimation
DOI:10.1080/17421770902834327 URL [本文引用: 1]
A method of fitting the gravity model based on the Poisson distribution
"In this paper, [the authors] suggest an alternative method for fitting the gravity model. In this method, the interaction variable is treated as the outcome of a discrete probability process, whose mean is a function of the size and distance variables. This treatment seems appropriate when the dependent variable represents a count of the number of items (people, vehicles, shipments) moving from one place to another. It would seem to have special advantages where there are some pairs of places between which few items move. The argument will be illustrated with reference to data on the numbers of migrants moving in 1970-1971 between pairs of the 126 labor market areas defined for Great Britain...."excerpt
The log of gravity
Spatial econometric models
//Fischer M M, Getis A.
Spatial Autocorrelation and Spatial Filtering:Gaining Understanding Through Theory and Scientific Visualization
Geography of talent in China during 2000-2015: An eigenvector spatial filtering negative binomial approach
DOI:10.1007/s11769-021-1191-y URL [本文引用: 1]
Error analysis of regional migration modeling
DOI:10.1080/24694452.2016.1197767 URL [本文引用: 3]
Evolution of spatial pattern of inter-provincial migration and its impacts on urbanization in China
DOI:10.11821/dlyj201508008
[本文引用: 2]
Since China's reform and opening up in 1978, the scale of inter-provincial migration increased sharply, especially from 2000 to 2010. The redistribution of inter-provincial migration has had significant influences on China's urbanization and socio-economic development. Using data from China's 2000 and 2010 censuses, this paper investigates inter-provincial migration by describing its spatial patterns and estimating its impacts on urbanization development with various indictors, such as geographic concentration index, gravity center of migration, composite index of migration, network analysis, and coefficient of variation. The results are as follows: 1) There have been escalating dispersion trends for the distribution of in- and out-migration, especially the out-migration. At the same time, the gravity center of in- and out-migration both move towards north and east. Besides, the destinations of migration has shifted from one single polar (Guangdong) in 2000 to multi-polar (Guangdong, Zhejiang, Shanghai, Jiangsu, Beijing, Fujian) in 2010; while Anhui, Sichuan, Henan and Hunan become the new top four sources of migration in 2010. 2) With the rapid growth of floating population, the network trend of inter-provincial migration is more prominent. Overall, the migration network of 2010 becomes more compacted, connective and balanced than that of 2000. At the regional scale, the migration of population is mainly from central and western to eastern China. The eastern region become the main destinations, while the central and western regions of China have become the main sources of inter-provincial migration, especially the "mid-belt subsiding" is more prominent. At the provincial scale, the increased migration flows mainly to Shanghai, Zhejiang, Jiangsu, Beijing, Tianjin, Fujian, etc. Besides, the migration flows formulate different models due to the effects of regional development disparities, migration distance and migration stocks. 3) The regional types of inter-provincial migration could be divided into four kinds: active regions have a larger floating population and their in-migration is much more than out-migration, which is mainly located in the eastern coastal provinces and Xinjiang; active regions have a larger floating population and their out-migration is much more than in-migration, which is mainly located in the central and western China; active regions have a larger floating population and their in-migration is nearly equal to out-migration; inactive regions have a smaller floating population, such as some provinces with a large ethnic minorities population. 4) Inter-provincial migration has a positive effect on the development of urbanization. It contributes to 18.13% of the increment of urbanization rate and it also narrows the disparities of urbanization rate among provinces, during 2000-2010. However, migrant workers account for most of the inter-provincial migration, and make great contributions to the development of urban socio-economy, but they cannot share the same identity with the citizens due to the household registration system. Therefore, it is necessary to accelerate the reform of household registration system and promote the citizenization of migrant workers.
中国省际人口迁移格局演变及其对城镇化发展的影响
DOI:10.11821/dlyj201508008
[本文引用: 2]
基于2000年和2010年人口普查数据,利用多种指标和方法研究了中国省际人口迁移的格局演变及其对城镇化的影响。研究发现:省际迁入和迁出人口在空间分布上均呈分散化态势,迁入迁出重心均向北向东偏移,迁入地由广东省“一枝独秀”向多极化演变,安徽、四川、河南、湖南成为新的四大迁出地。利用净迁移流构建的省际人口迁移网络,表现出紧凑化和均衡化趋势;迁移流仍然是从中西部地区指向东部地区,但新增加迁移流集中指向长三角、京津以及福建。综合考虑省际人口迁移强度和方向,可将全国31个地区划分为净流入型活跃区、平衡型活跃区、净流出型活跃区以及非活跃区四种类型。省际迁移改变了迁入地和迁出地的城乡人口结构,通过不同模式促进了城镇化率的提高和省际差异的缩小,对2000-2010年全国城镇化率增加的贡献占到了18.13%。
Spatial-temporal patterns of China's interprovincial migration during 1985-2010
DOI:10.11821/dlyj201506012
[本文引用: 4]
Migration plays an increasing role in economy since mobility rose and economic restructuring has proceeded during the last three decades in China. Given the background of most studies focusing on migration in a particular period, it is critical to analyze the spatial-temporal patterns of migration. Using bicomponent trend mapping technique and interprovincial migration data during the periods 1985-1990, 1990-1995, 1995-2000, 2000-2005, and 2005-2010, we analyze net-, in-, out-migration intensity, and their changes over time in this study. Strong spatial variations in migration intensity were found in China's interprovincial migration, and substantial increase in migration intensity was also detected in Eastern China during 1985-2010. Eight key destinations are mostly located within the three rapidly growing economic regions of Eastern China (Pearl River Delta, Yangtze River Delta and Jing-Jin-Ji Metropolitan Area), while most key origins are relatively undeveloped central and western provinces, which are exactly in accordance with economic development patterns in China. The results of bicomponent trend mapping show that most provinces with an increasing trend in in-migration are located in South China, and those with a decreasing trend are in North China. Therefore, in a sense, the migration in the south was more active than that in the north over the last three decades, which might largely be the results of cultural differences between the south and north. These results on spatial-temporal patterns reveal that migration has a strong relationship with regional development, and economic-cultural factors may be of increased relevance to interprovincial migration.
1985—2010年中国省际人口迁移时空格局特征
DOI:10.11821/dlyj201506012
[本文引用: 4]
改革开放以来,伴随着快速城镇化进程的推进以及20世纪80年代户籍制度出现松动,大规模跨区域的人口迁移流动已呈现不可阻挡之势,人口迁移时空格局亦发生着剧烈的变化。目前大多数相关研究只关注某一特定时期的人口迁移,故而人口迁移的时空格局分析显得尤其重要。使用双组分趋势制图法和1985-1990年、1990-1995年、1995-2000年、2000-2005年以及2005-2010年五个时期的人口迁移数据,分析人口迁入、迁出和净迁移的强度及其变化特征。在研究时期内,中国省际人口迁移表现出强烈的空间差异,迁移强度也有大幅的增加。八个主要人口迁入地全部位于东部三个经济快速增长的发展区域(珠江三角洲、长江三角洲和京津冀都市圈)内,而主要的人口来源地都是相对欠发达的中西部省份,这和全国经济发展空间格局完全吻合。双组分趋势地图结果显示南方省份的人口迁移强度及变化趋势都强于北方省份,因此从某种意义上说,在1985-2010年间,南方省份的人口迁移较北方省份更活跃,这可能主要受到南北方自然地理环境以及文化差异的影响。人口迁移时空格局分析结果表明,中国的人口迁移规律正在逐渐形成新特色,东部和西部地区之间的人口流动主要是受到经济因素和区域发展差异的影响,而南方和北方地区的人口迁移活跃程度则主要是由自然地理环境以及文化差异所致。
Characteristics and impact factors of migration in China: Characteristics China: Based on the analysis of the sixth census data
中国人口迁移特征及其影响因素: 基于第六次人口普查数据的分析
China's inter-provincial migration patterns and influential factors: Evidence from year 2000 and 2010 population census of China
中国省际人口迁移区域模式变化及其影响因素: 基于2000和2010年人口普查资料的分析
Analysis on the influencing factors of choosing the place of inter-provincial migration
省际人口迁移迁入地选择的影响因素分析
当一个人作出迁移的决定之后,还需要作出向何处迁移的决定。在以往的研究中,对于人口迁移的迁入地选择过程缺乏研究。本文利用 1990年人口普查资料,通过建立人口迁移分析矩阵,探讨了对人口迁移迁入地选择过程进行分析的实现方法
Modeling network autocorrelation in space-time migration flow data: An eigenvector spatial filtering approach
DOI:10.1080/00045608.2011.561070 URL [本文引用: 5]
Evolution patterns of China's interprovincial migration networks between 1995 and 2015: Based on labour heterogeneity
DOI:10.11821/dlyj020200507
[本文引用: 7]
With the loosing of the household registration (hukou) system, China has witnessed massive volumes of interregional migration. Among all kinds of migration, skilled migration and less-skilled migration present differential spatial patterns and network characteristics over time and may exert distinguished impacts on regional development and innovation. However, due to limited data availability, prior studies only adopted cross-sectional data analysis and examined the patterns of skilled and less-skilled migrations before 2005, whereas few have been done on related topics after 2005. Drawing on previous studies, the present paper uses micro-level datasets from population censuses and sample surveys to assess the spatial evolution patterns of China's skilled and less-skilled internal migrations between 1995 and 2015. Besides, several complex network analysis methods have been employed, together with the network visualization technique. The results of the paper are listed as follows. First, there were spatial clustering and uneven patterns in both skilled and less-skilled internal migrations over the 20 years of 1995-2015, where migration flows containing a large percentage of skilled and less-skilled migrants originated from inland western and central regions to the eastern coastal areas of China. However, the degree of spatial unevenness in the migration patterns has been slightly weakened. In addition, the average migration distance of skilled migration was farther than that of less-skilled migration in the same period. Second, both of the two migration networks have presented a “small-world” property over the 20 years. In comparison, the intensity and connection degree of less-skilled migration networks have prevailed over that of the skilled migration networks. Third, results from the community detection have revealed that both skilled and less-skilled migrations exhibited a network structure where Beijing, Shanghai, and Guangdong served as the core nodes. Skilled migration presented a more stable network structure during the 20 years, while less-skilled migrations showed a persistently changing pattern. Fourth, the paper suggested that regional economic disparity, path dependence effect, the heterogeneity of different labour forces in the job market, and the differences in labour market demand for different labour forces were underpinning factors shaping the spatial evolution pattern and network structure of the two types of migration from 1995 to 2015.
1995—2015年中国省际人口迁移网络的演化特征: 基于异质性劳动力视角
DOI:10.11821/dlyj020200507
[本文引用: 7]
自户籍制度放宽以来,中国经历了大规模的人口迁移。其中,异质性劳动力(高技能劳动力、普通劳动力)在迁移过程中表征出不同的空间格局和网络组织特征,对地区经济发展产生各异的影响。本研究基于人口普查和抽样调查微观抽样数据,使用复杂网络理论对1995—2015年中国异质性劳动力迁移的时空格局和网络演化展开分析,并分析了格局背后的可能成因。研究发现:① 省际高技能和普通劳动力迁移均呈现出持续高度不平衡的空间集聚特征,承载大量人口的迁移流主要由中国中西部地区指向东部沿海地区,但这种空间不平衡特征呈现出一定的减弱趋势。高技能劳动力的平均迁移距离比普通劳动力更长;② 两类劳动力迁移网络中均呈现明显的“小世界”特性,但普通劳动力迁移网络的迁移强度和关联程度均高于高技能劳动力迁移网络;③ 两类劳动力迁移网络均呈现出以北京、上海、广东为主要核心节点的网络结构。高技能劳动力网络结构呈现相对稳定的特征,而普通劳动力网络结构则呈现出变化的趋势;④ 地区经济差异、路径依赖效应、异质性劳动力在就业市场上的差异性以及劳动力市场对异质性劳动力需求的差异是导致两类劳动力迁移格局差异性的重要成因。
Flow field and its regional differentiation of inter - provincial migration in China
中国省际人口迁移流场及其空间差异
Trends in internal migration and mobility: International experiences and their implications for China
This article reviews international literature on the changing trends of population migration and mobility and their mechanisms from the following perspectives: the changing trends of different forms of population mobility,the international comparison of the overall intensity of China’s internal mi- gration,the micro life course of population migration and mobility,and the mechanism and recent evolution of circular migration.The authors derive the following views on the future trends of China’s population migration and mobility from the above review and its implications: First,the recent decreasing trends of regional and rural-urban migration in China indicate changes in the forms of China’s population mobility rather than a real decline of its overall volume and intensity,which will still be on the rise; Second,great attention still needs to be paid to the portable issues of various public services provided to the floating population; and third,the management of and services to the floating population need to be improved in accordance with the changes in the forms of population mobility,especially the rise of urban to urban and intra-urban migration and mobility.
国内人口迁移流动的演变趋势: 国际经验及其对中国的启示
文章从人口迁移流动的不同形式及其演变趋势、中国国内人口迁移整体强度的国际对比、人口迁移流动的微观生命过程、以及人口循环流动的发生发展机制和近期演变等4个方面回顾了国际上对人口迁移流动演变趋势及其机制的相关研究,并根据从中获得的借鉴和启示对中国人口迁移流动的未来走势做出判断,认为目前我国人口在区域和乡城间迁移流动的减缓更多预示的是人口迁移流动形式的改变,而不是其整体规模和强度的下降,后者还有着相当大的上升空间;今后仍不可忽视针对迁移流动人口的各种公共服务的转移、接续问题,并要根据人口迁移流动形式的变化,尤其是人口在城市间和城市内部迁移流动上升的新形势,与时俱进地改进流动人口的管理和服务工作。
Homeowner and renter payment for school quality in Beijing: Boundary fixed effect analysis with housing price-rent comparison
