

1 引言
理解“胡焕庸线”两侧的人口分布格局,对及时把握中国人地关系动态特征具有重要意义[1-2]。1978年改革开放以来,中国出现了大规模、高强度的流动人口,城镇化进入快速发展阶段,至2010年时,中国已有近半数的人口生活在城镇地区[3⇓-5]。按照一般的城镇化发展“S”型曲线规律,中国城镇化发展已进入中后期阶段,城镇化水平速度本当放缓[6-7]。然而,2010年以来,中国人口城镇化进一步提速,根据第七次人口普查公报(第八号),2010—2020年期间中国城镇人口比重提升了14.21个百分点,高于2000—2010年期间的13.46个百分点。2010—2020年期间,中国推进新型城镇化发展,旨在促进大中小城市协调发展,并提出“促进约1亿农业转移人口落户城镇”“引导约1亿人在中西部地区就近城镇化”等发展目标,深刻影响了中国人口空间再分布过程。正值第七次人口普查数据发布,本文旨在厘清“胡焕庸线”两侧人口集疏过程的新特征及其影响因素,并从新型城镇化视角,分析“胡焕庸线”高质量突破问题。
胡焕庸在1935年《中国人口之分布》一文中提到了“瑷珲—腾冲线”,但当时未在人口密度图上绘出这条线[8]。1989年胡焕庸和伍理利用第三次人口普查数据和1985年人口统计资料,绘制了《中华人民共和国人口分布、密度图》,第一次在图上表明了“黑河—腾冲线”[9]。嗣后,田心源将其命名为“胡焕庸线”。随着学术界的广泛引用和研究,“胡焕庸线”的学术意义逐渐从人口地理学延伸至其他相关学科[10]。应用历次人口普查数据(1953—2010年)、大数据等,“胡焕庸线”的稳定性得到反复确认[11⇓-13],“胡焕庸线”两侧人口占比大致稳定,但是稳中有微变,西北半壁得益于相对较高的自然增长率,人口份额持续提升。“胡焕庸线”两侧人口集疏模式呈现不同特征,东南半壁呈现剧烈的集疏模式,而西北半壁则呈现相对均势的集疏模式[14⇓-16]。部分人口地理学者应用“胡焕庸线”思想,先后提出了“准胡焕庸线”[17]、“胡焕庸亚线”[18]、青藏高原“祁连—吉隆线”等人口地理分界线[19],也有不少地理学者从资源环境和区域发展角度探讨了“胡焕庸线”的地理意义,包括主体功能区、“一带一路”倡议、信息化、碳排放等[20⇓⇓⇓⇓-25]。《国家人口发展规划(2016—2030年)》指出,中国目前处于人口发展的关键转折期,人口分布是人口均衡发展国家战略的重要内容之一。2010年以来,关于“胡焕庸线”的研究多基于抽样调查推算数据、户籍人口统计数据等展开[16,22,26],随着2020年第七次人口普查数据发布,有必要结合最新的人口普查数据,重新核算人口分布数据,系统观察近10年来“胡焕庸线”两侧的人口集疏变化特征。本文运用全国第七次人口普查数据,分析2010—2020年间“胡焕庸线”两侧人口集疏模式的新特征,揭示了中国人口分布及人口集疏过程的新态势,为支撑中国人口发展的关键转折期的发展提供了新的科学依据。
2 研究数据与研究方法
2.1 2010—2020年人口空间数据库
尽管各省、自治区和直辖市第七次全国人口普查主要数据公报包含了2010年和2020年标准普查时点的地级常住人口规模和比重,但部分公报数据并未考虑行政区划调整的影响,常住人口比重变化很多是“名义”上的统计变动。为准确核算2010—2020年的人口变化数据,有必要保证2010年和2020年的常住人口数据的地理空间范围一致性。据此,本文依据国家统计局发布的2020年统计用区划和城乡划分代码(第七次全国人口普查区域划分和地址编码的参照依据)和历年中华人民共和国行政区划简册发布的县级及以上行政区划变更情况,以2020年地级行政区划为基准,构建了2010—2020年空间可比的人口空间数据库[27],主要处理了3类数据。
(1)调整地方直属行政区划单元。仅保留海南省、河南省、湖北省的直辖县级行政区划,其余地方自定义直属行政区划调整为与国家标准一致,重新核算2020年和2010年常住人口。包括:① 将定州市并入保定市,将辛集市并入石家庄市,将梅河口市并入通化市,将杨凌区并入咸阳市;② 拆分沈抚新区常住人口,参照《沈阳市第七次全国人口普查公报(第二号)》,将沈抚新区的42312人并入沈阳市,沈抚新区其余常住人口并入抚顺市;③ 拆分长白山管委会常住人口,参照《长白山保护开发区第七次全国人口普查公报》,将池北区常住人口并入延边朝鲜族自治州,将池南区和池西区常住人口并入白山市;④ 参照《深圳市第七次全国人口普查公报(第二号)》,将深汕特别合作区常住人口并入汕尾市。
(2)核算行政区划调整涉及单元的常住人口。参照县级及以上行政区划变更情况,回溯核算相关地级单元的2010年常住人口。包括:① 将莱芜市并入济南市,将简阳市并入成都市,将公主岭市并入长春市,将寿县并入淮南市,将枞阳县并入铜陵市,将含山县、和县(不含沈巷镇)并入马鞍山市,将无为县、和县沈巷镇并入芜湖市,将巢湖市、庐江县并入合肥市,根据《中国2010人口普查分县资料》和《中国2010年人口普查分乡、镇、街道资料》重新核算对应地级单元2010年的常住人口;② 将雄安新区(含原沧州市的鄚州镇、苟各庄镇、七间房乡)并入保定市,将西咸新区所涉及的原咸阳市16个乡镇街道并入西安市(原则上并不符合2020年国家行政区划标准,但是考虑到西咸新区的管理和GDP等统计实际已经纳入西安市,故作相应调整),并重新核算相应范围内的2010年常住人口;③《新疆维吾尔自治区第七次全国人口普查公报(第二号)》只发布了“自治区直辖县级行政区划”的合计人口规模,这里“合计人口规模”仅包含阿拉尔市、图木舒克市、石河子市和五家渠市4个兵团城市,其他新设兵团城市常住人口在相关地州内统计,参照2010—2020年阿拉尔市和图木舒克市新增行政区划范围,根据《新疆生产建设兵团2010年人口普查暨调查师团连资料》重新核算各兵团城市和涉及地州最新行政区划对应的2010常住人口规模,其中,4个兵团城市以“自治区直辖县级行政区划”作为一个整体研究单元。
(3)确定人口空间统计的实际范围。包括:① 黑龙江省大兴安岭地区的加格达奇区和松岭区的常住人口实际位于内蒙古自治区呼伦贝尔市行政区划范围内,据此按照实际管辖范围调整大兴安岭地区和呼伦贝尔市的空间范围;② 那曲市的部分常住人口实际位于青海省海西蒙古族藏族自治州和玉树藏族自治州行政区划范围内,据此按照实际管辖范围调整那曲市、海西蒙古族藏族自治州和玉树藏族自治州的空间范围;③ 林芝市、山南市、三沙市等地区,按照人口普查实际统计范围或陆地面积核算常住人口密度。
本文的行政区划边界数据来源于中国科学院资源环境科学数据中心,并根据最新乡镇行政边界数据和地图资料补充编辑。最终,基于国家标准行政区划代码,构建2010—2020年可比的地级单元常住人口数据库,共计358个空间单元。本文暂未含港澳台地区,下同。
2.2 1982—2010年人口空间数据库
为对比2010—2020年与2010年之前各个时段的人口集疏特征,采用类似的行政区划调整融合处理的方法,对照1982—2010年县级及以上行政区划变更信息,构建1982—2010年可比的地级单元常住人口数据库。1982年、1990年、2000年和2010年的常住人口数据分别来源于《中华人民共和国人口统计资料汇编1949—1985》《中国分县市人口资料:1990年人口普查数据》《2000人口普查分县资料》和《中国2010人口普查分县资料》,该库共含340个空间单元。为尽可能保留2010—2020年最新数据的完整信息,本文未构建1982—2020年全部可对比的融合数据库。
2.3 准胡焕庸线
“胡焕庸线”是指黑龙江省黑河市到云南省腾冲市的连接线。由于人口数据往往按行政区划单元统计,而“胡焕庸线”与行政区划边界并不一致,故难以精确地计算“胡焕庸线”两侧人口规模。曾有学者提出采用省级边界划定的“准胡焕庸线”,将内蒙古、宁夏、甘肃、青海、西藏、新疆6个省、自治区作为西北半壁,然而若这样划分,则四川西部隶属于青藏高原的部分就被统计在了东南半壁,会产生较大误差[16-17]。为克服上述问题,本文提出了地级尺度的“准胡焕庸线”。由于地级尺度行政区划相对稳定,因此,利用地级尺度的“准胡焕庸线”,既有利于揭示“胡焕庸线”两侧人口分布的差异性,又有利于用行政区划数据探讨“胡焕庸线”的稳定性。表1列出了地级尺度“准胡焕庸线”东南半壁和西北半壁的空间范围。2010—2020年人口空间数据库中,东南半壁共293个地级空间单元,西北半壁共65个地级空间单元。1982—2010年人口空间数据库中,东南半壁共276个地级空间单元,西北半壁共64个地级空间单元。
表1 地级尺度“准胡焕庸线”两侧空间范围表
Tab. 1
| 区域 | 空间范围 |
|---|---|
| 东南半壁 | 北京市、天津市、河北省、山西省、内蒙古自治区(仅包括赤峰市和通辽市)、辽宁省、吉林省、黑龙江省(不包括大兴安岭地区)、上海市、江苏省、浙江省、安徽省、福建省、江西省、山东省、河南省、湖北省、湖南省、广东省、广西壮族自治区、海南省、重庆市、四川省(不包括阿坝藏族羌族自治州和甘孜藏族自治州)、贵州省、云南省(不包括迪庆藏族自治州和怒江傈僳族自治州)、陕西省(不包括榆林市) |
| 西北半壁 | 内蒙古自治区(不包括赤峰市和通辽市)、黑龙江省(仅包括大兴安岭地区)、四川省(仅包括阿坝藏族羌族自治州和甘孜藏族自治州)、云南省(仅包括迪庆藏族自治州和怒江傈僳族自治州)、西藏自治区、陕西省(仅包括榆林市)、青海省、宁夏回族自治区、新疆维吾尔自治区 |
2.4 人口分布集中化指数
本文将每个地级单元按照人口密度值从大到小排列,并计算人口数量的累计百分比。① 用于人口密度制图。根据人口数量累计百分比,从低到高每隔10个百分比划分出一个等级区间,对应地将人口密度从高到低分为10个等级,并据此编制人口密度图[28]。② 用于计算人口分布集中化指数。人口分布存在两种极端情况,一是全部人口集中分布在一个空间单元内;二是人口均匀分布在所有空间单元内,兼顾这两种极端情况,构建如下人口分布集中化指数计算公式:
式中:C代表人口集中化指数;i代表按人口密度从大到小排列的位序;n代表空间单元的数量;Ai代表对应位序的常住总人口累计百分比。人口集中化指数介于0~1,越接近0,人口分布越分散均匀;反之,越接近1,人口分布的集中化程度越高。
2.5 相对人口密度的年均变化指数
人口密度是反映人口分布的基本测度指标之一,其原理是将每个区域的人口都标准化到统一单元网格上,规避了不同行政区划单元人口规模不可比的问题。人口密度是横向(空间)和纵向(时间)均可比的相对指标,故常用人口密度变化值衡量人口分布的变动特征,其计算公式为:
式中:△PD代表人口密度的年均变化;Pt代表末期t时刻常住人口规模;P0代表初期0时刻常住人口规模;y代表初期与末期之间的间隔年数;S代表空间单元的面积。
为反映地级单元在省内人口集聚的优势特征,提出相对人口密度的测度指标。相对人口密度是指地级单元相对于所在省级单元人口密度的比值。相对人口密度年均变化指数计算公式为:
式中:△PRD代表相对人口密度年均变化指数;Pt代表末期t时刻地级单元常住人口规模;P0代表初期0时刻地级单元常住人口规模;
2.6 地理探测器
利用地理探测器探讨人口分布变动的影响因素。地理探测器的因子探测工具通过q值度量自变量对因变量空间分异的解释性。首先,确定自变量的“分层”(Strata),对于分类变量,每个“层”对应不同类型;对于连续变量,可以通过自然断点法或阈值区间划分出的不同的“层”。接着,计算每个自变量层内方差之和(Within Sum of Squares)与全区总方差(Total Sum of Squares)的比值r。最后,计算q值,q值等于1减去r,q值介于0~1之间,q值越大,自变量对因变量的解释性越强[29]。本文分别采用人口密度的年均变化量和相对人口密度的年均变化量作为因变量,从绝对变化和相对变量两个角度解析2010—2020年“胡焕庸线”两侧人口集疏变动的机理。自变量既考虑了经济水平、自然环境等因素[30],也考虑了新型城镇化建设特别关注的规模等级、城市群等因素。自变量及其分层方案具体如下:
(1)规模等级。城市规模等级是新型城镇化“实施差别化落户政策”的重要参考。中国城市规模等级新标准采用“城区常住人口”作为界定口径,但是在第七次人口普查开展之前有且仅有2010年人口普查公布了准确的“城区常住人口”数据,很多地方在实施人口调控时采用行政区划内的常住总人口作为参考。本文同时考虑“城区常住人口”和地级行政区划内的常住总人口两个口径,参考异化落户政策的人口规模区间,以≥ 500万人、300万~500万人、100万~300万人、50万~100万人、<50万人等作为城区常住人口规模或总人口规模的地理探测器分级方案[27]。考虑到政策实施的时段,城区常住人口规模等级和总人口规模等级均以第六次人口普查数据作为划分等级。其中,城区常住人口数据来源于《2010年第六次全国人口普查劳动力数据资料》,地区、自治州等非地级市单元的城区常住人口界定为< 50万人的调控区间。
(2)城市群类型。“以城市群为主体形态”是中国新型城镇化发展的重要特征,《国家新型城镇化规划(2014—2020年)》明确提出了优化城镇化布局和形态的实施目标。本文参照国家级城市群、区域性城市群、地区性城市群和非城市群地区的类型,确定城市群类型的地理探测器分级方案,解析不同类型城市群的人口集聚水平差异。
(3)行政等级。2010—2020年省会崛起、省会首位度或者省会独大等发展模式成为各界热议。特别是行政力量对社会基本公共服务、开发区或经济开发区建设、基础设施配套、人才引进优惠政策等资源方面的调配优势,进一步促进了省会或首府的人口集聚。本文从直辖市、省会、一般地级单元3个层次确定行政区划的地理探测器分级方案。
(4)经济水平。经济水平是驱动中国人口迁移的重要影响因素,经济水平较高的地方,往往能吸引更多人口集聚。本文通过自然断点法将人均GDP划分为5个等级,作为地理探测器分级方案。2020年GDP数据来源于各地级单元的国民经济和社会发展统计公报。
(5)生态地理区类型。和经济水平类似,自然环境也是分析人口分布及其变动的常用变量。正如“胡焕庸线”揭示的人地关系思想,人口分布与自然环境有着天然关系,尤其是东南半壁和西北半壁的差异特征。自然地理要素非常丰富,本文采用郑度等提出的中国生态地理区划,综合反映不同区域的自然环境差异[31]。该区划是中国自然地理类区划的新近成果,文中以16类不同生态地理区作为地理探测器分类方案。
3 结果分析
3.1 中国人口分布的总体格局相当稳定,西北半壁人口占比增幅已显著下降
1982—2020年“胡焕庸线”东南半壁和西北半壁的人口规模均持续增长,人口密度不断提升(表2)。截至2020年,东南半壁常住人口规模达13.18亿人,人口密度321.87人/km2;西北半壁常住人口规模仅0.92亿人,人口密度仅有17.23人/km2。以“胡焕庸线”为界,中国人口分布的总体格局没有发生根本性转变。从“胡焕庸线”两侧人口份额来看,1982—2020年“胡焕庸线”两侧“94∶6”的大数特征基本未变。截止2020年,东南半壁与西北半壁的常住人口比重为93.50:6.50。西北半壁保持常住人口份额微增,从1982年的6.01%增长至2020年的6.50%,提升0.49%,相应地,东南半壁常住人口份额下降0.49%。这主要与西北半壁少数民族地区相对较高的人口自然增长率有关[32⇓-34]。1982—1990年、1990—2000年、2000—2010年“胡焕庸线”西侧人口份额增幅分别为0.11%、0.21%、0.15%,2010—2020年“胡焕庸线”西侧人口份额增幅仅有0.02%,西北半壁人口份额增幅已显著下降。
表2 1982—2020年“胡焕庸线”两侧人口变动统计
Tab. 2
| 年份 | 人口规模(亿人) | 人口份额(%) | 人口密度(人/km2) | |||||
|---|---|---|---|---|---|---|---|---|
| 东南半壁 | 西北半壁 | 东南半壁 | 西北半壁 | 东南半壁 | 西北半壁 | |||
| 2020 | 13.18 | 0.92 | 93.50 | 6.50 | 321.87 | 17.23 | ||
| 2010 | 12.46 | 0.86 | 93.52 | 6.48 | 304.36 | 16.24 | ||
| 2000 | 11.64 | 0.79 | 93.67 | 6.33 | 284.23 | 14.78 | ||
| 1990 | 10.61 | 0.69 | 93.88 | 6.12 | 259.14 | 13.01 | ||
| 1982 | 9.45 | 0.60 | 93.99 | 6.01 | 230.69 | 11.35 | ||
注:① 依据地级尺度的“准胡焕庸线”,将中国划分为东南半壁和西北半壁;② 依据1982—2010年可对比的人口空间数据和2010—2020年可对比的人口空间数据库,开展数据核算,虽然两套数据库空间单元存在差异,但是核算出来的2010年胡焕庸线两侧人口数据一致。
3.2 东南半壁人口分布的集聚水平持续增长,而西北半壁人口分布的集聚水平由降转增
1990—2020年全国层面的人口分布集中化指数不断提升,东南半壁也呈现持续增长的态势,而西北半壁的人口分布集中化指数仅在2010—2020年才转为增长(表3)。也就是说,2010—2020年西北半壁人口分布的集聚特征由“趋于分散”转为“趋于集聚”。截至2020年,东南半壁10%的人口和50%的人口分别集聚在1.23%和18.35%的空间范围内;西北半壁10%的人口和50%的人口分别集聚在0.41%和5.83%空间范围内。相较于2010年,东南半壁和西北半壁在“10%”“50%”两个人口累计百分比特征值上对应的面积累计百分比均明显下降。由此说明,无论东南半壁还是西北半壁,人口分布均出现向少数地区集聚态势。
表3 1982—2020年“胡焕庸线”两侧人口分布集中化指数及相关参数
Tab. 3
| 年份 | 人口集中化指数 | 10%人口累计水平上的面积 累计百分比(%) | 50%人口累计水平上的面积 累计百分比(%) | ||||||||
|---|---|---|---|---|---|---|---|---|---|---|---|
| 全国 | 东南半壁 | 西北半壁 | 全国 | 东南半壁 | 西北半壁 | 全国 | 东南半壁 | 西北半壁 | |||
| 2020※ | 0.325 | 0.270 | 0.262 | 0.54 | 1.23 | 0.41 | 8.76 | 18.35 | 5.83 | ||
| 2010※ | 0.284 | 0.217 | 0.253 | 0.78 | 1.61 | 0.55 | 9.68 | 20.01 | 5.89 | ||
| 2010△ | 0.263 | 0.185 | 0.257 | 0.82 | 1.58 | 0.56 | 9.62 | 19.99 | 6.05 | ||
| 2000△ | 0.244 | 0.157 | 0.264 | 1.10 | 2.34 | 0.58 | 10.16 | 21.26 | 6.05 | ||
| 1990△ | 0.230 | 0.136 | 0.268 | 1.35 | 2.81 | 0.56 | 10.69 | 22.42 | 6.19 | ||
| 1982△ | 0.237 | 0.142 | 0.276 | 1.37 | 2.81 | 0.39 | 10.61 | 22.79 | 5.74 | ||
注:※采用的是2010—2020年可对比的人口空间数据库,共358个地级空间单元;△采用的1982—2010年可对比的人口空间数据库,共340个地级空间单元。
人口集聚地区主要集中在经济发达或省会城市。按照人口密度降序计算的常住人口累计百分比分级,绘制2020年全国人口密度分布图(图1)。在全国层面,人口稠密区主要分布在东南半壁,人口稀疏区则主要分布在西北半壁;单独看东南半壁,不乏云贵高原、大兴安岭、南岭、大巴山等人口相对稀疏区;单独看西北半壁,不乏甘肃东部到西宁一线、宁夏沿黄河地区、呼包榆、天山北坡、河西走廊等人口相对稠密区。总体来看,这与胡焕庸1935年描述的中国人口分布基本一致。时隔85年,中国人口分布发生的最显著变化是经济发达地区或省级行政中心的人口集聚水平明显提升,这些地区已成为东南半壁和西北半壁人口集中化程度提升的最主要贡献者。2020年人口密度超过1000人/km2的22个地级单元全部分布在东南半壁(表4),基本都是经济发达或省级行政中心所在的地级单元,其中,深圳市人口密度最高,达到8190.34人/km2;人口密度相对较低的地区大多集中到近年来经济相对衰退的东北地区。在西北半壁,人口密度相对较高的地区同样是经济发达或省级行政中心所在的地级单元,其中,银川市人口密度最高,达到415.15人/km2;大部分地区人口密度仍然处于非常低的水平,全国人口密度低于5人/km2的地级单元全部处于西北半壁。
图1
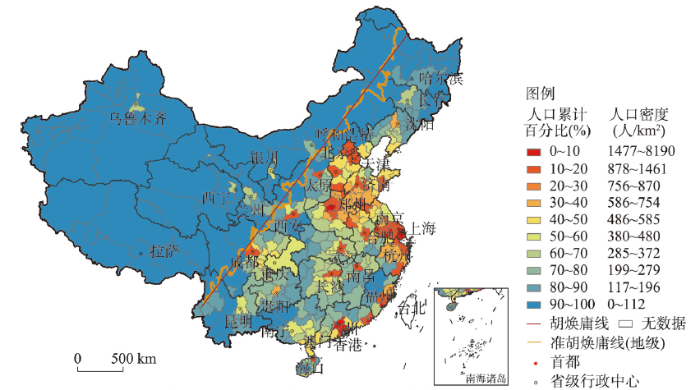
图1
2020年中国人口密度分布图(按照全国的人口累计百分比分级)
注:基于自然资源部标准地图服务网站GS(2016)1570号标准地图制作,底图边界无修改。
Fig. 1
Spatial distribution of China's population density in 2020 based on cumulative population percentage at national level
表4 2020年“胡焕庸线”两侧人口密度排序表(部分)
Tab. 4
| 人口密度位序 | 全国 | 东南半壁 | 西北半壁 | |||||
|---|---|---|---|---|---|---|---|---|
| 地级单元名称 | 人口密度(人/km2) | 地级单元名称 | 人口密度(人/km2) | 地级单元名称 | 人口密度(人/km2) | |||
| 正1 | 深圳市 | 8190.34 | 深圳市 | 8190.34 | 银川市 | 415.15 | ||
| 正2 | 东莞市 | 4253.98 | 东莞市 | 4253.98 | 乌海市 | 336.64 | ||
| 正3 | 上海市 | 3114.34 | 上海市 | 3114.34 | 兰州市 | 330.26 | ||
| 正4 | 厦门市 | 2923.48 | 厦门市 | 2923.48 | 西宁市 | 324.88 | ||
| 正5 | 广州市 | 2524.13 | 广州市 | 2524.13 | 乌鲁木齐市 | 285.36 | ||
| 正6 | 佛山市 | 2500.79 | 佛山市 | 2500.79 | 临夏州 | 259.42 | ||
| 正7 | 中山市 | 2432.37 | 中山市 | 2432.37 | 嘉峪关市 | 255.29 | ||
| 正8 | 汕头市 | 2343.71 | 汕头市 | 2343.71 | 天水市 | 209.04 | ||
| 正9 | 郑州市 | 1676.47 | 郑州市 | 1676.47 | 呼和浩特市 | 200.63 | ||
| 正10 | 无锡市 | 1593.39 | 无锡市 | 1593.39 | 石嘴山市 | 184.17 | ||
| 正11 | 苏州市 | 1477.30 | 苏州市 | 1477.30 | 平凉市 | 166.20 | ||
| 正12 | 成都市 | 1460.63 | 成都市 | 1460.63 | 定西市 | 128.63 | ||
| 正13 | 武汉市 | 1437.49 | 武汉市 | 1437.49 | 固原市 | 108.49 | ||
| 正14 | 南京市 | 1413.87 | 南京市 | 1413.87 | 自治区直辖 | 107.36 | ||
| 正15 | 北京市 | 1334.38 | 北京市 | 1334.38 | 海东市 | 104.48 | ||
| 正16 | 珠海市 | 1247.95 | 珠海市 | 1247.95 | 包头市 | 98.17 | ||
| 正17 | 常州市 | 1208.25 | 常州市 | 1208.25 | 陇南市 | 86.33 | ||
| 正18 | 西安市 | 1204.35 | 西安市 | 1204.35 | 榆林市 | 84.43 | ||
| 正19 | 嘉兴市 | 1172.96 | 嘉兴市 | 1172.96 | 吴忠市 | 82.27 | ||
| 正20 | 海口市 | 1153.60 | 海口市 | 1153.60 | 庆阳市 | 80.41 | ||
| 正21 | 天津市 | 1146.53 | 天津市 | 1146.53 | 中卫市 | 78.25 | ||
| 正22 | 揭阳市 | 1052.61 | 揭阳市 | 1052.61 | 白银市 | 75.23 | ||
| 倒11 | 哈密市 | 4.91 | 白城市 | 60.22 | 哈密市 | 4.91 | ||
| 倒10 | 日喀则市 | 4.45 | 牡丹江市 | 58.99 | 日喀则市 | 4.45 | ||
| 倒9 | 大兴安岭地区 | 3.99 | 白山市 | 55.60 | 大兴安岭地区 | 3.99 | ||
| 倒8 | 巴州 | 3.42 | 普洱市 | 54.35 | 巴州 | 3.43 | ||
| 倒7 | 林芝市 | 3.04 | 双鸭山市 | 52.79 | 林芝市 | 3.04 | ||
| 倒6 | 果洛州 | 2.90 | 通辽市 | 48.79 | 果洛州 | 2.90 | ||
| 倒5 | 玉树州 | 2.22 | 赤峰市 | 46.43 | 玉树州 | 2.22 | ||
| 倒4 | 海西州 | 1.80 | 延边州 | 45.89 | 海西州 | 1.80 | ||
| 倒3 | 那曲市 | 1.24 | 伊春市 | 26.77 | 那曲市 | 1.24 | ||
| 倒2 | 阿拉善盟 | 1.10 | 神龙架林区 | 20.55 | 阿拉善盟 | 1.10 | ||
| 倒1 | 阿里地区 | 0.37 | 黑河市 | 19.23 | 阿里地区 | 0.37 | ||
注:① 巴州、果洛州、玉树州、海西州、延边州、临夏州和自治区直辖的全称分别为巴音郭楞蒙古自治州、果洛藏族自治州、玉树藏族自治州、海西蒙古族藏族自治州、延边朝鲜族自治州、临夏回族自治州和新疆维吾尔自治区的自治区直辖县级行政区划。② 全国列项中,正1至正22位序包含2020年所有常住人口密度超过1000人/km2的地级单元,倒1至倒11位序包含2020年所有常住人口密度低于5人/km2的地级单元。
3.3 东南半壁人口集疏的“马太效应”持续强化,西北半壁人口集疏也开始转向东南模式
图2
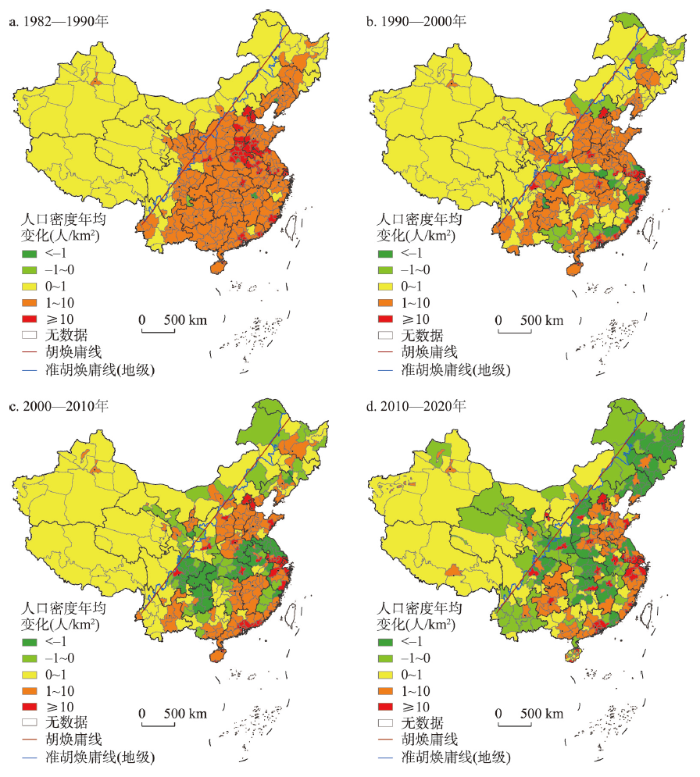
图2
1982—2020年中国人口密度年均变化
注:基于自然资源部标准地图服务网站GS(2016)1585号标准地图制作,底图边界无修改。
Fig. 2
Spatial distributions of average annual changes of population density in China from 1982 to 2020
表5 1982—2020年“胡焕庸线”两侧人口密度年均变化统计表
Tab. 5
| 年份 | 人口密度年均变化区间(人/km2) | 数量(个) | 面积占比(%) | |||||
|---|---|---|---|---|---|---|---|---|
| 全国 | 东南半壁 | 西北半壁 | 全国 | 东南半壁 | 西北半壁 | |||
| 2010—2020年 | < -1 | 86 | 83 | 3 | 12.84 | 28.09 | 1.09 | |
| -1~0 | 70 | 50 | 20 | 25.53 | 26.13 | 25.15 | ||
| 0~1 | 76 | 45 | 31 | 47.41 | 15.99 | 71.61 | ||
| 1~10 | 92 | 82 | 10 | 11.52 | 23.74 | 2.11 | ||
| ≥ 10 | 34 | 33 | 1 | 2.71 | 6.05 | 0.13 | ||
| 正增长合计 | 202 | 160 | 42 | 61.63 | 45.78 | 73.85 | ||
| 负增长合计 | 156 | 133 | 23 | 38.37 | 54.22 | 26.15 | ||
| 2000—2010年 | < -1 | 49 | 48 | 1 | 7.09 | 16.01 | 0.20 | |
| -1~0 | 45 | 35 | 10 | 13.87 | 17.00 | 11.46 | ||
| 0~1 | 86 | 46 | 40 | 60.66 | 28.24 | 85.69 | ||
| 1~10 | 127 | 114 | 13 | 16.09 | 33.49 | 2.65 | ||
| ≥ 10 | 33 | 33 | 0 | 2.29 | 5.26 | 0.00 | ||
| 正增长合计 | 246 | 193 | 53 | 79.04 | 66.99 | 88.35 | ||
| 负增长合计 | 94 | 83 | 11 | 20.96 | 33.01 | 11.65 | ||
| 1990—2000年 | < -1 | 9 | 9 | 0 | 1.18 | 2.71 | 0.00 | |
| -1~0 | 25 | 23 | 2 | 7.15 | 13.04 | 2.61 | ||
| 0~1 | 103 | 56 | 47 | 66.68 | 31.42 | 93.92 | ||
| 1~10 | 178 | 163 | 15 | 23.36 | 49.11 | 3.48 | ||
| ≥10 | 25 | 25 | 0 | 1.62 | 3.72 | 0.00 | ||
| 正增长合计 | 306 | 244 | 62 | 91.67 | 84.25 | 97.39 | ||
| 负增长合计 | 34 | 32 | 2 | 8.33 | 15.75 | 2.61 | ||
| 1982—1990年 | < -1 | 3 | 3 | 0 | 0.15 | 0.34 | 0.00 | |
| -1~0 | 1 | 1 | 0 | 0.13 | 0.30 | 0.00 | ||
| 0~1 | 68 | 25 | 43 | 62.37 | 20.97 | 94.34 | ||
| 1~10 | 222 | 201 | 21 | 34.05 | 70.80 | 5.66 | ||
| ≥ 10 | 46 | 46 | 0 | 3.31 | 7.59 | 0.00 | ||
| 正增长合计 | 336 | 272 | 64 | 99.72 | 99.36 | 100.00 | ||
| 负增长合计 | 4 | 4 | 0 | 0.28 | 0.64 | 0 | ||
注:① 东南半壁和西北半壁的划分依据是地级尺度的“准胡焕庸线”;② 1982—2010年可对比的人口空间数据和2010—2020年可对比的人口空间数据库的空间单元数量存在差异;③ “面积占比”各列自左向右分别对应为占全国的面积比重、占东南半壁的面积比重和占西北半壁的面积比重。
东南半壁人口集疏的“马太效应”持续强化。纵观1982—2010年,长三角地区、珠三角地区、北京市、天津市和大多数省会城市成为人口密度增长最具优势的地区,而其他地区大多呈现人口增长平稳或衰减,这种剧烈过程在已有的文献中总结为“马太效应”模式[11]。2010—2020年东南半壁的“马太效应”不仅没有消减,反而更加剧烈,人口负增长区面积首次超过人口正增长区,人口负增长的地级单元数量达133个,占东南半壁面积的54.22%。而且人口密度变化< -1人/km2的地级单元面积明显增长,也就是说,人口负增长区不仅表现在面积的大幅扩张,还表现为人口密度负增长程度的加剧。同时,东南半壁的人口正增长的地级单元数量已经缩减至160个,其中,人口密度年均增长≥ 10人/km2的地级单元仅有33个,面积占比仅6.05%,这些人口密度增长优势区主要包括长三角地区、珠三角地区、北京市和绝大部分省会城市。山西省、陕西省、湖北省、湖南省、江西省、云南省、四川省、江西省、辽宁省、吉林省等省区人口集疏的“马太效应”尤为突出,这些省区除了省会外,省内其他地区人口密度增长水平明显偏低甚至全部呈现负增长。
西北半壁1982—2010年总体上是“相对均势”的人口集疏模式,而2010—2020年,类似东南半壁“马太效应”模式开始显现。具体来看,1982—2010年西北半壁人口正增长面积仍占大多数,已有文献将西北半壁这种绝大多数地区普遍保持人口正增长的状态总结为“相对均势”的人口集疏模式[11]。而2010—2020年西北半壁的人口集疏的“马太效应”开始凸显。西北半壁人口负增长区的面积比重扩张至26.15%,在河西走廊地区、甘肃省东部、青海省北部、新疆维吾尔自治区的塔城地区、内蒙古自治区的中部地区等均出现人口负增长区。同时,呼和浩特市、银川市、兰州市、西宁市、拉萨市、乌鲁木齐市等省会或首府人口密度正增长幅度特别突出,其人口密度年均变化基本处于1~10 人/km2的区间,而且这些省会周边的人口增幅要么萎缩、要么转为人口负增长,这也正是2010年以来西北半壁人口集中化指数出现“拐点”的重要原因。但是西北半壁人口集疏的“马太效应”强度明显低于东南半壁,特别是,由于相对宽松的计划生育政策、少数民族聚居及特有生计方式等因素,在新疆维吾尔自治区、西藏自治区和青海省南部的绝大部分地区依然具有人口密度“相对均势”的人口集疏特征。
3.4 省会人口集聚得到持续强化,且西北半壁较东南半壁更为显著
图3
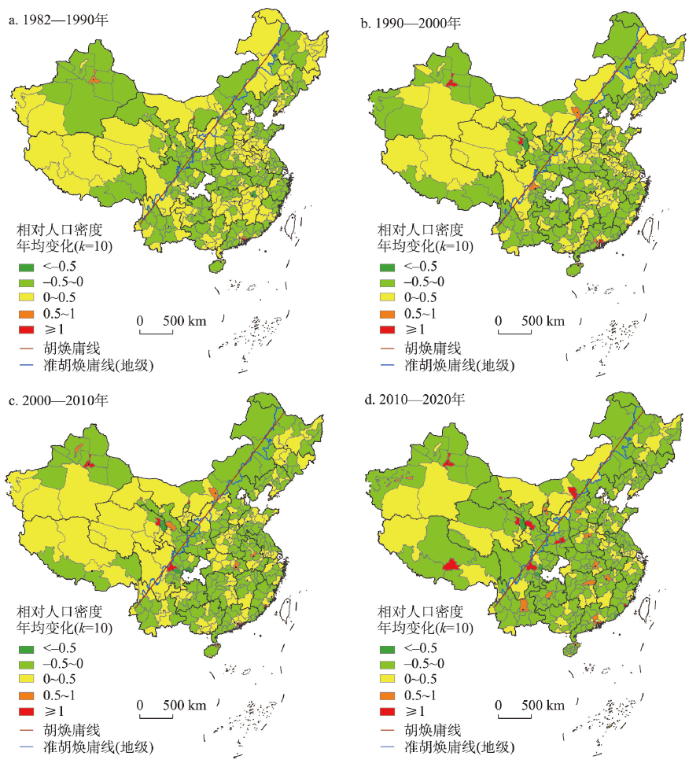
图3
1982—2020年中国相对人口密度年均变化指数
注:基于自然资源部标准地图服务网站GS(2016)1585号标准地图制作,底图边界无修改;北京市、上海市、天津市和重庆市属于省级单元,不参与相对人口密度的核算。
Fig. 3
Spatial distributions of average annual changes of relative density of population in China from 1982 to 2020
表6 1982—2020年“胡焕庸线”两侧相对人口密度年均变化统计表
Tab. 6
| 年份 | 人口密度年均 变化区间(人/km2) | 数量(个) | 面积占比(%) | |||||
|---|---|---|---|---|---|---|---|---|
| 全国 | 东南半壁 | 西北半壁 | 全国 | 东南半壁 | 西北半壁 | |||
| 2010—2020年 | < -0.5 | 4 | 3 | 1 | 0.28 | 0.33 | 0.24 | |
| -0.5~0 | 247 | 209 | 38 | 66.24 | 77.08 | 58.13 | ||
| 0~0.5 | 80 | 63 | 17 | 31.17 | 19.78 | 39.68 | ||
| 0.5~1 | 12 | 10 | 2 | 1.09 | 2.08 | 0.35 | ||
| ≥ 1 | 11 | 4 | 7 | 1.22 | 0.73 | 1.59 | ||
| 正增长合计 | 103 | 77 | 26 | 33.48 | 22.59 | 41.62 | ||
| 负增长合计 | 251 | 212 | 39 | 66.52 | 77.41 | 58.38 | ||
| 2000—2010年 | < -0.5 | 3 | 2 | 1 | 0.30 | 0.36 | 0.25 | |
| -0.5~0 | 190 | 162 | 28 | 49.35 | 65.13 | 37.52 | ||
| 0~0.5 | 130 | 102 | 28 | 49.33 | 33.72 | 61.04 | ||
| 0.5~1 | 7 | 3 | 4 | 0.60 | 0.40 | 0.75 | ||
| ≥ 1 | 6 | 3 | 3 | 0.42 | 0.40 | 0.44 | ||
| 正增长合计 | 143 | 108 | 35 | 50.35 | 34.51 | 62.23 | ||
| 负增长合计 | 193 | 164 | 29 | 49.65 | 65.49 | 37.77 | ||
| 1990—2000年 | < -0.5 | 1 | 0 | 1 | 0.14 | 0.00 | 0.25 | |
| -0.5~0 | 178 | 145 | 33 | 50.30 | 60.70 | 42.50 | ||
| 0~0.5 | 145 | 119 | 26 | 48.83 | 38.61 | 56.49 | ||
| 0.5~1 | 6 | 5 | 1 | 0.42 | 0.54 | 0.33 | ||
| ≥ 1 | 6 | 3 | 3 | 0.32 | 0.15 | 0.44 | ||
| 正增长合计 | 157 | 127 | 30 | 49.56 | 39.30 | 57.25 | ||
| 负增长合计 | 179 | 145 | 34 | 50.44 | 60.70 | 42.75 | ||
| 1982—1990年 | < -0.5 | 1 | 1 | 0 | 0.08 | 0.19 | 0.00 | |
| -0.5~0 | 170 | 140 | 30 | 48.13 | 54.50 | 43.36 | ||
| 0~0.5 | 160 | 128 | 32 | 51.56 | 45.18 | 56.34 | ||
| 0.5~1 | 3 | 2 | 1 | 0.19 | 0.09 | 0.27 | ||
| ≥ 1 | 2 | 1 | 1 | 0.04 | 0.05 | 0.03 | ||
| 正增长合计 | 165 | 131 | 34 | 51.79 | 45.31 | 56.64 | ||
| 负增长合计 | 171 | 141 | 30 | 48.21 | 54.69 | 43.36 | ||
注:① 东南半壁和西北半壁的划分依据是地级尺度的“准胡焕庸线”;② 1982—2010年可对比的人口空间数据和2010—2020年可对比的人口空间数据库的空间单元数量存在差异;③ “面积占比”各列自左向右分别对应占全国的面积比重、占东南半壁的面积比重和占西北半壁的面积比重;④ “相对人口密度年均变化指数”的核算不包括北京市、上海市、天津市和重庆市4个直辖市。
东南半壁,省会的相对人口密度年均变化指数的增长得到持续强化。具体来看,在相对人口密度年均变化指数≥ 1或者介于0.5~1的人口增长相对优势区中,1982—1990年仅有深圳、广州2市,1990—2000年厦门市、成都市加入其中,2000—2010年合肥市、武汉市加入其中,2010—2020年,太原市、西安市、郑州市、昆明市、贵阳市、长沙市、南昌市等省会城市也已加入其中。不难发现,相对人口密度年均变化较高的地级单元基本都是省会。2010—2020年成都和西安2市的相对人口密度年均变化指数均已超过1,是东南半壁中相对于本省人口空间极化最为突出的两个地区。而在长三角地区和珠三角地区改革前沿地带,其省会的相对人口密度年均变化指数反而并不突出。
西北半壁,省会或首府的相对人口密度年均变化指数的增长较比东南半壁更为显著。1982—1990年、1990—2000年、2000—2010年3个时段西北半壁相对人口密度年均变化指数正增长的面积不断增长,而相对人口密度负增长的面积呈现不断减少,人口分布是趋于分散的,这与前文中西北半壁人口集中化指数下降是对应的。但是2010—2020年呈现明显的“拐点”,西北半壁相对人口密度年均变化指数正增长的面积占比下降至41.65%,而相对人口密度负增长的面积扩张至58.35%,人口空间极化态势明显。具体来看,在相对人口密度年均变化指数≥ 1或者介于0.5~1的人口增长相对优势区中,1982—1990年仅有乌鲁木齐1市,1990—2000年西宁市、乌海市、呼和浩特市加入其中,2000—2010年兰州市、克拉玛依市也已加入其中,到2010—2020年,银川市、拉萨市、嘉峪关市也已加入其中。2010—2020年西北半壁绝大部分省会的相对人口密度年均变化指数都超过1,而东南半壁仅有成都市和西安市处于这样一个高水平区间,也就是说,在西北半壁,省会人口相对增长优势更加显著。
3.5 “胡焕庸线”两侧人口变动的影响因素
文中分别采用人口密度年均变化和相对人口密度年均变化指数作为因变量,通过地理探测器工具的因子分析方法,识别哪些因素对人口密度变化或人口密度相对变化的空间异质性的作用最为突出,结果如表7所示。
表7 2010—2020年“胡焕庸线”两侧人口变动影响因素的地理探测结果
Tab. 7
| 因素 | 人口密度年均变化 | 相对人口密度年均变化指数 | |||||
|---|---|---|---|---|---|---|---|
| 全国 | 东南半壁 | 西北半壁 | 全国 | 东南半壁 | 西北半壁 | ||
| 总人口规模等级 | 0.053*** | 0.048*** | 0.054 | 0.023* | 0.049*** | 0.044 | |
| 城区人口规模等级 | 0.286*** | 0.283*** | 0.487*** | 0.279*** | 0.381*** | 0.417*** | |
| 城市群类型 | 0.042*** | 0.037** | 0.111 | 0.025** | 0.020 | 0.043 | |
| 行政区划等级 | 0.041*** | 0.046*** | 0.516*** | 0.331*** | 0.246*** | 0.683*** | |
| 经济水平 | 0.140*** | 0.158*** | 0.166* | 0.120*** | 0.149*** | 0.149* | |
| 生态地理区类型 | 0.138*** | 0.134*** | 0.097 | 0.072 | 0.050 | 0.093 | |
注:***、**、*分别表示在1%、5%、10%的水平下显著。
从人口密度变化看,在全国层面,本文所选的6个自变量的影响都呈现统计显著性,其中,城区人口规模等级解释力最高,其次为生态地理区类型和经济水平;在东南半壁,回归结果和全国层面十分类似;然而,在西北半壁,只有城区人口规模等级、行政等级和经济水平的影响作用相对显著,而且,行政等级的解释力最高。
从相对人口密度变化看,在全国层面,除了生态地理区,其他自变量都呈现统计显著性,其中,行政等级的影响作为突出,其次为城区人口规模等级、经济水平等;在东南半壁,只有总人口规模等级、城区人口规模等级、行政等级和经济水平呈现统计显著,且城区人口规模等级解释力最高,其次为行政等级、经济水平等;在西北半壁,仅有城区人口规模等级、行政等级、经济水平呈现统计显著,且行政等级的作用尤其突出,其次才是城区人口规模等级和经济水平的贡献。
不难发现,“胡焕庸线”两侧人口变动的影响因素存在一定的共性和差异。共性是,城区人口规模等级、行政区划等级和经济水平都是东南半壁和西北半壁的人口变动的重要影响因素,虽然西北半壁地处内陆,具有特殊的生态地理区类型,但是生态地理区类型的差异对西北半壁内部的人口密度或人口密度相对变化影响并不显著。西北半壁人口集疏模式主要受经济发展水平和城市等级驱动,这一点上和东南半壁的人口集疏机理是类似的。差异是,东南半壁的城市规模等级的影响更为突出,而西北半壁的行政区划等级的影响更为突出,按照国家城区人口规模标准口径,西北半壁没有超大城市和特大城市,以中小城市为主,行政区划等级较高的省会城市无论城市规模等级如何,其人口密度或相对人口密度的增速都最为突出。此外,相较于城区人口规模等级这一标准口径,总人口规模等级与人口密度或相对人口密度变化的关联强度明显降低,而且在西北半壁均是不显著的,显然,至少在西北半壁采用总人口规模等级作为人口调控参考显然与人口变动态势不相吻合的。作为新型城镇化主体形态的城市群,城市群类型的差异仅在全国层面和东南半壁与人口密度或相对人口密度变化呈现一定显著性,而在西北半壁,城市群类型的差异尚不足以影响人口集聚能力,这也与西北半壁本身的城市群发育阶段和发育程度普遍滞后有一定关系。
4 结论与讨论
4.1 结论
基于第七次人口普查数据,本文构建了2010—2020年行政区划单元可比的地级人口空间数据库,以地级尺度的“准胡焕庸线”为依据,采用人口集中化指数、人口密度年均变化、相对人口密度年均变化指数等指标,解析“胡焕庸线”两侧人口空间变动的新态势,并采用地理探测器解析人口空间变动的主要影响因素。主要结论如下:
(1)“胡焕庸线”依然稳定,2020年东南半壁与西北半壁的人口比为93.5∶6.5,东南密、西北疏的人口分布格局并没有出现根本性变动。西北半壁人口份额仍然微增,但其增幅较2010年前明显下降,2010—2020年“胡焕庸线”两侧人口份额变动不大。
(2)“胡焕庸线”两侧人口集疏呈现新特征。从人口集中化指数来看,东南半壁人口分布的集聚水平持续增长,而西北半壁在2010—2020年迎来拐点,人口分布的集聚水平由降转增;从人口密度增长格局来看,东南半壁人口集疏的“马太效应”不断强化,2010—2020年人口负增长区的面积占比已达54.22%,首次超过人口正增长区,而西北半壁人口集疏的“马太效应”也开始凸显;从相对本省的相对人口密度变化来看,省会人口增长愈发突出,而且西北半壁比东南半壁更为显著。
(3)影响“胡焕庸线”两侧人口分布因素存在差异。东南半壁的城市规模等级的影响更为突出,而西北半壁的行政区划等级的影响更为突出。城区人口规模等级、行政区划等级和经济水平都是东南半壁和西北半壁的人口变动的重要影响因素,不同的是,经济发展水平、城区人口规模等级、行政区划等级显著影响区域人口变动;西北半壁行政区划等级对人口增长的影响效应尤为突出。城市群对东南半壁的人口增长影响显著,但是对西北半壁影响不大。
4.2 讨论
(1)虽然人口份额难以突破“胡焕庸线”,但“胡焕庸线”两侧人口集疏模式已经趋同。李克强总理在国家博物馆参观人居科学研究展,提出了“胡焕庸线”能否被打破之问。从人口大数比例来看,“胡焕庸线”两侧人口份额的“94∶6”的大数特征一直不变,而且“胡焕庸线”两侧人口相对稠密区和人口稀疏区总体是稳定的。突破“胡焕庸线”,并不是要打破这种天然的人地关系,而是要关注“胡焕庸线”两侧的区域发展差距。从人口分布变动来看,2010—2020年西北半壁出现了一些转折性变化,人口份额不再明显地增长,人口集疏开始出现类似东南半壁的“马太效应”。而且,西北半壁以省会为代表的人口极化集聚模式与东南半壁很多地方有着一致的特征,拉萨、乌鲁木齐、西宁、银川、呼和浩特都具有明显的人口增长优势。同时,和东南半壁类似,经济水平、城区人口规模等级和行政区划等级也是主要的影响因素。可见,2010—2020年间西北半壁也开始出现东南半壁在2010年出现的人口集疏模式,从这一点上看,“胡焕庸线”是已经被突破的。不过也能看到,在西藏、新疆等地农牧区的人口变动仍然呈现“相对均势”的普涨模式,这与这些地区的自然环境和生计模式是紧密相关的。
(2)在推进新型城镇化高质量发展过程中,要重视行政中心人口快速集聚、全国人口负增长区快速扩张等现象。在“十二五”和“十三五”时期,新型城镇化建设尤其重视增长型城镇的人口调控政策,城区人口规模较高的地方往往户籍门槛较高。事实上,2020年人口普查显示,超大特大城市仍然是人口增长最为突出的地区,未来这些地区的市民化发展仍然需要持续重视。同时,不可忽视行政区划等级的作用,特别是西北半壁,许多省会城市的城区人口规模虽然并不突出,但是行政区划等级较高的省会城市往往具有较强的要素集聚效应,就业机会、医疗教育资源、城市现代化水平、交通通达性等往往都更胜一筹,未来应当重视这些地区的城市承载能力,关注从城市群到都市圈等更精细尺度的区域人口联系。另外,要十分重视东南半壁和西北半壁都出现的人口负增长区的扩张现象,一是伴随着劳动力大量流失的空心村和收缩城市问题;二是面向人口长期均衡发展的国家战略,积极应对中国人口增长拐点出现之后的区域人口增长乏力现象。
(3)研究数据和方法的局限性。采用地级尺度的“准胡焕庸线”区分东南半壁和西北半壁,相关核算结果和研究结论可能与采用其他方法界定东南半壁和西北半壁的研究存在一定的差异[11-12,16 -17,35]。本文在探讨人口变化的影响因素时,特别关注了与新型城镇化发展相关几个核心变量,并没有面面俱到,其实不同地区影响人口分布变动的因素可能存在显著差异,后续工作需要结合典型区域,做进一步深入的案例研究。虽然地理探测器在分析定类自变量的作用强度上具有一定优势,但若考察定序或定比自变量时,或考察自变量的作用方向时,有必要进一步尝试其他统计模型。文中对“胡焕庸线”的研究虽然延续了人口规模或人口密度的研究传统,但随着中国人口的年龄结构、受教育程度等维度特征的深刻变动,有必要结合新的数据重视“胡焕庸线”两侧人口结构的区域差异与区域调控。
参考文献
Contributions of master Hu Huanyong to the development of modern geography in China
胡焕庸大师对发展中国地理学的贡献
A review of population geography research in China
DOI:10.11821/dlxb201408012
[本文引用: 1]

China's reform and opening up period saw a revival of research into population geography. Chinese researchers have discussed the issues of population capacity and realized that the total population of China will reach its maximum capacity and result in many social problems. The key to solving these problems is controlling total population capacity, developing production and changing lifestyles. Faced with resource shortages and environmental pollution, Chinese researchers have proposed strategies for creating a fourth industry, feeding environment, promoting labor employment, reducing environment pollution, and promoting gracious social behavior, cultural consciousness and new community organization at different scales. In response to rapid industrial shifts and various population structures, the research field proposed the theory of balanced population growth, and when faced with land use and development issues they developed a regional development model through industry transfer, population migration and payment transfer. Other themes covered in this review include unbalanced regional development, functional zoning indicators, a partitioned model of population development, population analysis, quantitative index and modeling. Future work on population geography in China requires (1) a distributed geographic information system around census and population thematic data to promote the exchange of population data and measurement models; (2) strengthening surveys of different micro-scale communities and control of the active behavior of community systems under rapid population change to improve our understanding and interpretation of quantitative population geography; and (3) international population intelligence exchange to better understand the population evolution trends of different countries, and regulate and control the allocation of labor and talent. Last, population geography researchers in China should adopt interdisciplinary methods to maximize their contribution to national development and scientific research.
中国人口地理研究进展
DOI:10.11821/dlxb201408012
[本文引用: 1]
1978年以来是中国人口地理学复兴和发展时期。中国人口地理学工作者消化吸收西方经典人口学理论,讨论中国人口容量问题,认识到中国人口总量即将达到增长极限,强调控制人口总量、努力发展生产和转变生存方式是解决人口问题的关键。针对资源短缺和环境污染问题,提出了创建第四产业,实施环境抚育,推动劳动力就业,降低环境污染的策略。针对民生问题,提出深入开展微观社会调查,主动再造跨尺度的社区制度,推进对人口行为的尺度综合和文化自觉。针对中国人口快速转变和人口结构问题,提出了人口均衡发展理论。针对国土空间开发格局问题,提出了区域发展均衡模型,强调通过产业转移、人口流动、转移支付等手段,形成相对均衡的区域发展格局。针对区域人口发展不平衡问题,提出了人口发展功能分区指标和分区模型,初步实现了视野综合化、指标定量化、分析模型化,将人口地理学研究推向新高度。未来中国人口地理学研究,一要围绕人口普查和人口业务数据库,建设分布式人口地理信息系统,推动人口专题数据和人口计量模型共享,巩固和发展人口地理学定量化研究之特色;二要加强不同尺度的社区微观调查,主动调控人口快速转变情景下的社区行为,提高对人口地理学定量研究结果的理解和解释;三要加强国际人口情报交流,把握各国人口演化趋势,从经济全球化的分工合作体系的视角,合理配置中国劳动力资源和人才资源。中国人口地理学应坚持走跨学科的发展道路,努力在世界人口之巅辛勤耕耘,为国家发展、学科建设做出应有的贡献。
Internal labor migration in China: Trends, geographical distribution and policies
China's floating population in the 21st century: Uneven landscape, influencing factors, and effects on urbanization
DOI:10.11821/dlxb201504005
[本文引用: 1]
China has witnessed unprecedented urbanization over the past decades. The rapid expansion of urban population has been dominated by the floating population from rural areas, of which the spatiotemporal patterns, driving forces, and multidimensional effects have been scrutinized and evaluated by voluminous empirical studies. However, the urban and economic development mode has been reshaped by the globalization and marketization processes and the socioeconomic space has been restructured as a consequence. How has the spatial pattern of floating population evolved against these backdrops? How has the evolution been driven by the interaction of state and market forces? What have been the contribution of population mobility to the urbanization of origin and destination regions and the evolution of China's urban system? The latest national censuses conducted in 2000 and 2010 offer the opportunity to systematically answer these questions. Analysis based on the county-level data comes to conclusions as follows. (1) The spatial pattern of floating population remained stable over the first decade of the 21st century. Three coastal mega-city regions, namely the Yangtze River Delta, the Pearl River Delta, and the Beijing-Tianjin-Hebei Region, were major concentration areas. As the emergence and rapid development of other coastal mega-city regions, the coastal concentration area of floating population tended to geographically united as a whole, whereas the spatial distribution within each region variegated significantly. (2) Floating population gradually moved into provincial capitals and other big cities in interior regions and its distribution center of gravity moved northward around 110 km during the study period. (3) Compared with extensively investigated inter-provincial migrants, intra-provincial migrants had higher intention and ability to permanently live in cities they worked in and thus might become the main force of China's urbanization in the coming decades. (4) The spatial pattern of floating population was shaped jointly by the state and market forces in transitional China. While the impacts of state forces have been surpassed by market forces in the country as a whole, they are still important in shaping the development space of central and western China. (5) The massive mobility of population contributed a large proportion to the increase of urbanization levels of both origin and destination regions and reshaped China's urban system in terms of its hierarchical organization and spatial structure.
中国流动人口空间格局演变机制及城镇化效应: 基于2000和2010年人口普查分县数据的分析
DOI:10.11821/dlxb201504005
[本文引用: 1]
基于2000和2010年全国人口普查分县数据,对中国流动人口空间格局的演变特征、形成机制及其城镇化效应进行了系统分析。研究发现,流动人口分布的空间格局具有较强的稳定性,长三角、珠三角和京津冀等沿海城市群仍然是其主要集中地,且沿海集中区有连绵化的趋势,但在城市群内部的空间分布模式差异显著。流动人口向内陆地区的省会等特大城市集中趋势明显,其分布重心出现了明显的北移。省内县际的流动人口规模已接近于省际流动,且有更高的意愿和更强的能力永久居留城镇,省内县际的永久性迁移将成为未来中国人口城镇化的主导模式。中国流动人口迁入地的选择受到政府和市场双重力量的影响,后者的影响力更强。远距离流入东部地区的人口在务工之外,对享受城市生活也开始有所考虑;而中西部地区政府力量在引导人口流动中仍起到重要作用。大规模的人口流动对流出地和流入地的城镇化水平提高均有显著贡献,同时在很大程度上重构了中国城镇体系的等级规模结构和空间布局模式。
The urbanization of the human population
DOI:10.1038/scientificamerican0965-40 URL [本文引用: 1]
Trends in internal migration and mobility: International experiences and their implications for China
This article reviews international literature on the changing trends of population migration and mobility and their mechanisms from the following perspectives: the changing trends of different forms of population mobility,the international comparison of the overall intensity of China’s internal mi- gration,the micro life course of population migration and mobility,and the mechanism and recent evolution of circular migration.The authors derive the following views on the future trends of China’s population migration and mobility from the above review and its implications: First,the recent decreasing trends of regional and rural-urban migration in China indicate changes in the forms of China’s population mobility rather than a real decline of its overall volume and intensity,which will still be on the rise; Second,great attention still needs to be paid to the portable issues of various public services provided to the floating population; and third,the management of and services to the floating population need to be improved in accordance with the changes in the forms of population mobility,especially the rise of urban to urban and intra-urban migration and mobility.
国内人口迁移流动的演变趋势: 国际经验及其对中国的启示
文章从人口迁移流动的不同形式及其演变趋势、中国国内人口迁移整体强度的国际对比、人口迁移流动的微观生命过程、以及人口循环流动的发生发展机制和近期演变等4个方面回顾了国际上对人口迁移流动演变趋势及其机制的相关研究,并根据从中获得的借鉴和启示对中国人口迁移流动的未来走势做出判断,认为目前我国人口在区域和乡城间迁移流动的减缓更多预示的是人口迁移流动形式的改变,而不是其整体规模和强度的下降,后者还有着相当大的上升空间;今后仍不可忽视针对迁移流动人口的各种公共服务的转移、接续问题,并要根据人口迁移流动形式的变化,尤其是人口在城市间和城市内部迁移流动上升的新形势,与时俱进地改进流动人口的管理和服务工作。
Distribution of China's population with statistics and maps
DOI:10.11821/xb193502002
[本文引用: 1]
China is the most populous country of the world.Besides her great numberof population she has also the most densely inhabited regions which are notcomparable with any other country of the world.
中国人口之分布: 附统计图与密度图
DOI:10.11821/xb193502002
[本文引用: 1]
年来中外学者,研究中国人口问题者,日见其多,中国人口是否过剩,国境以内,是否尚有大量移民之可能,此实当今亟须解答之间题,各方对此之意见,甚为纷歧;或则谓中国人口,实已过剩,此可由社会生计艰难,失业问题严重,以及海外侨民之多可以证之;或则谓中国人口,实未过剩,以全国面积除全国人口,计算其密度,较之欧西诸国,尚不及远甚,国境西北部,地旷而人稀,将来实大有移民之可能.
The ideological origins and geographical demarcation significance of Hu Huanyong Line
DOI:10.11821/dlxb202106001
[本文引用: 1]
In the early 20th century, China was faced with domestic crisis and foreign invasion, and the man-land contradictions were unprecedented fierce. Geographers pondered and explored the issues of national fortune such as China's population status, northwest exploitation and internal migration, thus China's population geography emerged as the times required. "The distribution of population in China" published by Hu Huanyong in 1935 is a symbol of maturity of China's population geography. The Hu Huanyong Line (also known as Hu Line) proposed in this paper, which he originally called the Aihui-Tengchong Line, is a significant geographical demarcation of China's population. The existence and stability of the Hu Line have been repeatedly verified by census data, and its scientific principles have also been revealed and explained by the academic circles from aspects of nature, economy, social culture, etc. This paper points out that grain and employment are the two hidden logics behind the Hu Line. The Hu Line is becoming a crucial national geographic demarcation, which has an increasingly essential impact on the cognition and analysis of China's national conditions. Recent research on the Hu Line has been widely extended in various fields and meanings, and there arose some amendments and adaptations of the line in practice. Under the influence of "Premier Li Keqiang's three questions", whether the Hu Line can be broken through has become an academic hot spot. This paper holds that it is more important to create more opportunities of the northwest region than to increase the share of population so as to balance regional development.
胡焕庸线的学术思想源流与地理分界意义
DOI:10.11821/dlxb202106001
[本文引用: 1]
20世纪早期,中国面临内忧外患、人地关系矛盾空前剧烈,地理学家对于中国人口国情、西北开发及国内移民等关乎国运问题的思考与探索,孕育了中国的人口地理学。1935年胡焕庸发表的“中国人口之分布”是中国人口地理学走向成熟的标识,文中提出的“瑷珲—腾冲线”即“胡焕庸线”,是中国人口地理的重要分界线。胡焕庸线的存在性与稳定性被人口普查等现实数据反复验证,其科学原理也被学术界从自然、经济、社会文化等方面加以揭示和阐释。本文指出食物与就业是胡焕庸线潜在的两大逻辑。胡焕庸线正在成为一条重要的国家地理分界,对认知与分析中国国情产生越来越重要的影响。近年来胡焕庸线的研究有了广泛引申,并衍生出多个领域、多种意义下的胡焕庸线,在应用层面上还出现了对该线的修正与变通。在“总理三问”的影响下,胡焕庸线能否突破成为一个学术热点,本文认为重要的不是增加西北人口份额,而是让西北地区获得更多发展机会,促进区域均衡发展。
A GIS-based study on the distribution pattern of China's population in the year 2000: Compared with Hu Huanyong's study in 1935
基于GIS的中国2000年人口之分布格局研究: 兼与胡焕庸1935年之研究对比
Cognizing population density demarcative line (Hu Huanyong-Line) based on space technology
基于空间信息认知人口密度分界线: “胡焕庸线”
A big-data analysis of Hu Line existence in the ecology view and new economic geographical understanding based on population distribution
胡焕庸线存在性的大数据分析: 中国人口分布特征的生态学及新经济地理学认识
Study on the stability of Hu Line and different spatial patterns of population growth on its both sides
DOI:10.11821/dlxb201504004
[本文引用: 1]
The Hu Line for population distribution in China has been regarded as one of the greatest geographical discoveries in China because it reveals the significant spatial characteristics of China's human-land relationship. Thus, the stability and significance for spatial development of Hu Line have become a major concern after the dramatic economic and social changes since China's reform and opening-up in 1978. With the support of GIS, this paper conducts a statistical analysis and systematic investigation on the stability and spatial patterns of population growth on both sides of Hu Line by constructing the spatial database of China's census data from 1982 to 2010 and initiating a new method for identifying the spatial patterns of population growth. The findings are as follows: (1) The Hu Line has been rather stable, while a new tendency of population change has emerged. On the whole, the ratio of population on both sides of Hu Line has roughly been kept at 94:6 (the southeastern side: the northwestern side) in the last 30 years. However, the proportion of population on the southeastern side of Hu Line has been slightly decreasing, while that on the northwestern side of Hu Line has been slightly increasing, which is benefited from its higher rate of natural population growth. (2) The spatial patterns of population growth on both sides of Hu Line were quite different. The agglomeration degree of population distribution on the southeastern side of Hu Line increased greater. The areas with negative population growth rate have rapidly expanded, mainly located south of the Qinling Mountains - Huaihe River line and the northeastern China, while the areas with the fast population growth rate concentrated in the areas such as the Yangtze River Delta, the Pearl River Delta and Beijing-Tianjin metropolitan region. Thus, the spatial pattern of population growth on the southeastern side of Hu Line presented an aggregating and diffusion mode of Matthew effect. (3) The spatial pattern of population growth on the northwestern side of Hu Line could be referred as the relative balance type. In this region, the positive rate of population growth and the lower agglomeration degree of population have been identified. There were lots of ethnic groups located on the northwestern side of Hu Line, and they generally lived dispersedly but with a higher rate of natural population growth due to preferential population policy. However, there were also some areas with negative rate of population growth on the northwestern side of Hu Line and they were mainly distributed close to the Hu Line and new Eurasia Land Bridge. (4) In the future, the spatial patterns of population growth on both sides of Hu Line will continue to change. On the southeastern side of Hu Line, the capacity of population agglomeration for those small and medium-sized cities and towns should be enhanced. As for the northwestern side of Hu Line, the emphasis should be placed on promoting its urbanization and enhancing the capacity of population agglomeration for major cities.
“胡焕庸线”的稳定性及其两侧人口集疏模式差异
DOI:10.11821/dlxb201504004
[本文引用: 1]
“胡焕庸线”是反映中国人地关系的重要地理发现之一。在当今中国经济社会背景下,“胡焕庸线”所表达地理意义及其对城镇化发展的指导作用受到广泛关注。在GIS的支持下,构建了改革开放以来4次人口普查的县级空间数据库,提出人口时空扩张的识别方法,对“胡焕庸线”两侧的人口数量、集疏格局进行统计、分析,主要得出以下结论:① “胡焕庸线”两侧人口数量94:6的大数一直相对稳定,但东南半壁人口持续微减、西北半壁人口持续微增。得益于较高的自然增长率,西北半壁具有较高的人口增长速度。② “胡焕庸线”两侧呈现出迥然不同的人口集疏模式。东南半壁人口集中化程度提升较快,负增长区在“秦岭—淮河”以南、东北等地区大面积扩张、人口正增长优势逐步极化到长三角、珠三角、京津等少数地区,呈现“马太效应”式的集疏模式。主要是由于东南半壁内部区域经济差异及快速城镇化带来的剧烈人口流动。③ 西北半壁则呈现“相对均势”的人口集疏模式,多数地区的人口普遍表现为正增长,但是空间分布广袤、增长不集中,人口集中化程度提升缓慢。主要是由于少数民族“多分散、少聚居”造成了自然增长优势的不集中。然而均势是相对而不是绝对的,同样存在一定的负增长区,主要分布在“胡焕庸线”和“新欧亚大陆桥”两条带上。④ 未来时期,“胡焕庸线”两侧的人口分布及集疏格局将进一步演化,东南半壁应关注内陆腹地及中小城镇对人口的吸纳作用,西北半壁应关注将分散的人口增长优势向少数城镇进行集聚,以期为人口地理学研究以及城镇化发展提供参考。
The population distribution and trend of urbanization pattern on two sides of Hu Huanyong population line: A tentative response to Premier Li Keqiang
DOI:10.11821/dlxb201602001
[本文引用: 1]
In November, 2014, Premier Li Keqiang raised a problem about Hu Huanyong population line (hereinafter referred to as "Hu line"), when visiting the exhibition of sciences of human settlements in National Museum of China, which was called "Premier's Question" by the press. Hence, Hu line has become a highlight currently, and aroused great controversy and different views. Aiming at such dilemma of cognition, this paper gives a general review of the origins of Hu line, which was put forward by the famous population geographer Hu Huanyong in 1935, under the background of a debate on the surplus of domestic population. Based on population census data and GIS platform, the paper analyzes the change of population scale, proportion and density in both southeast and northwest sides of Hu line. The results indicate that the population urbanization and migration do not change the pattern of population distribution determined by Hu line. On such basis, the pattern that the population density of southeast part is large, while that of northwest part is relatively small will not radically change over a longer period, and the pattern that urban agglomeration is mainly located in southeast part as well. The long-term existence of Hu line depends on integrated physical geographical conditions, like climate. At the meantime, this paper argues that the core issue of the Premier's concern is solvable, by positive policy guidance and reasonable spatial organization. It is definitely promising for western China to realize a higher level of modernization and a better quality of urbanization, and central region as well.
胡焕庸线两侧的人口分布与城镇化格局趋势: 尝试回答李克强总理之问
DOI:10.11821/dlxb201602001
[本文引用: 1]
2014年11月底,李克强总理在国家博物馆参观人居科学研究展时,向社会和科学界提出了关于"胡焕庸线"的问题,很多媒体称之为"总理之问","胡焕庸线"也因此成为时下受到高度关注的一个热词,就此开展了热烈讨论并提出了截然不同的见解.针对这样的认识困境,本文首先梳理了胡焕庸线的由来,是由著名人口地理学家胡焕庸先生于1935年提出,提出的背景是当时对国内人口是否过剩的大讨论.基于"一普","五普"和"六普"等人口数据和ArcGIS平台,分析了胡焕庸线东南半壁和西北半壁的人口规模,比重和密度变化,数据显示人口城镇化和人口迁移并没有改变胡焕庸线确定的人口分布格局.据此提出胡焕庸线揭示的人口东密西疏格局在较长时期不会发生根本性变化,城市群主要位于胡焕庸线东南半壁的格局在较长时期也不会发生变化,胡焕庸线不可破的原因是由气候等综合自然地理条件决定的.同时,本文认为总理关心的核心问题是"有解"的,通过积极的政策引导和合理的空间组织,西部地区完全可以实现更高水平的现代化和更好质量的城镇化,中部亦然.
Spatial heterogeneity and its changes of population on the two sides of Hu Line
DOI:10.11821/dlxb201701012
[本文引用: 4]
Hu Line uncovers one of China's most important characteristics of population paper distribution: East is dense, while west is sparse. Different from most previous research, this paper examined the differentiation and changes of population distribution on both sides of Hu Line from a perspective of spatial stratified heterogeneity instead. Geodetector was employed based on the spatial database of China's census data of 1953, 1982, 1990, 2000 and 2010 to reconfirm spatial position of Hu Line and analyzed changes of spatial stratified heterogeneity of population between southeast and northwest sides of Hu Line in different periods. Changes of population distribution since the founding of New China were found and the reasons for these changes were discussed. Major findings include: (1) From the spatial stratified heterogeneity perspective, Hu Line could be improved and optimized, at least, in some periods. Although the ratio of total population on both sides of Hu Line has roughly been kept at 94:6 since 1953, spatial stratified heterogeneity of population between the two sides (the southeastern side: the northwestern side) increased when Hu Line moves to south slightly in 1953, 2000 and 2010, which means population distribution was more homogeneous within either southeastern or northwestern region and heterogeneity was more remarkable between the two regions. (2) Heterogeneity decreased gradually since the reform and opening up. We found characteristics of population distribution converged on the two sides, especially since the 1990s when convergence between the two sides became apparent. This finding is significantly different from the conclusion of "remain unchanged" from most literatures. The reasons why heterogeneity reduced were: pattern of population distribution on the southeastern side changed from relatively even distribution among cities before 1990 to agglomeration in a few huge cities after 2000, while the degree of spatial agglomeration of population decreased slightly after the reform on the northwestern side. These changes have been confirmed by the analysis from cumulative distribution function and Gini coefficient. (3) On the whole, the effect of economic factors on population distribution has become more and more important, while the effect of natural environment and institution reduced. Combined effect from economic development, natural environment and institution resulted in two opposite directions of changes of population spatial distribution on the two sides. It should be emphasized that although general effect of natural environment has decreased, some natural factors, such as Three Gradient Terrains, still have significantly influence on population distribution in China.
胡焕庸线两侧人口的空间分异性及其变化
DOI:10.11821/dlxb201701012
[本文引用: 4]
胡焕庸线作为人地关系的重要地理大发现之一,揭示了中国人口分布东密西疏的重要特征,是人文与经济地理学对社会的重要贡献之一。本文采用地理探测器等定量方法,以人口普查数据为基础,对胡焕庸线两侧人口分布的分异性特征进行了深入讨论,并尝试解释中国人口分布特征变化的原因及其机制。结果表明:① 胡焕庸线作为中国最重要的人口分界线仍基本保持稳定,但从空间统计学分异特征来看该分界线仍可进一步优化调整;② 胡焕庸线两侧内部人口集聚模式发生着明显变化,东南半壁人口分布由改革开放之前和初期的相对均衡状态,转变为以长三角、珠三角等少数区域为中心的集聚模式;而西北半壁人口分布的集聚程度则趋于下降;③ 从人口空间分布的影响因素看,尽管总体上,经济发展类因素对于人口空间分布影响不断增强,但三大阶梯等自然地理本底条件依然对中国人口分布有着重要影响。
A study of Heihe-Tengchong Line over 65 years' development
从六十五年发展看胡焕庸线
Conception of sub-line of Hu Huangyong population line and patterns of future population carrying in the Yangtze River Economic Belt
胡焕庸亚线构想与长江经济带人口承载格局
Regional differentiation of population in Tibetan Plateau: Insight from the "Hu Line"
DOI:10.11821/dlxb202002004
[本文引用: 1]
The Tibetan Plateau is regarded as a typically sparsely populated area both from Chinese and global perspectives. There exists a large difference in population distribution of the Tibetan Plateau. Based on the town-level census data in 2010, we compiled a spatial population database to calculate the population density of the Tibetan Plateau. We found that the population distribution on this plateau was characterized in four dimensions, namely longitude, latitude, polarization and altitude. In addition, similar to the "Hu Line" for Chinese population distribution, we introduce the "Qilian-Gyirong Line" (short for Qi-Ji Line), a spatial division line of population geography in the Tibetan Plateau. Our main results are summarized as follows. (1) There are significant regional differences in the spatial population distribution in the Tibetan Plateau. The population density in the southeast was higher than that in the northwest. Compared to longitude-oriented, latitude-oriented and altitude-oriented regional differences, the polarization-oriented regional difference of population distribution was more prominent. This finding indicates that fewer people live in areas close to the cold-arid core of the Tibetan Plateau. (2) The spatial population distribution is closely related to the natural and environmental factors, including altitude, soil, water resources, climate and vegetation. The interaction between the natural factors has an impact on enhancing the regional difference of population. (3) The "Qiji Line" reveals the spatial differences of population in the Tibetan Plateau. The areas on either side of the line are approximately similar, whereas the population shares in the southeast and northwest halves are 93% and 7%, respectively. (4) In general, the population differences on both sides of the "Qiji Line" were stable over time. During 1982-2010 the population share in the southeast half decreased counterbalanced by an increased share in the northeast half. In the future, the majority of the people are expected to live on the southeast side. This is likely to imply two major policy initiatives. More attention is required on the urbanization development and transportation network construction in the southeast half and the increasing eco-environmental pressures from the growing population in the northwest half.
青藏高原人口地域分异规律及“胡焕庸线”思想应用
DOI:10.11821/dlxb202002004
[本文引用: 1]
青藏高原是中国乃至全球典型的人口稀疏区之一,但内部人口地域分异明显。通过构建青藏高原乡镇街道尺度的人口空间数据集,系统核算青藏高原人口数量及其空间密度,从经度、纬度、极向和垂直4个维度解析青藏高原人口地域分异规律,并基于“胡焕庸线”思想,提出青藏高原的“祁吉线”人口地理划分方案。结论包括:① 青藏高原人口空间分布不均衡,具有“东南密、西北疏”的总体空间分布特征,距离“寒旱核心区”近疏远密的极向地域分异明显;② 青藏高原人口地域分异与海拔、土壤、水资源、气候、植被等自然环境本底具有高度耦合关系,自然因素间交互作用加强了人口地域分异;③ 青藏高原人口地域分异可以通过连接祁连县与吉隆县的“祁吉线”体现,两侧地域面积大致相同,但是东南半壁与西北半壁人口比例达到93∶7的悬殊;④ “祁吉线”长期稳定,但是东南半壁人口持续微降,西北半壁人口持续微增,未来时期,东南半壁依然是青藏高原城镇化及人类活动的主要区域,而西北半壁应当重视人口增长与生态环境压力的矛盾。
The construction of main functional areas and the interpretation of "Hu Huanyong Line"
主体功能区建设与“胡焕庸线”破解
"The Belt and Road Initiative" boosts cracking "Hu Huanyong Line"
“一带一路”助推破解“胡焕庸线”
Informationization, Employment growth and population mobility: Based on the analysis of the "Hu Line"
信息化、就业增长与人口流动: 基于“胡焕庸线”的分析
Urban construction lands and their carbon emission differences east and west of the Hu Huanyong Line
DOI:10.18402/resci.2019.07.07
[本文引用: 1]
The utilization and expansion of urban construction lands produce a large amount of carbon emissions. Revealing the differences of carbon emissions of urban construction lands on the east and west of the Hu Huanyong Line and finding the driving factors can provide important references for the coordinated development of East and West China, carbon emission reduction, and new urbanization. However, there is a lack of comparative research on the changes of urban construction land and carbon emissions in these two regions. With the help of night light remote sensing data and GIS technology, a new method of extracting urban construction land was proposed, and the urban construction lands east and west of the Hu Huanyong Line were extracted and analyzed. The carbon emissions from the urban construction lands were estimated and analyzed through applying the carbon emission estimation methods of relevant literature. Based on these results, the correlations between urban construction lands and carbon emissions were analyzed. Combining with socioeconomic data, the results were discussed in depth. This work indicates that: (1) The results of the boundary-threshold method were better than that of the empirical threshold method and the neighborhood analysis method. (2) The Hu Huanyong Line has the possibility to be broken. From 2000 to 2013, the ratio of the areas of urban construction lands between the east and the west lowered from 95:5 to 92:8. (3) The rapid development of the western regions is at the cost of high carbon emissions. The ratio of annual carbon emissions between the east and the west lowered from 93:7 to 90:10. (4) According to the average level, when the urban construction land in the east and west increased by 1 km2, annual carbon emissions of urban construction land increased by 17.94 thousand tons and 25.75 thousand tons, respectively. While continuing to pay attention to the eastern regions with a large amount of carbon emissions, China should also pay attention to the exacerbating problem of high carbon emissions in the western regions. Methods such as promoting intensive use of urban construction land, optimizing industrial structure, and advocating a green and low-carbon lifestyle can be taken to help the western regions to embark on a new road of intensive and low-carbon urbanization.
胡焕庸线两侧城镇建设用地变化及其碳排放差异
DOI:10.18402/resci.2019.07.07
[本文引用: 1]
城镇建设用地在利用和扩张过程中承载和拉动着大量的碳排放。揭示胡焕庸线东西两侧城镇建设用地的碳排放差异,并探讨其驱动因素,能为东西部的协调发展、碳减排工作和新型城镇化提供重要参考。本文借助夜间灯光遥感数据和GIS技术,提出了边界阈值法,对胡焕庸线东西两侧的城镇建设用地进行了提取和分析,并综合相关文献中的碳排放估算方法对其所承载的碳排放进行估算和分析,在此基础上,对其关联性进行了剖析,并结合相关社会经济数据对研究结果进行深入讨论。研究表明:①边界阈值法提取结果的检验结果较好,优于经验阈值法和邻域分析法。②胡焕庸线存在被打破的可能性,2000—2013年东、西两侧城镇建设用地的面积比从95:5变为92:8,差异缩小。③西部地区的快速发展是以高碳排放为代价的,2000—2013年东、西两侧年碳排放量比值从93:7变为90:10,差异缩小。④东、西两侧的城镇建设用地每增加1 km<sup>2</sup>时,年均碳排放量分别增长1.79万t和2.58万t。因此,国家在继续重视碳排放量较大的东部地区的同时,也应重视西部地区加剧的高碳排放问题。可通过引导城镇建设用地的集约式扩张、优化产业结构和提倡绿色低碳的生活方式等手段促使西部地区走上集约低碳的新型城镇化道路。
Academic debates on Hu Huanyong population line
DOI:10.11821/dlyj201605001
[本文引用: 1]
Hu Huanyong, a famous geographer, discovered a divide of population geography in China in 1935 (hereinafter referred to as the Hu Line), which was an important achievement in the development of the discipline of geography in China, and was widely accredited and cited. In November, 2014, Premier Li Keqiang raised a question about the Hu Line, when he visited the exhibition of sciences of human settlements in the National Museum of China. This question is whether the Hu Line can be broken or not again caused a stir. Hereby we invited some geographers to have academic discussion on this question, aiming to demonstrate their understanding and reflection on the Hu Line from different perspectives. Thus, the scientific value and practical significance of the Hu Line are deepened, and furthermore, the Hu Line can provide reference for the implementation and regional planning of the new-type urbanization in China.
关于“胡焕庸线能否突破”的学术争鸣
DOI:10.11821/dlyj201605001
[本文引用: 1]
著名地理学家胡焕庸先生于1935年提出中国人口地理的重要分界线(简称“胡焕庸线”),被广泛认可和引用,是中国地理学发展的重要成果。2014年底,李克强总理参观人居科学研究展时,高度关注胡焕庸线,并提出了胡焕庸线能否突破的问题。胡焕庸线因而再度引起争论和热议。据此,组织了一些地理学者围绕该问题进行学术讨论,力图从不同层面展现学者们对胡焕庸线的理解与反思,从而深化胡焕庸线的科学价值和现实意义,进而指导中国新型城镇化战略的实施和区域实践。
Can new urbanization break through the Hu Huanyong Line? Further discussion on the geographical connotations of the Hu Huanyong Line
DOI:10.11821/dlyj201605002
[本文引用: 1]
The Hu Huanyong Line, which is also called the Aihui-Tengchong Line, is drawn by Hu Huanyong and marks a striking difference in the distribution of China's population. It has been accepted and used for the last 81 years, and has had a considerable influence on Chinese population distribution research at home and abroad. With rapid new urbanization, research on the Hu Huanyong Line has increased sharply. In the context of new urbanization, an urgent question for us is how to understand the Hu Huanyong Line accurately. As a divide between the distribution patterns of the population in China, the Hu Huanyong Line has not changed substantially in the past 81 years. It represents a divide not only for the ecological environment, but also for climate. There are mainly prohibited development areas and restricted development areas in the Major Function Oriented Zones Planning west of the Hu Huanyong Line. It is not only the region east of the Hu Huanyong Line, but also includes some parts of the central and western regions of China. The formation of the line was the result of long-term interactions between the natural environment, economic development and social and historical conditions. Therefore, it would not be changed by what we think and do to break through. New urbanization emphasizes that the rural population migrates to the towns and cities nearby, rather than a large-scale transfer of population. Due to a local transfer of 100 million people in the central and western regions, new urbanization will accelerate the process of the population gathering in these regions. New urbanization has a significant impact on the population structure of different sizes of cities and towns, but little effect on the national spatial pattern. It is healthy urbanization in harmony with nature, therefore, rational thinking is required during the process of new urbanization, in order to optimize the spatial distribution pattern of urbanization. Pushed by the two-child policy issued recently, the population in the eastern and central China is predicted to increase with the western region increasing slowly due to the unbalanced population birth policy. With the implementation of the Belt and Road Initiative, urbanization in the western region will accelerate, opening up and expanding border cities, thus posing new challenges to the population distributed either side of the Hu Huanyong Line.
新型城镇化能否突破“胡焕庸线”: 兼论“胡焕庸线”的地理学内涵
DOI:10.11821/dlyj201605002
[本文引用: 1]
“胡焕庸线”提出80年来,在国际上产生深远影响。随着中国新型城镇化进程的全面推进,对胡焕庸线的研究急剧升温。在新的历史背景下,如何客观看待胡焕庸线成为亟待解决的一个问题。研究认为:胡焕庸线不仅是中国人口分布的分界线,也是重要的自然生态界线,这条界线的形成不以人的意志为转移,不宜人为去“打破”。同时,在新型城镇化背景下,应该树立理性思维,稳妥有序地推进城镇化进程,不断优化城镇化的空间分布格局。在全面放开二孩的新政策推动下,由于中国区域人口政策的差异性,东部和中部地区的人口有望实现较为明显的增长,西部地区增长相对缓慢,由此可能对胡焕庸线两侧的人口空间格局产生一定的影响。
A study on 70 years' change of China's population distribution: A spatial quantitative analysis based on Hu's Line
新中国70年来人口分布变迁研究: 基于“胡焕庸线”的空间定量分析
City administrative area and physical area in China: Spatial differences and integration strategies
DOI:10.11821/dlyj020180881
[本文引用: 2]
The definition of city is connected to administrative division system in China. It is important to understand the spatial difference between city administrative area and city physical area. According to the population census data in 2010, we distinguished city definitions in multiple administrative levels, including municipality cities, prefectural cities, cities with districts, cities without districts, cities with sub-districts and cities without sub-districts. In addition, we compared the spatial areas between city administrative cities and physical cities area and put forward some integration strategies. The main results are listed as follows. (1) Among various administrative cities, municipality cities and prefectural cities were larger. The following ones were cities with districts and cities without districts. The areas of cities with sub-districts and cities without sub-districts were relatively small. City physical area reflected the real landscape of a city, which was smaller than all kinds of city administrative areas. It only covered 0.32% of the whole area in the mainland of China but had 30.18% of Chinese population in 2010. (2) To classify city scale hierarchies, the population in city physical area was a better measure than the population in city administrative area. According to the population in the physical area, Shanghai is the largest city in China in 2010. (3) China's city physical area definition was also affected by city administrative definition. We suggested China's city administrative division adjustment should concerns more on county-to-city conversion and new prefectural-city establishment. It is better to regard the population city physical area as a reference index for administrative division adjustment. For the definition of the city physical area, independent municipal district, county seat and large towns were suggested as the independent city physical area. Besides, we recommended to open the statistical data related to city physical area. We do hope our research can be beneficial for policy implications for China's administrative adjustment and city physical area studies.
中国城市行政地域与实体地域的空间差异及优化整合
DOI:10.11821/dlyj020180881
[本文引用: 2]
中国的城市界定与行政区划紧密关联。根据2010年人口普查数据,系统分析不同尺度城市行政地域与城市实体地域的界定及其空间差异。主要结论:① 按照直辖市或地级市、设区的市和不设区的市、设街道的市和不设街道的市的层级,城市行政地域范围依次收缩,但是都大于城市实体地域范围。按照实体地域界定,2010年中国城市人口仅占30.18%。② 城市实体地域更能客观地反映城市位序规模的分布状态,而按照城市行政地域会导致规模或排序偏差。③ 未来在行政区划调整时,着重考虑撤县设市、增设地级市、确立乡级行政区划调整标准等,在建立城市实体地域时,可从独立市辖区、县城、特大镇等方面优化,并加强统计信息公开。
Geodetector: Principle and prospective
DOI:10.11821/dlxb201701010
[本文引用: 1]
Spatial stratified heterogeneity is the spatial expression of natural and socio-economic process, which is an important approach for human to recognize nature since Aristotle. Geodetector is a new statistical method to detect spatial stratified heterogeneity and reveal the driving factors behind it. This method with no linear hypothesis has elegant form and definite physical meaning. Here is the basic idea behind Geodetector: assuming that the study area is divided into several subareas. The study area is characterized by spatial stratified heterogeneity if the sum of the variance of subareas is less than the regional total variance; and if the spatial distribution of the two variables tends to be consistent, there is statistical correlation between them. Q-statistic in Geodetector has already been applied in many fields of natural and social sciences which can be used to measure spatial stratified heterogeneity, detect explanatory factors and analyze the interactive relationship between variables. In this paper, the authors will illustrate the principle of Geodetector and summarize the characteristics and applications in order to facilitate the using of Geodetector and help readers to recognize, mine and utilize spatial stratified heterogeneity.
地理探测器: 原理与展望
DOI:10.11821/dlxb201701010
[本文引用: 1]
空间分异是自然和社会经济过程的空间表现,也是自亚里士多德以来人类认识自然的重要途径。地理探测器是探测空间分异性,以及揭示其背后驱动因子的一种新的统计学方法,此方法无线性假设,具有优雅的形式和明确的物理含义。基本思想是:假设研究区分为若干子区域,如果子区域的方差之和小于区域总方差,则存在空间分异性;如果两变量的空间分布趋于一致,则两者存在统计关联性。地理探测器q统计量,可用以度量空间分异性、探测解释因子、分析变量之间交互关系,已经在自然和社会科学多领域应用。本文阐述地理探测器的原理,并对其特点及应用进行了归纳总结,以利于读者方便灵活地使用地理探测器来认识、挖掘和利用空间分异性。
Research on the spatial pattern & formation mechanisms of population agglomeration & shrinking in China
中国人口集疏格局与形成机制研究
An index system for boundaries of eco-geographical regions of China
DOI:10.11820/dlkxjz.2002.04.002
[本文引用: 1]
Boundary of eco geographical regions is based on a set of index that indicates the regional features. It is located on special location by spatial differences in environmental features. Impersonally recognizing and delineating the boundary is an important way to open out spatial order of the environment. This boundary is a line or belt as border for two joined regions with different features. It shows relative coherence in environmental features within a region and otherness to the other region. The boundary is a belt with wideness that can be changed as course of time. Higher-class regions have wider boundary and lower class regions have clearer boundary. In delineation of eco geographical regions, several factors that can hardly be controlled by human are selected as main indexes. Days and cumulated temperature of daily temperature ≥10℃, average temperatures of the coldest and hottest months are used as indexes of temperature state. Dryness is the most common factor as token of dry humid degree of a region. Annual precipitation is more reliable but calculation of latency evaporation should be improved. Division of higher class of eco geographical regions focuses on biological and climatic differences, first of all on horizontal zonality. Because of limitation of number of climatic stations, the boundary is always modified with vegetation. Vertical zonation links latency vegetation with climate, which is divided according to precipitation, potential evaporation and bio temperature relationship. How to deal with relation between classes and indexes of eco geographical regions is another important point. Some studies tried to combine indexes of natural factors with social economic factors. Some considered the index system should cover environmental, resources, economic, social and population factors. Some proposed taking temperature, water moisture factors for the higher classes and introducing resources and social-economic factors for the lower classes. However, the former has not given detailed index and the latter took different indexes for different regions, which should have more work to realize the combination.
生态地理区域界线划分的指标体系
Western population patterns in the west of Hu's line
“胡焕庸线”以西的西部人口格局
Distribution and change of the ethnic minority population in China: A "Hu Line" perspective
The “Hu Line”and its demographic implications have attracted world-wide attention since the line was developed 80 years ago.Using GIS,this paper conducts a statistical analysis and systematic investigation on the stability and spatial patterns of China’s minority population growth on both sides of“Hu Line”by constructing the spatial database of China’s census data from 1953 to 2010 and initiating a new method for identifying the spatial patterns of population growth.Major findings are as follows: ( 1) Spatial distribution of the minority population in China is not balanced,showing a signifi- cant spatial clustering; ( 2) The minority population is widely distributed across China,spreading to East China and all over the country; ( 3) The distribution pattern of China’s minority population is characterized by extraordinary stability,with the share ratio of south-east half to north-west half standing roughly at 75: 25 from 1953 to 2010.We can thus say that the“Hu Line”is also a mutant line of China’s minority population.
基于“胡焕庸线”的中国少数民族人口分布及其变动
"胡焕庸线"作为中国人口的突变线,从1935年提出至今的80余年里,在国内外引起广泛的关注和深刻的思考。文章从民族人口的视角出发,收集和整理1953~2010年期间六次全国人口普查的县级资料,运用Arc GIS、Geo Data的空间分析技术,对"胡焕庸线"两侧的民族人口分布状况、变动趋势进行统计和分析。结果表明:中国少数民族人口空间分布不均衡,具有显著的空间集聚性,少数民族人口在传统分布区形成多个热点分布区域;中国少数民族人口分布广泛,民族人口向东部地区乃至全国范围迁移扩散的态势显著;中国少数民族人口分布格局具有非凡的稳定性。从1953~2010年东南半壁和西北半壁少数民族人口75∶25的比重一直相对稳定,可以说"胡焕庸线"也是中国少数民族人口的突变线。
Spatio-temporal evolution of migration in China from 1995 to 2015
DOI:10.11821/dlxb202202010
[本文引用: 1]
Based on the data of usual residence from 2000 and 2010 censuses and 1995 and 2015 micro-censuses and using the method proposed by Abel G. J., this paper estimates the O-D migration flows among prefectural-level administrative units in China for the period 1995-2015. By using the indicators of migration flows and migration rates, and the methods of GIS spatial analysis and community detection in social network analysis, it further reveals the characteristics of spatio-temporal evolution of migration in China since 1995. The results can be summarized as follows. (1) The scale and intensity of migration in China have been increasing, while their differences among regions have been gradually decreasing. This suggests that migration has experienced a gradual transformation from a "low-activity era" including a limited number of regions to a "high-activity era" involving the majority of regions. (2) Six regional types of migration among prefectural-level administrative units, namely, large-scale active net in-migration, small-scale net in-migration, large-scale active net out-migration, small-scale active net out-migration, active balanced migration and inactive migration, are identified. The spatio-temporal evolution characteristics of the regional types of migration in China indicate that each active migration regional type has been undergoing a change of continuous diffusion, while the inactive migration regional type has seen a significant reduction over time. (3) The spatial patterns of migration are quite different between regions on both sides of "Hu Line", manifested in the fact that the scale and intensity of migration flows on the southeastern side of the line is higher than that on the northwestern side, which means that the "Hu Line" is quite stable and robust in the last 20 years. (4) Patterns of migration flows indicate that while intra-provincial migration has continuously strengthened, inter-provincial migration has exhibited more complicated spatial patterns, mainly reflected in different changing trends of attractiveness to migrants among the three coastal city clusters, and the increasing migration flows within southwest China. As a result of combined effects of inter- and intra-provincial migration flows, the structure of migration flows in China's eastern, central and western regions has been undergoing changes, resulting in the internal differentiation of urban agglomerations and the declining spatial scope under their influence in the coastal areas, Hubei as the single independent "city community" in central China, as well as the relative stability in northwest China and continuous change in southwest China.
1995—2015年中国人口迁移的时空变化特征
DOI:10.11821/dlxb202202010
[本文引用: 1]
本文利用人口普查数据,估算了1995—2015年中国地(市)间人口O-D迁移流和迁移率,结合GIS空间分析和社会网络分析方法,揭示了20年间中国人口迁移的时空变化特征。研究发现:① 中国人口迁移由相对不活跃、局部地区参与的“低活性时代”,逐步走向相对活跃、绝大多数地区参与的“高活性时代”。② 人口迁移地域类型的时空演化过程呈现出各活跃型地(市)不断扩散,而非活跃型地(市)大幅缩减的特点。③ 人口迁移网络以“胡焕庸线”为界,东、西两侧迁移流“东密西疏”且差异悬殊,这一空间格局具有很强的稳定性和顽健性。④ 在人口省内迁移持续增强,以及跨省迁移中沿海三大城市群吸引力的“此消彼长”和西南地区吸引力不断增强的背景下,东中西部地区的人口迁移流场结构表现为:沿海地区主要城市群内部分化和影响范围减弱,中部地区(除湖北省)未能演化出以省为单元的独立社区,西部地区则是西北相对稳定而西南持续变动。
China's changing population distribution and influencing factors: Insights from the 2020 census data
DOI:10.11821/dlxb202202008
[本文引用: 1]
Using data of the latest three decennial censuses, this paper systematically analyzes the overall spatial pattern, changing trends, and influence mechanisms of China's population distribution since 2000. The study reveals that the general population distribution pattern of "dense east and sparse west" in China has not changed, which is determined by the differences in natural geographic environments on the two sides of Hu Line. In the first decade of the century, population concentration was mainly found in the southeastern area, but it has been observed in all regions in the recent decade. Provincial capitals have become the winners of population competition and the advantages of population growth of provincial capitals have been further strengthened in the recent decade compared with 2000-2010. However, the administrative power-led effects of the increasing dominance of provincial capitals will gradually weaken with the development of their provinces. The regional differentiation of population changes is also apparent: coastal region gradually forms a dense belt of population and towns with solid population attraction based on the development of urban agglomerations; the northeast region almost turns to a complete population shrinking status; central provinces still compete fiercely for population based on their capitals; the population of Sichuan, Chongqing, and Guizhou has stopped the decline and returned to growth; and the northwest region faces the risk of population loss. In addition, this paper finds that the driving factors of regional population growth have gradually changed from economic factors to both economic and amenity factors, and the difference of amenities among regions may become an important factor for future changes in China's population geography.
2000—2020年中国人口分布格局演变及影响因素
DOI:10.11821/dlxb202202008
[本文引用: 1]
基于第五、六、七次全国人口普查数据,本文分析了2000—2020年中国人口分布的空间格局、集散态势和影响因素。结果表明,中国人口分布依然保持东密西疏的基本格局,胡焕庸线两侧的自然地理环境差异性决定了这一格局的长期稳定性;人口空间集中化趋势在21世纪初的10年内主要发生在东南半壁,但在2010—2020年间成为各区域的共同特征。省会城市的人口集聚能力持续增强,2010—2020年的优势更加凸显,但这种行政力量主导的首位度提升效应将随着全省发展阶段的演进而逐渐弱化。人口变动的区域分化明显:沿海城市群的空间连绵化逐渐形成了强吸引力、高承载力的沿海人口增长带,东北地区几乎转向全面的人口收缩,中部各省依托省会展开的人口竞争依然激烈,川渝黔地区普遍实现了人口的止降回增,西北地区则面临人口收缩风险。此外,区域人口增长的驱动因素逐渐从经济要素主导转为经济要素和舒适性要素并重,各地区舒适性的差异可能将成为影响未来人口空间格局变化的重要因素。
