

1 引言
随着经济全球化进程加快和交通通讯技术进步,各地联系日趋紧密,跨国移民群体日益庞大。联合国移民署在《世界移民报告2020》中指出,2019年全球跨国移民已达2.72亿人,占全球人口的3.5%,与1995年的1.74亿人相比增长56.3%[1]。大规模跨国人口迁移对迁出和迁入地的经济、政治、社会和文化生活影响深远,成为改变世界政治经济地理图景的一股不可忽视的力量。亚洲自古以来就是跨国人口迁移最为活跃的地区,21世纪后更是成为跨国移民增长最显著的区域。2019年亚洲约吸引、输出8400万和1.12亿国际移民,分别约占世界国际移民总数的31%和40%[1]。既有的国际人口迁移研究大多关注亚洲发展中国家流向西方发达国家的移民和移民回流,或西方发达国家与亚洲发展中国家间的循环迁移,较少关注亚洲内部跨国人口迁移现象[2⇓-4]。然而,习近平总书记曾在2015年提出“一带一路”倡议和“亚洲命运共同体”概念,都强调了亚洲内部互联互通对中国坚持对外开放的重要意义。因此,掌握亚洲内部跨国人口迁移时空演变规律和驱动因素,一方面能够拓展既有的以新古典主义理论为代表的自由主义跨国人口迁移理论,对亚洲各国/地区制定国际移民政策有一定指导意义;另一方面也对中国在新发展阶段制定针对性跨国移民政策,推进“一带一路”倡议并贯彻落实“国内国际双循环”新发展格局具有重大理论和实践意义。
当前,社会网络分析方法(Social Network Analysis)被逐步运用到人口迁移的研究中,如分析留学生流动网络[5-6]、中国省际人口迁移网络[7-8]、城际人口流动网络[9-10]和节假日人口流动网络[11⇓-13]的时空格局演变特征。相较于传统人口迁移描述性统计方法,社会网络分析揭示人口迁移网络的复杂性特征和拓扑结构,可以对层次结构和网络集聚情况进行更客观准确地测度。引力模型(Gravity Model)是解释人口迁移影响因素最常用的模型之一,在中国跨区域人口迁移动力机制研究中得到广泛运用[14⇓⇓-17]。经典引力模型仅包含3个变量:迁出地人口规模、迁入地人口规模和两地间距离。该模型认为人口迁移规模与迁出和迁入地的人口规模成正比,与两地间距离成反比[18]。后续研究中,一部分学者在引力模型框架下,补充迁出和迁入地的解释变量,如工资水平、失业率水平和地区舒适度等来提高模型解释力[14,17,19];另一部分学者使用泊松模型、负二项模型和零膨胀模型[20-21]等改进引力模型设定,减小模型误差,提高模型解释力。
上述模型均基于每一条迁移流间相互独立的基本假设,但这一假设与现实情况不符。由于相邻迁入地间存在更直接的劳动力竞争(“竞争迁入地模型”),来自相邻迁出地的移民的空间选择机会也更相似(“干预机会模型”),迁移流之间往往存在网络自相关问题[22⇓⇓-25]。此外,国家/地区间语言和文化背景相似性、跨国社交网络以及贸易溢出等因素也是造成迁移流之间出现网络自相关的原因[26⇓-28]。为解决这一问题,有学者把特征向量空间滤波器(Eigenvector Spatial Filtering, ESF)纳入引力模型分析框架,以减少模型残差项中的空间自相关性,有效提高模型拟合度[24-25]。同时,由于“距离”相关变量也在一定程度上体现了“相邻”的自相关效应,加入空间滤波能够缓解这一变量的估计偏差[17]。近年来国内学者已开始运用该方法识别中国跨区域人口迁移的驱动因素[14,17,29 -30]。
西方学者已对跨国人口迁移特征及驱动因素开展了大量研究,提出一系列经典理论[31]。新古典理论指出,国际人口迁移在宏观上反映了来源地和目的地预期收入差异,在微观上反映了移民自身人力资本投资最大化的理性选择[32⇓-34]。该理论认为,劳动力从经济发展水平较差的国家/地区迁往经济水平较高的国家/地区,而这一过程反过来会对来源地缩小与目的地的工资和收入差距产生积极作用。依附理论却认为,发展中国家与发达国家间的人口流动是由两国/地区间贸易、投资不平等所导致的,且人口迁移会加剧这种结构失衡[35]。新移民经济学把家庭纳入迁移决策分析框架中,认为风险规避和预期收入最大化是发展中国家人口外流的主要动因[36]。与上述自由主义理论相比,二元劳动力市场分割理论和世界体系理论等结构主义理论关注一个国家/地区乃至全球的政治经济体系对跨国人口迁移的驱动作用[37-38]。部分研究也表明,两国/地区冲突或一国/地区内战会使得大量难民以及流离失所者被迫迁出,国际难民是世界跨国人口迁移的一种重要形式[39-40]。两国/地区文化相近、语言相同会降低移民迁入目的地后的融入障碍,进而推动人口流动[41-42]。
然而,大部分已有研究仅基于某个迁入或迁出地的问卷调查数据和访谈资料,对亚洲内部长时期跨国人口迁移格局与驱动因素关注较少[43⇓-45]。尽管少量研究基于多个国家/地区的官方统计数据,运用数据可视化和社会网络分析等方法,开展全球多个国家/地区的人口迁移格局分析[46⇓-48],但多采用描述性统计方法解释迁移动因,不仅无法量化迁入和迁出地的经济社会文化和政治因素对迁移流量的影响强度,也忽视了迁移流间的空间依赖性。因此,本文基于亚洲50个国家/地区的双边移民流量数据,运用社会网络分析方法,刻画1990—2015年亚洲跨国/地区人口迁移流的空间格局及演变特征,运用特征向量空间滤波面板负二项引力模型,识别亚洲跨国/地区人口迁移的驱动因素。本文不仅为清晰认识亚洲跨国/地区人口迁移流的空间格局提供了结构主义新视角,还为亚洲各国/地区科学制定国际移民政策提供了决策参考,有利于“一带一路”倡议推广和“包容性全球化”模式实施。
2 数据来源与研究方法
2.1 数据来源
研究数据为上海大学亚洲人口研究中心Guy Abel教授团队提供的1990—2015年全球200个国家/地区间的双边移民流量数据集(Bilateral International Migration Flow Estimates)[48]。该数据集基于联合国人口司迁移存量表,通过存量差异、迁移率、人口统计学等6种方法估算而得[31],实现迁移数据从存量向流量的转化,创造了从流空间视角分析迁入地和迁出地关系的可能。本文采用基于封闭系统的人口统计方法估算得到的数据,并选取其中50个亚洲国家/地区(①本文中东南亚包括:文莱、东帝汶、马来西亚、新加坡、印度尼西亚、菲律宾、越南、老挝、泰国、缅甸、柬埔寨;东亚包括:中国内地、中国香港、中国澳门、朝鲜、韩国、蒙古、日本;南亚包括:巴基斯坦、不丹、马尔代夫、孟加拉国、尼泊尔、斯里兰卡、印度;西亚包括:阿富汗、阿联酋、阿曼、阿塞拜疆、巴勒斯坦、巴林、格鲁吉亚、卡塔尔、科威特、黎巴嫩、塞浦路斯、沙特阿拉伯、土耳其、叙利亚、亚美尼亚、也门、伊拉克、伊朗、以色列、约旦;中亚包括:土库曼斯坦、乌兹别克斯坦、哈萨克斯坦、塔吉克斯坦、吉尔吉斯斯坦。)间在5个时间段(1990—1995年、1995—2000年、2000—2005年、2005—2010年和2010—2015年)的国际迁移流量数据,共计(50×50-50)×5 = 12250条跨国迁移流。其余研究数据来源参见脚注②(②世界银行公开数据(World Bank Open Data):
2.2 社会网络分析方法
2.2.1 网络密度(Graph Density, D)
网络密度是衡量网络联系紧密程度的重要指标。其数值越大,表明亚洲各国/地区间的联系越紧密,人员流动越频繁。本文的人口迁移网络为国家/地区(节点)数量为n的有向网络,密度计算公式为:
式中:l为网络中实际存在的迁移流数量;n(n-1)为网络中两两节点间可能存在的最大理论边数量。
2.2.2 加权度中心度(Weighted Degree Centrality, WD)和加权度中心势(Weighted Degree Centralization, WC)
社会网络分析方法通过“中心度”和“中心势”指标分别量化个体与整体在网络中的地位。在本文中,国家/地区(节点)i的加权入度中心度和加权出度中心度分别表示迁入i国/地区的全部移民数量总和和i国/地区的迁出的全部移民数量总和。若某节点加权度中心度越高,则该节点在网络中的地位越高。计算公式为:
式中:
度中心势刻画了网络整体向某点集中趋势的程度。其数值越大,表明跨国/地区人口迁移流的集聚程度越高,受重要节点影响的程度越高。加权入度中心势和加权出度中心势的计算方法分别如下:
式中:
2.3 特征向量空间滤波(ESF)面板负二项模型
由于跨国/地区迁移人数为非负整数,且同一年份不同国家/地区间迁移规模也相差甚远,存在过度离散问题,所用迁移流量数据为5个时期的面板数据,因此本文运用面板负二项回归模型来识别两国/地区间迁移规模的影响因素[49]。此外,为缓解跨国/地区人口迁移的网络自相关性,将特征向量空间滤波(ESF)纳入面板负二项模型。具体而言,ESF从人口迁移网络结构(即网络权重矩阵)中提取表达空间结构的特征向量,并把基于一定标准筛选出的特征向量作为控制变量加入面板负二项模型,以过滤残差的网络自相关性,提升模型估计能力,降低内生性。ESF负二项面板模型的设定和操作步骤如下:① 构造反映亚洲各国/地区间相邻关系的
假设t时期i国/地区和j国/地区间的迁移流量yijt服从条件均值为μijt的Gamma分布,则加入ESF的面板负二项引力模型的公式为:
式中:Xoi、Xdj分别为迁出地和迁入地的解释变量;Ei、Ej分别为迁出地和迁入地的候选特征向量;Q、P分别为从Ei和Ej中迭代筛选出的特征向量;g为i、j两国/地区间的距离;α为截距;βo、βd、βg分别为迁出地、迁入地各解释变量以及两国/地区间距离的相关系数;φq、φp分别为迁出地和迁入地筛选出的特征向量的相关系数。
2.4 选取模型指标
参考已有研究,本文将经济差异因素、政治稳定性因素、多维邻近性因素和引力因素纳入模型(表1)[15,17,50]。其中,经济差异因素包括来源地和目的地的人均GDP水平、GDP增长率和通货膨胀率3组指标。本文选用人均GDP水平测度一个国家/地区当前经济发展水平,用GDP增长率测度未来经济发展预期,用通货膨胀率控制通货膨胀所导致的生活成本的上升。由于经济差异因素对人口迁移的影响具有滞后效应,本文取相关变量的5年期平均值。鉴于1990—2015年间,部分亚洲国家/地区因政局动荡和战乱冲突向其他国家/地区输出了大量国际难民,在战乱冲突结束后又有大批难民回流,本文控制了来源地和目的地的政治稳定和非暴力程度、战乱冲突死亡人数两组政治稳定性指标[51]。
表1 变量描述、数据来源和预期作用
Tab. 1
| 指标 类型 | 指标名称 | 描述 | 变量简称 | 预期作用 | ||
|---|---|---|---|---|---|---|
| 迁出地 | 迁入地 | |||||
| 经济 差异性 | 迁出地/迁入地人均GDP(美元/人)a | 各国/地区人均GDP均值(对数) | O_preGDP D_preGDP | - | + | |
| 迁出地/迁入地GDP增长率(%)a | 各国/地区GDP增长率均值 | O_GDPgrow D_GDPgrow | - | + | ||
| 迁入地/迁出地通货膨胀率(%)a | 各国/地区通货膨胀率均值 | O_Inf, D_Inf | + | - | ||
| 政治 稳定性 | 迁入地/迁出地政治稳定和非暴力指标a | 包括恐怖主义在内的政治不稳定和 出于政治动机的暴力的可能性(对数) | O_PoliStab D_PoliStab | - | + | |
| 迁入地/迁出地战乱冲突死亡人数(人)b | 发生战乱冲突所在地的死亡人数滞后2年的均值(对数) | O_War D_War | + | - | ||
| 多维 邻近性 | 经济邻近性 | 商品进出口贸易矩阵c | i国/地区从/向j国/地区进/出口贸易总额之和(千美元)(对数) | Trade | + | |
| 文化邻近性 | 宗教虚拟变量矩阵d | 主要宗教相同则为1,否则为0 | Religion | + | ||
| 语言虚拟变量矩阵e | 官方语言相同则为1,否则为0 | Language | + | |||
| 组织邻近性 | 国际组织虚拟变量矩阵d | 同属某一国际组织则为1,否则为0 | Union | + | ||
| 社会邻近性 | 流动链指数 | 每个国家/地区迁往其他目的地国家/地区的人数比例(i国迁往j国的人数/i国迁出总人数) | MSTOCK | + | ||
| 引力 因素 | 迁出地、迁入地人口总数(人)a | 各国/地区总人口数(对数) | O_POP D_POP | + | + | |
| 留学吸引力 | 目的地国/地区高校在校生数均值(对数)e | D_Student | + | |||
| 两地间距离矩阵(km)f | 两国/地区首都间的直线距离(对数) | Dist | - | |||
注:“+”表示正向作用,“-”表示负向作用;数据来源:a.世界银行数据库;b.UCDP数据库;c.联合国贸易与发展会议;d.百度百科;e.联合国教科文组织;f.法国前景研究与国际中心数据库。
多维邻近性包括经济邻近、文化邻近、组织邻近和社会邻近。① 考虑到两国/地区间经贸合作与交流会促进人口流动,本文使用来源地向/从目的地出口/进口的贸易额总和表征两地经济邻近程度。② 来源地与潜在目的地若拥有相同的语言、文化和宗教习俗,不仅有助于移民融入目的地的主流社会,也有助于他们获取就业、住房和生活信息,降低迁移和定居的不确定性与风险。本文构建宗教和语言虚拟变量,若两个国家/地区的主要宗教相同,则宗教虚拟变量赋值为1,否则为0;若官方语言相同,则语言虚拟变量赋值为1,否则为0。③ 两国/地区间的关税壁垒和边境控制阻碍了人员、物质、资金和信息的流动。同属一个国际合作组织的两个国家/地区在经济、文化和政治事务的往来更频繁,人员流动所受到的限制可能更少,迁移动机更强。本文构建国际组织虚拟变量,若同属一个国际组织④(④本文选取的国际组织包括亚太经济合作组织、阿拉伯国家联盟、南亚区域合作联盟、东南亚国家联盟和上海合作组织。),则该变量赋值为1,否则为0。④ 以家庭团聚和投靠亲友为迁移动机的链式迁移是跨国人口迁移的重要类型之一。已抵达目的地的国际移民对留在母国/地区亲友的迁移决策起到关键作用,降低后者的迁移成本和风险。因此,本文使用流动链指数表征社会邻近程度[17,52]。
模型进一步控制了3组引力因素:来源地和目的地人口总量、目的地留学吸引力和两国/地区首都间距离。鉴于留学生是跨国移民的重要组成部分,本文用目的地高校在校生数测度其对留学生的吸引力[5]。考虑到数据可获得性以及可比性,本文选取两国/地区首都间的直线距离来代表空间距离,以表征经典引力模型影响因素。在进行模型分析之前,对于少数指标在部分年份存在缺失值的情况,使用线性插值法补全。模型的所有变量就多重共线性进行检验。检验结果表明,所有变量的方差膨胀因子(VIF)均在5以下,模型不存在严重的多重共线性问题。
3 亚洲内部跨国/地区人口迁移时空格局及其演变特征
3.1 亚洲内部跨国/地区人口迁移网络演化特征
本文通过UCINET软件计算1990—2015年5个时期的迁移联系数量、网络密度和度数中心势指标,从整体上揭示亚洲跨国/地区人口迁移网络演化特征(表2)。5个时期中,亚洲内部各国/地区间迁移联系数量在875条到1004条之间,1995—2000年最高,2010—2015年最低,这一趋势可能与南亚—中东间的劳工迁移规模在2010—2015年间有所下降有关。与之相似,网络密度先升后降,1995—2000年达到最大值(0.410)。可见,部分亚洲国家/地区间没有人口流动,国家/地区间联系的紧密程度在1995—2000年达到最大值,在21世纪有所回落。迁移网络的出度中心势从1990—1995年的1.885%上升到2010—2015年的4.048%,表明人口迁出地呈现越来越集中在少数几个人口迁出大国/地区的趋势。入度中心势在1995—2000年下降到最低水平(1.856%)后快速上升,2005—2010年达到最大值(4.557%),2010—2015年迅速回落到1.952%,说明人口迁入地存在先分散、后集聚、再分散的趋势。整体上,亚洲跨国人口迁移网络较为分散,各国/地区联系紧密程度先升后降,25年间跨国移民的来源地越来越集中,目的地在2010年前呈多元化,2010年后集聚性增强。
表2 1990—2015年亚洲跨国/地区人口迁移网络统计量
Tab. 2
| 1990—1995年 | 1995—2000年 | 2000—2005年 | 2005—2010年 | 2010—2015年 | |
|---|---|---|---|---|---|
| 迁移联系数(条) | 917 | 1004 | 953 | 923 | 875 |
| 网络密度 | 0.374 | 0.410 | 0.389 | 0.376 | 0.357 |
| 出度中心势(%) | 1.885 | 2.107 | 3.489 | 3.890 | 4.048 |
| 入度中心势(%) | 3.033 | 1.856 | 2.844 | 4.557 | 1.952 |
3.2 亚洲跨国/地区人口迁移流的时空格局及演化特征
进一步分析1990—2015年间亚洲跨国/地区人口迁移网络时空格局及演变特征(图1)。整体上,1990—2015年间亚洲跨国/地区人口迁移可划分为21世纪前与21世纪后两个阶段。1990—2000年间亚洲跨国/地区人口迁移规模普遍较小,且主要集中在西亚、南亚和东南亚各区域内部,大多发生在邻国/地区之间。这一阶段,阿富汗及其邻国/地区(巴基斯坦和伊朗)是最主要的迁移流场之一。1990—1995年,由苏联发起的长达10年的阿富汗战争刚刚结束,阿富汗政局较为稳定,流亡周边国家/地区的难民陆续返乡,巴基斯坦—阿富汗(196.7万人)和伊朗—阿富汗(103.1万人)成为该时期最大的跨国迁移流。1995—2000年,随着阿富汗硝烟再起和塔利班夺取全国政权,大量阿富汗人逃难到邻国,阿富汗—巴基斯坦(70.4万人)成为该时期最大迁移流。此外,印度及其邻国/地区(如巴基斯坦、孟加拉国和尼泊尔)也是主要的迁移流场之一。1990—1995年,印巴冲突导致大量在印度居留的巴基斯坦移民逃回本国,印度—巴基斯坦(72.3万人)成为该时期第三大跨国迁移流。同时,由于印度有更大经济体量和更多就业机会,这一时期,印度也从孟加拉国和尼泊尔吸引了大量劳动力。除上述两个主要迁移流场外,中南半岛四国(缅甸、泰国、柬埔寨和老挝)也形成迁移流场。从缅甸迁移到泰国的移民数量,由1990—1995年的16.1万上升到1995—2000年的48.8万人。最后,东南亚、南亚和西亚之间的“人口迁移通道”初具雏形,主要迁移流包括印度—阿联酋和沙特阿拉伯—印度尼西亚等,传统石油工业国对外籍廉价劳动力的需求与新兴工业化国家的经济腾飞是这一区域人口流动的主要驱动力。东亚和地中海沿岸地区没有发生大规模人口迁移,最大迁移流是中国内地—中国香港(10年间37.2万人发生了迁移)。
图1
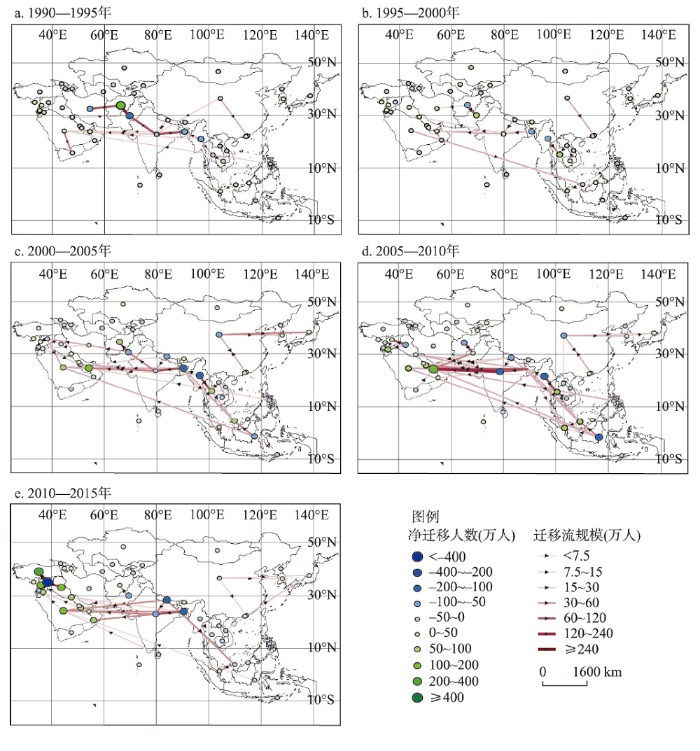
图1
1990—2015年亚洲内部跨国/地区年人口迁移流的空间格局
注:基于自然资源部标准地图服务网站审图号为GS(2016)1666号的标准地图制作,底图边界无修改。
Fig. 1
Spatial pattern of international migration flows between all pairs of Asian countries, 1990-2015
2000—2015年亚洲跨国/地区人口迁移规模逐渐增加,在西亚、南亚和东南亚三大区域间出现多条大规模长距离的人口迁移流。① 阿富汗和巴基斯坦间仍存在大规模移民潮,2000—2005年为亚洲最大跨国迁移流(69.4万人),2005—2010年为第三大跨国迁移流(85.3万人)。② 印度与巴基斯坦和孟加拉国组成的迁移流场仍然存在。孟加拉国—印度一直是规模最大的5条迁移流之一(3个时期分别有60.6万人、102.0万人和63.2万人)。③ 新加坡和泰国等东南亚新兴工业化国家从周边国家/地区吸引了大量劳工。例如,2000—2010年间缅甸向泰国输送了132.9万移民。④ 随着海湾国家经济多元化战略实施和大规模基础设施兴建,大量劳动力从南亚和东南亚(如印度、孟加拉国和印度尼西亚)流向中东(如阿联酋、沙特阿拉伯和卡塔尔)。例如,2000—2010年间印度向阿联酋输送了185.5万移民。⑤ 东亚内部(中国、日本和韩国)的人口迁移规模有所增加,各地间联系日趋紧密。⑥ 从2011年持续至今的叙利亚内战产生大规模难民潮,形成由叙利亚及其邻国/地区组成的辐散迁移流场。2010—2015年叙利亚成为了亚洲最大的人口输出国,向土耳其、黎巴嫩和伊拉克分别输送了254.6万、115.4万和96.6万移民。
4 亚洲内部跨国/地区人口迁移的影响因素
4.1 选取模型
本文构建面板负二项模型和ESF面板负二项模型,识别亚洲跨国/地区人口迁移的影响因素(表3)。模型结果显示,亚洲跨国/地区人口迁移网络的Moran's I为0.029,5个时期的面板数据存在一定的空间溢出效应。经筛选,ESF面板负二项模型共加入164个特征向量。对比两个模型,赤池信息准则(AIC)从82165.92下降为80261.07,贝叶斯信息准则(BIC)从82358.67下降为81669.59,说明模型的拟合优度有所提升;残差迁移流Moran's I值从0.184下降为0.157,表明加入特征向量空间滤波能有效消除迁移流的部分网络自相关性。因此,下文主要基于ESF面板负二项模型结果进行阐述。
表3 面板负二项引力模型和ESF面板负二项引力模型结果
Tab. 3
| 变量名称 | (1)面板负二项引力模型 | (2)ESF面板负二项引力模型 | |||
|---|---|---|---|---|---|
| 系数 | 标准误 | 系数 | 标准误 | ||
| O_preGDP | -0.129*** | (0.016) | -0.044** | (0.018) | |
| D_preGDP | 0.211*** | (0.016) | 0.170*** | (0.019) | |
| O_GDPgrow | -0.023*** | (0.003) | -0.023*** | (0.003) | |
| D_GDPgrow | 0.004 | (0.003) | 0.006* | (0.003) | |
| O_Inf | -0.022 | (0.039) | 0.092** | (0.041) | |
| D_Inf | 0.006 | (0.036) | -0.066 | (0.041) | |
| O_PoliStab | 0.234*** | (0.029) | 0.117*** | (0.030) | |
| D_PoliStab | 0.014 | (0.027) | 0.096 | (0.031) | |
| O_War | 0.286*** | (0.020) | 0.368*** | (0.021) | |
| D_War | -0.029 | (0.020) | -0.056** | (0.022) | |
| Trade | 0.060*** | (0.005) | 0.055*** | (0.006) | |
| Language | 0.227*** | (0.063) | 0.256*** | (0.076) | |
| Religion | 0.242*** | (0.044) | 0.086* | (0.050) | |
| MSTOCK | 0.023 | (0.164) | 0.163 | (0.160) | |
| Union | 0.018 | (0.045) | 0.018 | (0.045) | |
| O_POP | 0.071** | (0.030) | 0.084** | (0.035) | |
| D_POP | 0.101*** | (0.030) | 0.151*** | (0.034) | |
| D_Student | 0.011* | (0.006) | 0.015** | (0.006) | |
| Dist | -0.118*** | (0.027) | -0.182*** | (0.031) | |
| Year1 | 0.146** | (0.062) | 0.183*** | (0.065) | |
| Year2 | 0.314*** | (0.056) | 0.338*** | (0.059) | |
| Year3 | 0.265*** | (0.054) | 0.375*** | (0.056) | |
| Year4 | 0.240*** | (0.048) | 0.261*** | (0.048) | |
| Constant | -4.634*** | (0.437) | -5.348*** | (0.517) | |
| 特征向量数 | - | 164 | |||
| 残差迁移流Moran's I | 0.184*** | 0.157*** | |||
| N | 12250 | 12250 | |||
| AIC | 82165.92 | 80261.07 | |||
| BIC | 82358.67 | 81669.59 | |||
| 对数似然值 | -41056.962 | -39940.534 | |||
| Moran's I | 0.029*** | ||||
注:* p < 0.10,**p < 0.05,***p < 0.01;表中标准误为稳健标准误;Year1、Year2、Year3和Year4分别代
4.2 识别驱动因素
4.2.1 经济发展水平和国民收入差异是跨国/地区人口迁移的重要驱动力
模型结果表明,人均GDP和GDP增长率是跨国/地区人口流入的重要“拉力”,同时也对人口外流起到抑制作用。来源地人均GDP和GDP增长率每提高1%,会分别导致迁移流量减少约0.044%和0.023%。目的地人均GDP和GDP增长率每提高1%,会分别促使迁移流量提高0.170%和0.006%。此外,通货膨胀率也是人口流出的驱动力之一,每提高1%,会导致迁移流量提高约0.092%。可见,经济发展水平、发展前景较差,以及国民可支配收入减少对人口外流起推力作用,较高的经济水平对人口流入起拉力作用,亚洲跨国/地区移民往往从预期收入较低的国家/地区流向预期收入较高的国家/地区,证实了新古典主义迁移理论的观点。
4.2.2 政治动荡和战乱造成的国际难民是跨国/地区人口迁移的主要形式之一
政治动荡和战乱会导致大量人口外迁,其中战争对人口迁出带来的驱动作用更强。具体而言,来源地政治不稳定性和因战乱而死亡的人数每提高1%,会分别导致外迁人口增加0.117%和0.368%。此外,目的地的战乱也是抑制人口向其迁入的主要影响因素之一,其因战争而死亡的人数每增加1%,迁入人数就会减少0.056%。由战乱冲突所产生的难民潮,是阿富汗和叙利亚等国家出现大规模人口外流的主要驱动力。
4.2.3 多维邻近性对跨国/地区人口迁移起到了重要推动作用
两国/地区间大规模的贸易往来能够促进跨国/地区人口迁移活动,来源地从/向目的地的商品进/出口贸易总额每增加1%,迁移规模增加0.055%。文化邻近也是推动跨国/地区人口流动的重要因素,相同的官方语言会促使迁移流量增加约25.6%,相同的主要宗教促进跨国/地区人口迁移规模增加8.6%。文化邻近能够降低迁移成本和不确定性,对跨国/地区人口迁移有一定推动作用。没有证据表明,两国/地区间的组织邻近和社会邻近能够增加跨国人口迁移流量。
4.2.4 研究进一步印证了人口迁移引力模型已有结论
人口规模增长会积极促进跨国/地区人口迁移。来源地和目的地的人口规模每增加1%,迁移规模分别增加0.084%和0.151%。该结果与预期相符:人口众多意味着一个国家/地区拥有大量的潜在迁出人口以及庞大的就业市场和消费市场,对他国/地区劳动力有较大吸引力。目的地高校在校生人数每增加1%,导致迁移流量提高0.015%,说明留学生的跨国迁移受迁入地高等教育规模的影响。此外,跨国/地区人口迁移存在地理距离衰减效应,两国/地区首都间的空间距离每增加1%,迁移流量会减少0.182%。时间虚拟变量的系数表明,在控制了可观察变量的前提下,亚洲跨国/地区人口迁移流量整体上呈现先增后减的趋势。
4.3 驱动因素重要性的时间变化特征
经济发展差异、政治稳定性和多维邻近性均是亚洲跨国/地区人口迁移的重要驱动力。25年间,随着国际形势、各国/地区经济发展水平与相互间交流、合作的不断变化,各驱动因素对跨国/地区人口迁移的影响也可能随时间改变。因此,本文进一步构建经济差异、政治稳定和组织邻近指标与时间虚拟变量的交互项,以1990—1995年为参照组,揭示亚洲内部跨国/地区人口迁移主要驱动因素重要性的时间变化(表4)。考虑到各国/地区主要宗教、官方语言随时间变化不大,人口规模与距离等因素对人口迁移的影响已在其他研究中得到证实,上述5个指标未包含在交互项分析中。本节仅对ESF面板负二项引力模型的结果进行阐述。
表4 亚洲人口迁移网络影响因素的时空演化ESF面板负二项模型结果
Tab. 4
| - | Year2 | Year3 | Year4 | Year5 | ||||||
|---|---|---|---|---|---|---|---|---|---|---|
| 变量名称 | 系数 | 标准误 | 系数 | 标准误 | 系数 | 标准误 | 系数 | 标准误 | 系数 | 标准误 |
| O_preGDP | 0.051* | -0.027 | -0.089** | -0.037 | -0.087** | -0.040 | -0.277*** | -0.040 | -0.275*** | -0.046 |
| D_preGDP | 0.058** | -0.026 | 0.136*** | -0.035 | 0.249*** | -0.039 | 0.312*** | -0.042 | 0.238*** | -0.042 |
| O_GDPgrow | -0.032*** | -0.005 | -0.021* | -0.011 | 0.073*** | -0.014 | 0.055*** | -0.011 | -0.077*** | -0.014 |
| D_GDPgrow | 0.015*** | -0.005 | 0.016 | -0.010 | -0.024* | -0.014 | -0.038*** | -0.010 | 0.023* | -0.013 |
| O_Inf | 0.457*** | -0.052 | -0.493*** | -0.096 | -0.813*** | -0.107 | -1.148*** | -0.144 | -0.715*** | -0.150 |
| D_Inf | -0.274*** | -0.057 | -0.087 | -0.091 | 0.704*** | -0.106 | 1.293*** | -0.144 | 0.392** | -0.161 |
| O_PoliStab | 0.508*** | -0.070 | -0.562*** | -0.091 | -0.389*** | -0.087 | -0.507*** | -0.088 | -0.239*** | -0.084 |
| D_PoliStab | 0.021 | -0.065 | 0.174* | -0.089 | -0.056 | -0.085 | 0.170* | -0.091 | -0.152* | -0.078 |
| O_War | 0.580*** | -0.043 | -0.327*** | -0.057 | -0.160*** | -0.056 | -0.116** | -0.055 | -0.203*** | -0.053 |
| D_War | -0.062 | -0.041 | 0.074 | -0.057 | -0.045 | -0.056 | 0.030 | -0.061 | -0.204*** | -0.054 |
| Trade | 0.037*** | -0.008 | 0.006 | -0.009 | 0.027*** | -0.010 | 0.033*** | -0.010 | 0.029*** | -0.010 |
| MSTOCK | 0.016 | -0.450 | -0.061 | -0.589 | 0.038 | -0.532 | 0.074 | -0.572 | 1.693*** | -0.601 |
| D_Student | -0.050*** | -0.013 | 0.107*** | -0.018 | 0.049*** | -0.019 | 0.100*** | -0.019 | 0.047** | -0.019 |
| Constant | -4.558*** 0.566 | |||||||||
| 特征向量数 | 164 | |||||||||
| 其他控制变量 | 已控制 | |||||||||
| N | 12250 | |||||||||
| AIC | 79653.17 | |||||||||
| BIC | 81447.18 | |||||||||
| 对数似然值 | -39584.583 | |||||||||
注:*p < 0.10,**p < 0.05,***p < 0.01;表中标准误为稳健标准误;Year2、Year3、Year4、Year5分别代
4.3.1 经济差异性指标对亚洲跨国/地区人口迁移的影响先增后降,在2005—2010年间达到峰值
通过表4可知,人均GDP在亚洲历年跨国/地区人口迁移中均主要起“拉力”作用,且随着时间推移,对人口迁入的吸引力逐渐增强,在2005—2010年间达到峰值后下降。同时,人均GDP的提高在1990—1995年间与人口迁出显著正相关,随后对人口迁出的抑制效应也随着时间推移而增强,在2005—2010年间达到峰值,即人均GDP每增加1%,迁入人口增加0.370%,迁出人口减少0.226%。此外,各国/地区通货膨胀指标也呈相似趋势:通货膨胀率的增长在1995年前刺激人口迁出,1995年后均呈抑制作用。同时,通货膨胀率的增长也仅在1995年前对人口迁入有显著抑制作用,进入21世纪后转为促进人口迁入,且均在2005—2010年间达到峰值,通货膨胀率每提升1%,人口迁出减少0.691%,人口迁入增加1.019%。二元劳动力市场理论认为,发达国家的劳动力市场被分割为高技能职工、高收入、高附加值的第一劳动力市场和低收入、劳动密集型工作和低技能劳动的第二劳动力市场。后者因低工资、低社会地位以及工作环境差等特征,本国劳动力往往不愿意从事这一类型的工作。面对这一情况,政府和企业为避免由于给第二劳动力市场涨薪以吸引本国劳动力而引起通货膨胀上升、生产成本上升以及收入盈利下降等问题,往往选择从欠发达国家/地区吸收廉价劳动力,从而促进人口迁入[53]。人均GDP增长率对跨国/地区人口流动的影响在25年间保持小幅度波动,整体上变化不大。
4.3.2 政治稳定性一直为人口流动的重要影响因素,且对人口迁出的影响更大
来源地政治不稳定和因战乱导致的人口死亡在25年间整体上显著影响着人口迁出。1990—1995年间,塔吉克斯坦内战、印度锡克教暴动、阿富汗内乱以及斯里兰卡内战均造成国内人口巨大伤亡。此外,2005—2010年间亚洲因战争而死亡的总人数约为9.2万人,为5个时期之最,而塔利班领导的巴基斯坦国内恐怖袭击和阿富汗内战、持续不断的斯里兰卡内战以及菲律宾政府与恐怖组织的冲突更是造成约7.2万人死亡,占这一时期亚洲因战争死亡总人数的78%。2010—2015年亚洲因战争而死亡的人数约为8万人,虽略低于2005—2010年的死亡人数,但从2011年初持续至今的叙利亚内战仍造成叙利亚国内动荡,政治不稳定指标由2005—2010时期50个国家/地区中的第25位跃居于2010—2015时期首位,该时期叙利亚迁出共约525.51万人,占亚洲全部迁移人口的近34.46%。目的地政治不稳定性对人口迁入的影响一直处于波动状态,而因战争死亡人数仅在2010—2015年期间对人口迁入有显著抑制效应。
4.3.3 经济邻近推动跨国/地区人口迁移,社会邻近成为新兴因素,迁入地的留学吸引力呈波动趋势
两国/地区间进出口贸易总额的增长能够推动跨国/地区人口迁移,其推动作用先升后降,在2005—2010年达到最大值。社会邻近(流动链指数)仅在2010—2015年间对跨国/地区人口迁移量有显著推动作用,表明随着亚洲内部跨国/地区人口迁移的发展,家庭团聚和投靠亲友成为移民重要的迁移动机。此外,目的地高校在校生数量对人口迁入的吸引力呈波动趋势。
4.4 亚洲内部跨国/地区人口迁移动力机制
基于模型结果和相关理论,总结1990—2015年间亚洲内部跨国/地区人口迁移动力机制(图2)。跨国/地区移民是亚洲地区社会转型、经济发展和人口变动不可忽视的力量之一。在亚洲社会经济不平等、文化差异根深蒂固以及跨国/地区竞争与合作共存的背景下,亚洲跨国/地区移民的空间格局及影响因素也存在一定独特性[54]。1990—2015年间亚洲部分国家/地区政治不稳定与内战爆发是推动人口被动迁出的重要因素之一,不仅造成本国/地区大量高技能人才外流,也导致大量难民流向邻近国家/地区。在此影响下,形成了以阿富汗、叙利亚等为核心的、较为独立的迁移流场,迁移规模往往较大,如2010—2015年间叙利亚迁往周边国家/地区的移民数量就占到这一时期亚洲全部移民数量的近28%。
图2
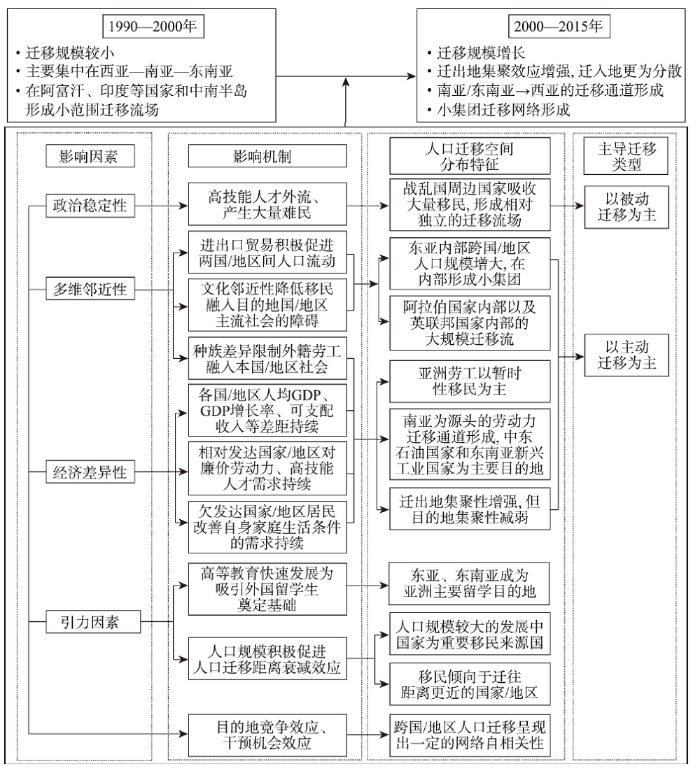
图2
1990—2015年间亚洲内部跨国/地区人口迁移的动力机制和空间格局
Fig. 2
Spatial pattern and drivers of international migration in Asia, 1990-2015
冷战格局结束后,和平与发展成为世界主流,国家/地区间进出口贸易规模增长也带动跨国/地区人口规模增加。经对比,2010—2015年东亚各国/地区间进出口贸易总额相比1990—1995年增长约8.03倍,东亚内部跨国/地区人口迁移规模也出现大幅增长,形成小集团式的人口迁移网络。此外,高校扩招为外国留学生前往求学提供了基础。中国在进入21世纪后成为亚洲高校在校生数量最多的国家。2015年中国吸纳12.31万留学生,在亚洲仅次于日本(13.19万人),位于第二位。相似的文化、宗教、语言也有助于移民克服生活、就业等障碍,促进人口跨国/地区流动。25年间,印度、孟加拉国、文莱、马来西亚、马尔代夫以及斯里兰卡等国之间的人口流动规模在前3个时期占其总迁出人口规模的比例较大,1995—2000年达到45.03%;亚洲阿拉伯国家内部人口流动规模一直占其迁出总人数的一半以上,在2005—2010年更是高达94.43%。
南亚、东南亚与阿拉伯国家间的劳工迁移通道也是亚洲跨国/地区移民的重要组成部分。一方面,不同于西方多元文化发展背景,亚洲许多国家在种族同质性的基础上建立国家意识,排斥具有种族差异的人成为本国公民,如部分海湾国家[55]。因此亚洲劳工在目的地的正常就业与生活等各方面均受限制,主要从事低技能工作,且遭受社会排斥和文化歧视。另一方面,中东石油国家/地区和新型工业化国家/地区劳动力短缺以及经济发展水平的巨大差异促生了亚洲内部大规模劳工迁移。南亚的劳工移民从迁往中东地区为主向东南亚扩散,劳工女性化程度的提高也导致了目的地的多元化[54]。新移民经济学理论认为家庭效益最大化是移民做出迁移决策的主导因素,为改善自身家庭的生活条件,南亚及东南亚的大量劳工也自愿迁出就业。整体上亚洲劳工移民以暂时性迁移为主,汇款补贴家用[56]。传统引力因素对人口跨国/地区迁移的影响也在本文中得到证实:较大人口规模提供了人口外迁基础,距离衰减效应使大部分移民选择迁往空间距离较近的国家/地区。
5 结论与讨论
5.1 结论
本文以1990—2015年亚洲50个国家/地区间跨国/地区人口迁移流为研究对象,运用社会网络分析方法和ESF面板负二项引力模型,揭示亚洲跨国/地区人口迁移的时空演化特征与驱动因素。主要结论如下:
(1)1990—2015年亚洲跨国/地区人口迁移规模先增后降,人口迁移网络较为松散,来源地集聚程度越来越高,而目的地在1990—2000年呈多元趋势,21世纪后集聚程度先增后降。
(2)1990—2000年亚洲跨国/地区人口迁移主要发生在西亚—南亚—东南亚,且大部分发生在邻国/地区之间。阿富汗及其邻国/地区、印度及其邻国/地区以及中南半岛四国是该时期最重要的迁移流场,由东南亚、南亚指向西亚的“迁移通道”初具雏形。2000—2015年,这一“迁移通道”进一步加强,东亚内部小集团式人口迁移网络逐渐形成,但整体上主要以阿富汗、印度、印度尼西亚和泰国为中心形成多个迁移流场。叙利亚内战导致叙利亚及其邻国/地区成为2010—2015年最大的迁移流场。
(3)亚洲跨国/地区人口迁移呈现网络自相关特征。来源地和目的地人口规模积极促进跨国/地区人口迁移;目的地高等教育规模对跨国/地区人口迁移有一定吸引作用;两国/地区首都距离越远,人口迁移规模越小。经济发展水平、国民收入差异、政治不稳定和战乱引发的难民潮均是亚洲跨国/地区人口流动的重要驱动力。经济邻近和文化邻近也有一定推动作用。
(4)经济差异性的影响先增后降,在2005—2010年间达到峰值;政治不稳定因素虽有波动,但一直是亚洲跨国/地区人口流动的主要影响因素,且对人口迁出影响更大;经济邻近性积极促进部分时期人口迁出,社会邻近性对人口外迁的吸引作用正逐渐显现。
(5)与既有研究相比,本文强调了政治稳定和结构性力量在亚洲跨国/地区人口迁移中的决定性作用。尽管自由主义理论能够部分解释亚洲跨国/地区人口迁移的产生,但结构主义理论在本文中也得到证实:由文明冲突和地缘政治主导的地方战乱是难民大量外逃的主要推力,而文化异同阻碍或促进了两国/地区间人员来往,主导跨国/地区迁移流的规模和流向。从地缘政治出发解释,主体权力不对等是导致难民跨国/地区迁移的原因之一,而多民族国家/地区内部种族、社会文化以及政治局势冲突是造成内战与国民流离失所的重要原因[57]。从文明冲突出发解释,语言、宗教等要素差异导致不同文明间的长期冲突。而在当今国际政治经济秩序向“非领土化”发展的背景下[58],不同文明间互动愈加频繁,使得如阿拉伯国家等地的国民对文明的自我意识增强,强化了基于宗教与民族的身份认同,导致其排斥其他文明的移民,推动国家制定相关限制性政策减少移民迁入。此外,世界体系理论强调了全球经济结构的发展变化是跨国/地区人口迁移的重要原因,核心国家的资本向半边缘和边缘国家渗透的过程促使了跨国移民流的产生[59]。
5.2 讨论
结合研究结论,本文有以下几点启示:① 人口众多的欠发达国家/地区应把握好全球产业转移新趋势,发挥劳动力和土地成本优势,大力发展劳动密集型产业,提供充足就业岗位;劳动力迁入国/地区应适时调整移民政策,推动产业转型升级,重点发展现代服务业和先进制造业,创造更多高收入、高技能就业岗位。② 习近平总书记曾在2014年提出新亚洲安全观,强调要发展和安全并重以实现持久安全。对于动荡国家/地区,早日恢复安全稳定,实现人民安居乐业是扭转人口大量流失的关键。其他国家/地区也应认识到安全稳定是头等大事,“利莫大于治,害莫大于乱”。同时,也应通过一系列对话与合作,着眼亚洲共同利益,促进亚洲区域安全。③ 为进一步深化亚洲各国/地区合作,实现劳动力资源的优化配置,各国/地区应推进高水平对外开放,扩大投资贸易往来,实现基础设施互联互通,加强政府间沟通合作,推进文化交流与文明对话。最后,中国作为世界主要移民来源国,可以依托经济高速发展、国家安全稳定和高水平对外开放的比较优势,营造良好创新创业和求学环境,广泛吸引跨国/地区创新创业人才和留学生,“聚天下英才而用之”。
本文研究尚有几点不足:① 2015—2020年全球双边移民流量数据尚未公布,本文无法检验“一带一路”倡议提出以来,亚洲跨国/地区人口迁移网络结构和驱动因素是否发生显著变化;② 未获取到移民社会经济属性特征的相关数据,而具有不同人口学特征(如男性和女性)、不同社会经济地位(如高技能人才和一般劳动力)和不同迁移动机(如经济移民和难民)的移民迁移的动力机制可能存在不同;③ 亚洲内部文化多元,社会经济发展存在差异,不同国家集团的人口迁移格局与驱动因素也可能有所不同,本文未对不同小集团的跨国/地区人口迁移展开进一步分析,亟待在今后完善;④ 囿于数据可得性,模型没有控制移民政策、失业率、气候、环境污染水平和粮食产量等可能影响人口迁移的指标,模型可能存在遗漏变量问题;⑤ 不同国际组织的合作重点及内部联系紧密程度有所不同,本文二值化的测度方法无法反映上述特征差异,可能存在估计偏误。拟在宏观和微观两个层面开展下一步研究:宏观层面,结合最新跨国/地区移民流量数据,揭示跨国/地区人口迁移动力机制,并尽可能考虑更多影响因素;微观层面,结合各国人口普查微观数据和专题问卷调查数据,分析不同特征跨国/地区移民的迁移决策和目的地选择的影响因素与机制。
参考文献
Literature review on the impetus and influence of talents mobility between countries and regions
DOI:10.2307/142494 URL [本文引用: 1]
人才跨国流动的动力与影响研究评述
Of skilled migration, brain drains and policy responses
Transnational mobility of the highly skilled: A review
西方高端人才跨国流动研究述评
Spatio-temporal evolution and factors influencing international student mobility networks in the world
DOI:10.11821/dlxb202004002
[本文引用: 2]

Based on the data released by UNESCO on international student mobility in tertiary education from 2001 to 2015, this paper draws on network science to construct a multidimensional weighted directed network heterogeneity model. This model combines the GIS spatial analysis method and the negative binomial regression model to study spatiotemporal evolution and factors influencing international student mobility networks. The results are as follows. First, in terms of the evolutionary characteristics of time series, the linkages of international student mobility networks have increased from 4921 to 9137, and its average weighted degree centrality has rapidly increased from 8004 to 20,834, which indicates that both the number of international students and the choices of overseas routines are mounting. Second, in terms of the topological structure, it has evolved from a single core comprising the United States into dual cores comprising the United States and China. Gradually, Asian countries have become the main body of international student mobility networks, while the centrality of European countries has reduced. Thirdly, in terms of spatial structure, the international student mobility network has a significant core-periphery structure and hierarchical characteristics. The countries in the core, strong semi-periphery and semi-periphery alternate with countries from other tiers. The spatial patterns of the international student mobility network "from east to west, and from south to north" are changing. China and Australia have become the new regional centers of international student mobility networks, meaning that regionalization has become an important trend. Finally, regression analysis shows that the flow of international students correlates positively with the quality of higher education in destination countries, the number of students in colleges and universities, the per capita GDP, the historical links connection between the destination country and the country of origin, and the level of globalization. Geographical distance and linguistic proximity have a significant negative correlation with the flow of international students, indicating that the impediment of language is rapidly weakening, while geographical distance still hinders student mobility.
全球留学生留学网络时空演化及其影响因素
DOI:10.11821/dlxb202004002
[本文引用: 2]
基于联合国教科文组织公布的全球高等学校留学生流动数据,借鉴网络科学,利用社会网络分析方法和负二项回归模型,对2001—2015年全球留学网络时空演化及其影响因素进行研究。主要结论为:① 时序演化特征上,全球留学网络关系流从4921个增加到9137个,平均加权度从8004迅速增加到20834,表明全球留学网络不仅学生数量在增加,且留学路径数量也在不断增加。② 拓扑结构上,从以美国为单一核心,演变成以美国、中国为双核心的拓扑结构,亚洲国家逐渐成为全球留学网络的主体,欧洲国家的中心性逐渐萎缩。③ 空间结构上,全球留学网络具有明显的等级层次性,美国是全球性主导型节点,德国、捷克是区域性主导型节点,次级主导型节点从25个增加到32个,全球留学网络“东向西、南到北”的地理空间格局正在发生变化,中国、澳大利亚等国成为新的区域性中心,区域化成为全球留学网络一个重要趋势。④ 回归分析发现,留学目的地国高等教育质量、高校在校生数量、人均GDP、留学目的地国与留学生来源国间的历史联系及全球化水平与留学生流量呈显著正相关关系,地理距离、语言临近性与留学生流量呈显著负相关关系,表明语言差异的阻抗作用在迅速减弱,地理距离仍然是阻碍学生流动的一个重要因素。
Spatiotemporal evolution of global talent mobility network based on the data of international student mobility
DOI:10.11821/dlyj020181156
[本文引用: 1]
High-quality talents are reshaping the world economic landscape by transcending geographic flows and driving global innovative activities. Based on the data of international student mobility, this paper draws on complex network theory to construct a multidimensional weighted directed network heterogeneity model. This model uses the GIS spatial analysis method to study spatiotemporal evolution of global talent mobility network complexity from 2001 to 2015. The results are as follows. First, the scale of the global talent mobility network is expanding rapidly, and the relationship is becoming closer and closer. In the network, both the number of talents and the choices of overseas routines are mounting. The network development has obvious small-world characteristics. However, the two levels of network differentiation are significant, and the difference is decreasing year by year. Second, the rank-size distributions of network nodes weighted degree of accession and weighted degree of output conform to the law of power distribution, showing a typical "pyramid structure" characteristics, reflecting that the global talent mobility network is controlled by a small number of pivotal node countries. The spatial patterns of the global talent mobility network are basically "from east to west, and from south to north", but the trend of mobile regionalization is gradually emerging, and the role of emerging countries attracting talents has gradually increased. Thirdly, the core-periphery structure of the global talent mobility network is remarkable. The countries in the core, strong semi-periphery and semi-periphery alternate with countries from other tiers. There is a strong mobility of relations between the core countries. The marginal countries are not connected with each other, or have weak links with each other. The talent of the marginal countries mainly flows to the core countries and semi-marginal countries. Finally, the global talent mobility network community has been significantly differentiated. The network has evolved into six associations, including American associations, EU associations, Chinese associations, South American and South African associations, Malaysian associations, and CIS associations. The scale of associations varies widely. Like the overall network, each community has a similar "pyramid structure" feature.
全球人才流动网络复杂性的时空演化: 基于全球高校留学生流动数据
DOI:10.11821/dlyj020181156
[本文引用: 1]
高质量的人才跨越地理的流动影响和驱动着全球范围内的创新活动,正在重塑世界经济格局。研究基于全球高校留学生流动数据,构建加权有向网络模型,对2001—2015年全球人才流动网络复杂性时空演化进行全面刻画。主要结论如下:① 全球人才流动网络规模迅速扩大,网络发育具有明显的小世界性,两级分化显著。② 全球人才流动网络呈典型“金字塔结构”特征,基本呈“东向西,南到北”的地理格局,新兴国家作为人才吸纳国的角色逐渐上升。③ 全球人才流动网络核心-边缘结构显著,核心国家间存在较强的关系流,边缘国家间联系较弱,其人才主要流向了核心国家和半边缘国家。④ 全球人才流动网络分化成美国社团、欧盟社团、中国社团、南美和南非社团、马来西亚社团、独联体社团等6个凝聚子群。
Evolution patterns of China's interprovincial migration networks between 1995 and 2015: Based on labour heterogeneity
1995—2015年中国省际人口迁移网络的演化特征: 基于异质性劳动力视角
DOI:10.11821/dlyj020200507
[本文引用: 1]
自户籍制度放宽以来,中国经历了大规模的人口迁移。其中,异质性劳动力(高技能劳动力、普通劳动力)在迁移过程中表征出不同的空间格局和网络组织特征,对地区经济发展产生各异的影响。本研究基于人口普查和抽样调查微观抽样数据,使用复杂网络理论对1995—2015年中国异质性劳动力迁移的时空格局和网络演化展开分析,并分析了格局背后的可能成因。研究发现:① 省际高技能和普通劳动力迁移均呈现出持续高度不平衡的空间集聚特征,承载大量人口的迁移流主要由中国中西部地区指向东部沿海地区,但这种空间不平衡特征呈现出一定的减弱趋势。高技能劳动力的平均迁移距离比普通劳动力更长;② 两类劳动力迁移网络中均呈现明显的“小世界”特性,但普通劳动力迁移网络的迁移强度和关联程度均高于高技能劳动力迁移网络;③ 两类劳动力迁移网络均呈现出以北京、上海、广东为主要核心节点的网络结构。高技能劳动力网络结构呈现相对稳定的特征,而普通劳动力网络结构则呈现出变化的趋势;④ 地区经济差异、路径依赖效应、异质性劳动力在就业市场上的差异性以及劳动力市场对异质性劳动力需求的差异是导致两类劳动力迁移格局差异性的重要成因。
Spatial characteristics of China's interprovincial migration network during 1985-2015
DOI:10.18306/dlkxjz.2017.11.006
[本文引用: 1]
With the rapid development of urban economy and the promotion of urbanization, great changes have taken place in the spatial pattern of population migration in China. Migration has played an important role in the economic, social, and cultural development of cities. Based on the provincial population migration matrix data of 31 provinces, autonomous regions, and municipalities in 1985-2015, a social network analysis was conducted to investigate the overall characteristics of interprovincial population migration network and the role of each node. The results show that: (1) Network density of interprovincial population migration has experienced a slow decline in 1985-2000 and a continuous increase in 2000-2015. The concentrated migration of population from the northwest, southwest, and central regions to the eastern developed areas has become the mainstream of development. (2) The inward center potential of population migration network rapidly increased in 1985-2005 and gradually declined in 2005-2015. It indicates that the number of important population moving areas were increasing gradually (such as Tianjin and Fujian), towards a "multi-polarization" development. The outward center potential was always at a low level and exhibited a trend of fluctuation. The inward center potential was clearly larger than the outward center potential. It indicates that the population migration area is relatively concentrated, and the population emigration area is relatively dispersed. (3) The interprovincial population migration network can be divided into 5 groups: Northeast-North China population linkage area, Central Plains-Yangtze River Delta population linkage area, Middle South-Pearl River Delta population linkage area, southwest population linkage area, and northwest population linkage area. Among them, the Central Plains-Yangtze River Delta population linkage area was the most closely linked between and within group; Middle South-Pearl River Delta population linkage area had the highest total population migration. The Northeast-North China population linkage area had a stronger internal connection and only strongly linked with the northwest region externally. (4) According to the population migration analysis, the 31 provinces, autonomous regions, and municipalities can be divided into three major categories: net population migration areas including eight provinces, autonomous regions, municipalities (Guangdong, Zhejiang, Beijing, Jiangsu, Shanghai, Tianjin, Fujian, and Xinjiang); population balanced areas including six provinces and autonomous regions (Hainan, Inner Mongolia, Tibet, Qinghai, Ningxia, and Liaoning), and population net emigration areas including 17 provinces, autonomous regions, and municipalities including Sichuan, Henan, and so on. (5) Based on the centrality analysis and the core-periphery structure, contributions of the provinces, autonomous regions, and municipalities to population migration was very different. In the interprovincial population migration network, a few core nodes had strong control over the total amount and path of population migration. About 25-30% core provinces controlled 70-80% of the population migration and path of the country, and the control power continued to rise. Among these provinces, Guangdong and Beijing had overall control significance. Jiangsu, Shaanxi, Sichuan, and Zhejiang were largely among the core control nodes. The role of Shanghai, Tianjin, Inner Mongolia, and Fujian as core areas had gradually increased. The role of Henan, Hubei, Hebei, and Xinjiang as core areas had declined. The overall migration path of the country is northward.
1985—2015年中国省际人口迁移网络特征
DOI:10.18306/dlkxjz.2017.11.006
[本文引用: 1]
随着中国城市经济的发展以及城镇化的快速推进,人口迁移的空间格局发生了重大变化。本文基于1985-2015年全国省际人口迁移矩阵数据,运用社会网络分析方法,探讨中国省际人口迁移网络的整体特征以及每个节点在网络中的地位作用。研究结论为:①省际人口迁移网络密度经历了1985-2000年的缓慢下降、2000-2015年持续上升的过程,与西北、西南和中部主要人口迁出地向东部经济发达地区的集中性迁移成为发展主流密切相关。②人口迁移网络的内向中心势明显大于外向中心势,说明人口迁入地相对集中,人口迁出地相对分散。③省际人口迁移网络可分为东北—华北人口联动区、中原—长三角人口联动区、中南—华南人口联动区、西南人口联动区、西北人口联动区5个子群。其中,中原—长三角人口联动区是群内和群间联系最紧密的区域;中南—华南人口联动区是全国人口累计迁移量最高的区域;东北—华北人口联动区内部联系较强,对外仅与西北人口联动区联系较强。④基于中心性分析以及核心—边缘结构划分,各省(市、区)对于人口迁移网络的贡献意义不同,广东、北京具有全局控制意义,江苏、陕西、四川、浙江基本处于核心节点序列,上海、天津、内蒙古、福建核心作用逐渐增强,河南、湖北、河北、新疆核心作用出现下降,全国人口迁移路径总体向北偏移。
Research on China's urban population mobility network: Based on Baidu migration big data
中国地级以上城市人口流动网络研究: 基于百度迁徙大数据的分析
Human mobility and evolution based on social network: An empirical analysis of Yangtze River Delta
基于社会网络分析的长三角地区人口迁移及演化
DOI:10.11821/dlyj201402016
[本文引用: 1]
在当今全球化与地方化、区域化的背景下,物质和能量在各节点间的高速流动促进了城市网络的形成并成为一种新的区域组织模式和空间结构,尤其是对区域一体化高度发达的区域产生了深刻影响。以长江三角洲地区为例,从人口迁移的网络空间入手,从网络密度、中心势等角度对1982-2010年长三角地区人口网络的演变进行研究。结果表明:整体上人口迁移网络日趋成熟,但空间分布不均衡;人口迁移主要流向上海、杭州、南京、宁波和苏锡常等核心城市,同时这些城市的人口外迁现象逐渐显现;以无锡、苏州、杭州之间人口迁移联系为主体的省际间人口流动行为增多,空间上具有等级扩散的特征;不同空间尺度的网络结构相互嵌套,在地方尺度下形成了江苏以邻域渗透为主和浙江的等级辐合两种网络结构。最后从就业机会、收入水平、产业结构、迁移成本等方面分析了人口迁移网络的演化历经均质离散—单核心集聚—多核心等级网络—链式空间网络四个阶段的成因。
Research on spatial pattern of population mobility among cities: A case study of "Tencent Migration" big data in "National Day-Mid-Autumn Festival" vacation
DOI:10.11821/dlyj020171231
[本文引用: 1]
Population migration, social check-in, vehicle navigation, and other spatial behavior big data have become vital carriers characterizing users' spatial behavior. The big data used in this paper were collected from the locations provided by hundreds of millions intelligent mobile phone users through Location Based Service (LBS) Tencent Migration data platform, and were displayed by means of real-time heat map which indicates user’s moving trajectory in China. "Tencent Migration" big data can real-timely, dynamically, completely and systematically record population flow routes using LBS device. Through gathering residents daily mobility among 299 cities in China during the period of "National Day-Mid-Autumn Festival" (NDMAF) vacation (from September 30 to October 8) in 2017 in "Tencent Migration" and defining three periods with "travel period, journey period, return period", this paper is designed to analyze and explore the characteristics and spatial patterns of daily flow mobility cities from the perspective of population daily mobility distribution levels, flow distribution layers network aggregation, spatial patterns and characteristics of the complex structure of the flow network. Results show that "Tencent migration" big data clearly discovers the temporal-spatial pattern of population mobility in China during the period of NDMAF. The net inflow of population showed a diamond-shaped pattern with cross frame support in each period, with the four nodes of Beijing, Shanghai, Guangzhou and Xi’an. Main mobility assembling centers are distributed in the urban agglomerations of Beijing-Tianjin-Hebei, Yangtze River Delta, Pearl River Delta and Chengdu-Chongqing, and those centers have strong coherence with those urban hierarchies. There is a positive correlation between the level of urban administration and the influence of population flow. Most cities are in a state of "relative equilibrium" in the population flow, and clear hierarchical structure and level distinction can be identified. Spatial patterns of population mobility present obvious core-periphery structures. The Dali-Hegang line exhibits a significant network of spatial differences in terms of boundary divisions. In this context, the spatial distribution of urban network could be summarized as "dense in the East and sparse in the West", and the core linkages of urban network could be characterized as "parallel in the East and series in the West". The whole network exhibits a typical "small world" network characteristic, which shows that China's urban population flow network has high connectivity and accessibility during the period of NDMAF. The network has a distinct "community" structure in the local area, including 2 national communities, 2 regional communities and 3 local-level communities.
中国城市间人口流动空间格局的网络分析: 以国庆—中秋长假和腾讯迁徙数据为例
DOI:10.11821/dlyj020171231
[本文引用: 1]
“腾讯迁徙”大数据基于位置服务,实时、动态、完整、系统地描述了用户日常出行活动的轨迹。通过采集“腾讯迁徙”数据平台中2017年国庆-中秋长假期间国内299个城市之间的逐日人口流动数据,分“出行期、旅途期、返程期”3个时间段,利用复杂网络分析方法,从人口流动集散层级、集散网络体系的分层集聚、人口流动空间格局、网络空间特征等角度分析各时间段城市间的人口流动特征与空间格局。结果表明,腾讯迁徙大数据直观地揭示了国庆-中秋期间中国各地级城市间人口的迁移规律,3个时段人口的净流入均呈现十字形骨架支撑的菱形分布,人流集散中心主要集中在京津冀、长三角、珠三角和成渝四大城市群,与城市等级有较强的一致性。人口流动集散体系呈明显的分层集聚,城市行政级别的高低与人口流动影响力存在一定的正相关关系,大部分城市人口流动处于“相对平衡”状态。人口流动空间格局呈现出明显的核心-边缘结构,大理-鹤岗一线是人口流动强度空间分布的显著分界线,以此线为界,城市网络呈现东密西疏的分布特征和东部并联、西部串联的网络关联特征。人口流动网络总体表现出“小世界”网络特征,局部具有较明显的“社区”结构特征,聚为2个国家级、2个区域级和3个地区级社区。
Measurement of directed alternative centricity and power of directed weighted urban network: A case of population flow network of China during "Chunyun" period
DOI:10.11821/dlyj201704004
[本文引用: 1]
With the rapid development of ICTs and big data technology, various "flow" data have become easier to be obtained such as population flows, information flows and capital flows. These data are key material to build the production network, social network, urban network and other types of network, which are becoming very important research subjects of geographical sciences and enrich the research content of this field. So far, researches on the networks in geography are still in their infancy stage. There are a number of methods that have not been utilized effectively, while it is difficult to find a proper abstracted network model to simulate the geographical phenomenon in many occasions. Therefore, to seek more appropriate methods and models for geographical network studies undoubtedly become urgent tasks in this field. In this context, an exploratory research was carried out. First, population flow network of China in the period of "Chunyun", a typical directed-weighted urban network, was built based on the population flow data acquired from “Big data on human migration during the "Chunyun" period from Baidu Map ("Baidu migration data" in short). Sequentially directed alternative centrality and directed alternative power were proposed in predecessor's foundation to evaluate the importance of each node and divide these nodes into different types according to their roles in the urban network. As analysis result, two dimensional spatial characteristic and geographical spatial characteristic was revealed which endowed the methods more practical significances. To validate the effectiveness of the methods, a contrastive analysis of the directed alternative centrality/directed alternative power and centrality/directed alternative power in previous studies was conducted. Based on directed weighted urban network and with the help of this method, this paper classified the cities into quintessential cities, hub cities, gateway cities and periphery cites, and identified the characteristics of agglomeration and diffusion at the mean time. And the result of classification was explained according to the internal structure and external context of the population flow network during the "Chunyun" period. It is found that the regional difference of directed alternative centrality and directed alternative power have certain relationship to economic and social development, national development strategy and administrative division. This explorative process demonstrated that one can effectively extract the information on the hierarchical structure, function divergence and imbalance of the directed weighted urban network via the directed alternative centrality-directed alternative power method. Directed alternative centrality-directed alternative power method is really a feasible approach to analyze the geographical network, and it also demonstrated that directed-weighted urban network can really make a difference from undirected and unweighted network in the geographical network studies.
有向加权城市网络的转变中心性与控制力测度: 以中国春运人口流动网络为例
DOI:10.11821/dlyj201704004
[本文引用: 1]
目前中国地学领域对网络的研究仍处于起步阶段,大量网络研究方法尚未得到应用的同时,许多地理现象尚未寻找到合适的抽象网络模型,不断拓展和应用有效的网络分析方法成为当务之急。在这一背景下,基于百度迁徙平台获取的春运人口流动大数据,构建中国春运人口流动的有向加权城市网络,在已有研究基础上提出有向转变中心性与控制力测度方法,对该城市网络的节点重要性和功能进行评估和分类,分析其呈现的二维空间特征与地理空间分布特征,并与已有方法进行对比。结果表明:利用有向转变中心性和控制力方法,可有效提取有向加权网络的层级结构、功能分异和非均衡性等特征,不但可区分典型城市、枢纽城市、门户城市与边缘城市等不同的城市类型,还可以识别城市的集聚与扩散特征,从而获得比无权无向网络更为丰富和具有实践意义的信息参考,是一种有效的地理网络分析方法。
A spatial-temporal study of inter-provincial migration pattern during Chinese Spring Festival travel rush
Based on Baidu migration data,this paper constructs the relationship matrix of population movement,and fully depicts the spatial agglomeration and diffusion process of inter-provincial circulation of Chinese population in the eastern,central and western regions during the spring festival of 2015.The conclusions are as follows: ( 1) February 13th-17th and February 25th-March 1st are respectively the back-home flow and the postganglionic return flow peak periods; ( 2) The inter-provincial flow is char- acterized by both near field and spatial dependency.Beijing-Tianjin-Hebei,Yangtze River Delta,and Pearl River Delta city group led the high-intensity population flows,and form three fan-shaped radiation areas; ( 3) we identify 94 population inflow cities and 242 outflow cities.The population agglomeration along the coastal areas and the population collapse in middle areas form the double vertical pattern of the floating population in China.
2015年我国春运人口省际流动的时空格局
文章基于百度迁徙数据构建人口流动的关系矩阵,完整刻画出 2015 年春运期间全国 人口在东部与中西部城市间省际循环流动的空间集聚与扩散过程。主要研究结论: ( 1) 2015 年 2 月 13 日( 腊月廿五) 至 17 日( 腊月廿九) 和 2 月 25 日( 正月初七) 至 3 月 1 日( 正月十一) 是春节前返乡 流和节后返工流两阶段人口净流入( 流出) 的峰值时段,两阶段各市日人口净流入人次存在正负对应 的规律性特征; ( 2) 人口省际流动的近域特征、空间依赖关系并存,京津冀、长三角、珠三角城市群主导了 高强度人口流动,并形成3 个扇形辐射区域;( 3) 识别出全国 94 个人口流入城市和 242 个流出城市。在 空间上,人口集聚的沿海绵延带与人口流失的中部塌陷带共同构成流入、流出城市的双纵平行格局。
Error analysis of regional migration modeling
DOI:10.1080/24694452.2016.1197767 URL [本文引用: 3]
Multilateral mechanism analysis of interprovincial migration flows in China
DOI:10.11821/dlxb201602003
[本文引用: 2]
Population migration flows between different regions are related to not only the origin- and destination-specific characteristics, but also to the migration flows to and from neighborhoods. Intuitively, changes in the characteristics of a single region will impact both inflows and outflows to and from other regions. In order to explore the spatial interaction mechanism driving the increasing population migration in China, this paper builds the spatial OD model of interprovincial migration flows based on the sixth national population census data and related social-economic data. The findings are as follows: (1) Migration flows show significant autocorrelation effects among origin and destination regions, which means that the migration behavior of migrants in some region is influenced by that of migrants in other places. The positive effects indicate the outflows from an origin or the inflows to a destination tend to cluster in a similar way. Simultaneously, the negative effects suggest the flows from the neighborhood of an origin to the neighborhood of a destination tend to disperse in a dissimilar way. (2) Multilateral effects of the regional economic and social factors through the spatial network system lead to the clustering migration flows across interrelated regions. Distance decay effect plays the most influential force in shaping the patterns of migration flows among all the factors and the negative spillover effect further aggravates the friction of distance. As for destinations, the influence of wage level and migration stocks is beyond that of GDP and the positive spillover effects of these factors enhance the attraction of neighborhood regions. The spillover effects of unemployment rate and college enrollment of higher education are significantly negative while the effect of population in a destination is not significant. As for origins, population and migration stocks lead to positive spillover effects on the neighborhoods while the effects of other factors are negative. (3) Changes in the regional characteristics will potentially lead to a series of events to the whole migration system, and the flows to and from the center of oscillation and its neighborhoods vibrate greatly compared with other regions. The simulation results of 5% GDP increase in Jiangsu province indicate that the outflows to other regions decrease while the inflows from all others increase to some different extent. Comparatively, the influence on the flows to and from the regions neighboring Jiangsu is significant while that of remote regions is much less, which cannot be explained by the traditional gravity model.
中国省际人口迁移的多边效应机制分析
DOI:10.11821/dlxb201602003
[本文引用: 2]
区际人口迁移不仅与迁出地和目的地的要素特征以及距离有关,而且还受到周边迁移流的影响.基于网络自相关理论,利用"六普"省际人口迁移数据和相关统计资料,在重力模型的基础上考虑迁移流之间可能存在的几种空间依赖形式,构建中国省际迁移流的空间OD模型,初步揭示区域经济社会等因素及其空间溢出效应对省际人口迁移的影响,并就区域要素变化对整个省际人口迁移系统产生的"连锁反应"进行了模拟.结果表明:① 中国省际迁移流之间存在显著的网络自相关效应.目的地和迁出地的自相关效应皆为正,导致迁入和迁出流的空间效仿行为;迁出地和目的地周边则出现负的自相关效应,导致迁移流的空间竞争行为;② 区域经济社会等因素通过网络空间关系对周边地区产生的多边溢出效应导致迁移流在空间上集聚.其中,距离衰减效应位居各要素之首,其溢出效应进一步加剧距离的摩擦作用;对目的地而言,区域工资水平和迁移存量超过GDP的影响并产生正的溢出效应,促进周边地区吸引更多的外来人口;对迁出地而言,人口规模和迁移存量产生正的溢出效应,推动周边地区人口外迁;③ 区域要素变化潜在地对整个省际人口迁移系统产生一系列"连锁反应",震荡中心及其周边区域的迁移流波动较大.江苏省GDP增长5%的模拟结果表明,江苏迁往全国其他省份的人口数量都有不同程度地减少,而其他省份入迁人口均有所增加.相对而言,江苏周边省份的迁入或迁出流受到的波动较大,偏远省份波及较小,这是传统的重力模型所无法解释的.
Gravity model coefficient calibration and error estimation: Based on Chinese interprovincial population flow
DOI:10.11821/dlxb201902001
[本文引用: 1]
Simulations based on spatial interaction models have been widely applied to understand the strength of relationships between geographical elements, but many issues remain unclear and deviations between actual and simulated results have often been seriously underestimated. A high-precision Baidu migration process combined with mass relationships is applied in this study and enables the generation of regression coefficients of gravity model based on programmed large-scale regression simulations. A series of accuracy assessments are then developed for 2015 empirical projection daily regression coefficients that can be applied to Chinese spring interprovincial mobile gravity model variables as well as spatiotemporal research that utilizes regression coefficients within a heterogeneity research model. This approach also enables the error within the gravity model to be assessed in terms of floating population simulations. The results of this analysis lead to a number of clear conclusions, including the fact that parameter calibration complexity for the Chinese population mobility gravity model is reflected in the degree of influence asymmetry within spatial object interaction variables, and that the spatial heterogeneity of the variable regression coefficient increases in two distinct fashions. The first of these increases has to do with the overall influence of specific variables, including the fact that differences between proxies tend to be higher than inflow-outflow characteristics. In contrast, the second set of increases is related to economic levels, industrial scales, the proportion of the tertiary industry, and public service facilities. In this latter case, two-way population flow exerts a more profound influence on results and thus the scope of possible explanations for phenomena is more extensive. The regression coefficient for the existence of positive and negative proxy variables therefore relates to differences in spatial heterogeneity, including at the city level, and also assumes that floating population gravity model regression coefficients ignore spatiotemporal changes in the heterogeneity coefficient. This leads to spatial differences in estimated results and thus convergence trends, but further enables the identification of anisotropic interactions in extension space. The second main conclusion of this research is that the national scale population flow distance attenuation coefficient was 1.970 during the spring of 2015, while at the level of prefectural administrative units and given population outflow, the range encapsulated by this coefficient fell between 0.712 (Zhumadian) and 7.699 (Urumqi). Data also reveal a population inflow coefficient of 0.792 for this year that ranged as high as 8.223 in both Sanya and Urumqi. Population flow simulation results using the gravity model and including Baidu migration measured flow data were also subject to significant error. Third, the results of this analysis reveal a total fitting error of 85.54% in weighted absolute mean; the spatial interaction effect within this is responsible for a maximum error of 86.09% in actual and simulated flows, while relative outflow force and attractiveness encompass 57.73% and 49.34% of model error, respectively. These results show that the spatial interaction effect remains most difficult to model in terms of current factors.
中国人口省际流动重力模型的参数标定与误差估算
DOI:10.11821/dlxb201902001
[本文引用: 1]
空间交互模型被广泛应用于地理要素关系强度的模拟,然而目前大量研究或建立在模型参数标定理想化、模式化的假设条件下,或是在暗箱中完成,由此导致模拟结果与实际的偏差却被严重低估。基于2015年中国春运期间人口省际流动的城市间O-D数据,在逐日、分市的研究精度下,实证推算人口流动重力模型变量的回归系数,探究模型代理变量影响效应的空间异质性,并评估重力模型在人口流动模拟上的误差。结果显示:① 重力模型参数标定的复杂性体现在交互对象代理变量影响程度的非对称性,和变量回归系数的空间异质性随研究精度加深显著加剧两个方面,因此模型参数标定的模式化将导致估算结果空间差异的趋势收敛;② 2015年春运期间中国人口省际流动距离衰减系数为1.970,在地级行政单元视角下,人口流出地距离衰减系数值域为0.712(驻马店)~7.699(乌鲁木齐),人口流入地系数值域为0.792(三亚)~8.223(乌鲁木齐);③ 应用重力模型模拟人口流动结果与实测流(百度迁徙数据)存在显著误差。就加权绝对平均误差而言,拟合总误差为85.54%,其中空间相互作用效应造成了86.09%的实测流与模拟流的最大误差,相对流出力、相对吸引力分别造成57.73%、49.34%的模型误差。因此,空间交互效应仍然是当前最难以模式化的因素。
Driving mechanism of interprovincial population migration flows in China based on spatial filtering
DOI:10.11821/dlxb201902002
[本文引用: 7]
According to previous studies, not only does the conditional gravity model based on ordinary least squares often bring about poor fitting of migration flows in reality, but also there exists overdispersion in the extended Poisson gravity model. Simultaneously, network autocorrelation usually exists in population migration data (e.g., the spatial interaction among migration flows). The problems mentioned above result in biased estimation. In order to capture network autocorrelation and deal with the issue of overdispersion, we build an eigenvector spatial filtering negative binomial gravity model (ESF NBGM) based on the data of 1% national population sample survey in 2015, to analyze the driving mechanism of interprovincial population migration flows in China. The results are as follows: (1) Positive spatial spillover effect exists in interprovincial population migration flows, and ESF can capture network autocorrelation in data, so as to reduce the estimated deviation of the model. Furthermore, eigenvectors ranking top 1.4% can properly interpret the spatial pattern of high network autocorrelation in data. (2) There exists overdispersion in China's interprovincial migration flows. Considering this problem, a negative binomial regression model is more suitable for the estimation of driving mechanism for population migration, together with statistical enhancement. (3) Network autocorrelation leads to overestimation of distance variables and underestimation of non-distance variables. The results of the improved model reveal that: chief factors the affect driving mechanism are regional population characters, social network, economic development and education level. Meanwhile, living environment and road network gradually become one of the most crucial pulling factors that influence migration flows. (4) Compared to previous studies, social network (i.e. migration stock) plays a more significant role in population migration flows, while the impact of spatial distance keeps weakening.
基于空间滤波方法的中国省际人口迁移驱动因素
DOI:10.11821/dlxb201902002
[本文引用: 7]
人口迁移数据中往往存在较强的网络自相关性,以往基于最小二乘估计的重力模型与迁移数据的拟合度较低,而改进后的泊松重力模型仍存在过度离散的缺陷,以上问题均导致既有人口迁移模型中的估计偏差。本文构建了特征向量空间滤波(ESF)负二项重力模型,基于2015年全国1%人口抽样调查数据,研究2010-2015年中国省际人口迁移的驱动因素。结果表明:① 省际人口迁移流间存在显著的空间溢出效应,ESF能有效地提取数据中的网络自相关性以降低模型的估计偏差,排序在前1.4%的特征向量即可提取较强的网络自相关信息。② 省际人口迁移流之间存在明显的过度离散现象,考虑到数据离散的负二项重力模型更适用于人口迁移驱动因素的估计。③ 网络自相关性会导致模型对距离相关变量估计的上偏与大部分非距离变量估计的下偏,修正后的模型揭示出以下驱动因素:区域人口特征、社会网络、经济发展、教育水平等因素是引发省际人口迁移的重要原因,而居住环境与公路网络等因素也逐渐成为影响人口迁移重要的“拉力”因素。④ 与既有研究相比,社会网络因素(迁移存量、流动链指数)对人口迁移的影响日益增强,而空间距离对人口迁移的影响进一步呈现弱化趋势。
The P1 P2 D hypothesis: On the intercity movement of persons
DOI:10.2307/2087063 URL [本文引用: 1]
Spatial patterns and determinants of skilled internal migration in China, 2000-2005
DOI:10.1111/pirs.12014 URL [本文引用: 1]
A method of fitting the gravity model based on the Poisson distribution
"In this paper, [the authors] suggest an alternative method for fitting the gravity model. In this method, the interaction variable is treated as the outcome of a discrete probability process, whose mean is a function of the size and distance variables. This treatment seems appropriate when the dependent variable represents a count of the number of items (people, vehicles, shipments) moving from one place to another. It would seem to have special advantages where there are some pairs of places between which few items move. The argument will be illustrated with reference to data on the numbers of migrants moving in 1970-1971 between pairs of the 126 labor market areas defined for Great Britain...."excerpt
Long and short distance migration in Italy: The role of economic, social and environmental characteristics
DOI:10.1080/17421772.2010.540035 URL [本文引用: 1]
A new set of spatial-interaction models: The theory of competing destinations
DOI:10.1177/0308518X8301500103 URL [本文引用: 1]
Intervening opportunities and competing migrants
Modeling network autocorrelation within migration flows by eigenvector spatial filtering
DOI:10.1007/s10109-008-0068-2 URL [本文引用: 5]
Modeling network autocorrelation in space-time migration flow data: An eigenvector spatial filtering approach
DOI:10.1080/00045608.2011.561070 URL [本文引用: 4]
A gravity model analysis of international migration from BRIC to OECD countries using Poisson Pseudo-maximum likelihood Approach
Social networks and the intention to migrate
DOI:10.1016/j.worlddev.2018.05.011 URL [本文引用: 1]
Migration, trade and spillover effects
DOI:10.1016/j.jce.2019.10.005 URL [本文引用: 1]
Modelling skilled and less-skilled interregional migrations in China, 2000-2005
Modelling skilled and less-skilled internal migrations in China, 2010-2015: Application of an eigenvector spatial filtering hurdle gravity approach
Theories of international migration: A review and appraisal
DOI:10.2307/2938462 URL [本文引用: 2]
Migration, unemployment and development: A two-sector analysis
A model of labor migration and urban unemployment in less developed countries
The costs and returns of human migration
DOI:10.1086/258726 URL [本文引用: 1]
Cities, international labor migration and development: Towards an alternative research agenda
DOI:10.1016/j.habitatint.2007.08.008 URL [本文引用: 1]
War, climate change, and migration
DOI:S1550-8307(18)30082-X PMID:29653722 [本文引用: 1]
The role of language in shaping international migration
DOI:10.1111/ecoj.12231 URL [本文引用: 1]
Exploratory social-spatial network analysis of global migration structure
DOI:10.1016/j.socnet.2020.09.007 URL [本文引用: 1]
An investigation of globalisation, difference and international student mobility
DOI:10.1111/j.1475-5661.2011.00454.x URL [本文引用: 1]
A ritual economy of 'talent': China and overseas Chinese professionals
DOI:10.1080/1369183X.2011.559721 URL [本文引用: 1]
International student migration: Mapping the field and new research agendas
DOI:10.1002/psp.1746 URL [本文引用: 1]
Quantifying global international migration flows
DOI:10.1126/science.1248676
PMID:24675962
[本文引用: 1]
Widely available data on the number of people living outside of their country of birth do not adequately capture contemporary intensities and patterns of global migration flows. We present data on bilateral flows between 196 countries from 1990 through 2010 that provide a comprehensive view of international migration flows. Our data suggest a stable intensity of global 5-year migration flows at ~0.6% of world population since 1995. In addition, the results aid the interpretation of trends and patterns of migration flows to and from individual countries by placing them in a regional or global context. We estimate the largest movements to occur between South and West Asia, from Latin to North America, and within Africa.
Brain circulation: The educational profile of return migrants
DOI:10.1007/s11113-021-09655-6 URL [本文引用: 1]
Bilateral international migration flow estimates for 200 countries
DOI:10.1038/s41597-019-0089-3
PMID:31209218
[本文引用: 2]
Data on stocks and flows of international migration are necessary to understand migrant patterns and trends and to monitor and evaluate migration-relevant international development agendas. Many countries do not publish data on bilateral migration flows. At least six methods have been proposed recently to estimate bilateral migration flows between all origin-destination country pairs based on migrant stock data published by the World Bank and United Nations. We apply each of these methods to the latest available stock data to provide six estimates of five-year bilateral migration flows between 1990 and 2015. To assess the resulting estimates, we correlate estimates of six migration measures from each method with equivalent reported data where possible. Such systematic efforts at validation have largely been neglected thus far. We show that the correlation between the reported data and the estimates varies widely among different migration measures, over space, and over time. We find that the two methods using a closed demographic accounting approach perform consistently better than the four other estimation approaches.
How multi-proximity affects destination choice in onward migration: A nested logit model
DOI:10.11821/dlxb202012012
[本文引用: 1]
China's migrant population continued to grow for decades, but has slowly declined since 2015. In such a context, the destination choice of stock migrants has a profound influence on the future pattern of population distribution and urbanisation. Previous analysis and modelling of internal migration in China have mainly focused on the primary migration or the most recent one, while it has long been recognized that migration is a repetitive event. Migrants have various motives and strategies in different stages, and the experience gained from the primary migration will affect the subsequent one. So, the primary and onward migrations differ in their spatial patterns. This paper focused on China's onward migrants who have moved once. Considering both the origins and primary destinations, we constructed a framework of how multi-proximity, which includes cognitive proximity, geographic proximity, institutional proximity, informational proximity and social proximity, which generates an influence on destination choice by affecting the migration cost. Based on data from the 2017 China Migrants Dynamic Survey, and by the use of the nested logit model, we make an empirical test. The results show that migrants have a dual identity of the origin and the primary destination, and their onward migration is based simultaneously on these two places. After controlling the effects of cities' characteristics, dual multi-proximity has a significant and robust impact on migrants' decision-making. Onward migrants prefer destinations which match them well in education background, and are geographically adjacent to, and closely connected with their origins and previous destinations. The migration network between a destination and its origins increases the likelihood that onward migrants will migrate to such a destination. Besides, migrants are willing to return to the province of their origins subjectively, but cities in such provinces are generally lack of attractiveness due to low level of socio-economic development. However, the effect of proximities varies from different groups. This is reflected in the following facts. First, women are more dependent on their hometown networks than men. Second, the new generation of migrants is similar to the older one in many ways, but relies more on the information and social connections of their hometowns than the latter. Finally, highly educated migrants are able to take advantage of localized social capital owing to their deep social integration in the primary destinations and are less dependent on the social capital in their origins. So, their destination choice is more similar to local residents than their counterparts.
邻近性对人口再流动目的地选择的影响
DOI:10.11821/dlxb202012012
[本文引用: 1]
中国人口流动进入总量稳定下的空间调整新阶段,存量流动人口的再流动成为塑造人口和城镇化格局的主体因素。本文从户籍地和前期流入地两个基点出发,综合考虑地理、制度、信息、社会、认知等维度,构建了双重多维邻近性影响人口再流动目的地选择的理论框架,利用全国流动人口动态监测调查数据和嵌套Logit模型开展实证研究。结果表明:双重多维邻近性对人口再流动的空间选择具有显著而稳健的影响。人口再流动时,会选择与自身知识水平更匹配、与户籍地和前期流入地都更近、信息联系都更强的城市,但社会联系仍主要依靠老家。流动人口具有回到户籍所在省(区、市)的主观意愿,但省内城市普遍机会不多、环境欠佳,缺乏吸引力。相对而言,女性对同乡网络的依赖高于男性;新生代流动人口在很多方面继承了老一代的特点,甚至比后者更依赖老家的信息和社会联系;高学历流动人口在流入地的深度社会融入使其能够利用本地化社会资本,再流动的空间选择也与流入地居民更为类似。
Climate, conflict and forced migration
DOI:10.1016/j.gloenvcha.2018.12.003 URL [本文引用: 1]
Understanding the migration of highly and less-educated labourers in post-reform China
Austerity, labour market segmentation and emigration: The case of Lithuania
DOI:10.1111/irj.12102 URL [本文引用: 1]
Conceptual contours of migration studies in and from Asia
DOI:10.1111/imig.12932 URL [本文引用: 2]
Migration networks and migration decision-making
DOI:10.1080/13691830801961605 URL [本文引用: 1]
Self-imagination of transnational-refugee cultural identity in context of globalization
全球化语境中跨国难民文化身份的自我想象
A review of critical geopolitics
评批判性地缘政治学
