Progress of applied research of physical geography and living environment in China from 1949 to 2019
CHEN Fahu,1,2,3, WU Shaohong,3,4,5, CUI Peng2,3,6, CAI Yunlong7, ZHANG Yili2,3,4,5, YIN Yunhe4,5, LIU Guobin8, OUYANG Zhu3,4, MA Wei9, YANG Linsheng3,4,5, WU Duo10, LEI Jiaqiang11, ZHANG Guoyou4,12, ZOU Xueyong13, CHEN Xiaoqing2,6, TAN Minghong3,4,5, WANG Xunming3,4, BAO Anming11, CHENG Weixin4, DANG Xiaohu14, WEI Binggan4,5, WANG Guoliang8, WANG Wuyi4,5, ZHANG Xingquan4, LIU Xiaochen2,15, LI Shengyu11
1. Key Laboratory of Alpine Ecology, Institute of Tibetan Plateau Research, CAS, Beijing 100101, China
2. Centre for Excellence in Tibetan Plateau Earth Sciences, CAS, Bejing 100101, China
3. School of Resources and Environment, University of Chinese Academy of Sciences, Beijing 100190, China
4. Institute of Geographic Sciences and Natural Resources Research, CAS, Beijing 100101, China
5. Key Laboratory of Land Surface Pattern and Monitoring, CAS, Beijing 100101, China
6. Institute of Mountain Hazards and Environment, CAS, Chengdu 610041, China
7. College of Urban and Environmental Sciences, Peking University, Beijing 100871, China
8. State Key Laboratory of Soil Erosion and Dryland Farming on the Loess Plateau, Northwest A&F University, Yangling 712100, Shaanxi, China
9. Northwest Institute of Ecological and Environmental Resources, CAS, Lanzhou 730000, China
10. Key Laboratory ofWestern China's Environmental Systems (Ministry of Education), College of Earth and Environmental Sciences, Lanzhou University, Lanzhou 730000, China
11. Xinjiang Institute of Ecology and Geography, CAS, Urumqi 830011, China
12. Geographical Society of China, Beijing 100101, China
13. Faculty of Geographical Sciences, Beijing Normal University, Beijing 100875, China
14. College of Geology and Environment, Xi'an University of Science and Technology, Xi'an 710054, China
15. Institute of Tibetan Plateau Research, CAS, Beijing 100101, China
Physical geography is a basic discipline of natural science. Since its research object is the natural environment, it is closely related to human survival and development. China's natural environment is complex and diverse; therefore, according to national demand and regional development needs, physical geographers have also made remarkable achievements in applied foundation and application, making important contributions to the planning of national major economic construction and social development, protection of macro-ecosystem and resources and environment, and regional sustainable development. This paper summarizes the practice and application of physical geography in China in the last 70 years (1949-2019), differences between the natural environment and natural zoning, land use/cover change, natural disasters and risk prevention and control, the process of desertification and its administration, lower-yield field transformation of Huang-Huai-Hai Plain, engineering construction of permafrost areas, geochemical element abnormity and endemic disease prevention and control, positioning observation of natural geographical factors, geographical spatial heterogeneity identification, and geographical detector. Finally, it proposes the future application research directions of physical geography.
Keywords:physical geography
;
practices
;
application
;
regional development
;
national strategy
CHEN Fahu, WU Shaohong, CUI Peng, CAI Yunlong, ZHANG Yili, YIN Yunhe, LIU Guobin, OUYANG Zhu, MA Wei, YANG Linsheng, WU Duo, LEI Jiaqiang, ZHANG Guoyou, ZOU Xueyong, CHEN Xiaoqing, TAN Minghong, WANG Xunming, BAO Anming, CHENG Weixin, DANG Xiaohu, WEI Binggan, WANG Guoliang, WANG Wuyi, ZHANG Xingquan, LIU Xiaochen, LI Shengyu. Progress of applied research of physical geography and living environment in China from 1949 to 2019. Acta Geographica Sinice[J], 2020, 75(9): 1799-1830 doi:10.11821/dlxb202009001
土地是人类活动的载体,土地利用/覆被变化(Land Use and Land Cover Change, LUCC)集中反映人类活动和自然因子变化及其相互作用与影响,LUCC在全球气候环境变化和可持续发展中占有重要地位[38,39,40,41]。研究中国社会经济快速发展带来的土地利用/覆被的巨大时空变化,为中国人地关系的协调发展提供大力支持。
Fig. 2
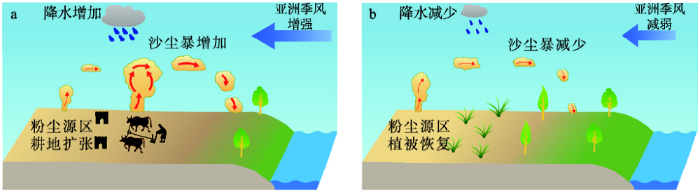
A schematic diagram of the response of sandstorms to human activities and Asian monsoon changes in the eastern monsoon marginal region of China (according to Chen[130])
Fig. 5
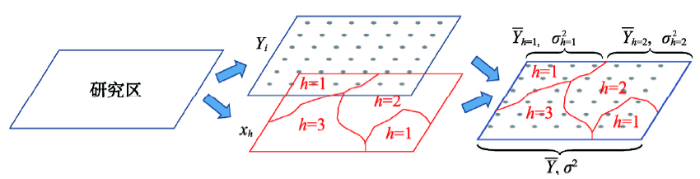
Principle of geodetector (according to Wang Jinfeng et al. [273]) (The study area consists of two layers: the explained variable Y and the spatial stratification X; X can be used to express geographical classification or partitioning. $\bar{Y}$ and $σ^{2}$ are the mean value and variance of the entire study area, $\bar{Y}_{h}$ and $σ^{2}_{h}$ are the mean value and variance of the h layer)
Physical geography is the cornerstone of comprehensive study in geography. On the basis of reviewing the main research progress of physical geography, this article discussed the new research directions of physical geography. Driven by global environmental changes, physical geography and its branches have achieved significant progress. Recent progress in physical geography mainly includes research on the synthesis of physical geographic processes, land surface system integration, land-sea interaction, and physical geography application for regional ecological or environmental management. Physical geography needs to face the global climate change and human needs, explore new methods of technology application, carry out integrated multi-factor and multi-process research, develop geographical models, model future environmental dynamics and sustainable development, and serve the national priorities. In the process of physical geography development, we should pay more attention to the following frontier areas and directions: (1) geomorphology needs to focus on the study of geomorphology and global environmental change, and geomorphology and human activities; (2) biogeography needs to focus on the exploration of frontier fields such as attribute geography, global change biogeography, and to connect spatial distribution in biogeography and human needs under the background of change; (3) hydrology needs to integrate the multi-factor, multi-process, and multi-scale research, and to promote the development of ecological hydrology, social hydrology, and hydrological morphology; (4) physical geography needs to play a key role in the research of climate change, and serve major international research projects in climate change; (5) comprehensive physical geography research needs to meet national priority demands, focusing on the coupling of human-land system, resource and environment carrying capacity assessment, ecological security pattern, and ecological civilization construction; (6) physical geography needs to merge the natural and human elements and processes, develop complex system simulation models, and analyze the coupling mechanism of natural and human factors and the dynamic change of land surface system.
Suggestion concerning the devdopmental directiom of agriculture, forestry, animal husbandry, sideline production and fishery in different natural regions of China
Regional study is an ancient and important tradition, forming the regional school of geography. In view of integrated or unified geography, regional study of sustainable development is an important level for approaching regional system of man-land relationship and effective way for coordinating man-nature relationship. Aimed at sustainable development the integrated geographical regionalization includes natural elements and human factors. Main principles for demarcation are as follows: combining regional differentiation of physical environments and human geography, integrating comprehensive analysis and principal factors, genetic unity, as well as linking regional frameworks with regional types, etc. Criterion and index system of the integrated geographical regionalization consists of environments, resources, economy, society and population, etc. The selected criteria and indices for demarcation should be practical, simplified, comparable, quantified, and reflecting dynamic state and trends of various regions. Regional types of development states may be identified based on the above mentioned results, then proposing a tentative scheme of the integrated geographical regionalization.
Major Function Oriented Zoning (MFOZ) is the blueprint for the future developmnt and protection pattern of China's territory, and has been raised to from major function zones planning to major function zoning strategy and major function zoning institution. From 2004 to 2014, the author organized a series of research projects to compose MFOZ for the country, studied basic theory of regional function and MFOZ technical process, and proposed that space controlling zones of national and provincial scales can be divided into four types: urbanized zones, foodstuff-security zones, ecological safety zones, cultural and natural heritage zones. On this basis, major function zones of county scale should be transferred to optimized, prioritized, restricted, and prohibited zones. In this paper, a regional function identification index system comprising nine quantitative indicators (including water resources, land resources, ecological importance, ecological fragility, environment capacity, disaster risk, economic development level, population concentration and transport superiority) and one qualitative indicator of strategic choice is developed. Based on the single index evaluation, comprehensive evaluation using regional function suitability evaluation index is conducted, aiming at testing several key parameters including lower limit of protection zones and upper limit of development zones at the provincial level. In addition, a planning-oriented zoning method of major function zones is also discussed, which has brought the first MFOZ planning in China. According to the MFOZ caliber, it is forecasted that national spatial development intensity will rise from 3.48% in 2010 to 3.91% in 2020. Furthermore, according to caliber of the provincial integrated MFOZ planning, the area of optimized, prioritized and restricted zones accounts for 1.48%, 13.60% and 84.92%, respectively, and that of urbanized, foodstuff-security and ecological safety zones accounts for 15.08%, 26.11% and 58.81%, respectively. In combination of analyses of development level, resources and environmental carrying status and quality of the people's livelihood, the main characteristics of MFOZ were identified. Through verification, MFOZ draft of national and provincial scales, which is interactively accomplished with "MFOZ Technical Process" put forward by the author, is mostly above 80% identical with what have been forecasted.
Despite the well-documented effects of global climate change on terrestrial species’ ranges, eco-geographical regions as the regional scale of ecosystems have been poorly studied especially in China with diverse climate and ecosystems. Here we analyse the shift of temperature zones in eco-geographical study over China using projected future climate scenario. Projected climate data with high resolution during 1961–2080 were simulated using regional climate model of PRECIS. The number of days with mean daily temperature above 10℃ and the mean temperature of January are usually regarded as the principal criteria to indicate temperature zones, which are sensitive to climate change. Shifts due to future climate change were calculated by comparing the latitude of grid cells for the future borderline of one temperature zone with that for baseline period (1961–1990). Results indicated that the ranges of Tropical, Subtropical, Warm Temperate and Plateau Temperate Zones would be enlarged and the ranges of Cold Temperate, Temperate and Plateau Sub-cold Zones would be reduced. Cold Temperate Zone would probably disappear at late this century. North borderlines of temperature zones would shift northward under projected future climate change, especially in East China. Farthest shifts of the north boundaries of Plateau Temperate, Subtropical and Warm Temperate Zones would be 3.1°, 5.3° and 6.6° latitude respectively. Moreover, northward shift would be more notably in northern China as future temperature increased.
LiMingxing, MaZhuguo.
Soil moisture-based study of the variability of dry-wet climate and climate zones in China
Chinese Science Bulletin, 2012,57(28/29):2740-2754.
Along the meridian of 105°E, the Chinese region are divided into two parts, east and west. The results show that in the east part of China the temperate extratropical belt, the warm extratropical belt, and the northern subtropical belt shift northward significantly, whereas the middle subtropical belt and the southern subtropical belt have less or no change. As for the northern subtropical belt, the maximal northward shift can reach 3.7 degrees of latitude. As for the warm extratropical belt, along the meridian of 120°-125°E, the maximal northward shift can reach 3-4 degrees. In the west part of China, each climatic belt changes little. Only in the Xinjiang area are the significant northward shifts. Correspondingly, it is found that in the last 50 years the traditional seasons have changed. For Beijing, Hailar, and Lanzhou, in general, summer becomes longer and winter shorter over the last 50 years. Summer begins early and ends late with respect to early 1950s. Contrary to the summer, winter begins late and ends early with respect to early 1950s. Furthermore, spring and autumn have changed over the last 50 years: with respect to early 1950s spring begins early and autumn begins late.
WuShaohong, LiuWenzheng, PanTao, et al.
Amplitude and velocity of the shifts in the Chinese terrestrial surface regions from 1960 to 2011
Based on the annual mean precipitation and evaporation data of 295 stations covering 1951-1999, the aridity index is calculated in this paper. The climatic regions in China are classified into three types, namely, arid region, semi-arid region and humid region. The number 0.20 (D) is the boundary between arid and semi-arid regions and 0.50 (D) is the boundary between semi-arid and humid climate regions. Dry and wet climate in China fluctuates markedly and differentiates greatly in each region in recent 50 years. The fluctuation amplitude is 20-400 km in Northeast China, 40-400 km in North China, 30-350 km in the eastern part of Northwest China and 40-370 km in Southwest China in recent 40 years. Before the 1980s (including 1980), climatic trend was dry in Northeast and North China, wet in the eastern part of the Northwest and very wet in the Southwest. In the 1990s dry signs appeared in the Southwest, the eastern part of Northwest China and North China. During the 1960s and 1970s dry and wet climates in China had single mutation changing wetness into drought. Moreover, drought shows an increasing trend. Dryly and wetly climatic boundary shows the fluctuation characteristics of the whole movement and the different fluctuations in East, West, South and North directions. The fluctuation of climatic boundary and the dry and wet variations of climate have 10 distinctive inter-annual features. It was drier in the 1950s, 1970s and 1990s in Southwest China, the eastern part of Northwest China (except Hexi region) and the first region in North China. It was wetter in the 1960s and 1980s.
Changes in regional moisture patterns under the impact of climate change are an important focus for science. Based on the five global climate models (GCMs) participating in the Coupled Model Intercomparison Project Phase 5 (CMIP5), this paper projects trends in the area of arid/humid climate regions of China over the next 100 years. It also identifies the regions of arid/humid patterns change and analyzes their temperature sensitivity of responses. Results show that future change will be characterized by a significant contraction in the humid region and an expansion of arid/humid transition zones. In particular, the sub-humid region will expand by 28.69% in the long term (2070-2099) relative to the baseline period (1981-2010). Under 2°C and 4°C warming, the area of the arid/humid transition zones is projected to increase from 10.17% to 13.72% of the total of China. The humid region south of the Huaihe River Basin, which is affected mainly by a future increase in evapotranspiration, will retreat southward and change to a sub-humid region. In general, the sensitivity of responses of arid/humid patterns to climate change in China will intensify with accelerating global warming.
HuangWei, YanJingjing, LiuChang, et al.
Changes in climate regimes over China based on a high-resolution dataset
The influence of climate change on the natural environmental and socio-economic system leads to a series of adverse effects. With the development of socio-economy, climate change hazards interact with the environmental and socio-economic risk bearing body and form the spatial-temporal patterns of climate change risk. The systematic expression of the spatial-temporal patterns is the scientific foundation of climate changes adaptation. Based on the RCP8.5 climate scenario data from 2021 to 2050, we analyzed the variation trend and rate of temperature and precipitation, and assessed the hazard of extreme climate events including drought, heat wave and flood. Then, economy, population, food production and ecosystem were selected as the risk bearing bodies to assess the possible impacts of climate change as the indices qualifying the comprehensive climate change risk. Under the guidance of systematic principle, predominating factor principle, as well as the space consecution principle, we proposed a scheme of three-level regional division system for the comprehensive climate change risk regionalization in China. Finally, the Chinese mainland was divided into 8 climate change sensitive zones, 19 danger zones of extreme events and 46 comprehensive risk zones of bearing body. The result shows that the climate changes high risk zones in China under the RCP8.5 climate scenario from 2021 to 2050 include North China weak warming and precipitation increased sensitive zone, North China Plain heat wave danger zone, population-economy-food high risk zone, South China-Southwest China weak warming and precipitation increased sensitive zone, Yunnan-Guizhou mountain heat wave danger zone, ecosystem-economy-food-population high risk zone; coastal South China flood-heat wave danger zone, ecosystem-food-economy-population high risk zone. The comprehensive climate change risk regionalization of China covers the climate change scenarios, the extreme events, and the possible lost information of the socio-economy and ecosystem, which can provide scientific and technological support for national and local governments to cope with the climate change and risk management.
Building the Belt and Road is initiatives of China to promote win-win international cooperation in the new era, aiming at green, health, intellect and peace and the joint development with people of the countries along the route. Systematic analysis on environmental characteristics, evolutionary tendency and future risks are certainly the scientific fundamentals of sustainable development for the Belt and Road construction. Applied remote sensing monitoring, statistical analysis, this paper investigates the regional characteristics of climate, topography, soil, hydrology, vegetation cover and terrestrial ecosystems production, as well as socio-economic conditions. Based on the regional characteristics, the Belt and Road is divided into 9 sub-regions: Central and Eastern Europe sub-region with cold and humid climate, Mongolia and Russia sub-region with cold and arid climate, Central and West Asia arid sub-region, Southeast Asia sub-region with warm and humid climate, Pakistan arid sub-region, Bangladesh-India-Myanmar sub-region with warm and humid climate, Eastern China monsoon sub-region, Northwest China arid sub-region and Tibetan Plateau sub-region. Combining modeling simulation with scenario projections, natural disaster assessment methodology is used to assess the risk of extreme events including heat waves, droughts and floods in the coming 30 years (2021-2050). Results show that, on the basis of the regional framework, the western Eurasia would be a warming trend; both sides of Qinghai-Tibet Plateau in high temperature and heat waves risk; Central and Eastern Europe sub-region with cold and humid climate in high drought risk; Bangladesh-India-Myanmar sub-region with warm and humid climate as well as Eastern China in high risk of flooding.
CaiYunlong.
A study on land use/cover change: The need for a new integrated approach
Adding the effects of changes in land cover to the A2 and B1 transient climate simulations described in the Special Report on Emissions Scenarios (SRES) by the Intergovernmental Panel on Climate Change leads to significantly different regional climates in 2100 as compared with climates resulting from atmospheric SRES forcings alone. Agricultural expansion in the A2 scenario results in significant additional warming over the Amazon and cooling of the upper air column and nearby oceans. These and other influences on the Hadley and monsoon circulations affect extratropical climates. Agricultural expansion in the mid-latitudes produces cooling and decreases in the mean daily temperature range over many areas. The A2 scenario results in more significant change, often of opposite sign, than does the B1 scenario.
Land use has generally been considered a local environmental issue, but it is becoming a force of global importance. Worldwide changes to forests, farmlands, waterways, and air are being driven by the need to provide food, fiber, water, and shelter to more than six billion people. Global croplands, pastures, plantations, and urban areas have expanded in recent decades, accompanied by large increases in energy, water, and fertilizer consumption, along with considerable losses of biodiversity. Such changes in land use have enabled humans to appropriate an increasing share of the planet's resources, but they also potentially undermine the capacity of ecosystems to sustain food production, maintain freshwater and forest resources, regulate climate and air quality, and ameliorate infectious diseases. We face the challenge of managing trade-offs between immediate human needs and maintaining the capacity of the biosphere to provide goods and services in the long term.
3 km2, while cropland decreased by 4.9×10³ km2, and the total area of woodland and grassland decreased by 16.4×10³ km2. The spatial pattern of land-use changes in China during 2010-2015 was concordant with that of the period 2000-2010. Specially, new characteristics of land-use changes emerged in different regions of China in 2010-2015. The built-up land in eastern China expanded continually, and the total area of cropland decreased, both at decreasing rates. The rates of built-up land expansion and cropland shrinkage were accelerated in central China. The rates of built-up land expansion and cropland growth increased in western China, while the decreasing rate of woodland and grassland accelerated. In northeastern China, built-up land expansion slowed down continually, and cropland area increased slightly accompanied by the conversions between paddy land and dry land. Besides, woodland and grassland area decreased in northeastern China. The characteristics of land-use changes in eastern China were essentially consistent with the spatial governance and control requirements of the optimal development zones and key development zones according to the Major Function-oriented Zones Planning implemented during the 12th Five-Year Plan (2011-2015). It was a serious challenge for the central government of China to effectively protect the reasonable layout of land use types dominated with the key ecological function zones and agricultural production zones in central and western China. Furthermore, the local governments should take effective measures to strengthen the management of territorial development in future.]]>
12 gC yr-1(yr represents year),while the average annual NPP was 120.8 gC m-2 yr-1. (2) The annual NPP in alpine grassland on the TP fluctuates from year to year but shows an overall positive trend ranging from 114.7 gC m-2 yr-1 in 1982 to 129.9 gC m-2 yr-1 in 2009,with an overall increase of 13.3%;32.56% of the total alpine grassland on the TP showed a significant increase in NPP,while only 5.55% showed a significant decrease over this 28-year period. (3) Spatio-temporal characteristics are an important control on annual NPP in alpine grassland:a) NPP increased in most of the natural zones on the TP,only showing a slight decrease in the Ngari montane desert-steppe and desert zone. The positive trend in NPP in the high-cold shrub-meadow zone,high-cold meadow steppe zone and high-cold steppe zone is more significant than that of the high-cold desert zone;b) with increasing altitude,the percentage area with a positive trend in annual NPP follows a trend of "increasing-stable-decreasing",while the percentage area with a negative trend in annual NPP follows a trend of "decreasing-stable-increasing",with increasing altitude;c) the variation in annual NPP with latitude and longitude co-varies with the vegetation distribution;d) the variation in annual NPP within the major river basins has a generally positive trend,of which the growth in NPP in the Yellow River Basin is most significant. Results show that,based on changes in NPP trends,vegetation coverage and phonological phenomenon with time,NPP has been declining in certain places successively,while the overall health of the alpine grassland on the TP is improving.]]>
QiWei, BaiWanqi, ZhangYili, et al.
Effects of ecological engineering on net primary production in the Chang Tang and Sanjiangyuan national nature reserves on the Tibetan Plateau
Long term series of remotely sensed imagery of net primary production (NPP) data could reflect ecosystem health. In this study, we employed NPP to evaluate the effects of ecological engineering (nature reserve and new ecological engineering in 2004 or 2005 techniques) by the sampling area comparison method in the Chang Tang and Sanjiangyuan national nature reserves on the Tibetan Plateau. The results showed that: (1) among the 10 pairs of sampling areas, annual NPP of 9 pairs tended to increase between 1982 and 2009; (2) the new ecological engineering techniques improved the effectiveness of ecosystem conservation, with NPP in 8 pairs of sampling areas increasing faster than before; and (3) among all alpine grassland types, the new ecological engineering techniques remarkably improved the effectiveness of conserving the meadows.
Satellite data show increasing leaf area of vegetation due to direct (human land-use management) and indirect factors (climate change, CO2 fertilization, nitrogen deposition, recovery from natural disturbances, etc.). Among these, climate change and CO2 fertilization effect seem to be the dominant drivers. However, recent satellite data (2000-2017) reveal a greening pattern that is strikingly prominent in China and India, and overlapping with croplands world-wide. China alone accounts for 25% of the global net increase in leaf area with only 6.6% of global vegetated area. The greening in China is from forests (42%) and croplands (32%), but in India is mostly from croplands (82%) with minor contribution from forests (4.4%). China is engineering ambitious programs to conserve and expand forests with the goal of mitigating land degradation, air pollution and climate change. Food production in China and India has increased by over 35% since 2000 mostly due to increasing harvested area through multiple cropping facilitated by fertilizer use and surface/ground-water irrigation. Our results indicate that the direct factor is a key driver of the
ChenYong, LiuJie, ChenQi, et al. Earthquake Hazard Analysis and Earthquake Damage Prediction. Beijing: Seismological Press, 1999.
Flood risk can, in general terms, be defined as probability time consequence. It consists of flood hazard analysis, vulnerability analysis and damage evaluation. A variety of methods have been developed and applied. Among them, Quantitative Risk Analysis (QRA) is a method of quantifying risk through systematic examination of the factors contributing to the flood hazard and affecting the severity of flood consequence, their interaction and relative contribution to the occurrence of the flood. The QRA technique is well established in many fields such as chemical engineering and hazardous materials processing. The application of QRA to flood risk is relatively new and still under development. While the basic risk assessment concepts and tools can be used, the methodologies need to be adapted. Category-based model for flood risk analysis is used to assign a value to each driven-factor such as triggering factor of rainfall, dam break, ground surface conditions of topography, land cover, and others. The keys to the model are to synthesis the spatial-referenced data and create the risk zone. The diffusion of Geographical Information Systems (GIS) technology opens up a range of new possibilities for hazard mitigation and disaster management. Microzonation is greatly facilitated by the kind of automation that GIS offers, especially as it involves comparison, indices and overlays in much the same way that GIS does. In this article, ArcInfo GIS has been chosen to quantitatively represent the influencing factors, spatialize the data into the uniform grid system, and transfer all the data item into the effect degrees on the probability of flooding. At last, with the support of Arc/Info GRID model, a categorical model for flood risk zonation has been put forward. The approach has been applied to the Liaohe river basin, the north-eastern of China, flood disaster risk zonation. The results show that the flood risk of the lower reaches of the Liaohe river is more serious than other places, which accord with the fact. The case study showes that the GIS-based category model is effective in flood risk zonation.
ZhangJiquan, LiNing. The Quantitative Method and Its Application of Risk Assessment and Management of Major Meteorological Disasters. Beijing: Beijing Normal University Press, 2007.
To achieve sustainable development, the understanding of impact of global environmental change on renewable resources and disaster frequency, strength and spatial-temporal pattern should be strengthened. In recent years, severe disasters have caused catastrophes all over the world, such as the freezing rain and snowstorm disaster that happened in China in 2008, Typhoon Sidr in Bangladesh in 2007, and Hurricane Katrina in the US in 2005. Strengthening the study of integrated disaster risk governance under the background of global environmental change has become a pressing problem of sustainable development. Supported by CNC-IHDP, the CNC-IHDP-RG workgroup proposed to the IHDP to launch a new international research project on integrated risk governance in the context of global environmental change in 2006. After two years′ efforts, the IRG Project is now accepted by IHDP-SSC to be the new core Scientific Program and it will be formally launched during the IHDP Open Science Conference held in Bonn, Germany in April, 2009. This core project will build a platform for top level researchers, government policy makers and practitioners in risk governance to exchange ideas, theories and methodologies. The research foci of this core project will be on the issues of science, technology and management of integrated disaster risk governance based on the case comparisons around the world. It is the goal of the project to make the innovations in concepts, theories and methodologies of integrated disaster risk governance, which could be useful and applied to practices of integrated disaster reduction in the real world. By proposing, preparing and organizing this important international cooperative project, it is helpful not only to promote the research results made by Chinese risk governance research community, but also to raise Chinese global environmental change research community in a highly respected position internationally.
QinDahe, ZhangJianyun, ShanChun, et al. China National Assessment Report on Risk Management and Adaptation of Climate Extremes and Disasters. Beijing: Science Press, 2015.
Based on the concept of ‘consilience’ in integrated risk governance, this paper aims to develop scientific meanings of consilience in a systemic manner from the perspectives of fundamental principles, synergistic efficacy, operational means, and optimization process to improve a system's robustness to resist external disturbs. This paper proposed a new consilience mode for the purpose of complementing the existing theoretical system of integrated risk governance. The results presented in this paper show that the four proposed synergistic principles (tolerance, constraint, amplification and diversification) can well describe the characteristics of consilience in integrated risk governance of a socioecological system. The principles set four optimization goals in terms of ‘consenting in minds’ and ‘gathering in force’ in the consilience theory. The consilience mode demonstrates how the synergistic principles and their optimization goals are converted into a series of tasks including the popularization of social perception, the rationalization of cost allocation, the systemization of optimization and the maximization of cost benefit. With implementation of all these tasks, the consensus and social welfare can be maximized while the cost and risk can be minimized in the integrated risk governance of the socio-ecological system. The modeling and simulation results show that a complex network system's robustness can be improved with increased system consilience when facing local or global disturbs. Moreover, this kind of improvement can be achieved by optimizing the structure and function of nodes in a socio-ecological system. The consilience mode also complements current disaster system theory in which the concepts of vulnerability, resilience and adaptation may face limitation of addressing integrated risk governance problems in a socio-ecological system.
In this millennium, global drylands face a myriad of problems that present tough research, management, and policy challenges. Recent advances in dryland development, however, together with the integrative approaches of global change and sustainability science, suggest that concerns about land degradation, poverty, safeguarding biodiversity, and protecting the culture of 2.5 billion people can be confronted with renewed optimism. We review recent lessons about the functioning of dryland ecosystems and the livelihood systems of their human residents and introduce a new synthetic framework, the Drylands Development Paradigm (DDP). The DDP, supported by a growing and well-documented set of tools for policy and management action, helps navigate the inherent complexity of desertification and dryland development, identifying and synthesizing those factors important to research, management, and policy communities.
Dregne HE.
Land degradation in the drylands
Arid Land Research and Management, 2002,16:99-132.
2 per year, and the change rate of different type KRD land is inverse proportion to its degree of degradation. (5) The change frequencies of moderate and potential KRD land is highest and obviously higher than that of light KRD land. The regional characteristics of KRD spatial evolution and its influencing factors are analyzed, and some suggestions on comprehensive control of KRD land are put forward.]]>
Land degradation is a major representation of global environmental change. In degraded land, people get into the trouble of PPE (poverty-population-environment) spiral. Land degradation takes various forms in China, such as land desertification, soil erosion, farmland pollution, surface mining, farmland salinization and soil fertility deterioration. Among these the former two are the most distributing and the most influencing. A great amount of poor population assembles in these lands, for example, in the karst areas of southwest China and in the Loess Plateau of northwest China. This paper especially pays more attention to the reversal of impoverishment-degradation spiral in the karst areas of southwest China. Since the PPE spiral is caused by ecological and, in particular, social factors, the solution must be in a social approach. Poverty alleviation is a systematic project with great complexities. Any single approach can not success and integrated measures should be taken. Obviously, the key to escape the vicious spiral is the reconstruction of the local ecosystem, economy and society so that the self development capacity of the local people may be enhanced. Thus the poverty can be essentially eliminated. On the other hand, it is unrealistic to let the degraded land naturally recover under the pressure of population growth and economic development. The degraded land needs ecological reconstruction through social investment, while the local economy and society should be restructured. Ecological reconstruction of the degraded land involves not only the degraded and underdeveloped localities but also developed regions. The guidelines of degraded land reconstruction should be the concepts of sustainability and economic viability, and the theory of landscape ecology. Sustainability includes the idea of a type of development that does not compromise, and even promote, the future use of land. Economic viability is profitability of the reconstructed land, although in a long term consideration. In other words, the reconstructed land and its use should obtain productivity, stability, sustainability, equability and autonomy. According to landscape ecology, reasonable land use and landscape patterns should be allocated at a macro scale, and an appropriate productivity and ecological conditions should be created at a micro scale. It is necessary, in the degraded land reconstruction, to identify different issues at different spatial scales, for example, land productivity at site, land use pattern at local, urban rural relation at a region, and economic cooperation at inter region. In temporal scale, it is necessary to establish realistic targets of short term (to emphasize viability), middle term (to get into benign spiral) and long term (to realize sustainability) respectively. As a social approach, the reconstruction of degraded land includes ideology innovation, institute transformation, and science and technology popularization.
The paper chooses the industrial city-Shuicheng basin in Guizhou province-as research site because the karst water quality around the city has become deteriorated with land use and land cover change. The natural susceptibility of karst water system is the important factor leading to karst water pollution. But the change of land use and land cover is the main factor according to the changing data of the water quality analysis and land use change. So it is a good way to protect karst water through rational planning and managing land use and land cover.
Taking Maotiaohe watershed in Guizhou province as study area, the mechanism of soil erosion was analyzed by applying basic principles and methodology of environmental economics. The economic loss of soil erosion was estimated, and the spatial distribution of economic loss caused by soil erosion was revealed, which provides scientific basis for soil and water prevention and sustainable development of the study area. The result showed that the total economic loss of soil erosion reached 36 602.44 × 10⁴ Yuan, and the losses of soil nutrient, abandoned land, water and sediment accounted for 89.46%, 4.64%,1.05%, 4.85%, respectively. Among land use types, economic loss of soil erosion was the highest in dry land, accounting for 61.94% of the total loss. Among all counties, the economic loss caused by soil erosion was the highest in Qingzhen City, accounting for 32.87% of the total. The economic loss per unit area in the study area was 1 174.86 Yuan /hm2, and was higher in the north and southwest of the study area. Ecological compensation should be put in practice in order to prevent the soil erosion and water loss.
Owing to the fragile eco- environment, terrain fragmentation, and serious soil erosion, the karst area in Southwest China is one of the distinct poor regions. Selecting Maotiaohe watershed as study area, taking villages and towns as studying unit, and using GIS and ANN model, this paper simulates the spatial distribution of natural impoverishing index and socio- economic alleviating impoverishing index, calculates the poverty degree of villages and towns, and reveals the spatial distribution of poverty in order to provide scientific basis for eliminating poverty and ecological reconstruction. The results show that the natural factors such as soil erosion and so on are the main impoverishing indexes, and socio- economic factors are the main alleviating impoverishing indexes. The villages and towns with smaller poverty degree are mainly distributed in the middle and east area of Maotiaohe watershed, and those with larger poverty degree are mainly distributed in the southern and northern area of Maotiaohe watershed. The results also indicate that application of BP neural network to simulating regional poverty is convenient, precise and feasible, which can be an alternative approach to simulating regional poverty.
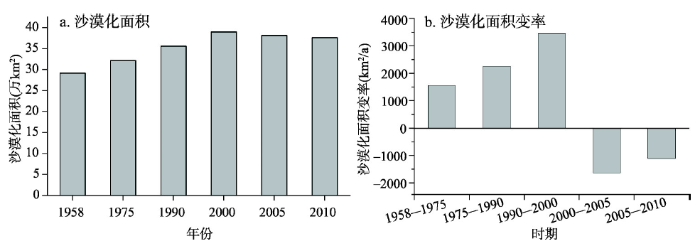
The data of aeolian desertification lands status in different periods have been extracted through visual interpretation method based on Landsat MSS, TM/ETM images in 1975, 1990, 2000, 2005 and 2010 over the northern China areas. Hence, we analyzed the changing trend of aeolian desertification in northern China during the last 35 years, and have got some results as follows: (1) The area of aeolian desertification lands in northern China in 2010 are 37.59×10⁴ km2, among which the slight grade accounts for 33.80%, the moderate grade for 22.84%, the severe grade for 22.16%, and the extremely severe grade for 21.21%. (2) From 1975 to 1990, the net increase area of land desertification area of northern China was 33 838.32 km2 with an increasing rate of 2 255.89 km2·a-1; the net area of land desertification lands being intensified was 33 279.28 km2; thus the net developing rate was 4 474.51 km2·a-1. From 1990 to 2000, the net increasing rate of land desertification area was 3 441.49 km2·a-1 and net developing rate was 5 370.06 km2·a-1. Since 2000, there was a recovering trend of land desertification lands in northern China. From 2000 to 2005, the net area decreasing rate was 1 635.28 km2·a-1, and the net reversion rate was 10 071.02 km2·a-1. From 2005 to 2010, the net area decreasing rate was 1 114.35 km2·a-1, and the net reversion rate was 7 552.21 km2·a-1. Changes of land desertification mainly occurred in the agro-pasture ecotone of semi-arid area.]]>
The sandy deserts which occupy about 7.7% of total land area in China have been investigated and studied with great concern by Chinese scientific personnels ever sinee the founding of People's Eepublic of China in 1949. Major contributions of these research works are summarized in the following six areas:1. Source of parent materials of the desert sands and process of formation of the sandy dunes;2. Environmental changes during historical time;3. Chief characteristics of major Chinese sandy deserts;4. Sand control in farmlands;5. Sand control along railways;6. Better use of natural resources and the establishment of new oases.
Soil erosion is an interaction of multi factors including wind, vegetation, soil characteristics, land use, precipitation, micro-geomorphology and so on. It is a continuous dynamic process occurring on airflow-soil interface in the specific geographical locations. Soil erosion empirical model, based on statistic theory, is difficult to avoid overlap of some factors affecting soil wind erosion between sub-models and not enable sub-models to be strictly independent from each other, thereby leading to lack of theoretical basis for modeling. Such empirical model is also not able to objectively reflect dynamic process of soil erosion. On the basis of clarifying basic concepts of soil erosion and analyzing the global research background and inadequacy, we proposed a new theoretical framework for soil erosion models based on wind erosion dynamics theory and the classification as well as representation of factors affecting soil wind erosion under the framework. We also elaborated the rationality of both the framework and the classification as well as the representation of factors affecting soil wind erosion, and further explored the research approaches on the latter.
AbstractIn the present work the episodic appearance of Saharan dust in the Hungarian aerosol has been investigated using our 1991–2000 aerosol data obtained with proton-induced X-ray emission elemental analysis. For selecting local episodes of Saharan origin three different approximations have been applied. On the one hand, episodes have been selected in the time series of concentration ratios Ti/Ca, Si/Al, Al/Ca, Ti/Fe, Si/Fe, Ca/Fe generally accepted as regional signatures of Saharan dust. Remarkable similarity has been found between Italian and Hungarian observations of Saharan dust episodes in spring 1991. The tracing power of the regional signatures generally accepted as fingerprints of Saharan dust was found to be limited in the present region due to anthropogenic effects during transport. On the other hand, either backward air trajectories or TOMS aerosol index data from NASA satellites NIMBUS7 and EARTH PROBE have been used as additional tool for assigning local effects to Saharan sources. A nine-month overlap in the application of trajectories and TOMS maps permitted us to compare the applicability of these selection tools. During the period considered we assigned nearly 50 local episodes to Saharan sources. Data are presented for the frequency, the probable source areas and the seasonal distribution of Saharan episodes in the Hungarian atmosphere.]]>
Soil wind erosion can be influenced by wind regime,vegetative cover,soil moisture content,soil texture,cultivation,grazing,and collection of fuelwoods etc..By the wind tunnel experiment,the influences of these factors on wind erosion are quantitatively and semi-quantitatively studied Experimental results showed that the erosive intensity of sand-carrying wind is 4.36-72.9 times higher than that of the wind without sand at the same wind velocity.The high soil moisture content favours wind erosion control.The erosive intensity of semi-fixed sandy land is 12.9 and 2.84 times higher than that of the aboriginal grassland and the vegetated sandy land respectively.Under the same physical conditions,the irrational human activities,such as over-cultivation,over-grazing and undue collection of fuelwoods,can greatly accelerate the natural wind erosion.Wind erosion process is an intergrated phenomenon related with many natural factors and human ones,human factors play an important role in wind erosion,the wind erosion loss caused by human factors occpies 78.6% of the total value and that caused by natural factors occupies 21.4%.
Wind erosion has played the major role in shaping Mu Us landscape. Although Mu Us Sand land is a hot spot, of research, the detail of wind erosion in Mu Us has been poorly understood. On the basis of observations in Mu Us Desert, we determine the threshold of wind velocity and present sand transport equations on bare and vegetated land. Furthermore, we discuss the quantitative relationship between vegetation cover and sand transport. We get a quite good understanding of the effect of vegetation on wind erosion.
MeiFanmin. Experimental Observation and Numerical Simulation of Wind Erosion Dust Release in Typical Regions of Northern China. Xi'an: Press of Northwestern Polytechnical University, 2013.
The Leading Office of First-ever Nationwide Water Resources Survey of the State Council. No. 6 Training Materials of First-ever Nationwide Water Resources Survey. Beijing: China Water & Power Press, 2010: 94-117.
ZhaoQiguo, et al. Temporal-spatial Changes, Mechanism and Controlling Counter Measures of Soil Degradation in Hilly Red Soil Region of Eastern China. Beijing: Science Press, 2002.
CaiQiangguo, WangGuiping, ChenYongzong. Process and Simulation of Erosion and Sediment Production in Small Watershed on the Loess Plateau. Beijing: Science Press, 1998.
WangZunqin. Research on Agricultural Development Strategy and Comprehensive Management of Natural Wenyanqu Basin. Beijing: Science Press, 1987: iii-iv.
An active measure of protecting frozen soils, namely cooling foundation, is put forward in order to face the severe challenge of high temperature frozen soil and world warming, and to insure the stability of engineering in cold regions. The feasibility of the measure is analyzed and discussed in the aspects of roadbed of ventilation duct, the ballast revetment and ballast roadbed, the roadbed of heat pipe, the roadbed of awning, development and application of heat preservation materials of thermal semiconductor and application of artificially freezing technology, respectively. It is found that as a technology of actively adjusting and controlling temperature in foundation, the measure is effective in different ranges, able to effectively raise permafrost table and can insure the stability of frozen soil foundation. So, it is a feasible method and can be applied to constructions in cold regions.
Climate Warming and human activity bring out a great influence on permafrost along Qinghai-Tibet highway. For example, the temperature of permafrost rises, the thickoness of permafrost eliminate, disconhnuous permafrost retreats toward north and so on. These changes seriously disturb and affect the stability of Qinghai-Tibet highway. Meanwhile, considering these changes and engineering stability, the stability of Qinghai-Tibet highway is divided into six zones: 1) very stable zone; 2) stable zone; 3) basically stable zone; 4) basically stable passing zone, 5) unstable zone; 6)extreme unstable zone.
Due to that the roadbed of the high-speed railway does not allow the serious deformation,the design of filling material and its anti-frost ability have become an important technical problem in the seasonally frozen regions. According to the referring and analysis for the frost-sensitive classification and the anti-frost method of roadbed filling material in different industries at home and abroad,the frost classification of filling material of the high-speed railway roadbed which is suitable for the seasonally frozen regions in China is discussed combining the specific engineering case,Harbin—Dalian passenger special line. About 70% frost heave amount of the high-speed railway roadbed is found at the upside of underlying roadbed by measured data and analyzing the distribution of frost heave amount along the frozen depth. The result will be used to estimate the thickness of anti-frost layer. The result calculated by the finite element method shows that the maximum frozen depth using modified materials A and B is less about 20 to 30 cm than that using common materials A and B,additionally the warming in the former is quicker than that in the latter. The results above also indicate that the roadbed using modified filling materials has good effects to heat preservation and temperature rising.
Harbin-Dalian High-Speed Railway, crossing Northeast China, is the first new-built and operating high-speed railway in cold regions around the world. The subgrades of the railway were treated with filling material replacement and taking waterproof measures and so on to prevent frost damages. For evaluating the effects of the frost heaving prevention and engineering operation status of the subgrades, the monitoring data during the first freeze-thaw period (2012-2013) from 9,641 monitoring points along the railway were analyzed. The occurrence, development and changing of the frost heaving were summarized. It is found that the development of the frost heaving includes the rapid growing stage, the stable frost heaving stage and the thawing settlement stage. The frost heaving deformation occurs along the whole line, but the frost heaving amount, great or small, is under control. The frost heaving degrees are related to the subgrade structures. The frost heaving occurs mainly in shallow part of a subgrade base, and its damage degree depends on the subgrade structure. On the whole, the frost heaving in the transition section is slight, followed by that in the embankments, and it is most serious in the cutting sections or in the base-plate jointing parts. As engineering treatments against frost heaving, it is suggested to focus on reducing surface water infiltration and control frost heaving deformation of the subgrade base. And in the designing of high-speed railway in seasonal frozen soil regions, bridges are strongly recommended instead of subgrade, and to modify the upper layer of the subgrade to no frost heaving structure.
i be the direction of a river section and Li correspounding langth. A concept of concentrated degree is introduced as following: where {λ-k,......,λ0,......,λk} are a group of powers, λi=λ-i>0, λ0 is maximum of {λi}, and if j>i, then λj<λi. Obviously, reflects the concentrated degree of the directions of a river network at θm. The prefferred directions can be calculated by the following steps:1) compute 2) Suppose Max/n = a1, look for the maximum of , where n varies in (0°, 180°), (α1-45°, α1+45°) 3) Denote A=(α1+α2)/2, B=A+90, then compute new concentrated degree . in and 4) Suppose β1=max , then β1 is the first preffered direction. Similarly, if β2=max, then β2 is the second preffered direction. By computing it is found that the choice of power {λi} is important. We call η=λ0/λk by propertion of amplitude. η can be taken near 1 when the variance of data is rather small, on the contrary, it should be taken rather more.utational method. Let θi be the direction of a river section and Li correspounding langth. A concept of concentrated degree is introduced as following: where {λ-k,......,λ0,......,λk} are a group of powers, λi=λ-i>0, λ0 is maximum of {λi}, and if j>i, then λj<λi. Obviously, m reflects the concentrated degree of the directions of a river network at θm. The prefferred directions can be calculated by the following steps:1) compute m 2) Suppose Max/n =al, look for the maximum of , where n varies in (0°, 180°), (α1-45°, α1+45°) 3) Denote A=(α1+α2)/2, B=A+90, then compute new concentrated degree z. in and 4) Suppose β1=max , then β1 is the first preffered direction. Similarly, if β2=max, then β2 is the second preffered direction. By computing it is found that the choice of power {λi} is important. We call η=λ0/λk by propertion of amplitude. η can be taken near 1 when the variance of data is rather small, on the contrary, it should be taken rather more.]]>
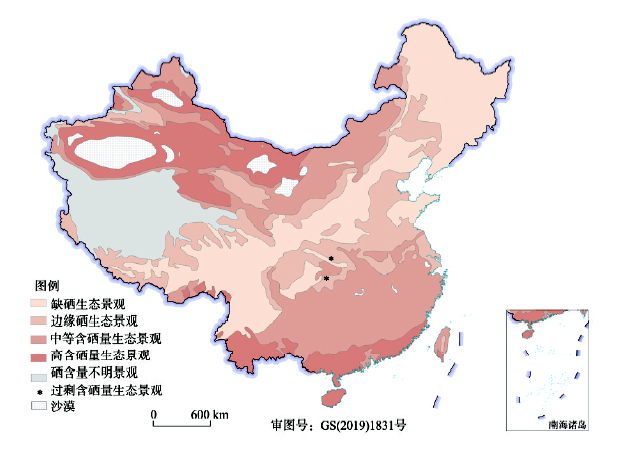
P<0.05). The low soil selenium content in KBD areas was the critical reason leading to the low selenium level in grain and human bodies in these areas, and the KBD prevalence in Tibet. Therefore, to improve soil environment and to increase soil selenium content would be the critical way to prevent the KBD prevalence in Tibet. Moreover, selenium supplement could obviously improve the selenium content of children’s hair, and prevent and control KBD effectively. However, this supplement should be insisted on longtime.]]>
Kashin-Beck disease (KBD), which is still active and severe in the Tibetan Plateau, is considered to be a kind of selenium (Se)-deficient disease. Highland barley as the most popular staple food in the Tibetan Plateau is one of the dominant Se sources for local people. To improve Se levels in crops in the Tibetan Plateau KBD area, the distribution and translocation of Se from soil to highland barley in both non-KBD and KBD endemic areas were investigated. The results showed that Se levels in highland barley were too low to meet the minimum requirements of human for daily intake of Se. The total Se concentrations of highland barley fractions in KBD areas were lower than that in non-KBD areas (grain P = 0.238; straw P = 0.087; root P = 0.008). However, no significant difference was observed in corresponding cultivated soil Se between the two areas (P = 0.993). The calculation of Se transfer factors indicated that the restricting step for Se translocation was from soil to root. Water-soluble, exchangeable and fulvic acid-bound Se fractions in the soil are key species dominating in this transfer process, according to their significant correlations with root Se. Se transfer from soil to root significantly increases as the pH value of soil increases (P = 0.007), and soil organic matter content decreases (P = 0.019). The information obtained may have considerable significance for proposing effective agricultural measures to increase grain Se in KBD endemic areas.
GuoYanan, LiHairong, YangLinsheng, et al.
The relationship between environment selenium characteristic and distribution of Kaschin-Beck disease in the Yarlung Zangbo River banks
Chinese Journal of Endemiology, 2017,36(7):494-497.
The Committee of Endemic Diseases and Their Environments in the People's Republic of China. Atlas of Endemic Diseases and Their Environments in the People's Republic of China. Beijing: Science Press, 1989.
Based on the data of plague in China since 1840, nine appropriate indictors are selected, which are total number of plague, total number of plague deaths, annual average of number of plague cases, annual average plague deaths, the number of plague occurring years, the number of human plague epidemic sites during the highest incident years, total number of human plague epidemic sites, incidents times for epidemic sites of human plague, and case fatality rate. The data of nine indictors show non normal distribution through distribution tests, so we establish the standards to divide the grades for all the plague indictors by the way of percentile. The spatial distribution features of each plague indicators are studied by using GIS. Moreover, a comprehensive indicator to assess plague for different areas is made through the method of factor analyzing, which is applied for regionalization of the plague in whole China. The results indicate that there are two plague prevalent regions: north of China and south of China in the past. In south of China, Yunnan, Fujian, Guangxi and Hainan provinces were seriously prevalent plague areas; Jilin, Inner-Mongolia, Shan’xi provinces, in north of China, were also seriously prevalent plague areas. At present, almost all the plague areas are controlled, but there are still a few cases of plague in west especially in the south west of China. The comprehensive evaluation of plague will be benefit for watching out of plague prevalence and convenient for plague management according to various grades of different areas.
The development models in the rapid growth areas along China coast after reform and opening up to the international market include two models, one of which is called the Jiangsu-Zhejiang model. This means that the principle power for economic development in these regions mainly relies on regional and domestic markets rather than on oversea ones. The economic development of the township enterprises and the coordination between the internal and external regions are the two characteristics in Zhejiang Province and Jiangsu Province. The local industrial clusters in Wenzhou, Zhejiang province, which has generated high rate of regional economic development, are now confronted with new challenges in the globalization age, because most local enterprises are middle and small sized ones and are engaged in traditional industrial productions, such as shoes, glasses, clothes and other commodities. However, the globalization will consolidate the important role of locally industrial system played in the regional development, rather than weaken it as some people have supposed to be. The main concern of this paper is firstly devoted to discuss the features of local networks in Wenzhou city, and then by employing the two cases, it is argued that local industrial clusters can maintain and further improve their competitiveness by expanding their national and global networks which are deeply embedded in local networks, as well as by keeping the dynamic capability of learning and innovation which is oriented to upgrade the local traditional industry. Furthermore, it is suggested local enterprises to develop networks which represent a set of selective and explicit linkages between one firm and others with which it has technological and marketing relations as well as other social and cultural linkages, aiming at mutual advantages. Such linkages may take a material or a non material form and include supplier user relationships, subcontracting, production sharing, joint ventures, licensing agreements, and R&D collaboration, etc. This finding has important implications for the regional development and industrial structure adjustment ongoing in China.
Drinking water and burning coal endemic arsenism as a severe disease is confirmed by National Ministry of Health in China in 1992. It is not uniform survey of the disease for the whole country from its report in 1980 in xijiang. Therefore National Ministry of Scientific and Technology in China supports to study on distribution of endemic arsenism in 21 provinces in China, so that it can know the basic distribution of endemic arsenism in China, and the data results will be a guide for the disease prevention and control. The project used environmental epidemiology study including retrospective epidemiology, present situation survey of the disease in severe areas and sampling investigation in unknown areas, collecting data of exposure population and arsenism cases. At the same time, the data of arsenic level in environment were collected, and environment samples were analyzed by standard chemical method. The both data were statistical analysis by access database and SAS procedure in computer. Through the study, it achieves the expected aim that grasps spreading distribution of drinking water arsenism and burning coal arsenism, including arsenic level in water, coal, food and air, as well as patient's condition of the disease at macroscopic. Drinking water endemic arsenism distributed in 8 provinces, 40 counties, affecting 2,343,238 peoples, among 522566 peoples expositing to the drinking water arsenic higher than 0.05 mg/L, and 7821 arsenism patients were diagnosed. Burning coal endemic arsenism spreads in 2 provinces, 8 counties, affecting 333905 peoples, 48438 peoples exposing to high arsenic of burning coal pollution, and 2402 peoples causing chronic arsenic poising by coal burning. Drinking water endemic arsenism: Nemeng, Shanxi is a severe drinking water endemic region also. Wusu city in Xinjiang is old arsenism area, which reformed drinking water to decrease arsenic, so chronic arsenic poisoning condition decreasing. Reforming drinking water measures to decreees arsenic were performed in some areas of Neimeng and Shanxi. On other hand, 1 county of Jilin and 1 county of Ningxia as drinking water arsenism areas were affirmed. 11 counties of Shanyi, 1 Banner of Nemeng, 1 city of Jilin, 1 county of Qinhai and 1 counties of Anhui province were discovered for new drinking water arsenism areas in this survey. Shunyi district of Beijing has high arsenic in drinking water. Otherwise, high arsenic content in drinking water in some areas decreased to lower than 0.05 mg/L, which including some villages of Liaoning province, Tongxing city of Zhejiang province, and Tianzhu village of Shunyi district in Beijing. Blackfoot disease related to high arsenic in drinking water in Taiwan province does not include in this study. Burning coal endemic arsenism: Guizhou province has a typical burning coal arsenism areas in China and world. Although to reform stove and decreasing arsenic pollution, but the chronic arsenic poisoning from domestic coal combustion exists, because it located high seal level and poor areas. Some new burning coal arsenism areas in Shanxi province were found, which produced air pollution and food pollution of arsenic from domestic coal combustion for cooking and heating. The paper summarizes the arsenic distribution levels in drinking water and in environment of burning coal. At the same time, preventive and control measures of endemic arsenism were provided.
To investigate the interaction between skin lesion status and arsenic methylation profiles, the concentrations and proportions of arsenic metabolites in urine and arsenic methylation capacities of study subjects were determined. The results showed that the mean urinary concentrations of iAs (inorganic arsenic), MMA (monomethylarsonic acid), DMA (dimethylarsinic acid), and TAs (total arsenic) were 75.65, 68.78, 265.81, and 410.24 mug/L, respectively, in the skin lesions subjects. The highest values were observed in the multiple skin lesions subjects. Higher %iAs and %MMA, and lower %DMA, PMI (primary methylation index), and SMI (secondary methylation index) were found in skin lesions subjects. The multiple skin lesions subjects had highest %iAs and %MMA, and lowest %DMA, PMI, and SMI. The prevalence of skin lesions strongly, positively correlated with arsenic levels in drinking water. The elder persons also had higher frequency of skin lesions compared with younger persons. It can be concluded that arsenic levels in drinking water significantly affected the prevalence of skin lesions. Male subjects usually had higher proportions of skin lesions when compared with female subjects. Moreover, it may be concluded that MMA was significantly related to single skin lesion, whereas DMA and iAs were associated with multiple skin lesions. It seemed that MMA had greater toxicity to hyperkeratosis, whereas DMA and iAs had higher toxicity to depigmentation or pigmentation. (c) 2015 Wiley Periodicals, Inc. Environ Toxicol 32: 28-36, 2017.
WeiBinggan, YuJiangping, KongChang, et al.
Effects of arsenic methylation and metabolism on the changes of arsenic-related skin lesions
Environmental Science and Pollution Research, 2018,25:24394-24402.
Little was known about the arsenic metabolism and arsenic methylation associated with the changes of skin lesions after reducing the arsenic in drinking water (WAs). Therefore, urinary concentrations and proportions of arsenic species were determined for recovery (RC), improvement (IC), persistent (PE), aggravation (AC), new incidence (NC), and no sign (HC) groups based on the changes of skin lesions between before (in 2004) and after (in 2017) WAs reduction. The results indicate that the urinary concentrations of inorganic arsenic (iAs), monomethylarsonic acid (MMA), dimethylarsinic acid (DMA), and total arsenic (TAs) were much higher for RC and IC groups than for the other groups in 2004, while these values varied slightly among the groups in 2017. The urinary %iAs of all the groups was significantly decreased after WAs reduction. In contrast, the urinary %DMA of RC, IC, AC, and NC groups was increased. From 2004 to 2017, the PE and HC groups had lower decrease rate of %iAs and %MMA, and increase rate of %DMA, primary methylation index (PMI), and secondary methylation index (SMI) after WAs reduction. The adjusted odd ratios (ORs) showed that the RC, IC, AC, and NC groups were positively related with %iAs and %MMA and were negatively correlated with %DMA, PMI, and SMI before WAs reduction. It can be concluded that higher urinary %iAs and %MMA before WAs reduction increased the probability of skin lesions recovery and improvement, and the risks of skin lesions aggravation and incidence. Higher increase rate of urinary %DMA was positively associated with of skin lesions recovery and improvement. Moreover, higher urinary %iAs and %MMA or lower increase rate of urinary %DMA might increase the risk of skin lesions aggravation.
YangLinsheng, WangWuyi, HouShaofan, et al.
Effects of selenium supplementation on arsenism: An intervention trial in Inner Mongolia
Environmental Geochemistry and Health, 2002. 24(4):359-374.
This paper reports the effects of a placebo-controlled Se-enriched yeast supplementation trial, conducted for 14 months, on arsenism in adult farmers living in a rural community in Inner Mongolia, China. The farmers had been naturally exposed to elevated concentrations of As in drinking water from tube-wells since 1983 but changed to arsenic-free drinking water when the trial began in June 1996. Blood and hair Se and As concentrations were analysed pre-intervention and at the end of the 3rd, 9th and 14th month, while skin lesions were assessed pre-intervention, as well as at the end of the 14th month, using the Arsenism Clinical Criteria established by the Ministry of Health, China. As the trial was a voluntary one, a number of farmers did not routinely have their blood and hair samples taken for analysis. Consequently, the data have been analysed in two categories. Fifty-four farmers from the Se-group and 29 from the placebo-group who were sampled on each occasion were considered as one group, which has been compared with the second group comprising up to a total of 100 farmers in the Se-group and 86 in the placebo-group. Results calculated for those farmers who were sampled on each occasion, showed that at the end of the trial, blood and hair Se concentrations of the Se-group increased from 0.130 to 0.186 µg ml–1 and from 0.431 to 0.502 µg g–1, respectively, while those of the placebo-groups remained constant. Blood and hair As concentrations of the Se-group decreased from 0.051 to 0.015 µg ml–1 and from 2.57 to 0.680 µg g–1, respectively, a greater reduction than those in the placebo-group that went from 0.064 to 0.024 µg ml–1 and from 2.62 to 1.25 µg g–1, respectively. When the data from all patients were examined, the analytical trends were similar. An evaluation of skin lesions in the category who were sampled for hair and blood on each occasion showed that 41.2% of hyperkeratosis, 50.0% of depigmentation and 44.7% of pigmentation in the Se-group improved one or more degrees, while those in the placebo-group improved by only 7.1, 12.0 and 6.7%, respectively. A total of 61.1% of the adults in Se-group improved in one or more type of skin lesion, but only 17.2% improved in the placebo-group. Comparable results were obtained when all the data from both categories of farmers were examined. Results from the trial showed that Se supplementation was more effective for the improvement of adults who were affected by double or triple skin lesions. In the placebo-group, most of the severely affected adults improved in only one kind of skin lesion, but in the Se-group, more adults improved in two or three kinds of skin lesions. Although the trial was limited by its relatively small size, the results have provided some evidence of the usefulness of Se supplementation for people affected by arsenism.]]>
YuJiangping, WangWuyi, FengFujian, et al.
Expiration of prevention action of coating technique on fluoride and sulfur pollution from civilian high-fluorine stone coal
Survey Report on the Development of Field Stations of the Chinese Academy of Sciences. 2014. http://www.cas.cn/ggzy/kycx/ywtz/201409/t20140905_4198278.
Following the emergence of large numbers of spatiotemporal datasets, the literatures related to spatiotemporal data analysis increase rapidly in recent years. This paper reviews the literatures and practices in spatiotemporal data analysis, and classifies the methods available for spatiotemporal data analysis into seven categories: including geovisualization of spatiotemporal data, time series analysis of spatial statistical indicators, coupling spatial and temporal change indicators, detection of spatiotemporal pattern and abnormality, spatiotemporal interpolation, spatiotemporal regression, spatiotemporal process modelling, and spatiotemporal evolution tree. We summarized the principles, input and output, assumptions and computer software of the methods that would be helpful for users to make a choice from the toolbox in spatiotemporal data analysis. When we handle spatiotemporal big data, spatial sampling appears to be one of the core methods, because (1) information in a big data is often too big to be mastered by human physical brain, so has to be summarized by statistics understandable; (2) the users of Weibo, Twitter, internet, mobile phone, mobile vehicles are neither the total population nor a random sample of the total population, therefore, the big data sample is usually biased from the population, and the bias has to be remedied to make a correct inference; (3) the data quality is usually inconsistent within a big data, so there should be a balance between the variances of inferences made by using data with various quality and by using small but high quality data.
... 土地是人类活动的载体,土地利用/覆被变化(Land Use and Land Cover Change, LUCC)集中反映人类活动和自然因子变化及其相互作用与影响,LUCC在全球气候环境变化和可持续发展中占有重要地位[38,39,40,41].研究中国社会经济快速发展带来的土地利用/覆被的巨大时空变化,为中国人地关系的协调发展提供大力支持. ...
土地利用/土地覆被变化研究: 寻求新的综合途径
1
2001
... 土地是人类活动的载体,土地利用/覆被变化(Land Use and Land Cover Change, LUCC)集中反映人类活动和自然因子变化及其相互作用与影响,LUCC在全球气候环境变化和可持续发展中占有重要地位[38,39,40,41].研究中国社会经济快速发展带来的土地利用/覆被的巨大时空变化,为中国人地关系的协调发展提供大力支持. ...
The importance of land-cover change in simulating future climates
1
2005
... 土地是人类活动的载体,土地利用/覆被变化(Land Use and Land Cover Change, LUCC)集中反映人类活动和自然因子变化及其相互作用与影响,LUCC在全球气候环境变化和可持续发展中占有重要地位[38,39,40,41].研究中国社会经济快速发展带来的土地利用/覆被的巨大时空变化,为中国人地关系的协调发展提供大力支持. ...
Global consequences of land use
1
2005
... 土地是人类活动的载体,土地利用/覆被变化(Land Use and Land Cover Change, LUCC)集中反映人类活动和自然因子变化及其相互作用与影响,LUCC在全球气候环境变化和可持续发展中占有重要地位[38,39,40,41].研究中国社会经济快速发展带来的土地利用/覆被的巨大时空变化,为中国人地关系的协调发展提供大力支持. ...
Global land change from 1982 to 2016
1
2018
... 土地是人类活动的载体,土地利用/覆被变化(Land Use and Land Cover Change, LUCC)集中反映人类活动和自然因子变化及其相互作用与影响,LUCC在全球气候环境变化和可持续发展中占有重要地位[38,39,40,41].研究中国社会经济快速发展带来的土地利用/覆被的巨大时空变化,为中国人地关系的协调发展提供大力支持. ...
Desertification area (a) and variability (b) in China from late 1950s to 2010 (according to Wang Tao et al. <sup>[<xref ref-type="bibr" rid="b113">113</xref>]</sup>)Fig. 1
Desertification area (a) and variability (b) in China from late 1950s to 2010 (according to Wang Tao et al. <sup>[<xref ref-type="bibr" rid="b113">113</xref>]</sup>)Fig. 1
... 注:a夏季风强—人类活动强—沙漠化扩张—沙尘暴强时期;b夏季风弱—人类活动弱—植被恢复—沙尘暴弱的时期. A schematic diagram of the response of sandstorms to human activities and Asian monsoon changes in the eastern monsoon marginal region of China (according to Chen<sup>[<xref ref-type="bibr" rid="b130">130</xref>]</sup>)Fig. 2
... 注:研究区包括被解释变量Y以及空间分层X两个图层;X可用于表达地理分类或分区;$\bar{Y}$、$σ^{2}$为整个研究区的均值及方差,$\bar{Y}_{h}$、$σ^{2}_{h}$为第h个层的均值及方差. Principle of geodetector (according to Wang Jinfeng et al.<sup> [<xref ref-type="bibr" rid="b273">273</xref>]</sup>) (The study area consists of two layers: the explained variable <i>Y</i> and the spatial stratification <i>X</i>; <i>X</i> can be used to express geographical classification or partitioning. $\bar{Y}$ and $σ^{2}$ are the mean value and variance of the entire study area, $\bar{Y}_{h}$ and $σ^{2}_{h}$ are the mean value and variance of the <i>h </i>layer)Fig. 5
... 注:研究区包括被解释变量Y以及空间分层X两个图层;X可用于表达地理分类或分区;$\bar{Y}$、$σ^{2}$为整个研究区的均值及方差,$\bar{Y}_{h}$、$σ^{2}_{h}$为第h个层的均值及方差. Principle of geodetector (according to Wang Jinfeng et al.<sup> [<xref ref-type="bibr" rid="b273">273</xref>]</sup>) (The study area consists of two layers: the explained variable <i>Y</i> and the spatial stratification <i>X</i>; <i>X</i> can be used to express geographical classification or partitioning. $\bar{Y}$ and $σ^{2}$ are the mean value and variance of the entire study area, $\bar{Y}_{h}$ and $σ^{2}_{h}$ are the mean value and variance of the <i>h </i>layer)Fig. 5


