

1 引言
大量研究探索了步行的潜在相关性和决定因素,越来越多的实证研究为建成环境与步行行为之间的联系提供了证据。来自西方发达国家的实证表明步行和特定建成环境如人口和就业密度[8]、混合土地利用[9]、街道连通度[10]、人行道[11]或日常生活设施的可达性与邻近度[12,13]、邻里类型[14]、安全性及步行环境的美学设计[15]等因素之间具有联系。近年来,关于公共交通使用和步行行为之间的关联研究逐渐成为关注的焦点。研究发现公共交通使用与步行和体力活动正相关[16,17,18,19],仅通过与公共交通相关的步行就能提高公共交通用户的身体活动水平[20,21]。与那些不使用公共交通的人相比,公共交通用户和通勤者达到国际体力活动推荐量的几率要高出2到8倍[22,23]。但这些研究主要关注的问题是公共交通用户是否会有更多的步行和体力活动,对于建成环境中公共交通可达性,尤其是城市轨道交通站点邻近度对步行行为的影响研究不足。Ewing等使用Meta方法,分析了2010年以前关于建成环境和出行行为的200多篇实证文献,发现只有3项研究将步行作为因变量,同时将到公交站点的距离作为自变量[24]。目前国际上相关研究还存在以下几个主要的局限:
其次,对自选择效应(Self-Selection)的控制问题。自选择已经成为建成环境和出行行为研究中一个不可回避的科学问题。建成环境与步行行为之间的联系可能来源于自选择效应[29,30]。例如,有公交和步行偏好的城市居民,在选择居住地时会有意地选择公交和步行便利的社区。在这种情况下,影响他们出行行为和模式的可能是他们的态度和偏好,而不一定是社区公交设施的属性或建成环境。如果不控制自选择,它的影响将会掺杂到公共交通和建成环境的效应中,导致难以揭示真实的影响机理[31]。尽管自选择问题是国际上出行行为研究领域的前沿和热点之一,但建成环境对步行行为的影响研究中,只有部分研究控制了自选择。在关于中国的实证研究中,更是缺乏对自选择效应的考虑。仅有研究中,李琬等主要关注的是轨道交通对出行方式选择的影响[32],杨文越等关注的是自选择和建成环境对出行碳排放的影响[33]。
当前,北美和欧洲关于城市与公共交通发展的相关理论已经在中国激发了许多以公共交通为导向的建设计划,旨在促进可持续出行行为和城市可持续发展,尤其是近年来城市轨道交通建设成为重点。截至2018年12月31日,中国大陆共有32座城市开通地铁,开通运营总里程达到5123.3 km,运营车站3255座[46]。按照《“十三五”现代综合交通运输体系发展规划》,到2020年全国城市轨道交通运营总里程预计达到6000 km。在新型城镇化建设和绿色交通发展背景下,城市轨道交通不仅局限于满足出行需求的基本功能,更承担着引导出行模式转变和促进城市可持续发展的战略性作用和责任。然而,在中国城市发展背景下,公共交通尤其是城市轨道交通的建设和发展,究竟能否促进步行行为的增加,还缺乏实证证据。因此有必要研究中国城市的轨道交通建设和建成环境与居民步行行为之间是否存在与发达国家相同的规律。
为此,本文基于西安的微观调查数据试图回答以下研究问题:第一,控制了自选择效应后,城市轨道交通和建成环境对居民步行出行是否具有显著影响?第二,城市轨道交通和建成环境是否会以不同的方式影响不同目的的步行(交通步行和休闲步行)?第三,剥离开建成环境的影响后,城市轨道交通本身对于步行行为是否具有独立影响?
2 数据和方法
2.1 研究设计
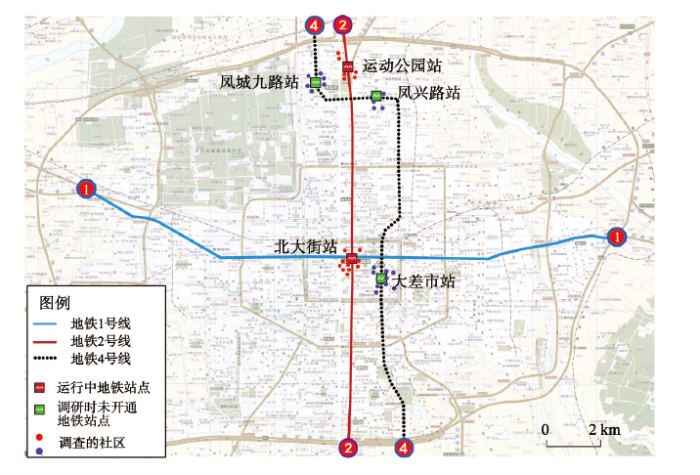
本文采用匹配对照的准实验研究设计,其在社会科学研究领域有广泛的应用[47]。该方法要求将被观察者分为两组:第一组具有研究者所感兴趣的特征(案例组);而另一组不具有这种特征但其他属性和第一组相似(对照组)。在对样本的行为数据进行统计处理后,两组之间的差异就是该特征对行为的平均处理效应。本文将样本分为两组:居住在地铁社区的居民(案例组)和居住在非地铁社区的居民(对照组)。由于问卷调查时,西安仅开通1号线和2号线两条地铁线路,3号、4号和9号线正在建设中。本文选取了沿2号线(已开通)和4号线(在建)两条相邻公共交通廊道上城市中心区和郊区各两个地铁站点1 km缓冲区内的59个居住社区的居民进行问卷调查。其中地铁站北大街(2号线)和大差市(4号线)位于城区,而体育公园(2号线)、凤城九路、凤兴路(4号线)位于城区外。主要调研社区的空间分布如图1所示。
图1
2.2 变量及数据采集
本文以西安市为研究对象,基础数据主要来自于课题组2014年实施的西安市建成环境与居民出行行为问卷调查。调查问卷主要包括居民对建成环境的感知、出行态度偏好、日常出行和基本社会经济属性信息4部分内容。完成一份问卷的时间大约为20~30 min。问卷调查前,对25名本科生和研究生组成的调查组进行了培训。调研组招募了30名目标社区的居民,对调查进行了预测试,并根据他们的反馈对调查问卷的细节进行了修改。2014年4月—10月通过家庭拜访,在社区公园和开放空间采取面对面、随机拦截的方式进行了正式问卷调查。收集的问卷调查数据共涉及59个居住社区。由于调研的这59个社区包含75477户住户,按照每个社区1%的比例随机抽样住户,共有813名住户参与调查。在删除无效数据之后,本文使用的为782份有效问卷。调查过程中并未详细记录拒访者信息,但记录了拒访人数,问卷的回复率约为60%~70%。
研究中使用的自变量主要包括居民社会经济属性特征、出行态度偏好、客观和感知的建成环境特征4类(表1)。居民社会经济属性特征包括年龄、性别、受教育程度、是否拥有驾照、家庭年收入、家庭规模和结构、家庭交通工具拥有量等信息。
表1 变量的定义及描述性统计
Tab. 1
| 层次 | 类别 | 指标 | 定义 | 均值 | 标准差 |
|---|---|---|---|---|---|
| 因变量 | 交通步行出行频率 | 最近7天,您有几天从家里步行到商店(包括购物、吃饭、喝茶等) | 3.37 | 1.77 | |
| 休闲步行出行频率 | 在最近的这7天,您有几天在您社区附近散步(包括锻炼、遛狗) | 3.77 | 1.99 | ||
| 个体层次 | 个人社会经济属性特征 | 年龄 | 单位:岁 | 40.15 | 15.69 |
| 性别(男性) | 是=1,否=0 | 0.49 | 0.50 | ||
| 受教育程度 | 不识或初识字=1;小学毕业=2;初中毕业、高中(含中专、职高)毕业=3;大专和大学本科=4;研究生及以上学历=5 | 3.97 | 1.10 | ||
| 是否有驾照 | 无=0,有=1 | 0.43 | 0.49 | ||
| 家庭年收入 | 30000元以下=1;30001~50000元=2;50001~100000元=3;100001~200000元=4;200001~300000元=5;30万元以上=6 | 2.91 | 1.27 | ||
| 家庭规模 | 单位:人数 | 3.78 | 1.49 | ||
| 感知社区建成环境 | 社区及周边建筑外观 | 社区及周边建筑外观漂亮 | 2.56 | 0.86 | |
| 开放空间邻近度 | 附近有公园或开放空间 | 2.74 | 0.86 | ||
| 购物可达性 | 步行距离内有购物场所 | 3.02 | 0.85 | ||
| 公交服务质量 | 高质量的公共交通服务(公交或地铁) | 3.10 | 0.80 | ||
| 公交站点可达性 | 到达公交站点方便 | 3.31 | 0.88 | ||
| 步行设施 | 有步行道、内部交通便利 | 2.74 | 0.86 | ||
| 安全性 | 社区步行安全 | 3.05 | 0.79 | ||
| 小孩安全 | 小孩户外玩耍安全 | 2.96 | 0.83 | ||
| 邻里认同 | 社区居民的经济水平和我相似 | 2.50 | 0.89 | ||
| 出行态度及偏好 | 开车安全 | 小汽车出行比坐公交车、骑自行车、步行更安全 | - | 0.51 | |
| 喜欢小汽车 | 喜欢开车,为享受开车的乐趣而开车,开车时觉得很自由和独立 | - | 0.62 | ||
| 喜欢公交 | 在可能的情况下更喜欢坐公交车而不是开车 | - | 0.37 | ||
| 喜欢骑自行车 | 在可能的情况下更喜欢骑自行车而不是开车 | - | 0.73 | ||
| 喜欢步行 | 喜欢步行,步行有时比开车更方便 | - | 0.67 | ||
| 社区层次 | 客观建成环境变量 | 是否居住在地铁社区 | 是=1,否=0 | 0.509 | 0.50 |
| 人口密度 | 居住社区位于的街道人口密度,单位:千人/km2 | 0.016 | 0.011 | ||
| 道路网密度 | 居住的小区所有入口800 m缓冲区内的道路长度/面积,单位:km/km2 | 6.84 | 2.46 | ||
| 道路交叉口数量 | 居住的小区所有入口800 m缓冲区内的道路交叉口数量,单位:个 | 12.8 | 7.06 | ||
| 购物及餐饮POI数量 | 居住的小区所有入口800 m缓冲区内商购物和餐饮POI数量,单位:个 | 1.95 | 1.07 | ||
| 常规公交站点数量 | 居住的小区所有入口800 m缓冲区内的常规公交站点数量,单位:个 | 9.62 | 4.08 | ||
| 常规公交线路数量 | 居住的小区所有入口800 m缓冲区内的常规公交站点数量,单位:条 | 31.33 | 19.03 | ||
对自选择效应的控制主要反映在对出行态度偏好变量的控制上。出行态度偏好数据来源于问卷,受访者就21项关于小汽车、公共交通、自行车和步行的偏好表述进行判断,从“非常不赞成”到“非常赞成”共4级量表。然后通过验证性因素分析(Confirmatory Factor Analysis, CFA)得到5个主要因素:认为汽车安全、喜欢开车、喜欢公交、喜欢骑自行车和喜欢步行(图2)。
图2
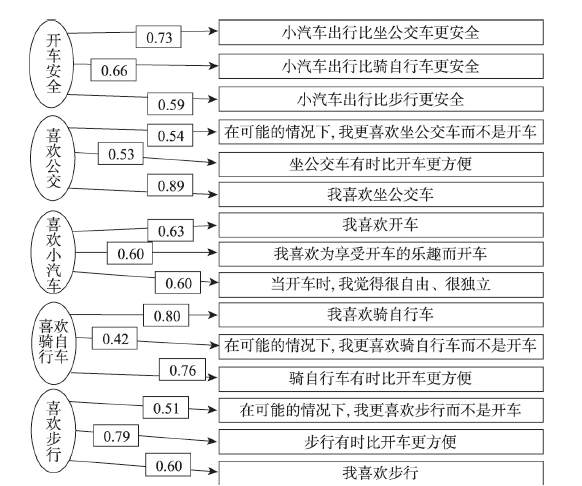
图2
出行态度的测量模型
注:① 椭圆代表潜变量,矩形代表观察变量;② 图中数值代表标准化后的因子荷载,所有因子荷载均在0.01水平上显著。③ 拟合优度测度:均方根近似误差(RMSEA)= 0.054 < 0.08;标准化均方根残差(SRMR)= 0.046 < 0.08;比较拟合指数(CFI)= 0.905。
Fig. 2
Measurement models of travel attitudes
客观建成环境变量主要使用ArcGIS 10.0通过空间分析计算。由于人口普查数据只到街道尺度,因此人口密度数据采用的是样本所在街道的人口密度。其他客观建成环境变量道路网密度、道路交叉口数量、购物及餐饮兴趣点(Point of Interest, POI)数量、常规公共交通站点和线路数均计算样本居住社区所有入口800 m缓冲区内的数据。
感知建成环境变量要求受访者对现在居住社区的27项属性特征进行判断,包括房屋费用、房屋质量和安全性、交通便利性、投资潜力、周边中小学质量、社区外观、住宅形式、社区物业管理、停车设施、人行道和步行设施、自行车线路、公交服务质量、公交站点可达性、公园和公共空间可达性、步行距离内的购物场所、区域商业中心可达性、城市中心可达性、公共建筑可达性、工作地点可达性、社区治安和犯罪率、社区街道交通拥堵率、社区环境安静、街道照明、步行安全性、小孩玩耍安全性、邻里交往、社区居民的经济水平相似度。对这些因素的重要性从“描述完全不正确”到“完全正确”进行评级来衡量个人对这些社区特征的感知。本文选取了与步行行为密切相关的九项社区特征代表感知的建成环境特征自变量纳入分析模型(表1)。
本文使用的因变量主要为步行频率。参照国际上相关研究中较成熟的问卷方式[48],在问卷中通过询问被访者“在最近的这7天,您有几天在您社区附近散步(包括遛狗、锻炼)”“在最近的这7天,您有几天从家里步行到商店(包括步行去购物、餐饮及娱乐等)”获得交通和休闲步行频率数据。由于本文关注焦点在步行本身,而不是出行模式的转变。因此,使用步行频率作为因变量,而不是步行频率占总出行频率的比例。
2.3 研究方法
研究数据为存在嵌套的跨层次结构数据。影响城市居民步行出行的社会经济属性因素、感知的建成环境和出行态度偏好是个体层面的非集计数据,而客观建成环境因素则往往在社区层面度量。如采用传统单一层次回归方法控制一方面因素来突出另一方面因素的作用,会导致结果出现偏差。多层模型(Multilevel Model)考虑了数据的跨层次结构,利用多层面的自变量对因变量进行估计,能得到更可靠的统计结果。同时,与传统模型相比,多层模型可提供方差及协方差的有效估计,进而提高模型的简约性。多层模型中,第1层的截距和斜率可由第2层自变量决定。本文定义第1层为个体层,第2层为社区层,模型结构如下:
个体层:
社区层:
本文使用的模型:
式中:Yij表示第j个社区第i个居民的步行频率;Xnij表示第j个社区第i个居民的个体层次n个解释变量取值;Wmj为社区建成环境层变量;
本文使用Stata 15.0建立数据库并进行数据分析。在对多层模型进行参数标定时,利用收缩估计的参数估计方法,即对个体层面和社区层面分别利用最小二乘估计方法和加权最小二乘估计方法进行参数估计,最终以两种估计的加权综合作为估计结果。
3 实证结果
3.1 数据统计分析
西安地铁2号线已开通运营,因此其沿线社区为地铁案例社区。相对的调查时还未投入运营的地铁4号线沿线社区为对照社区。考虑到建成环境特征在区域上的差异性,对照和案例社区按照同一区域相匹配。因此,区分城市中心区和郊区分别讨论对照组和案例组的建成环境特征。
表2显示了西安地铁2号线和4号线被访者的社会经济属性数据。无论是城市中心区还是郊区社区,地铁社区居民的受教育程度和家庭年收入均高于对照社区。可见由于公共交通仍是中国城市最主要的交通方式,城市居民为地铁支付了大量的房价溢价[49]。郊区社区的家庭规模显著大于城市中心区社区。无论是城市中心区还是郊区社区,地铁社区的被访者更年轻。在城市中心区,地铁和对照社区之间的女性比例没有显著差异,但在郊区社区中,地铁社区女性受访者的比例要比对照社区小。因为无法获取到社区层面的人口普查数据,本研究无法进行对比来评估样本的代表性。然而,由于研究的重点是解释相关变量与步行行为的关系,而不是描述步行行为本身的代表性,因此这些差异并不会对结果产生实质性影响。
表2 西安地铁2号线和4号线站点区域样本的社会经济属性特征
Tab. 2
| 变量 | 郊区 | 城市中心区 | |||||
|---|---|---|---|---|---|---|---|
| 郊区 总样本 | 地铁4号线 (对照组) | 地铁2号线 (案例组) | 城区 总样本 | 地铁4号线 (对照组) | 地铁2号线 (案例组) | ||
| 年龄均值 | 38.70*** | 42.40*** | 35.30*** | 41.70*** | 44.80*** | 38.50*** | |
| 女性(%) | 0.49*** | 0.56*** | 0.43*** | 0.51*** | 0.52 | 0.53 | |
| 受教育程度均值 | 4.00*** | 3.71*** | 4.27*** | 3.98*** | 3.79*** | 4.16*** | |
| 家庭年收入均值 | 3.23*** | 2.96*** | 3.49*** | 2.58*** | 2.27*** | 2.88*** | |
| 家庭规模均值 | 3.87*** | 3.90 | 3.84 | 3.70*** | 3.39*** | 4.01*** | |
| 居住社区数量 | 29 | 12 | 17 | 30 | 21 | 9 | |
| 个体样本数量 | 396 | 191 | 205 | 386 | 193 | 193 | |
注:使用SPSS中方差的单向分析(ANOVA)来确定两组间变量之间是否存在显著差异;***表示在1%水平上显著,**表示在1%~5%水平上显著,*表示在10%水平上显著。
由表3可知,无论在城市中心区还是郊区,在2号线和4号线之间,道路密度和常规公交线路数量没有显著差别,但地铁社区的常规公交站点、道路交叉口数量、购物及餐饮POI数量比对照社区少,人口密度比对照社区高。这表明虽然这两组社区在区域位置上是相似的,但在某些社区特征上仍然存在差异。因此,模型中需要对建成环境变量中的人口密度、道路交叉口数量、购物及餐饮POI数量、常规公交站点数量进行控制。
表3 西安地铁2号线和4号线沿线城区和郊区社区建成环境特征
Tab. 3
| 变量 | 郊区 | 城市中心区 | |||||
|---|---|---|---|---|---|---|---|
| 郊区 总样本 | 地铁4号线 (对照组) | 地铁2号线 (案例组) | 城区 总样本 | 地铁4号线 (对照组) | 地铁2号线 (案例组) | ||
| 人口密度均值 | 6778*** | 5259.25*** (1.674) | 8193.04*** (8.87) | 24816.65*** | 21681.84*** (7.519) | 27951.47*** (4.333) | |
| 道路网密度均值 | 4.75 | 4.78 (0.836) | 4.73 (1.688) | 8.97 | 9.89 (0.767) | 8.05 (0.774) | |
| 道路交叉口数量 | 8.39*** | 10.01*** (3.156) | 6.88*** (2.141) | 17.31*** | 23.80*** (3.864) | 10.83*** (1.546) | |
| 购物及餐饮POI数量 | 1.07*** | 1.34*** (0.383) | 0.81*** (0.557) | 2.86*** | 3.21*** (0.502) | 2.51*** (0.513) | |
| 常规公交站点数量均值 | 6.66*** | 8.23*** (2.936) | 5.21*** (2.147) | 12.64*** | 13.12*** (2.136) | 12.17*** (2.904) | |
| 常规公交线路数量均值 | 15.4*** | 15.6 (2.622) | 15.21 (8.48) | 47.67*** | 54.81 (8.467) | 40.53 (12.478) | |
| 居住社区数量 | 29 | 12 | 17 | 30 | 21 | 9 | |
| 个体样本量 | 396 | 191 | 205 | 386 | 193 | 193 | |
注:① 使用方差的单向分析(ANOVA)来确定两组间变量之间是否存在显著差异;② ***表示在1%水平上显著,**表示在1%~5%水平上显著,*表示在10%水平上显著;③ 括号内的值为标准差。
3.2 实证结果
多层模型分为3个步骤:① 构建无条件平均模型(也称空模型)判断因变量是否存在显著的层间变异;② 构建随机效应模型,判断个体层变量对因变量的影响显著程度及层间差异;③ 通过完整模型来判断控制条件下各层自变量对因变量分别作用程度,以及第二层变量对于第一层变异所反映背景效应的解释程度。
3.2.1 无条件平均模型 无条件平均模型也称空模型,即不含任何自变量的回归分析,其方程式为:
式中:Yij表示第j个社区第i个居民的步行频率;γ00代表总平均值或总截距,是固定参数;μ0j是社区层次的随机变量,代表j社区的截距到总截距的距离,表示第j个社区居民步行频率均值与所有居民步行频率均值的离差;γij是居民个体层次的随机变量,即分布于j社区的i居民到该社区截距的偏离。
在构建完整模型之前,需要建构两层均没有解释变量的无条件平均模型。无条件平均模型通过方差贡献可以确定步行出行频率在社区内相关程度,同时表征步行出行频率的社区层变异是否显著。
如表4所示,交通步行和休闲娱乐步行频率的随机截距误差项分别为1.129和0.507,该数值远远大于其标准误差0.137和0.111,表明交通步行和休闲娱乐步行频率在很大程度上因社区而异。计算两层次组间相关系数(The Intraclass Correlation Coefficient, ICC)交通步行频率为1.129/(1.129+1.389)=0.448,表明对于交通步行频率大约44.8%的变异可以分解到社区层次的客观建成环境变量,其余55.2%的变异来自于个人社会经济属性、感知的社区特征、出行态度及偏好。休闲步行频率的两层次组间相关系数为0.209,表明对于休闲步行频率大约20.9%的变异可以分解到社区层次的客观建成环境变量,其余79.1%的变异来自于个人社会经济属性、感知的社区特征、出行态度及偏好。
表4 无条件平均模型的方差估计结果
Tab. 4
| 参数 | 交通步行频率空模型 | 休闲步行频率空模型 | |||
|---|---|---|---|---|---|
| 系数 | 标准误 | 系数 | 标准误 | ||
| 截距(固定效果) | 3.581 | 0.176 | 3.843 | 0.109 | |
| 随机效果 | |||||
| 社区之间变异 | 1.129 | 0.137 | 0.507 | 0.111 | |
| 个体之间变异 | 1.389 | 0.036 | 1.923 | 0.050 | |
| 组内相关系数(ICC) | 0.448 | 0.209 | |||
| 社区样本量 | 59 | ||||
| 个体样本量 | 782 | ||||
注:p < 0.001。
3.2.2 随机截距模型 将个人和社区层次变量纳入模型,探讨其对交通步行频率和休闲步行频率的影响(表5)。个人层次中,包含个人社会经济属性特征、个人感知的社区特征、个人出行态度偏好的各个自变量;社区层次中,在个人层次的截距项方程中引入反映社区特征的自变量和误差项,并将个人层次的斜率项设为固定。由于本文不考察各层影响因素间的互动效应,所以采用上述设置把各层影响因素之间的互动效应产生的误差归入社区层次的误差项中,这有利于对各自变量在多层结构效应下对步行频率的影响程度进行独立分析。
表5 随机截距模型的估计结果
Tab. 5
| 层次 | 类型 | 变量 | 交通步行频率模型 | 休闲步行频率模型 | |||
|---|---|---|---|---|---|---|---|
| 系数 | 标准误 | 系数 | 标准误 | ||||
| 个体层次 | 个人社会经济属性特征 | 年龄 | 0.011** | 0.004 | 0.039*** | 0.004 | |
| 性别(男性) | -0.223** | 0.095 | -0.404** | 0.117 | |||
| 受教育程度 | 0.058 | 0.053 | -0.073 | 0.064 | |||
| 是否有驾照 | -0.018 | 0.110 | 0.054 | 0.134 | |||
| 家庭年收入 | 0.005 | 0.043 | 0.046 | 0.052 | |||
| 家庭规模 | -0.035 | 0.032 | 0.046 | 0.052 | |||
| 感知的社区特征 | 社区及周边建筑外观 | 0.126* | 0.059 | -0.063 | 0.072 | ||
| 开放空间可达性 | -0.015 | 0.071 | 0.287** | 0.086 | |||
| 购物可达性 | 0.001 | 0.065 | 0.117 | 0.079 | |||
| 公交服务质量 | 0.158* | 0.067 | 0.055 | 0.082 | |||
| 公交站点可达性 | 0.011 | 0.168 | 0.263 | 0.172 | |||
| 步行设施 | 0.105* | 0.061 | 0.219** | 0.074 | |||
| 安全性 | -0.011 | 0.070 | 0.069 | 0.085 | |||
| 小孩安全 | -0.010 | 0.067 | 0.203* | 0.082 | |||
| 邻里认同 | 0.084 | 0.054 | 0.246*** | 0.066 | |||
| 出行态度和偏好 | 喜欢开车 | -0.010 | 0.091 | 0.009 | 0.111 | ||
| 喜欢公交 | 0.592* | 0.276 | 0.715* | 0.337 | |||
| 喜欢步行 | 0.509** | 0.151 | 0.752*** | 0.185 | |||
| 社区层次 | 客观建成环境变量 | 是否居住在地铁社区 | 1.389*** | 0.263 | -0.189 | 0.257 | |
| 人口密度 | -0.020 | 0.140 | 0.001 | 0.137 | |||
| 道路交叉口数量 | 0.018 | 0.021 | 0.003 | 0.021 | |||
| 购物及餐饮POI数量 | 0.583*** | 0.142 | -0.222 | 0.140 | |||
| 常规公交站点数量 | 0.097** | 0.034 | -0.049 | 0.034 | |||
| 截距 | -1.080 | 0.845 | -1.035 | 0.863 | |||
| 随机效果 | |||||||
| 社区之间变异 | 0.267 | 0.096 | 0.268 | 0.096 | |||
| 个体之间变异 | 1.534 | 0.040 | 1.533 | 0.040 | |||
| 样本数 | 782 | ||||||
注:① ***表示在1%水平上显著,**表示在1%~5%水平上显著,*表示在10%水平上显著;② 一般认为方差扩大因子(VIF)大于10时,存在严重的多重共线性。检验模型的VIF,两个模型最大VIF均为4.97。
(1)交通步行频率
根据表5中多层模型结果,共有10个自变量对交通步行频率产生显著影响,其中7个个体层面变量(年龄、性别、感知的社区及周边建筑外观、感知的公交服务质量、感知的步行设施、喜欢公交和喜欢步行)和3个社区层面变量(是否居住在地铁社区、购物及餐饮POI数量和常规公交站点数量)。
个人社会经济属性特征中年龄对交通步行频率产生显著正效应。随着年龄的增加,交通步行频率呈增加趋势。与女性相比,男性交通步行频率更低。受教育程度、是否有驾照、家庭年收入和家庭规模均对交通步行频率不产生显著影响。出行态度变量中,喜欢公共交通和喜欢步行的居民交通步行频率更高。
在控制了个人社会经济属性特征和出行态度偏好带来的自选择效应后,感知的社区建成环境和客观建成环境变量仍然对交通步行频率产生显著影响。感知的社区建成环境变量中,社区及周边建筑外观、公交服务质量、步行设施对交通步行频率产生显著正效应。有意思的发现是居民感知的常规公交站点可达性并不对交通步行频率产生显著影响,只有感知的公共交通服务质量才产生显著正效应。表明公共交通的乘车舒适度、准点率,乘车环境等的重要性。感知的开放空间邻近度、购物可达性、安全性、小孩安全性、邻里认同等社区特征均对交通步行频率无显著影响。
此外,在控制了个人社会经济属性特征、出行态度和建成环境变量后,地铁仍然对交通步行频率产生显著正效应。这一结论肯定了地铁建设的积极作用,表明其对于交通步行行为具有独立于建成环境的影响。
(2)休闲步行频率
对休闲步行频率产生显著影响的8个自变量(年龄、性别、感知的开放空间可达性、感知的步行设施、感知的小孩安全、感知的邻里认同、喜欢公交和喜欢步行)均来自于个体层,虽然从零模型中可以判断有对于休闲步行大约20.86%的变异可以分解到社区层次,但从随机截距模型结果来看,纳入模型的客观建成环境变量均对休闲步行频率无显著影响。
个人社会经济属性特征中年龄对休闲步行频率产生显著正效应。随着年龄的增加,休闲步行频率呈增加趋势。与女性相比,男性休闲步行频率更低。受教育程度、是否有驾照、家庭年收入和家庭规模均对交通步行频率不产生显著影响。出行态度偏好变量中,喜欢公共交通和喜欢步行的居民休闲步行频率更高,这符合假设,表明态度和偏好等自选择因素会影响居民的步行行为。
感知的社区特征变量中,开放空间可达性、步行设施、小孩安全和邻里认同对休闲步行频率产生显著正效应。感知到附近有公园或开放空间的人休闲步行频率更高。这一研究结果和已有研究发现类似,Gilescorti等发现邻近那些大的、具有吸引力的公共开放空间,可以鼓励更高水平的步行[52]。Li等在俄勒冈州波特兰市的调查结果显示,绿化及休憩用地与较频繁的步行活动密切相关[53]。已有发达国家的实证研究证明位于离家步行距离内的人行道和步行设施与体力活动正相关。如Duncan等在昆士兰州的研究发现步行道网络的接近性和参与休闲步行之间具有强烈正相关关系[54]。本研究亦证实了这一点,感知到便利的步行设施对于增加休闲步行频率有重要影响。感知到小孩户外玩耍安全,社区居民的经济水平相似的人会更频繁地进行休闲步行,这一研究结果类似于发达国家的实证结果,安全性是影响步行行为的关键因素[55,56]。客观层面的建成环境变量均不对休闲步行频率产生显著影响。这一研究结果和已有研究发现类似[57]。可能的原因是解释休闲步行行为时,个体对步行环境的感知比客观社区建成环境特征更重要,也有可能是因为这里使用的客观建成环境特征变量并不能很好地反映建成环境对个体休闲步行的影响。
上述分析表明,居民的步行行为受个人层面社会经济属性因素、出行态度偏好因素、感知的建成环境因素以及社区层面的客观建成环境因素的共同作用(图3)。且感知和客观建成环境变量对不同目的的步行行为影响存在差异。
图3
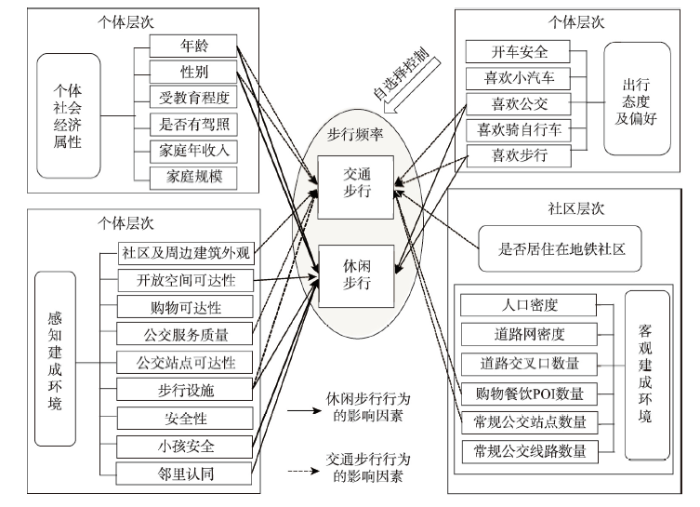
图3
不同目的步行行为的影响因素
Fig. 3
The influence factors of walking behavior for different purposes
4 结论与讨论
4.1 结论
本文实证研究了城市轨道交通、建成环境和自选择对交通步行频率和休闲步行频率的影响。通过对两种类型步行频率模型结果的比较,得到了关于步行行为的有趣结论。
首先,这两个模型都表明出行态度和偏好等自选择因素对个人步行行为具有重要影响。喜欢步行和公共交通的人,交通步行频率和休闲步行频率都相对更高。因此,通过塑造建成环境来管理出行行为的能力可能会受到明显的居民出行态度和偏好的限制。
第二,控制了个人社会经济属性和自选择因素后,建成环境对步行行为有影响,尤其是受访者对建成环境的感知极大地影响了步行频率。但交通步行和休闲步行受到不同维度感知建成环境变量的影响。感知到的社区及周边建筑外观、公交服务质量、步行设施的便利程度等因素对交通步行频率产生显著影响。而对于休闲步行频率而言,产生影响的主要是感知到的开放空间可达性、步行设施的便利程度、小孩安全和邻里认同。但无论是交通步行还是休闲步行频率均受到感知到的步行设施便利程度的显著影响。可见,人行道等步行设施在创造安全步行环境和鼓励步行方面的重要作用。
第三,客观建成环境变量对于交通步行和休闲步行行为的影响存在差异。在本研究中无论交通步行还是休闲步行频率模型中,均未发现密度的显著影响。客观建成环境变量中周边购物及餐饮设施数量和常规公交站点数量对交通步行频率产生显著正效应,表明社区周边的商业区特征、购物可达性和公共交通可达性对于交通性步行出行很重要。良好的公共交通可达性和服务对于促进交通步行具有重要意义。但对于休闲步行来说,人口密度、道路交叉口数量、购物及餐饮POI数量和常规公交站点数量客观建成环境变量并不产生显著影响。因此,为了准确获取和解释步行行为,避免建成环境和人口特征对步行行为的影响被抵消和低估,在调查和研究中区分不同目的步行方式非常重要。
第四,在控制了建成环境、自选择和居民社会经济属性特征后,地铁仍然对交通步行频率具有显著的独立影响。这一结论肯定了地铁建设的积极作用,表明其对于步行行为具有独立于建成环境的影响。
4.2 讨论
本文研究结论对城市规划和管理采取相应措施改善城市轨道交通可达性和社区建成环境,激励步行出行和缓解交通问题有一定启示和实践意义,可以为城市和社区规划与建设提供参考依据。本研究的结论表明在相关规划和政策制定中,通过提升城市轨道交通可达性和改善建成环境因素来促进步行出行的措施在中国背景下同样适用。同时需要关注基于不同出行目的步行行为的建成环境因素调整的差异性。另外,出行者不同社会经济属性和态度偏好特征也是居民步行行为的重要影响因素。应当在中国城市社会空间分异与重构背景下,充分认识到通过塑造建成环境来管理出行行为的能力可能会受到明显的居民出行态度和偏好的限制。
本文也存在一些不足。① 本研究主要是基于截面数据的准实验研究,基于调查数据的限制,未做到真正意义上的纵向研究,难以总结城市轨道交通和建成环境与步行行为之间的因果关系;② 步行行为数据主要来自于问卷中居民的自我报告,而非客观测量数据。未来的研究可依赖于物理活动持续时间和地点的客观测量数据(例如使用全球定位系统)来进一步验证我们的研究结果。
参考文献
What limits the pedestrian? Exploring perceptions of walking in the built environment and in the context of every-day life
Economic value of walkability
The built environment and human activity patterns: Exploring the impacts of urban form on public health
DOI:10.1177/08854120122093339 URL [本文引用: 1]
Public transit, obesity, and medical costs: Assessing the magnitudes
DOI:10.1016/j.ypmed.2007.10.004
URL
[本文引用: 1]

Abstract
Objective.
This paper assesses the potential benefits of increased walking and reduced obesity associated with taking public transit in terms of dollars of medical costs saved and disability avoided.
Methods.
I conduct a new analysis of a nationally representative U.S. transportation survey to gauge the net increase in walking associated with public transit usage. I translate minutes spent walking into energy expenditures and reductions in obesity prevalence, estimating the present value of costs and disability that may be avoided.
Results.
Taking public transit is associated with walking 8.3 more minutes per day on average, or an additional 25.7–39.0 kcal. Hill et al. [Hill, J.O., Wyatt, H.R., Reed, G.W., Peters, J.C., 2003. Obesity and the environment: Where do we go from here? Science 299 (5608), 853–855] estimate that an increase in net expenditure of 100 kcal/day can stop the increase in obesity in 90% of the population. Additional walking associated with public transit could save $5500 per person in present value by reducing obesity-related medical costs. Savings in quality-adjusted life years could be even higher.
Conclusions.
While no silver bullet, walking associated with public transit can have a substantial impact on obesity, costs, and well-being. Further research is warranted on the net impact of transit usage on all behaviors, including caloric intake and other types of exercise, and on whether policies can promote transit usage at acceptable cost.
Built environment in local relation with walking: Why here and not there?
The pandemic of physical inactivity: Global action for public health
DOI:10.1016/S0140-6736(12)60898-8 URL [本文引用: 1]
Can population levels of physical activity be increased? Global evidence and experience
DOI:10.1016/j.pcad.2014.09.002 URL [本文引用: 1]
Impacts of mixed use and density on utilization of three modes of travel: Single-occupant vehicle, transit, and walking
Walking, bicycling, and urban landscapes: Evidence from the San Francisco Bay Area
DOI:10.2105/AJPH.93.9.1478 URL [本文引用: 1]
The effectiveness of urban design and land use and transport policies and practices to increase physical activity: A systematic review
Physical activity and environment research in the health field: Implications for urban and transportation planning practice and research
DOI:10.1177/0885412204267680 URL [本文引用: 1]
Understanding environmental influences on walking
DOI:10.1016/j.amepre.2004.03.006
URL
[本文引用: 1]
Abstract
Background
Understanding how environmental attributes can influence particular physical activity behaviors is a public health research priority. Walking is the most common physical activity behavior of adults; environmental innovations may be able to influence rates of participation.
Method
Review of studies on relationships of objectively assessed and perceived environmental attributes with walking. Associations with environmental attributes were examined separately for exercise and recreational walking, walking to get to and from places, and total walking.
Results
Eighteen studies were identified. Aesthetic attributes, convenience of facilities for walking (sidewalks, trails); accessibility of destinations (stores, park, beach); and perceptions about traffic and busy roads were found to be associated with walking for particular purposes. Attributes associated with walking for exercise were different from those associated with walking to get to and from places.
Conclusions
While few studies have examined specific environment–walking relationships, early evidence is promising. Key elements of the research agenda are developing reliable and valid measures of environmental attributes and walking behaviors, determining whether environment–behavior relationships are causal, and developing theoretical models that account for environmental influences and their interactions with other determinants.
Transport, urban design, and physical activity: An evidence-based update
Environmental factors associated with adults' participation in physical activity
DOI:10.1016/S0749-3797(01)00426-3
URL
[本文引用: 1]
Abstract
Background: Promoting physical activity is a public health priority, and changes in the environmental contexts of adults’ activity choices are believed to be crucial. However, of the factors associated with physical activity, environmental influences are among the least understood.
Method: Using journal scans and computerized literature database searches, we identified 19 quantitative studies that assessed the relationships with physical activity behavior of perceived and objectively determined physical environment attributes. Findings were categorized into those examining five categories: accessibility of facilities, opportunities for activity, weather, safety, and aesthetic attributes.
Results: Accessibility, opportunities, and aesthetic attributes had significant associations with physical activity. Weather and safety showed less-strong relationships. Where studies pooled different categories to create composite variables, the associations were less likely to be statistically significant.
Conclusions: Physical environment factors have consistent associations with physical activity behavior. Further development of ecologic and environmental models, together with behavior-specific and context-specific measurement strategies, should help in further understanding of these associations. Prospective studies are required to identify possible causal relationships.
Walking to transit: An unexpected source of physical activity
DOI:10.1016/j.tranpol.2011.03.010
URL
[本文引用: 1]
Using data from a regional survey carried out in Montreal, this paper shows empirical evidence that modal shift from car to transit contributes to the volume of daily physical activity. First, the paper presents a method to calculate the walking distance related to transit trips, and a totally disaggregate trip assignment model. The walking distance involved in every transit trip is then associated to the individuals' characteristics to estimate the number of steps made by the population in the whole transit system.
Results show that, in average, a transit trip involves 1250 steps, required to access and egress the network as well as to transfer between routes or modes. Thus, a round trip represents 2500 steps, which account for 25% of the recommended volume of physical activity per day. Hence, analysis shows that the volume of walking varies according to attributes of the traveler (general decrease with age, higher for men) and of the trip (study and work trip involve more steps, the use of train generates more steps). A regression model confirms that these variables significantly affect the number of steps involved in transit trips. Such positive outcome, for the traveler himself, is an innovative argument to promote the use of transit that is also aligned with current sustainable transportation goals. (C) 2011 Elsevier Ltd.
Commuting by public transit and physical activity: Where you live, where you work, and how you get there
Physical activity associated with public transport use: A review and modelling of potential benefits
Relation between higher physical activity and public transit use
DOI:10.2105/AJPH.2013.301696
URL
[本文引用: 1]
Objectives. We isolated physical activity attributable to transit use to examine issues of substitution between types of physical activity and potential confounding of transit-related walking with other walking.
Methods. Physical activity and transit use data were collected in 2008 to 2009 from 693 Travel Assessment and Community study participants from King County, Washington, equipped with an accelerometer, a portable Global Positioning System, and a 7-day travel log. Physical activity was classified into transit-and non-transit-related walking and nonwalking time. Analyses compared physical activity by type between transit users and nonusers, between less and more frequent transit users, and between transit and nontransit days for transit users.
Results. Transit users had more daily overall physical activity and more total walking than did nontransit users but did not differ on either non-transit-related walking or nonwalking physical activity. Most frequent transit users had more walking time than least frequent transit users. Higher physical activity levels for transit users were observed only on transit days, with 14.6 minutes (12.4 minutes when adjusted for demographics) of daily physical activity directly linked with transit use.
Conclusions. Because transit use was directly related to higher physical activity, future research should examine whether substantive increases in transit access and use lead to more physical activity and related health improvements.
Transit use, physical activity, and body mass index changes: Objective measures associated with complete street light-rail construction
DOI:10.2105/AJPH.2015.302561 URL [本文引用: 1]
Walking to public transit: Steps to help meet physical activity recommendations
DOI:10.1016/j.amepre.2005.06.010
URL
[本文引用: 1]
Background
Nearly half of Americans do not meet the Surgeon General’s recommendation of ≥30 minutes of physical activity daily. Some transit users may achieve 30 minutes of physical activity daily solely by walking to and from transit. This study estimates the total daily time spent walking to and from transit and the predictors of achieving 30 minutes of physical activity daily by doing so.
Methods
Transit-associated walking times for 3312 transit users were examined among the 105,942 adult respondents to the 2001 National Household Travel Survey, a telephone-based survey sponsored by the U.S. Department of Transportation to assess American travel behavior.
Results
Americans who use transit spend a median of 19 minutes daily walking to and from transit; 29% achieve ≥30 minutes of physical activity a day solely by walking to and from transit. In multivariate analysis, rail users, minorities, people in households earning <$15,000 a year, and people in high-density urban areas were more likely to spend ≥30 minutes walking to and from transit daily.
Conclusions
Walking to and from public transportation can help physically inactive populations, especially low-income and minority groups, attain the recommended level of daily physical activity. Increased access to public transit may help promote and maintain active lifestyles. Results from this study may contribute to health impact assessment studies (HIA) that evaluate the impact of proposed public transit systems on physical activity levels, and thereby may influence choices made by transportation planners.
Correlates of walking for transportation and use of public transportation among adults in St Louis, Missouri
Transit and health: Mode of transport, employer-sponsored public transit pass programs, and physical activity
DOI:10.1057/jphp.2008.52 URL [本文引用: 1]
Travel and the built environment: A meta-analysis
DOI:10.1080/01944361003766766 URL [本文引用: 1]
The influences of the built environment and residential self-selection on pedestrian behavior: Evidence from Austin, TX
DOI:10.1007/s11116-005-7027-2
URL
[本文引用: 1]
Pedestrian travel offers a wide range of benefits to both individuals and society. Planners and public health officials alike have been promoting policies that improve the quality of the built environment for pedestrians: mixed land uses, interconnected street networks, sidewalks and other facilities. Whether such policies will prove effective remains open to debate. Two issues in particular need further attention. First, the impact of the built environment on pedestrian behavior may depend on the purpose of the trip, whether for utilitarian or recreational purposes. Second, the connection between the built environment and pedestrian behavior may be more a matter of residential location choice than of travel choice. This study aims to provide new evidence on both questions. Using 1368 respondents to a 1995 survey conducted in six neighborhoods in Austin, TX, two separate negative binomial models were estimated for the frequencies of strolling trips and pedestrian shopping trips within neighborhoods. We found that although residential self-selection impacts both types of trips, it is the most important factor explaining walking to a destination (i.e. for shopping). After accounting for self-selection, neighborhood characteristics (especially perceptions of these characteristics) impact strolling frequency, while characteristics of local commercial areas are important in facilitating shopping trips.
Urban form and pedestrian choices: Study of Austin neighborhoods
Understanding the demand for travel: It's not purely 'Derived'. Innovation-the European Journal of
When is getting there half the fun? Modeling the liking for travel
Examining the impacts of residential self-selection on travel behaviour: A focus on empirical findings
DOI:10.1080/01441640802539195 URL [本文引用: 1]
Self-selection: A key to a better understanding of location choices, travel behaviour and transport externalities?
DOI:10.1080/01441640902752961 URL [本文引用: 1]
Examining the impacts of residential self-selection on travel behavior: A focus on methodologies
DOI:10.1016/j.trb.2007.07.006 URL [本文引用: 1]
The influence of rail transit accessibility on the shift of travel modal choice: Empirical analysis based on the micro survey of the 1980s generation in Shanghai
轨道交通对出行方式选择的影响研究: 基于上海市80后微观调查样本的实证分析
The influence mechanism of travel-related CO2 emissions from the perspective of residential self-selection: A case study of Guangzhou
DOI:10.11821/dlxb201802010
URL
[本文引用: 1]
Numerous studies have examined the influencing factors of CO2 emissions from transportation at the national, city and community levels. However, fewer studies have considered the effect of residential self-selection. Ignoring this effect is likely to result in underestimating the role of the built environment, thus affecting relevant planning and policy development. Is the effect of residential self-selection in Chinese cities the same as in Western cities? How and to what extent does the built environment affect CO2 emissions from travel after controlling for the effect of residential self-selection? To address these questions, this paper first measures the CO2 emissions from travel on the basis of the Travel Intelligent Query System (TIQS) developed by us on the Baidu map LBS (Location Based Service) open platform, and 1239 questionnaires conducted in 15 communities in Guangzhou in 2015. It develops a structural equation model (SEM) to examine the effects of the influencing factors on CO2 emissions of trips with different purposes. The results show that the effect of residential self-selection also exists in Chinese cities. Changing residents' preference of travel mode will help reduce travel-related CO2 emissions. After controlling the effect of residential self-selection, the built environment still has significant effects on CO2 emissions from travel. Although some of them are direct effects, others are indirect effects that work through mediating variables, such as car ownership and travel distance. For different trip purposes, the mechanisms of CO2 emissions are not the same. Specifically, the distance to city public centers has a significant positive total effect on CO2 emissions from commuting trips, which is an indirect effect. Residential density significantly affects CO2 emissions from social, recreational and daily shopping trips, but it has no significant effect on CO2 emissions from commuting trips. Bus stop density is positively associated with CO2 emissions from commuting trips, and negatively associated with CO2 emissions from social and daily shopping trips. In addition, land-use mix has a negative effect on CO2 emissions from commuting, social and daily shopping trips, and metro station density and road network density have significant negative effects on CO2 emissions from all types of trip. These results suggest that it is necessary to comprehensively consider the effects of the built environment on CO2 emissions from different types of trip, and carry out targeted intervention on the built environment in related planning and policy development so as to guide the public to change their travel behavior and to promote low-carbon travel.
居住自选择视角下的广州出行碳排放影响机理
DOI:10.11821/dlxb201802010
URL
[本文引用: 1]
Numerous studies have examined the influencing factors of CO2 emissions from transportation at the national, city and community levels. However, fewer studies have considered the effect of residential self-selection. Ignoring this effect is likely to result in underestimating the role of the built environment, thus affecting relevant planning and policy development. Is the effect of residential self-selection in Chinese cities the same as in Western cities? How and to what extent does the built environment affect CO2 emissions from travel after controlling for the effect of residential self-selection? To address these questions, this paper first measures the CO2 emissions from travel on the basis of the Travel Intelligent Query System (TIQS) developed by us on the Baidu map LBS (Location Based Service) open platform, and 1239 questionnaires conducted in 15 communities in Guangzhou in 2015. It develops a structural equation model (SEM) to examine the effects of the influencing factors on CO2 emissions of trips with different purposes. The results show that the effect of residential self-selection also exists in Chinese cities. Changing residents' preference of travel mode will help reduce travel-related CO2 emissions. After controlling the effect of residential self-selection, the built environment still has significant effects on CO2 emissions from travel. Although some of them are direct effects, others are indirect effects that work through mediating variables, such as car ownership and travel distance. For different trip purposes, the mechanisms of CO2 emissions are not the same. Specifically, the distance to city public centers has a significant positive total effect on CO2 emissions from commuting trips, which is an indirect effect. Residential density significantly affects CO2 emissions from social, recreational and daily shopping trips, but it has no significant effect on CO2 emissions from commuting trips. Bus stop density is positively associated with CO2 emissions from commuting trips, and negatively associated with CO2 emissions from social and daily shopping trips. In addition, land-use mix has a negative effect on CO2 emissions from commuting, social and daily shopping trips, and metro station density and road network density have significant negative effects on CO2 emissions from all types of trip. These results suggest that it is necessary to comprehensively consider the effects of the built environment on CO2 emissions from different types of trip, and carry out targeted intervention on the built environment in related planning and policy development so as to guide the public to change their travel behavior and to promote low-carbon travel.
Does TOD need the T? On the importance of factors other than rail access
DOI:10.1080/01944363.2013.791008 URL [本文引用: 1]
Light rail leads to more walking around station areas
Land use and vehicle miles of travel in the climate change debate: Getting smarter than your average bear
//Ingram G K, Hong Y H. Climate Change and Land Policies.
The influence of light rail transit on transit use: An exploration of station area residents along the Hiawatha line in Minneapolis
DOI:10.1016/j.tra.2013.11.001 URL [本文引用: 1]
Effects of metro transit on the ownership of mobility instruments in Xi'an, China
DOI:10.1016/j.trd.2016.09.014 URL [本文引用: 1]
The influence of built environment on walking behavior: Measurement issues, theoretical considerations, modeling methodologies and Chinese empirical studies
//Kwan M, Richardson D, Wang D, et al. Space-time Integration in Geography and GIScience: Research Frontiers in the US and China.
Residential self-selection, built environment, and travel behavior in the Chinese context
DOI:10.5198/jtlu.v7i3 URL [本文引用: 1]
A study on the impact of job-housing balance on commuting travels: An empirical test of a traditional idea in the field of urban planning
职住平衡对通勤交通的影响分析: 对一个传统城市规划理念的实证检验
A comparison of the recreational walking environment quality between old and new towns: A case study in Shanghai
新旧城区休闲步行环境质量比较: 以上海市鞍山新村和江湾新城为例
Walking activity quality and built environment: Take three commercial streets in Shanghai as examples
步行活动品质与建成环境: 以上海三条商业街为例
Built environment's influence on physical activity: Review and thought
建成环境对体力活动的影响研究: 进展与思考
Progress of international research on health impact of the built environment of communities: Literature review and reflections from a perspective of physical activities
社区建成环境健康影响的国际研究进展: 基于体力活动研究视角的文献综述和思考
Statistical analysis of urban rail transit lines in 2018, China
2018年中国城市轨道交通运营线路统计和分析
What educated citizens should know about statistics and probability
DOI:10.1198/0003130031630 URL [本文引用: 1]
Regional differences in walking frequency and BMI: What role does the built environment play for Blacks and Whites?
The impacts of rail transit on property values and land development intensity: The case of No.13 Line in Beijing
DOI:10.11821/xb201002008
URL
[本文引用: 1]
Theoretical analysis shows that the effect of rail transit on housing price is greater in suburbs than that in the central area. Empirical results validate this point by using the hedonic pricing method and housing transaction data nearby No.13 rail line in Beijing. In suburban areas, the housing prices within 1 km of rail stations are nearly 20% higher than those beyond that distance. However, with the development of surrounding urban transportation networks, the impact of rail transit is declining. Also, rail transit has significant impacts on urban land development intensity. The operation of No.13 Line encourages the land development in the north suburbs of Beijing, and raises the land development intensity around the stations. The FAR of new housing projects decreases by 1.0 every 3.3 km further away from the stations in suburban areas. These empirical results have important policy implications for the TOD strategy, the cost-benefit analysis and value capture strategy of rail transit construction in Chinese cities.
轨道交通对住宅价格和土地开发强度的影响: 以北京市13号线为例
DOI:10.11821/xb201002008
URL
[本文引用: 1]
Theoretical analysis shows that the effect of rail transit on housing price is greater in suburbs than that in the central area. Empirical results validate this point by using the hedonic pricing method and housing transaction data nearby No.13 rail line in Beijing. In suburban areas, the housing prices within 1 km of rail stations are nearly 20% higher than those beyond that distance. However, with the development of surrounding urban transportation networks, the impact of rail transit is declining. Also, rail transit has significant impacts on urban land development intensity. The operation of No.13 Line encourages the land development in the north suburbs of Beijing, and raises the land development intensity around the stations. The FAR of new housing projects decreases by 1.0 every 3.3 km further away from the stations in suburban areas. These empirical results have important policy implications for the TOD strategy, the cost-benefit analysis and value capture strategy of rail transit construction in Chinese cities.
Self-selection in the relationship between the built environment and walking: Empirical evidence from northern California
DOI:10.1080/01944360608976724 URL [本文引用: 1]
The built environment and walking activity of the elderly: An empirical analysis in the Zhongshan metropolitan area, China
DOI:10.3390/su6021076 URL [本文引用: 1]
Increasing walking: How important is distance to, attractiveness, and size of public open space?
Multilevel modelling of built environment characteristics related to neighbourhood walking activity in older adults
Psychosocial and environmental factors associated with physical activity among city dwellers in regional Queensland
DOI:10.1016/j.ypmed.2004.06.017 URL [本文引用: 1]
Identification of the impact of crime on physical activity depends upon neighbourhood scale: Multilevel evidence from 203, 883 Australians
Do changes in residents' fear of crime impact their walking? Longitudinal results from RESIDE
DOI:10.1016/j.ypmed.2014.02.011
URL
[本文引用: 1]
Objective. To examine the influence of fear of crime on walking for participants in a longitudinal study of residents in new suburbs.
Methods. Participants (n = 485) in Perth, Australia, completed a questionnaire about three years after moving to their neighbourhood (2007-2008), and again four years later (2011-2012). Measures included fear of crime, neighbourhood perceptions and walking (min/week). Objective environmental measures were generated for each participant's neighbourhood, defined as the 1600 m road network distance from home, at each time-point. Linear regression models examined the impact of changes in fear of crime on changes in walking, with progressive adjustment for other changes in the built environment neighbourhood perceptions and demographics.
Results. An increase in fear of crime was associated with a decrease in residents' walking inside the local neighbourhood. For each increase in fear of crime (i.e., one level on a five-point Likert scale) total walking decreased by 22 min/week (p = 0.002), recreational walking by 13 min/week (p = 0.031) and transport walking by 7 min/week (p = 0.064).
Conclusion. This study provides longitudinal evidence that changes in residents' fear of crime influence their walking behaviours. Interventions that reduce fear of crime are likely to increase walking and produce public health gains. (C) 2014 Elsevier Inc.
Perceived and objective environmental measures and physical activity among urban adults
DOI:10.1016/j.amepre.2004.10.023 URL [本文引用: 1]
Walk the line: Station context, corridor type and bus rapid transit walk access in Jinan, China
DOI:10.1016/j.jtrangeo.2011.09.007
URL
[本文引用: 1]
This paper examines BRT station walk access patterns in rapidly urbanizing China and the relationship between bus rapid transit (BRT) station context and corridor type and the distance people will walk to access the system (i.e., catchment area). We hypothesize that certain contextual built environment features and station and right-of-way configurations will increase the walk-access catchment area; that is, that urban design influences users' willingness to walk to BRT. We base our analysis on 1233 user surveys, conducted at 19 BRT stations along three existing (as of summer 2009) BRT corridors in the city of Jinan. Ordinary least squares regression is applied to estimate the relationship between walk access distances and aggregate station- and corridor-area characteristics, controlling for individual- and trip-specific attributes. The results suggest that people walk farther to BRT stations when the walking environment has certain features (median transit-way station location, shaded corridors, busy and interesting). Trip and trip maker characteristics play a relatively minor role in defining BRT walk access distance. Implications include the need for flexible transit station catchment area definitions in identifying transit-oriented development opportunities and estimating system demand. (C) 2011 Elsevier Ltd.
Associations of residential density with adolescents' physical activity in a rapidly urbanizing area of Mainland China
DOI:10.1007/s11524-009-9409-9 URL [本文引用: 1]
Association between perceived urban built environment attributes and leisure-time physical activity among adults in Hangzhou, China
DOI:10.1016/j.ypmed.2014.06.001
URL
[本文引用: 1]
Background. Neighborhood built environment may influence residents' physical activity, which in turn, affects their health. This study aimed to determine the associations between perceived built environment and leisure-time physical activity in Hangzhou, China.
Methods. 1440 participants aged 25-59 were randomly selected from 30 neighborhoods in three types of administrative planning units in Hangzhou. International Physical Activity Questionnaire long form and NEWS-A were used to obtain individual-level data. The China Urban Built Environment Scan Tool was used to objectively assess the neighborhood-level built environment. Multi-level regression was used to explore the relationship between perceived built environment variables and leisure-time physical activities. Data was collected in Hangzhou from June to December in 2012, and was analyzed in May 2013.
Results. Significant difference between neighborhood random variations in physical activity was identified (P = 0.0134); neighborhood-level differences accounted for 3.0% of the variability in leisure-time physical activity. Male residents who perceived higher scores on access to physical activity destinations reported more involvement in leisure-time physical activity. Higher scores on perception of esthetic quality, and lower on residential density were associated with more time in leisure-time walking in women.
Conclusions. The present study demonstrated that perceived urban built environment attributes significantly correlate with leisure-time physical activity in Hangzhou, China. (C) 2014 The Authors. Published by Elsevier Inc.
