
基于公民科学数据的中国鸟类城市化响应及适应性
|
吴佳雨(1989-), 男, 内蒙古乌海人, 博士, 副教授, 博士生导师, 主要研究方向为城市绿色空间治理。E-mail: wujiayula@zju.edu.cn |
收稿日期: 2022-09-04
修回日期: 2023-11-02
网络出版日期: 2023-11-29
基金资助
第二次青藏高原综合科学考察研究(2019QZKK0406)
中国科学院战略性先导科技专项(XDA23020101)
Urbanization responses and adaptation of birds in China based on citizen science data
Received date: 2022-09-04
Revised date: 2023-11-02
Online published: 2023-11-29
Supported by
The Second Tibetan Plateau Scientific Expedition and Research Program(2019QZKK0406)
Strategic Priority Research Program of the Chinese Academy of Sciences(XDA23020101)
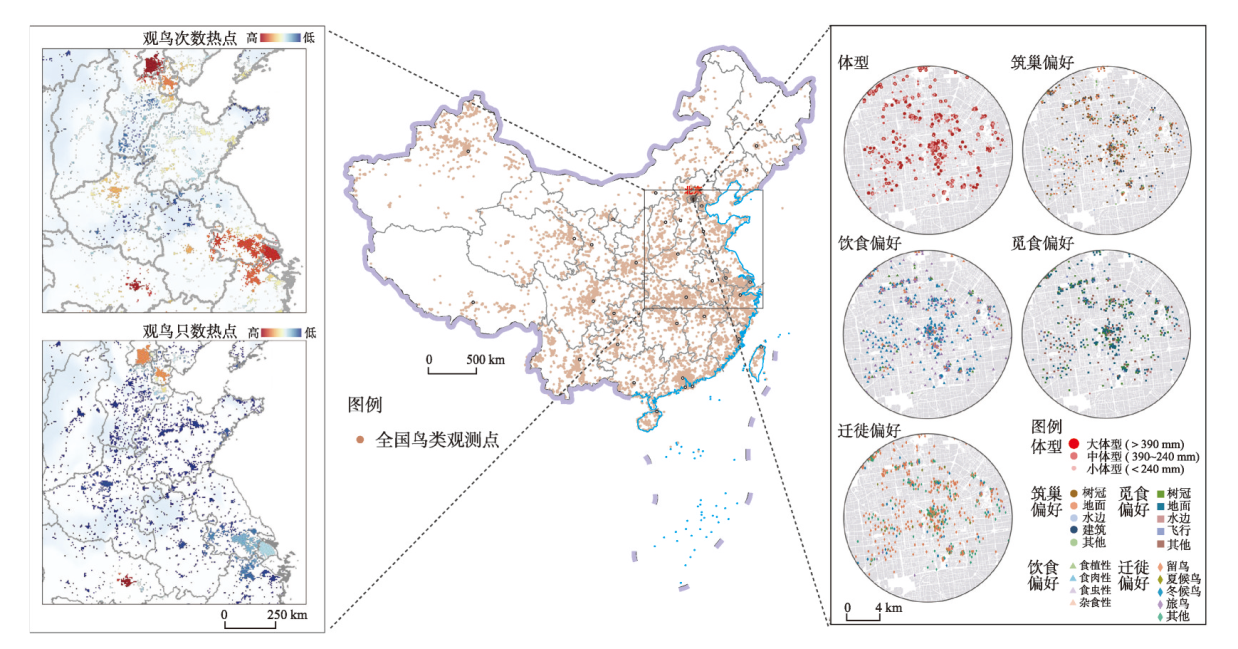
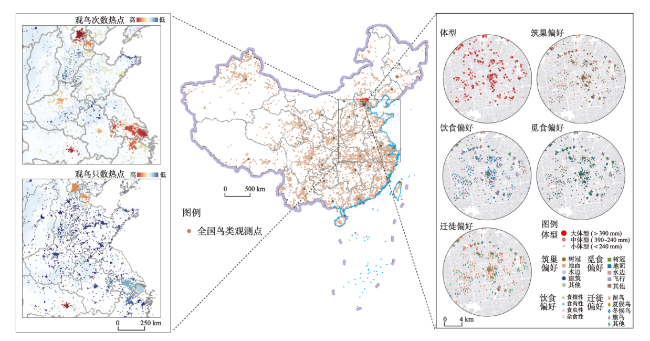
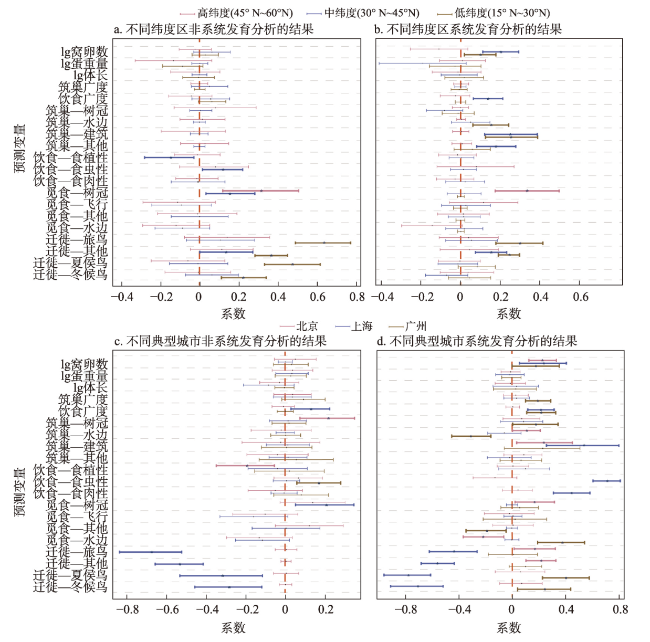
全球鸟类多样性正面临巨大威胁。现有关于鸟类特征与其城市化响应的研究多聚焦于地方或区域尺度,采用分类变量对鸟类城市耐受力进行分级,且较少考虑物种间进化关系,致使鸟类特征与其对城市化响应的关联机制存在诸多争议。因此,本文综合了2012—2020年中国范围内952036个鸟类公民科学观测数据和多种连续的城市化水平测度方法(城市与建成区比例、人口密度和夜间灯光强度),基于系统发育的视角,从国家、省域和城市尺度探究中国鸟类的城市化响应模式及空间适应性。结果表明:具有较多的窝卵数和食性泛化的鸟类是最能适应城市化的物种。非系统发育和系统发育两种视角度量得出的鸟类城市化响应模式不同,表明物种间进化关系的确掩盖了鸟类在城市适应性上的表现:同一进化枝系上在建筑崖壁上筑巢的鸟类更易适应城市建成环境。此外,不同纬度背景下影响鸟类城市适应性的决定性因素有所不同:高位觅食在高纬度城市环境中发挥重要作用,食虫鸟在中纬度区表现出高城市耐受力,而迁徙鸟是低纬度区预测鸟类高城市适应性的重要特征。
吴佳雨 , 杨梦夏 , 周侃 . 基于公民科学数据的中国鸟类城市化响应及适应性[J]. 地理学报, 2023 , 78(11) : 2850 -2863 . DOI: 10.11821/dlxb202311013
Bird diversity is facing a considerable threat. The existing studies primarily focus on local or regional scales by relying on categorical variables to classify birds' urban tolerance. However, they tend to neglect the evolutionary relationship between species, leading to inconsistent and sometimes contradictory conclusions regarding the response of bird traits to urbanization. Therefore, our study attempts to supplement the previous literature by using the above deficiencies as bases. We integrate 952,036 citizen science observations of birds in China from 2012 to 2020, along with various continuous measures of urbanization, such as the proportion of built-up land, population density, and night-light intensity. From a phylogenetic perspective, we explore the urbanization response and tolerance of Chinese birds on national, regional, and urban scales. Our findings reveal that birds with large clutch sizes and generalist diets are the most adaptable in the urban environment. Moreover, phylogenetic and non-phylogenetic analyses present inconsistencies, indicating that the evolutionary relationship between species conceals the expression of several traits in urban tolerance. Birds that nest on architectural cliffs show high urban tolerance within clades. In addition, the decisive factors influencing birds' tolerance to urbanization vary across different latitudes. High-foraging birds perform well in high-latitude urban environments, whereas insectivorous birds exhibit high urban tolerance in mid-latitude areas. Migratory birds show strong adaptation to urban environments at low latitudes. The above results confirm the importance of considering species evolution and diverse continuous urban measurement in studying the relationship between various birds and urbanization. This approach helps us adopt differentiated protection strategies for birds in the context of rapid urbanization. Several measures can be implemented to mitigate the adverse impact of rapid urbanization on birds and promote harmonious urban design. They include protecting the existing trees and buildings that serve as nesting sites for birds, increasing the presence of shrubs to provide suitable habitats for ground-dwelling bird species, and implementing strategies to control predation risks for ground nests. These efforts contribute to optimizing urban spaces and creating a favorable environment for bird populations.
表1 鸟类的形态和生理特征描述表Tab. 1 Description of the morphological and life history traits |
| 分类 | 变量 | 定义 | 解释 | 数据来源 |
|---|---|---|---|---|
| 生活史特征 | 窝卵数 | 窝巢中卵的个数(个) | 参考文献[28] | |
| 卵重量 | 平均卵重量(g) | 参考文献[28] | ||
| 体重 | 平均体重(g) | 参考文献[28] | ||
| 体长 | 平均体长(mm) | Birds of the world | ||
| 生态位广度 | 筑巢广度 | 主要筑巢区域的数量 | 参考文献[29] | |
| 饮食广度 | 主要饮食类型的数量 | |||
| 行为偏好 | 筑巢偏好 | 筑巢—树冠 | 筑巢于树冠及枝叶,植被中上层 | 参考文献[29] |
| 筑巢—地面 | 筑巢于地面,植被中下层 | |||
| 筑巢—水边 | 筑巢于水面、水岸、湿生植被、滩涂或 其他靠近水体的区域 | |||
| 筑巢—建筑 | 筑巢于建筑墙体、空调机箱或土壁 | |||
| 筑巢—其他 | 以上筑巢区域超过一类者 | |||
| 饮食偏好 | 食性—食植性 | 主要觅食植物的叶、种子、果实和叶汁 | ||
| 食性—食肉性 | 主要觅食鱼类、软体动物、两栖类、小型哺乳类 或其他鸟类 | |||
| 食性—食虫性 | 主要觅食昆虫 | |||
| 食性—杂食性 | 腐食性或觅食以上食物类型超过一类 | |||
| 觅食偏好 | 觅食—树冠 | 觅食于树冠及枝叶,植被中上层 | ||
| 觅食—地面 | 觅食于地面,植被中下层 | |||
| 觅食—水边 | 觅食于水面、水岸、湿生植被、滩涂 或其他靠近水体的区域 | |||
| 觅食—飞行 | 飞行觅食 | |||
| 觅食—其他 | 以上觅食区域超过一类者 | |||
| 迁徙偏好 | 迁徙—留鸟 | 一年四季均生活于中国 | ||
| 迁徙—冬候鸟 | 冬季到中国越冬 | |||
| 迁徙—夏候鸟 | 繁殖季节到中国繁殖 | |||
| 迁徙—旅鸟 | 春秋迁徙季节路过中国 | |||
| 迁徙—其他 | 在中国以上居留型超过一类者 |
注:生态位广度利用数据库Ecological Archives E095-178[29]进行计算,该数据库详细标明鸟类物种的每类饮食偏好和觅食偏好的估计使用百分比;饮食偏好和觅食偏好分别分为10类和7类,各类别估计使用百分比之和为100%;对于每个物种,我们计算了使用百分比大于0的饮食和觅食偏好的类别数量作为其饮食广度和筑巢广度。在中国不同地理分布下具有不同迁移偏好的物种被归类为“迁移—其他”。 |
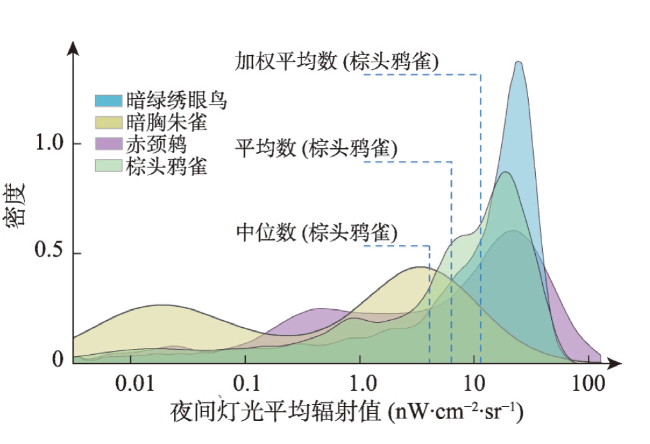
图2 给定物种的夜间灯光平均辐射值—密度分布Fig. 2 Night light average radiance-density distributions of given species |
表2 鸟类在观测点5 km缓冲区的响应统计值描述Tab. 2 Definition of features for measuring birds' response to urbanization in a 5-km buffer zone |
| 变量 | 统计量 | 平均值 | 标准差 |
|---|---|---|---|
| 城市与建筑区占比(%) | 加权平均数 | 0.13 | 0.14 |
| 平均数 | 0.15 | 0.14 | |
| 中位数 | 0.08 | 0.15 | |
| 人口平均密度 (人·km-2) | 加权平均数 | 1978.62 | 2812.61 |
| 平均数 | 2283.34 | 2922.10 | |
| 中位数 | 772.73 | 2193.48 | |
| 夜间灯光 平均辐射值 (nW·cm-2·sr-1) | 加权平均数 | 3.99 | 4.52 |
| 平均数 | 4.59 | 4.65 | |
| 中位数 | 2.24 | 4.55 |
注:城市适应性为9个城市化响应统计值的PC1描述。 |
表3 非系统发育和系统发育全局模型的模型平均结果Tab. 3 Results of averaged model for the non-phylogenetic and phylogenetic analysis |
| 变量 | 非系统发育分析 | 系统发育分析 | ||||||||
|---|---|---|---|---|---|---|---|---|---|---|
| Estimate | Std | Z | P | Sw | Estimate | Std | Z | P | Sw | |
| 生活史特征 | ||||||||||
| lg窝卵数 | 0.13 | 0.03 | 4.07 | < 0.001 | 1.00 | 0.19 | 0.04 | 4.35 | < 0.001 | 1.00 |
| lg卵重量 | -0.13 | 0.05 | 2.76 | 0.006 | 1.00 | -0.14 | 0.09 | 1.57 | 0.116 | 0.56 |
| lg体长 | 0.01 | 0.07 | 0.18 | 0.860 | 0.23 | 0.03 | 0.08 | 0.4 | 0.691 | 0.29 |
| 生态位广度 | ||||||||||
| 筑巢广度 | 0.03 | 0.03 | 0.99 | 0.320 | 0.37 | -0.04 | 0.03 | 1.25 | 0.212 | 0.44 |
| 饮食广度 | 0.07 | 0.03 | 2.26 | 0.024 | 0.87 | 0.09 | 0.03 | 2.60 | 0.009 | 1.00 |
| 筑巢偏好(以筑巢—地面为参照) | ||||||||||
| 筑巢—树冠 | 0.13 | 0.04 | 3.40 | 0.001 | 1.00 | -0.03 | 0.04 | 0.60 | 0.547 | 1.00 |
| 筑巢—其他 | 0.06 | 0.06 | 0.98 | 0.328 | 1.00 | 0.08 | 0.05 | 1.79 | 0.073 | 1.00 |
| 筑巢—建筑 | 0.04 | 0.07 | 0.56 | 0.575 | 1.00 | 0.21 | 0.07 | 3.23 | 0.001 | 1.00 |
| 筑巢—水边 | 0.05 | 0.05 | 0.86 | 0.389 | 1.00 | 0.07 | 0.05 | 1.41 | 0.157 | 1.00 |
| 饮食偏好(以食性—杂食性为参照) | ||||||||||
| 食性—食植性 | -0.12 | 0.05 | 2.57 | 0.010 | 1.00 | |||||
| 食性—食虫性 | 0.05 | 0.04 | 1.13 | 0.259 | 1.00 | |||||
| 食性—食肉性 | 0.07 | 0.06 | 1.2 | 0.229 | 1.00 | |||||
| 迁徙偏好(以迁徙—留鸟为参照) | ||||||||||
| 迁徙—旅鸟 | 0.54 | 0.08 | 7.19 | < 0.001 | 1.00 | 0.32 | 0.07 | 4.85 | < 0.001 | 1.00 |
| 迁徙—其他 | 0.41 | 0.04 | 9.30 | < 0.001 | 1.00 | 0.36 | 0.04 | 9.76 | < 0.001 | 1.00 |
| 迁徙—夏候鸟 | 0.39 | 0.07 | 5.40 | < 0.001 | 1.00 | 0.07 | 0.05 | 1.40 | 0.161 | 1.00 |
| 迁徙—冬候鸟 | 0.24 | 0.06 | 4.06 | < 0.001 | 1.00 | 0.08 | 0.06 | 1.39 | 0.165 | 1.00 |
注:Estimate为标准化参数估计;Std为标准差;Z为z分数;P值加粗表明在5%水平下具有显著性;Sw为平均模型中变量所占总权重。由于非系统发育和系统发育分析中,平均的顶部模型均不包括觅食偏好,故将其从表中删除。 |
表4 响应变量和连续的预测变量的系统发育信号分析Tab. 4 Phylogenetic signal analysis of dependent variables and continuous independent variables |
| 变量 | Moran's I | Abouheif's Cmean | Pagel's λ | Blomberg's K | |||||||
|---|---|---|---|---|---|---|---|---|---|---|---|
| Statistic | P | Statistic | P | Statistic | P | Statistic | P | ||||
| 城市适应性 | 0.200 | 0.001 | 0.201 | 0.001 | 0.314 | <0.001 | 0.054 | 0.188 | |||
| lg窝卵数 | 0.544 | 0.001 | 0.546 | 0.001 | 0.791 | <0.001 | 0.153 | 0.001 | |||
| lg卵重量 | 0.851 | 0.001 | 0.851 | 0.001 | 0.931 | <0.001 | 0.950 | 0.001 | |||
| lg体长 | 0.824 | 0.001 | 0.825 | 0.001 | 0.953 | <0.001 | 0.459 | 0.001 | |||
| 筑巢广度 | 0.359 | 0.001 | 0.359 | 0.001 | 0.640 | <0.001 | 0.060 | 0.006 | |||
| 饮食广度 | 0.405 | 0.001 | 0.405 | 0.001 | 0.670 | <0.001 | 0.038 | 0.564 | |||
注:Statistic为统计值;P < 0.05表明在5%水平下具有显著性。 |
表5 不同尺度下基于AIC准则的非系统发育和系统发育最优模型Tab. 5 Best models of non-phylogenetic and phylogenetic analysis based on AIC criteria at different scales |
| 尺度 | 类别 | 最优模型 | AICc |
|---|---|---|---|
| 国家 | 非系统 发育分析 | 城市适应性=0.13lg窝卵数-0.14lg卵重量+0.08饮食广度+0.13筑巢树冠+ 0.06筑巢其他+0.04筑巢建筑+0.05筑巢水边+0.41迁徙其他+ 0.54迁徙旅鸟+0.39迁徙夏候鸟+0.24迁徙冬候鸟-0.24 | 1188.19 |
| 系统 发育分析 | 城市适应性=0.19lg窝卵数-0.13lg卵重量+0.09饮食广度-0.02筑巢树冠+ 0.08筑巢其他+0.22筑巢建筑+0.08筑巢水边+0.07食性食肉性- 0.12食性食植性+0.05食性食虫性+0.36迁徙其他+0.31迁徙旅鸟+ 0.06迁徙夏候鸟+0.08迁徙冬候鸟-0.1 | 1522.47 | |
| 省域 (高纬度) | 非系统 发育分析 | 城市适应性=-0.19lg卵重量-0.09饮食广度+0.21筑巢树冠+0.07筑巢其他- 0.07筑巢建筑+0.04筑巢水边+0.25觅食树冠-0.12觅食飞行- 0.05觅食其他-0.14觅食水边+0.15迁徙其他+0.21迁徙旅鸟- 0.06迁徙夏候鸟+0.01迁徙冬候鸟-0.1 | 551.52 |
| 系统 发育分析 | 城市适应性=-0.14lg窝卵数+0.34觅食树冠+0.11觅食飞行+0.01觅食其他- 0.16觅食水边-0.09 | 655.01 | |
| 省域 (中纬度) | 非系统 发育分析 | 城市适应性=0.08lg窝卵数+0.07筑巢广度+0.08饮食广度+0.16觅食树冠- 0.1觅食飞行-0.01觅食其他-0.1觅食水边-0.15食性食植性+ 0.12食性食虫性+0.15迁徙其他+0.12迁徙旅鸟+0.07迁徙冬候鸟-0.04 | 1159.64 |
| 系统 发育分析 | 城市适应性=0.2lg窝卵数-0.21lg卵重量+0.13饮食广度-0.07筑巢树冠+ 0.18筑巢其他+0.26筑巢建筑+0.06筑巢水边+0.15迁徙其他+ 0.05迁徙旅鸟-0.01迁徙夏候鸟-0.07迁徙冬候鸟+0.03 | 1328.67 | |
| 省域 (低纬度) | 非系统 发育分析 | 城市适应性=0.05lg窝卵数-0.09lg卵重量+0.07饮食广度+0.36迁徙其他+ 0.63迁徙旅鸟+0.48迁徙夏候鸟+0.22迁徙冬候鸟-0.19 | 1033.37 |
| 系统 发育分析 | 城市适应性=0.08lg(窝卵数)-0.25lg(卵重量)+0.33lg(体长)+0.1筑巢树冠+ 0.12筑巢其他+0.27筑巢建筑+0.17筑巢水边-0.1觅食树冠+ 0.04觅食飞行-0.13觅食其他+0.05觅食水边+0.29迁徙其他+ 0.66迁徙旅鸟+0.1迁徙夏候鸟-0.18迁徙冬候鸟-0.20 | 1596.52 | |
| 城市 (北京) | 非系统 发育分析 | 城市适应性=0.09lg窝卵数+0.2筑巢树冠-0.05筑巢其他-0.01筑巢建筑- 0.02筑巢水边+0.15觅食树冠-0.1觅食飞行+0.12觅食其他- 0.16觅食水边-0.04食性食肉性-0.21食性食植性+ 0.08食性食虫性+0.04 | 611.25 |
| 系统 发育分析 | 城市适应性=0.23lg窝卵数+0.07筑巢树冠+0.09筑巢其他+0.25筑巢建筑+ 0.11筑巢水边+0.17觅食树冠-0.03觅食飞行-0.22觅食水边+ 0.04食性食肉性+0.01食性食植性-0.17食性食虫性+0.21迁徙其他+ 0.17迁徙旅鸟+0.07迁徙夏候鸟+0.07迁徙冬候鸟-0.16 | 782.66 | |
| 城市 (上海) | 非系统 发育分析 | 城市适应性=0.43lg卵重量-0.11lg体长+0.07筑巢广度+0.13饮食广度+ 0.2觅食树冠-0.15觅食飞行+0.01觅食其他-0.1觅食水边- 0.53迁徙其他-0.68迁徙旅鸟-0.33迁徙夏候鸟-0.28迁徙冬候鸟+0.43 | 417.05 |
| 系统 发育分析 | 城市适应性=0.21lg窝卵数+0.23饮食广度+0.07筑巢树冠-0.02筑巢其他+ 0.52筑巢建筑-0.05筑巢水边+0.44食性食肉性+0.09食性食植性+ 0.69食性食虫性-0.53迁徙其他-0.43迁徙旅鸟-0.77迁徙夏候鸟- 0.69迁徙冬候鸟+0.07 | 717.00 | |
| 城市 (广州) | 非系统 发育分析 | 城市适应性=0.06lg卵重量+0.11筑巢广度+0.08食性食肉性+0.02食性食植性+ 0.17食性食虫性-0.04 | 519.54 |
| 系统 发育分析 | 城市适应性=0.13筑巢广度+0.05筑巢树冠+0.04筑巢其他+0.23筑巢建筑- 0.26筑巢水边-0.07觅食飞行-0.18觅食其他+0.28觅食水边+ 0.13迁徙其他+0.02迁徙旅鸟+0.35迁徙夏候鸟+0.21迁徙冬候鸟-0.2 | 664.37 |
| [1] |
[曹铭昌, 乐志芳, 雷军成, 等. 全球生物多样性评估方法及研究进展. 生态与农村环境学报, 2013, 29(1): 8-16.]
|
| [2] |
|
| [3] |
|
| [4] |
[张征恺, 黄甘霖. 中国城市鸟类学研究进展. 生态学报, 2018, 38(10): 3357-3367.]
|
| [5] |
[毛齐正, 马克明, 邬建国, 等. 城市生物多样性分布格局研究进展. 生态学报, 2013, 33(4):1051-1064.]
|
| [6] |
[张林波, 李伟涛, 王维, 等. 基于GIS的城市最小生态用地空间分析模型研究: 以深圳市为例. 自然资源学报, 2008, 23(1): 69-78.]
|
| [7] |
[樊杰, 赵鹏军, 周尚意, 等. 人文地理学学科体系与发展战略要点. 地理学报, 2021, 76(9): 2083-2093.]
|
| [8] |
|
| [9] |
|
| [10] |
|
| [11] |
|
| [12] |
|
| [13] |
|
| [14] |
|
| [15] |
|
| [16] |
|
| [17] |
|
| [18] |
|
| [19] |
|
| [20] |
[杨丽慧, 郑有飞, 许遐祯, 等. 气候变化对两种候鸟物候期的影响初探: 以大丰市调查为例. 中国农业气象, 2010, 31(3): 338-343.]
|
| [21] |
[闻丞, 顾垒, 王昊, 等. 基于最受关注濒危物种分布的国家级自然保护区空缺分析. 生物多样性, 2015, 23(5): 591-600.]
|
| [22] |
[黄越, 顾燚芸, 李雪珊, 等. 北京市平原区受胁鸟类栖息地识别和评价. 风景园林, 2019, 26(1): 32-36.]
|
| [23] |
|
| [24] |
|
| [25] |
|
| [26] |
[张雁云, 张正旺, 董路, 等. 中国鸟类红色名录评估. 生物多样性, 2016, 24(5): 568-579.]
|
| [27] |
|
| [28] |
|
| [29] |
|
| [30] |
|
| [31] |
|
| [32] |
|
| [33] |
|
| [34] |
|
| [35] |
|
| [36] |
|
| [37] |
|
| [38] |
|
| [39] |
|
| [40] |
|
| [41] |
|
| [42] |
|
| [43] |
|
| [44] |
[谢世林, 曹垒, 逯非, 等. 鸟类对城市化的适应. 生态学报, 2016, 36(21): 6696-6707.]
|
/
| 〈 |
|
〉 |