This paper reviewed the main expedition and scientific investigation activities on the Tibetan Plateau (TP) before 1949. The history of scientific investigations on the TP can be divided into four stages: (1) The investigations in ancient times were mainly sporadic records of geographical phenomena in some parts of the TP by Chinese monks and Western Christian missionaries. (2) In the late Qing Dynasty, foreign and Chinese scholars and explorers, mainly Westerners, carried out preliminary scientific investigations. (3) 1912-1949, Chinese scholars began to take part in sino-foreign investigation teams to explore the TP. (4) Chinese scholars led scientific investigations in some regions during the Period of the Republic of China. The expedition on the TP mainly focused on geographical description, data collection, and single-subject investigation and research before the Qing Dynasty, which changed to the measurement of geographical elements with simple scientific instruments and in-depth research on a certain topic (such as vegetation) in some regions during the Period of the Republic of China. A remarkable feature of the investigations by Chinese scholars on the TP during the Period of the Republic of China was that they changed from cooperation with Western scientists in joint scientific investigations to independent investigation of geography, geomorphology, geology, meteorology, climate and plants. Some achievements by Chinese researchers have spread worldwide, which expanded the domestic and international understanding of the TP.
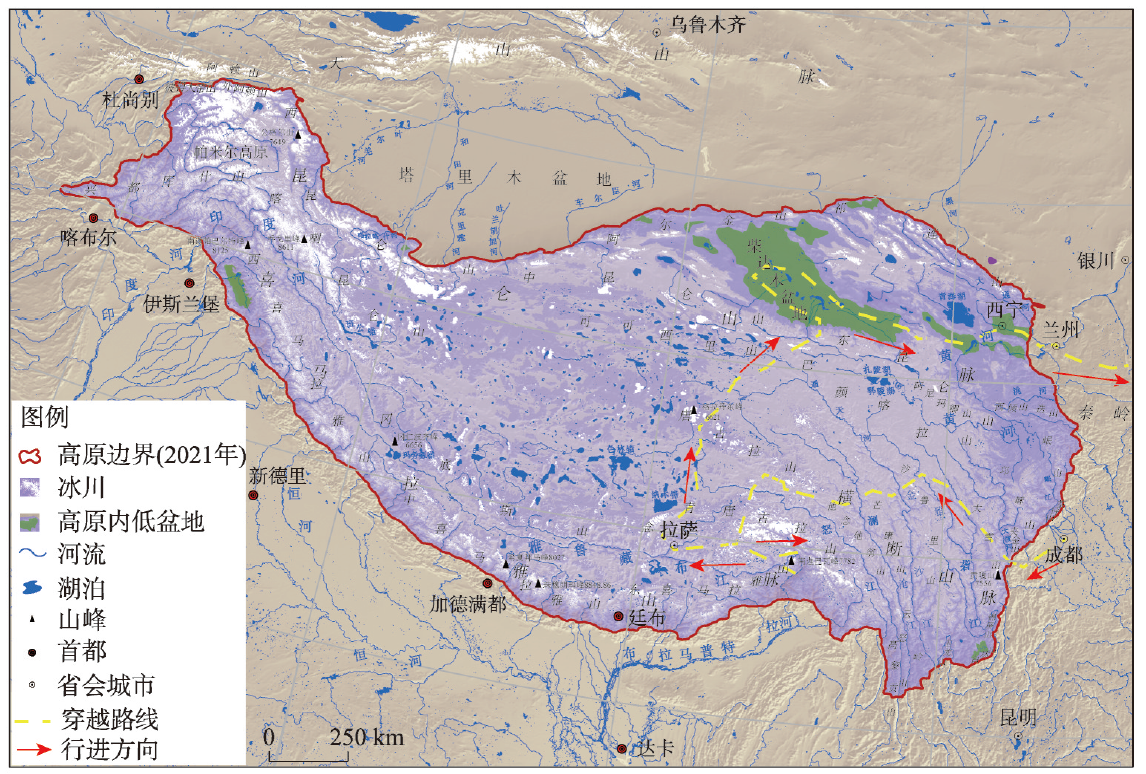
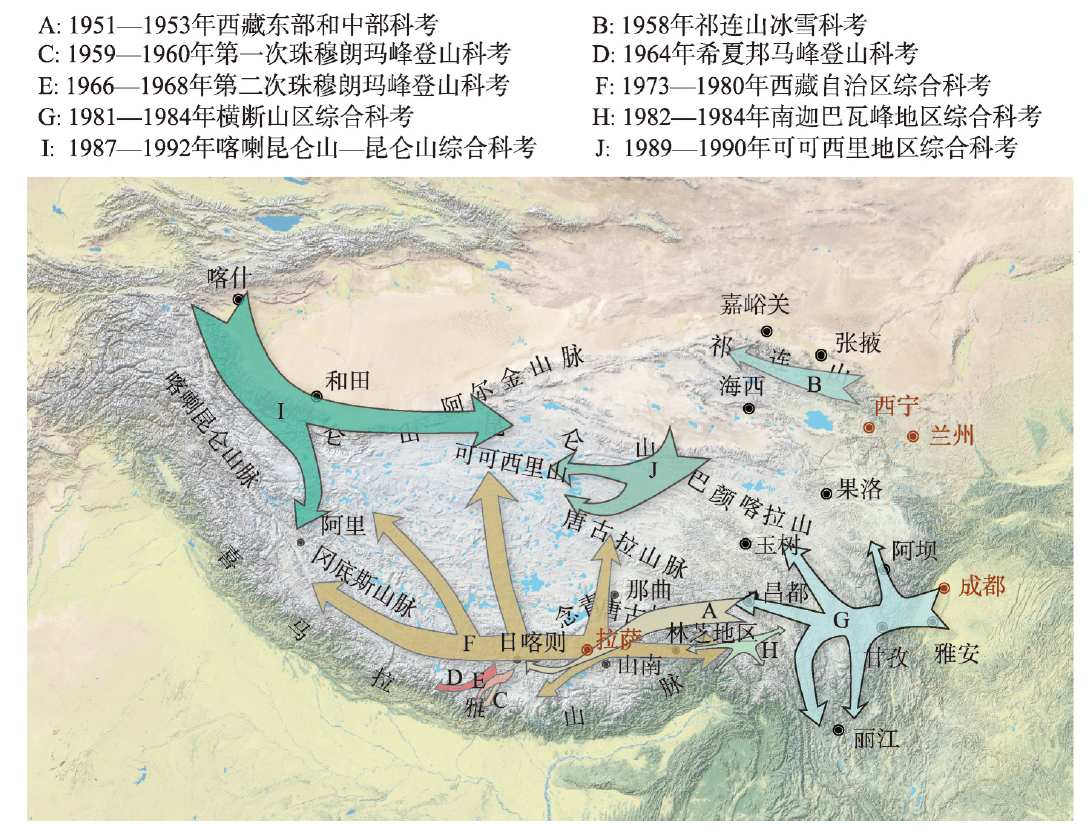
The Tibetan Plateau (TP), also known as the roof of the world and the Asian Water Tower, is an important ecological security barrier for China. Since 1949, scientific expedition and research on the TP has always been a major scientific and technological task at the national strategic level. This paper reviewed the scientific expedition and research activities carried out by Chinese scientists on the TP from 1949 to 2017, before the initiation of the Second Tibetan Plateau Scientific Expedition and Research (STEP). These activities can be divided into four stages: (1) Regional and thematic scientific expedition and research carried out from the early 1950s to the late 1960s, which obtained important scientific data, laid the foundation for the large-scale expedition and research starting from the 1970s. (2) The first comprehensive scientific expedition and research on the TP during 1973-1992, which investigated the full range of TP covering an area of 2.6 million km2, collected a large number of first-hand scientific data, filled in the gaps in some areas and disciplines of the TP research, and had significant scientific and societal impacts. (3) Scientific question-oriented expedition and research from the early 1990s, promoted by national and international scientific projects, has achieved a milestone transformation from static to dynamic processes, from qualitative to quantitative analyses, and from single discipline to multi-disciplinary integration on TP research. (4) Since its founding in 2003, the Institute of Tibetan Plateau Research, Chinese Academy of Sciences has been leading multi-disciplinary research teams, and conducted institutionalization and group-oriented expedition and research in field observations, laboratory systems and international networks. At present, the STEP is being carried out and the reviewing of the fruitful achievements in the past will inspire the STEP team to be actively involved in the TP research.
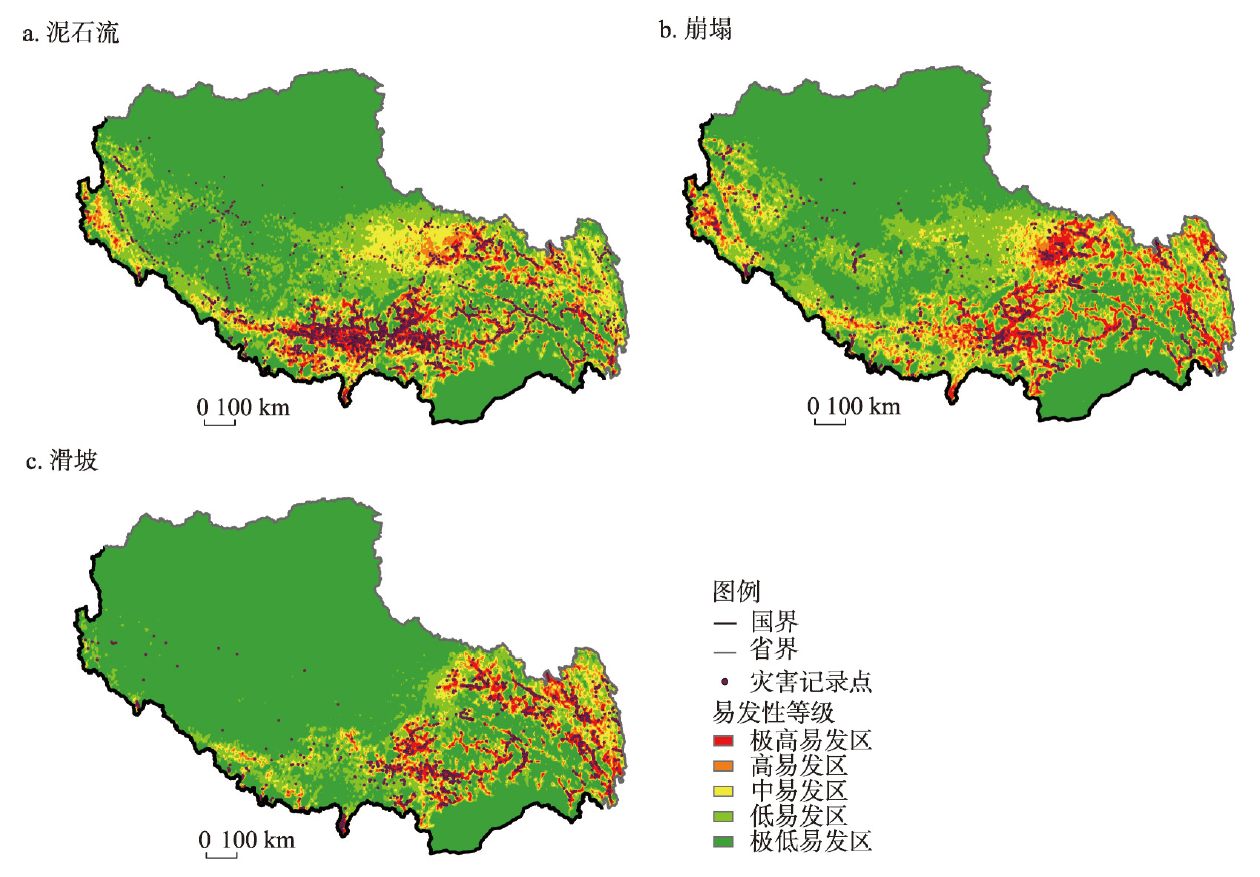
Tibet is recognized as the key repository and focal area for future hydropower development in China because of its high capacity for hydropower storage; however, frequent occurrence of geological hazards in this region have posed great challenges to us. Priority should be given to the effects of geological hazards on the suitability of areas in Tibet for hydropower development. Based on the maximum entropy model, the susceptibility of potential development areas to three typical geological hazards (debris flow, avalanche, and landslide) was calculated using data of landforms, hydrometeorology, and vegetation coverage of Tibet. Furthermore, hydropower development suitability was evaluated by considering distribution of potential hydropower storage alongside geological hazard susceptibility. The results show that the Qiangna-Bangxin section of the Great Bend of the Yarlung Tsangpo River has the highest suitability and would be a prime development target. The Mali-Linka and Zhonglinka-Chawalong sections in the middle reaches of the Nujiang River, the Tiantuo-Bitu section of the Weiqu River, the Chaya-Cuowa, Rumei-Yanjing, and Muxie-Gobo sections in the upper reaches of the Jinsha River, the Motuo-Lijia and Xiaru-Penji sections in the lower and upper reaches, respectively, of the Yarlung Tsangpo River, and the Pengqu River Basin in the Himalayas are all highly suitable for hydropower development. However, these areas also show high susceptibility to geological hazards, so they should be developed with caution. The Renbu-Qushui section in the middle reaches of the Yarlung Tsangpo River, the Zhongyu-Yigong section of the Yigong Tsangpo River, the southern section of the Chayu River, and the lower reaches of the Langqin Tsangpo River show moderate suitability and low hazard susceptibility, and thus present future development opportunities. Therefore, other areas are not suitable for hydropower development. This study presents an effective suitability evaluation method for hydropower development in Tibet, and its results provide a scientific basis for hydropower planning and site selection in this region.
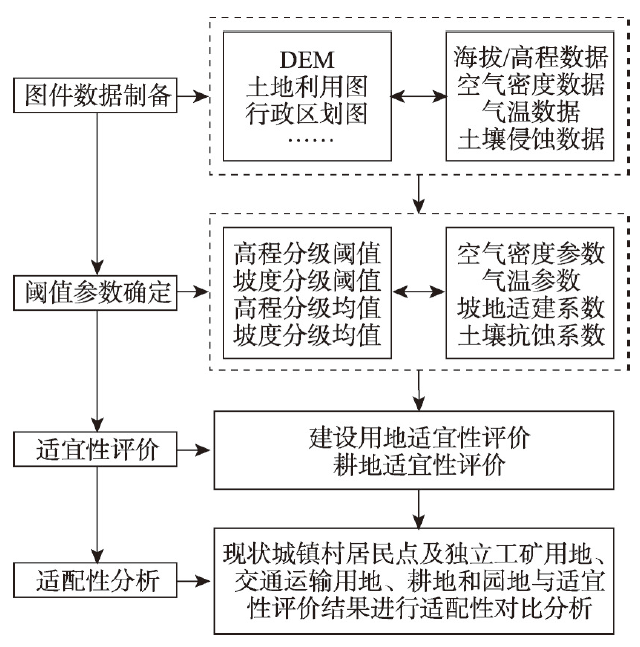
The existing human activity suitability evaluation of land resources in China has the defects of insufficient theoretical support in terms of basic data accuracy, elevation and slope classification and suitability grade judgement. When it is applied empirically, there are some problems such as excessive evaluation factors, difficulty in obtaining indicator data, and low altitude of applicable regions. In this paper, we constructed a technical evaluation framework applicable to the Qinghai-Tibet Plateau, and established a grid-scale evaluation model for construction land suitability and cultivated land suitability after selecting key parameters that vary with topographic elevation and slope. And then we proposed a generalized algorithm for key parameters such as atmosphere density, air temperature, slope suitability for construction, and soil erosion resistance of sloping cultivated land. With Milin County in southeastern Tibet as an example, the empirical research has been carried out according to the interval of 100 m in elevation and 1° in slope. In addition, grid precisions of 30 m, 50 m, 100 m, 250 m, 500 m, and 1000 m are tested. This article obtains four conclusions: (1) The construction land suitability and cultivated land suitability can be classified into five levels: suitable, relatively suitable, moderately suitable, less suitable, and unsuitable. Under the grid precision of 30 m, the five levels of construction land suitability account for 1.26%, 2.92%, 2.12%, 2.77%, and 90.93%, respectively. Compared with 30 m, the area ratio results of 50 m, 100 m and 250 m have the errors of ±0.34%, ±0.34% and ±1.11%, respectively. Similarly, the area ratio of each level of cultivated land suitability with a 30 m grid precision is 0.72%, 3.07%, 2.62%, 1.35%, and 92.25%, the errors between it and the results under grid precision of 50 m, 100 m, and 250 m are ±0.52%, and the errors of 500 m and 1000 m grid precisions for both construction land suitability and cultivated land suitability are relatively larger than those of the other grid precisions. (2) Current construction lands (i.e., settlements of cities, towns and villages, industrial and mining lands) in the study area are mainly distributed in areas with levels of relatively suitable, suitable, and moderately suitable according to the distribution ratio. Under grid precisions of 30 m, 50 m, and 100 m, the total land areas of these three levels account for 95.96%, 95.96%, and 94.74%, respectively. Current cultivated land and plantation land are distributed in areas with levels of relatively suitable, moderately suitable, and suitable, accounting for more than 96% of different grid precisions. (3) The empirical research shows that evaluation method, quantitative model, and parameter algorithm for evaluating the human activity suitability of land resources in the Qinghai-Tibet Plateau are feasible and applicable. In the actual evaluation, the grid precision should be controlled within 100 m, and the maximum cannot exceed 250 m. (4) This study established a corresponding pedigree between construction land suitability and cultivated land suitability and topographic elevation and slope that can be applied to the Qinghai-Tibet Plateau. Meanwhile, some professional defects are analyzed of available land resources evaluation methods in major function-oriented zoning and "Double Evaluations" of territorial spatial planning in China when applied to the Qinghai-Tibet Plateau.
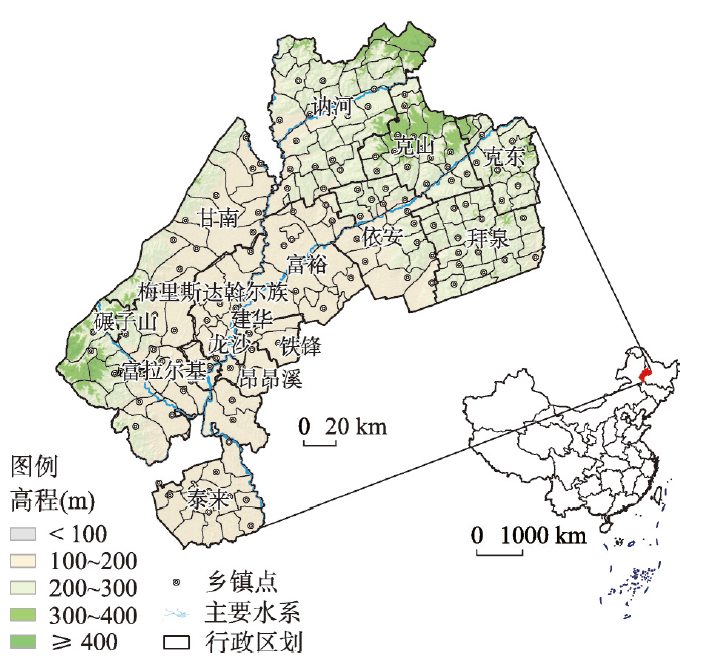
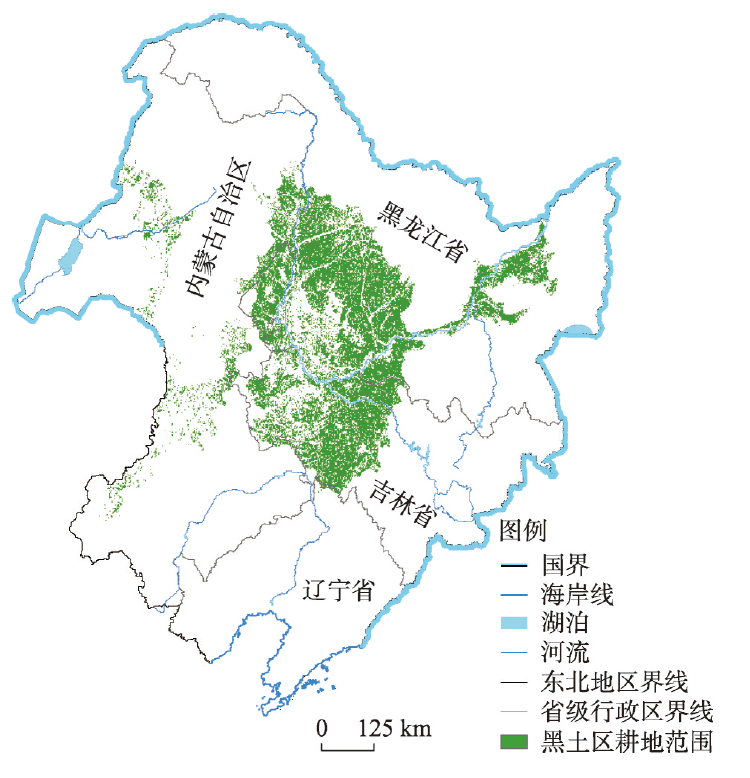
The black soil area in Northeast China serves as a "ballast" to ensure China's food security. Unreasonable development and utilization lead to serious black soil degradation in some areas and affect regional food production and economic and social development. In the context of the intensification of the contradiction between food supply and demand around the world, we should pay more attention to the overall situation of regional sustainable development, and seek for systematic, scientific, and economic solutions. Guided by the concept of integrated geography, this study establishes a regional all-for-one customization model of black soil granary on the basis of the regional system of human-land relationship, customized and accurate management, agricultural system theory, and agricultural informatization. The aim of this regional all-for-one customization model is to systematically diagnose the key problems and leading factors of black soil degradation and find out a solution that combines the commonness and individuality of black soil protection from the perspective of multi-scale linkage, multi-factor coupling, and multi-technology cooperation. The regional all-for-one customization model of black soil granary integrates the two perspectives of "global" and "customization" into the protection and comprehensive utilization of black soil for the first time. It adopts zoning, grading, and classification as the main strategy and big data and artificial intelligence as the main technical approaches. Relying on the "satellite-air-ground network" three-dimensional monitoring system and combined with the all-for-one customization platform driven by big data and artificial intelligence, the model constructs three strategies of different scales. First, "implementing strategies by regions" are implemented at the regional scale to formulate the regional agricultural resource allocation scheme and agricultural zoning, which can provide strategies to protect and utilize black soil effectively. Second, the "determining strategies according to villages" is implemented at the village scale to formulate the black soil protection and utilization model for different categories of villages, which can promote the organic integration of black soil protection and rural revitalization. Third, the "one strategy for one field" concept is applied at the field scale to provide accurate strategies for soil restoration and yield improvement in a fixed, quantitative, and regular manner. Multi-scale integrated demonstration and scheme verification of the regional all-for-one customization model of black soil granary are conducted in Qiqihar city at three scales, namely, region, village, and field, to solve the key issues in black soil protection and utilization and form a replicable and popularized system solution, thus providing a model for the sustainable development of Chinese and global black soil agriculture. The regional all-for-one customization model of black soil granary has important theoretical and practical value in promoting the high-quality development of regional agriculture and rural revitalization, and it provides a demonstration model of land protection and utilization for the black soil area in China and the whole world.
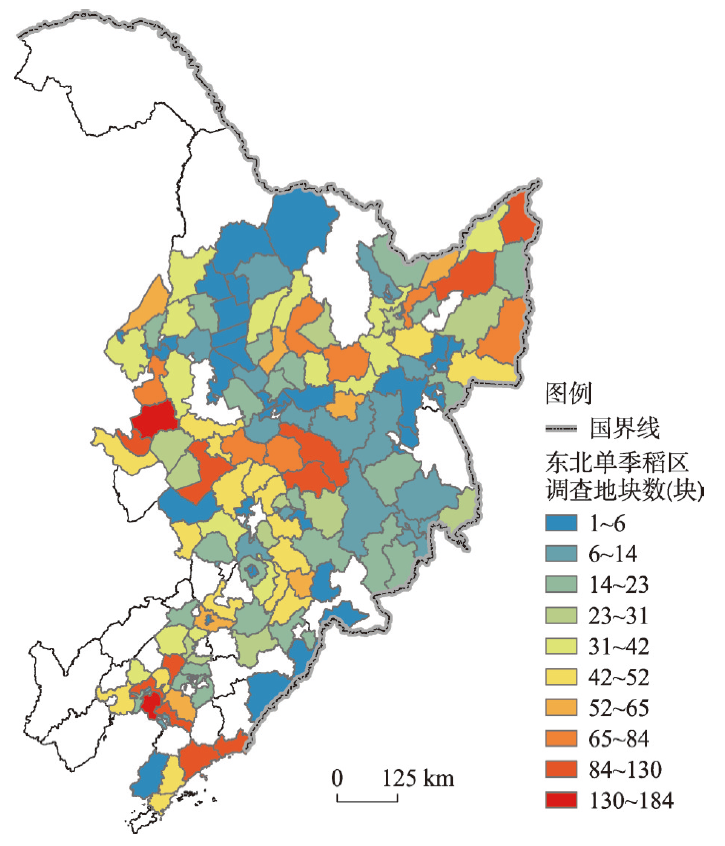
The Northeast China Plain is an important commercial grain production base of the country, with rice being one of the region's principal food crops. Despite the exceptional quality and fertility of the region's black soil, excessive fertilizer application is nonetheless widespread. As a result, large-scale surveys and soil incubation experiments were conducted in Heilongjiang, Jilin and Liaoning provinces to clarify the spatial pattern, differential characteristics and the reduction potential of rice fertilization in the black soil area. The findings revealed that both netrogen (N) application intensity and economic yield dropped progressively from south to north in the region, with the decrease in N application intensity being greater than that in yield. As a result, N fertilizer partial productivity steadily increased from south to north. Compared to the theoretically suitable N application rate, the theoretical N reduction potential of rice area in Liaoning, central and western Jilin and Heilongjiang were determined to be 16.7%~24.7%, 8.7%~17.8%, and 2.0%~11.4%, respectively. In the three provinces, there is no significant difference in the quantity of accumulative soil mineralization of typical rice soils. Therefore, variances in N application to rice in Heilongjiang, Jilin, and Liaoning are mostly influenced by changes in the N quantity carried by aboveground biomass.
In China, the national spatial planning system is built largely upon prefectural plans, a critical part of which in many prefecture-level cities would be agricultural planning. When we develop such plans for the black soil regions in Northeast China, much effort is needed to guarantee both the black soil conservation and food security, given the rarity and importance of the black soil to agricultural use. In this research, we took Qiqihar as a case to establish an evaluation index system of land space function in the black soil areas that integrated grid-scale and administrative regional-scale. We analyzed the spatio-temporal evolution features of the production-living-ecological space (PLES) in the study area and evaluated their coupling coordination. Based on this analysis, we put forward an optimal strategy for spatial planning regulation to meet the requirement of the diversified regional development and social demands in Qiqihar in the context of prioritizing black soil preservation and food security. The main conclusions can be drawn as follows: regarding the production-life-ecology function, the mildly imbalanced and barely coordinated areas increased from 2010 to 2018, when the production and living space grew to a certain extent. The low coordination of PLES, the regionally varied conflict between different functional spaces, and the potential risks of unsustainable development of black soil resources jointly constituted the conflict arising from its spatial planning. Eventually, we constructed a configuration model for optimizing spatial planning under the constraint of conflict between PLES on multiple scales. It is our suggestion that the enhancement of functional spatial planning at the prefecture level should drive the priority on which the national food security is based, by which the black soil preservation is oriented, and on which the allocation of "human-water-land" resources depends. To achieve such enhancement with the advantages of our prosperous industry, we should wisely channel the advantages of particular regions toward better development, promote the accelerated development of the critical cities and towns, improve the utilization efficiency of black soil resources, and encourage effective land use of towns in harmony with that of counties.
The black soil region of Northeast China is the major food base and one of the most sensitive regions to climate change in China. However, the characteristics of crop phenological response, the integrated impact of climatic and phenological changes on agricultural productivity in the black soil region of Northeast China under the background of climate change are not clear, the quantitative degree of future agricultural risk assessment is insufficient, and the risk level formulation lacks a basis. Therefore, based on remote sensing products, climate data and model simulations, this study integrated the logistic function fitting curvature derivation, multiple linear regression and scenario simulation to investigate the crop phenology dynamics and its climate response characteristics in this black soil region, and to identify the compound effects of climate and phenology changes on agricultural production and possible future risks. Results show that: (1) From 2000 to 2017, about 29.76% of the black soil region of Northeast China showed a significant delay in the onset of the growing season and 16.71% of the total area showed an advancing trend in the end of the growing season. The time lag effects of the onset of the growing season for crop response to climatic factors depended on site and climatic parameters, with the widespread influence of temperature and its lag time longer in general. (2) Both climatic and phenological changes have a significant effect on the interannual variability of crop production, and the explanatory capacity of both increased by 70.23% and the explanatory area expanded by 85.04% compared to that of climate change in the same period of the growing season. (3) Under RCP8.5 scenario, the future crop yield would show a decrease in the north and increase in the south, and when the global temperature rises by 2.0 ℃, the crop yield of southern Songnen black soil subregion would reduce by nearly 10%. Spatial and temporal variation of drought would adversely affect crop production. The study will help to understand the mechanisms underlying climate change, phenological response and productivity dynamics, and also help to strengthen the risk management of agro-meteorological disasters, which is important to ensure national food security and regional climate change response.
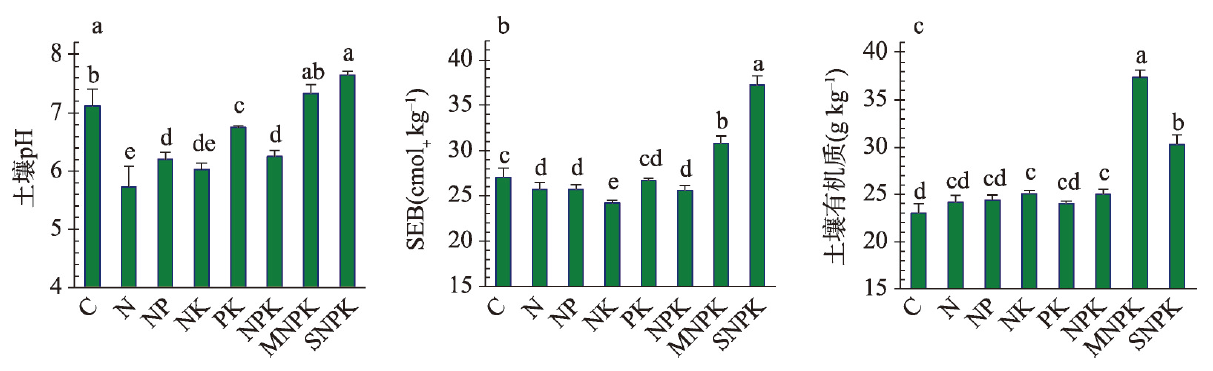
Long-term application of chemical fertilizers can lead to soil acidification, basic cation depletion, nutrient imbalance and heavy metal pollution of crops in farmland of Black Soil regions. Based on a 25-year National Black Soil Fertilizer Efficiency Monitoring Experiment in Gongzhuling, Jilin Province, the effects of 8 different fertilization treatments on soil acid neutralizing capacity (ANC) was examined, including no fertilization (Control or C), N, NP, NK, PK, NPK, combination of farmyard manure with chemical fertilizers (MNPK), and corn stalk return (SNPK). The application rates of N, P and K were 165, 36 and 68.5 kg hm-2 a-1, respectively, and N input was the same among NPK, MNPK and SNPK treatments. Results showed that chemical fertilizer application decreased topsoil pH by 0.37-1.39, while MNPK and SNPK treatments increased soil pH by 0.21 and 0.53, respectively. Acid neutralizing capacity as soil pH dropped to 5.0 (ANCpH 5.0) of N, NP, NK, PK and NPK treatments was 42.85%, 61.79%, 54.05%, 82.26% and 63.68% of the Control, respectively, while the ANCpH 5.0 of MNPK treatment was 1.86 times of the Control. With 160 mmol kg-1 H+ addition, the pH of SNPK-treated soil only decreased from 7.65 to 6.42, showing an extremely strong acid neutralizing capability. Soil exchangeable base cations were 1.37 and 1.14 times, while soil organic matters were 1.32 and 1.63 times, in SNPK and MNPK treatments as much as that in the Control, respectively, which are two main factors in improving soil ANC. In brief, the addition of organic materials significantly improved the anti-acidification properties and soil basic fertility level of the black soil. The results could provide theoretical basis and data support with long-term experiment evidence for the practices of conservation tillage with corn stalk return and chemical fertilizers partly substituted by farm-yard manure in black soil regions of Northeast China.
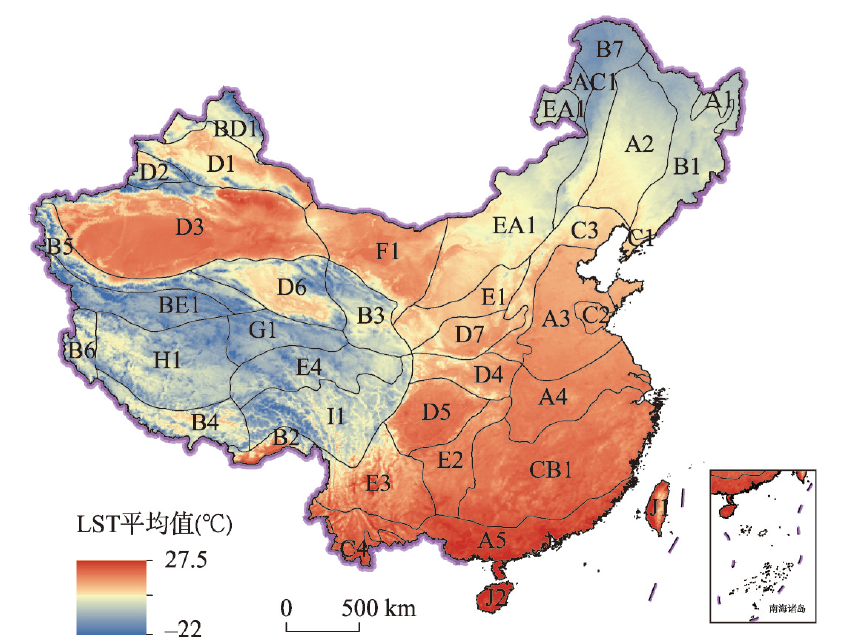
The variation of land surface temperature (LST) has a vital impact on the energy balance of the land surface process and the ecosystem stability. Based on MDO11C3, we used methods including regression analysis, GIS spatial analysis, correlation analysis, and center-of-gravity model, etc., to analyze the LST variation and its spatiotemporal diversity in China from 2001 to 2020. Finally, the Geodetector was used to identify the leading factors of LST variation in 38 eco-geographical zones of China, and explore the causes of its pattern. The results show that: (1) the average LST in China from 2001 to 2020 is 9.6 ℃, which is high in the plains, and low in the mountainous areas. Generally, LST has a striking negative correlation with altitude, with a correlation coefficient of -0.66. China's First Ladder has the most conspicuous negative correlation, with a correlation coefficient of -0.76 and the lapse rate of LST is 0.57 ℃/100 m. (2) The change rate of LST in China during the study period is 0.21 ℃/10 a, and the warming area accounts for 78%, showing the spatial characteristics of "multi-core warming and axial cooling" in general. (3) LST's variation has prominent seasonal characteristics in the whole country. The spatial distribution of average value in winter and summer is quite different and fluctuates obviously; the moving trajectory of the centroid in the warming/cooling area is close to a loop shape. The movement direction shows the corresponding seasonal reverse, and the movement range in the cooling zone is larger, indicating that the regional difference and seasonal variability of the cooling zone are more obvious. (4) China's LST variation is driven by natural conditions and human activities, of which natural factors contribute more, with sunshine hours and altitude being the key factors. The boundary trend between the two dominant type areas is highly consistent with the "Heihe-Tengchong Line". The eastern region is mostly dominated by human activity intensity and interacts with terrain factors, while the western region is dominated by natural factors, which enhance/weaken the change range of LST through mutual coupling with the climate, terrain, vegetation, and other factors. This study can provide scientific references for dealing with climate change, analyzing surface environmental models, and protecting the ecological environment.
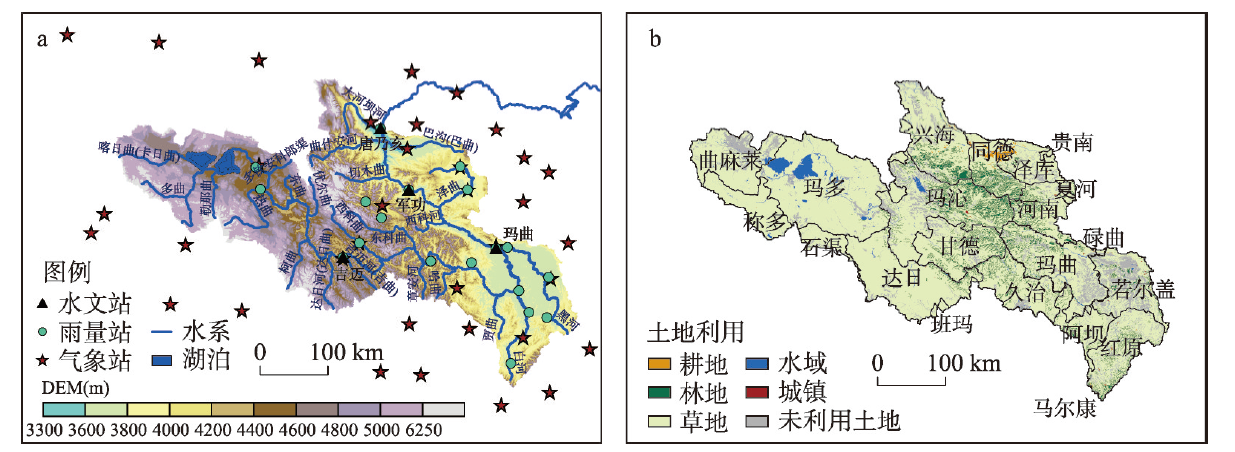
Vegetation recovery under global change and its consequent evolution of eco-hydrological processes have modulated the water resources conservative capacity in the source region of the Yellow River (YRSR). Based on climatological data, remotely sensed vegetation index and geographical information, the integrated simulations of water and carbon cycles in the YRSR are presented, with the vegetation interface processes (VIP) distributed eco-hydrological dynamic model. Then the co-evolving mechanisms of hydrological and vegetation dynamics are investigated. Results show that warming and wetting climate in the YRSR has improved the vegetation growing condition and extended the growing period for more than 10 days in recent decades. Averaged NDVI from 2010 to 2020 increased by 4.5% relative to that from 2000 to 2009. Vegetation gross primary productivity (GPP) shows a significant uptrend with a rate of 4.57 gC m-2 a-1, 77% of which is contributed by climate change and elevated atmosphere CO2 fertilization, and the rest 23% is by vegetation greening. Evapotranspiration (ET) is increasing at a rate of 2.54 mm a-1 and vegetation water use efficiency (WUE, expressed as GPP/ET) is also improving at a relative rate of 5.1% a-1. Generally, annual ET, GPP and WUE and their trends are decreasing along the elevation below 4200 m. At basin scale, there are significant positive correlations between the vegetation greenness and the runoff coefficient with precipitation in the current and previous years, demonstrating a legacy effect of precipitation for vegetation recovery on water conservation capacity. The increased ET might be a benefit to the water recycle between land surface and atmosphere, which will alleviate the reduced potential of water yield owing to ecological restoration and establish trades-off and synergies among precipitation, vegetation and water yield. Conclusively, exploring the mechanisms of hydrological responses to climate change and vegetation recovery and its feedback will provide scientific support to the assessment of ecological engineering programs in the source regions.
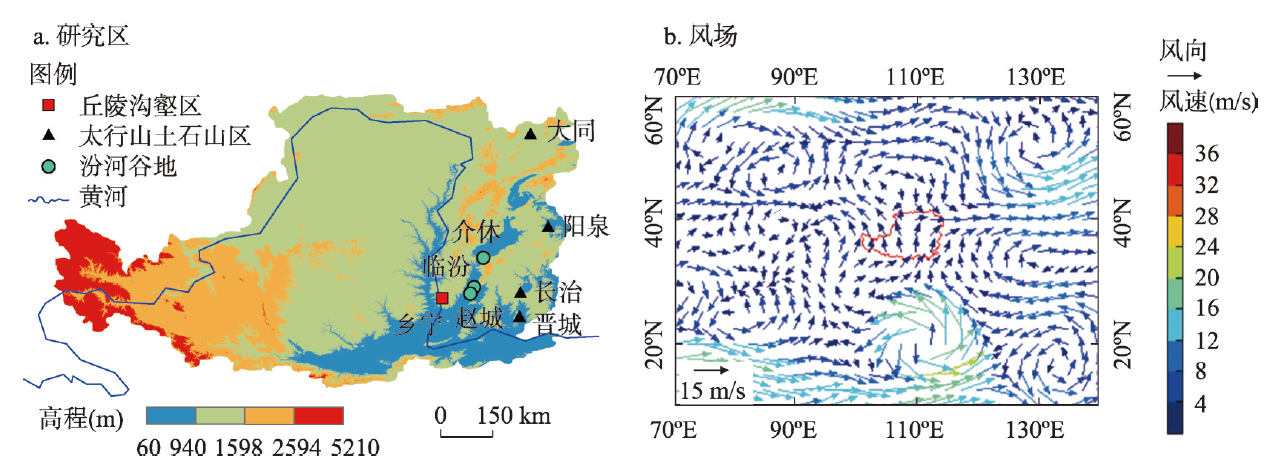
The composition of hydrogen and oxygen stable isotopes of atmospheric precipitation can indicate the climatic and environmental changes of precipitation process. It is of great significance to analyze and understand the changes of stable isotopes of atmospheric precipitation and examine the hydrological cycle process under current and past climatic conditions. Based on the determination of δ2H and δ18O in 152 precipitation samples collected from 8 stations in the eastern Loess Plateau in the summer of 2019 (April-October), the spatial and temporal distribution characteristics of δ2H and δ18O and their relationship with meteorological parameters and sub-cloud evaporation were systematically analyzed. The HYSPLIT model was used to analyze the source and migration path of water vapor. The results show that: (1) δ2H and δ18O of summer precipitation in the study area have obvious seasonal variation, which gradually enriched from May to July and gradually depleted from August to September; the precipitation δ2H and δ18O also showed significant spatial differences, with a gradual increase from southeast to northwest. (2) The results of regional atmospheric precipitation line show that the overall precipitation in this area is significantly affected by the sub-cloud evaporation, but the precipitation process in the basin area (Zhaocheng, Yangquan, and Changzhi) is significantly affected by the local circulation. (3) δ18O in the precipitation of this region did not show significant indigenous temperature effect and precipitation effect. The temperature effect only existed in the Jiexiu station of the Fenhe river basin valley, while the precipitation effect existed at the Jiexiu and Linfen stations. (4) The sub-cloud evaporation has a significant influence on the Yangquan station in the middle of the rocky areas of Taihang Mountains, the Datong station in the north and the Linfen station in the Fenhe river basin valley. The hydrogen and oxygen stable isotopes of the cloud bottom and surface precipitation are significantly different. (5) The results of water vapor source analysis show that the main sources of summer precipitation in the region are near the ground and the Bohai Sea in the southeast direction, and the water vapor content of the western path in the long distance is relatively small. The results of this study are of great significance to improve the understanding of regional water cycle and the rational allocation of water resources.
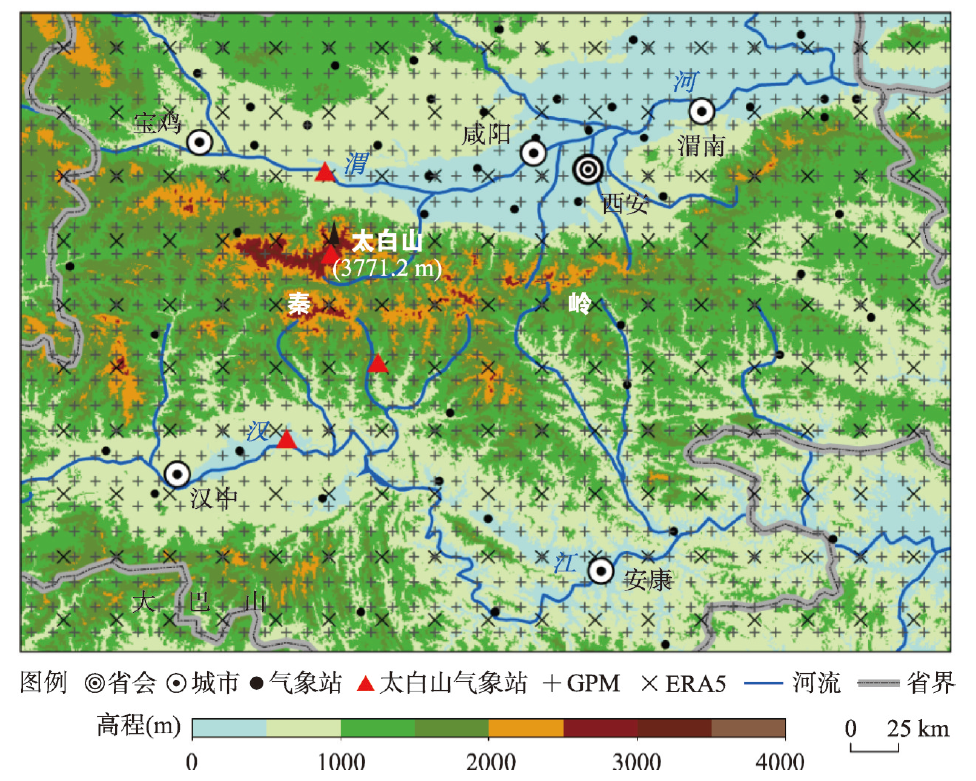
A clear understanding of the precipitation variation patterns at high altitudes of the Qinling Mountains is a prerequisite for an in-depth understanding of the characteristics of this mountain range as China's north-south transitional zone and its important role of water resources in the Middle Route of South-North Water Transfer Project. However, understanding the precipitation changes in the mountainous areas of the Qinling Mountains has been hindered by limited effective precipitation observation data in these mountainous areas. An analysis of precipitation data measured from June 1, 2018, to May 31, 2019, at an altitude of 3760 m at the Mount Taibai of the Qinling Mountains revealed that the annual precipitation at this altitude can reach 1300 mm, which is much more than the 600-800 mm annual precipitation recorded in the Hanjiang Basin and the Guanzhong Plain. On this basis, the persistence of annual and seasonal precipitation patterns in the Qinling Mountains was examined by kriging, inverse distance weighted interpolation, and ANUSPLIN methods, as well as GPM-corrected data (GPM-cal) and ERA5 reanalysis data. Accurate high-altitude precipitation values could not be obtained using kriging and IDW. However, GPM-cal, ANUSPLIN, and ERA5 data could more accurately portray the variation of annual precipitation with topography in the Qinling Mountains. An analysis of water vapor fluxes showed that the Mount Taibai has significant blocking, forcing, and intercepting effects on southward moist airflow below the 600 hPa height owing to its high terrains, making its southern slope a regional center of high precipitation values. Combining high mountain precipitation observations, ANUSPLIN, multi-source grid point information, and data correction methods is an effective way to understand precipitation formation and variation in the Qinling Mountains.
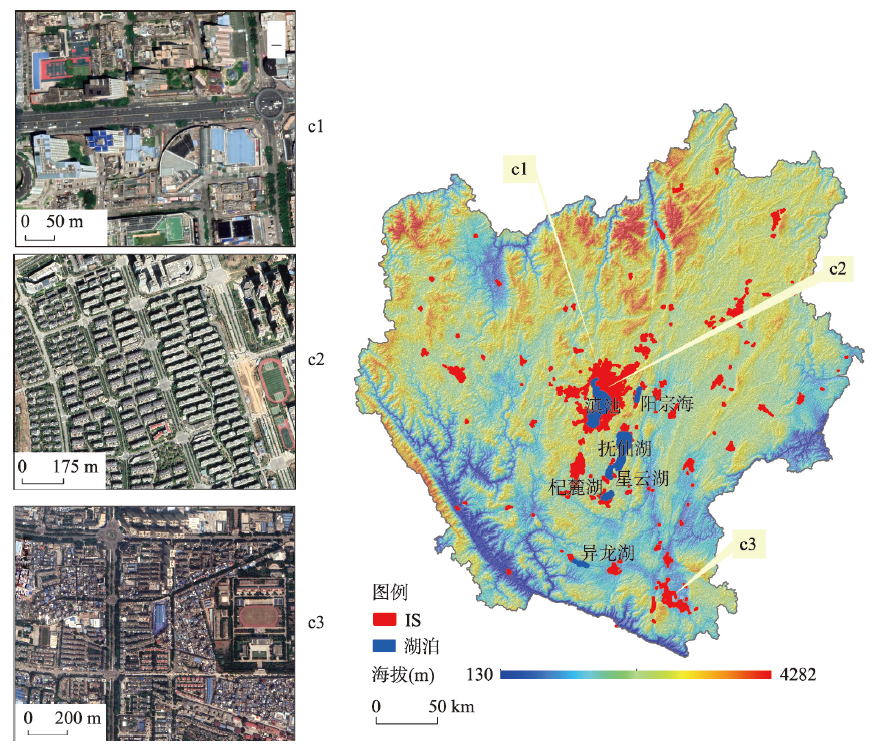
Research on the impact of human activities on global climate change is not only the frontier of the discipline, but also the hotspot and difficulty. At present, the research focuses on the climate phenomena of urban impervious surface (IS), such as heat island and rain island effects, while the research on other climate factors has not yet to be carried out. Based on the Global IS Data Set (GAIA) and the China Region High-resolution Surface Meteorological Element Data Set, though the Mann-Kendall (M-K) mutation test and Bayesian model, this paper studied the spatiotemporal variation of IS, the relationship between meteorological elements and IS, and abnormal climatic phenomena for the 34 lakeside urban agglomerations in the Central Yunnan Plateau controlled by the subtropical high from 1985 to 2018. The results showed that the IS area increased by 227.56% compared with that in 1985, with the highest growth rate (89.85 km2/a) in the past 10 years (2007-2018), mainly expanding in S, NE, SE and W directions. During the past 34 years, the climate of the Central Yunnan urban agglomeration experienced three rapid transformation stages: cold and humid (1985-1995), warm and humid (1996-2006), and warm and dry (2007-2018). Compared with the permeable surface, IS had some significant climatic phenomena, including heat island (air temperature increases by 0.63 ℃, long wave increases by 4.49 W m²), rain island (precipitation increased by 38.27 mm), wet island (specific humidity increases by 0.51 g/kg), wind speed low island (wind speed decreased by 0.025 m/s) and air pressure high island (air pressure increased by 602.64 Pa). The spatial distribution of IS has a significant relationship with meteorological elements in a specific interval, such as long wave of 313~329 W m², specific humidity of 8.9~9.9 g/kg, air pressure of 76235~79946 Pa, short wave of 186~194 W m², precipitation of 840~876 mm and 876~998 mm, wind speed of 2.08~2.38 m/s and air temperature of 13.85~15.85 ℃. In that interval, meteorological elements respond significantly with the increase of the proportion of IS distribution. The impact of IS on air pressure and humidity has the abnormal characteristics of air pressure-temperature and humidity, which may be caused by subtropical high, elevation and large lakes (lake-land breeze).
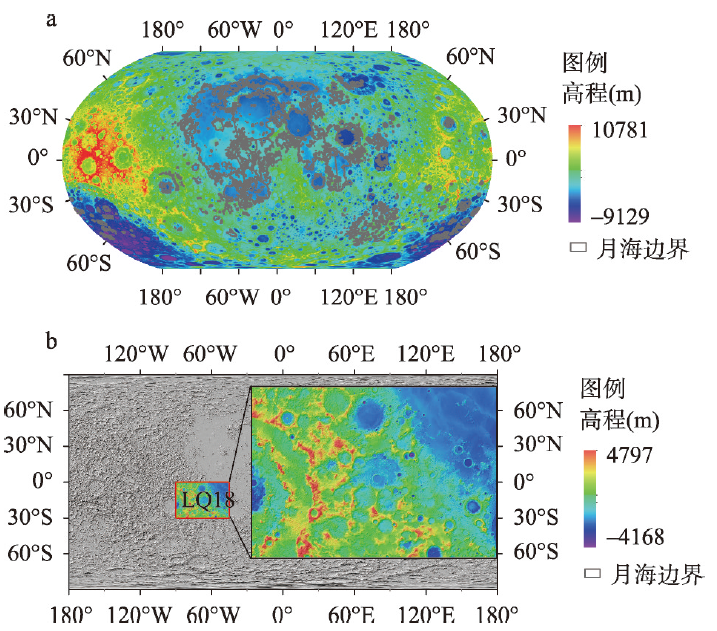
The lunar landform is the result of the geological and geomorphic processes on the lunar surface. It is very important to identify the type of the lunar landforms. Geomorphology is the scientific study of the origin and evolution of topographic landforms on the planetary surface. Elevation and relief amplitude are the most commonly used geomorphic indexes in the study of geomorphological classification. Previous studies have determined the elevation classification criterion of lunar surface. In this paper, we focus on the classification criterion of the topographic relief amplitude of the lunar surface. As for the estimation of the best window to calculate the relief amplitude of the lunar surface, we used the method of change-point in the mean based on LOLA (Lunar Orbiter Laser Altimeter) DEM data and DEM that combines the LOLA and SELENE TC (Terrain Camera) merged Digital Elevation Model (SLDEM2015). According to the statistical analysis of the basic lunar landforms, the classification criterion of lunar surface relief amplitude is determined. Taking the topographic relief amplitudes of 100 m, 200 m, 300 m, 700 m, 1500 m and 2500 m as the thresholds, the lunar surface is divided into seven geomorphic types, including slightly micro-relief plains (< 100 m), slightly micro-relief platforms [100 m, 200 m), micro-relief landforms [200 m, 300 m), small relief landforms [300 m, 700 m), medium relief landforms [700 m, 1500 m), large relief landforms [1500 m, 2500 m) and extremely large relief landforms (≥ 2500 m). The slightly micro-relief plains are mainly distributed in the maria, and the floor of craters and basins that are filled with basalts, while the slightly micro-relief platforms are mainly distributed in the transition regions between the maria and highlands. The micro-relief landforms are mainly located in the regions with higher topography than the mare, such as wrinkle ridges and sinuous rilles in the mare. The small relief landforms are mainly scattered in the central peak and floor-fractured of craters. The medium relief landforms are mainly distributed in the transition regions between the rater floor and carter wall, between the crater wall and crater rim, between the basin floor and basin wall, and between the basin wall and basin rim. Large and extremely larger relief landforms are mainly scattered in the crater wall and basin wall. The determination of classification criteria of lunar surface relief amplitude in this paper can provide important references for the construction of digital geomorphology classification schemes of the lunar surface.
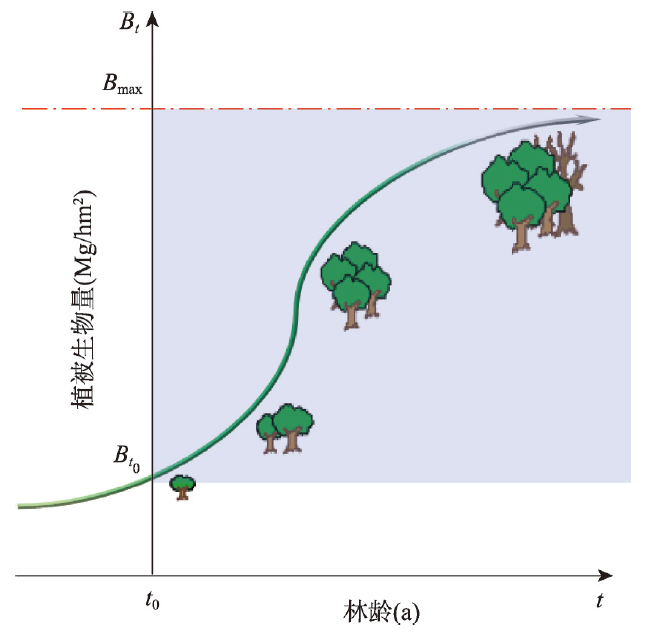
Forest ecosystem, as a predominant component of terrestrial ecosystem carbon sinks, has a high potential for carbon sequestration. Accurate estimation of the carbon sequestration rate in forest ecosystems at provincial level is a prerequisite and foundation for scientifically formulating the technical approaches of carbon neutrality and associated regulatory policies. However, research on future carbon sequestration rates (CSRs) for forest ecosystems for provincial-level regions (hereafter province) in China has rarely been reported. This paper quantitatively assesses the carbon sequestration rates of existing forest ecosystems of all the provinces from 2010 to 2060 using the Forest Carbon Sequestration model (FCS), in combination with large quantities of measured data in China under three future climate scenarios (RCP2.6, RCP4.5, and RCP8.5). Results showed that CSRs across provinces varied from 0.01Tg C/a to 36.74 Tg C/a, with a mean of (10.09±0.43) Tg C/a. There are apparent inter-provincial differences in view of forest CSRs. In terms of the spatial variations in CSRs on unit area basis within provinces, the eastern region has larger capacity to sequestration than the western region, while the western region has greater CSR per unit GDP and per capita. Moreover, there are significant negative correlations between the CSRs per capita in each province and the corresponding GDP per capita, under an assumption that GDP per capita is constant across provinces. In summary, there is a significant regional imbalance of the CSR among provinces, and major technical and policy changes are needed to realize their carbon sink potential sustainably. In view of the overlap between China's poor areas and high ecological carbon sink areas, it is indicated that the existing policies to support the traditional carbon trading are far from sufficient. It is urgent to take China's regulatory measures such as "regional carbon compensation" in line with the Chinese characteristics, so that people in western or underdeveloped regions can voluntarily/consciously strengthen forest protection and enhance forest carbon sinks on the basis of ensuring coordinated regional development, thus China's forests can play a greater role in carbon neutrality strategies.
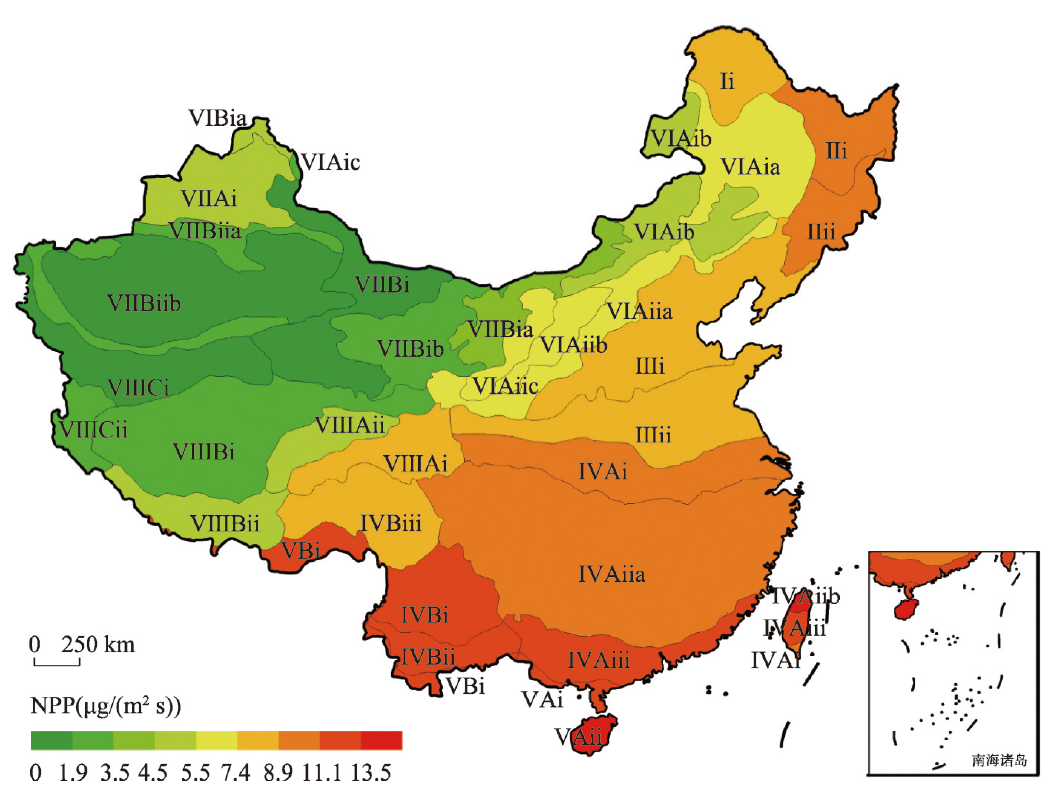
Six vegetation dynamic models, provided by the Inter-Sectoral Impact Model Intercomparison Project (ISI-MIP), are selected and verified for net primary productivity (NPP) in China based on remote sensing retrials. Then the goodness of fit of each model is used as the weight to synthesize a new sequence to estimate the future change pattern of China's NPP under the RCP2.6 and RCP6.0 scenarios. This study aims to solve inaccuracy of the estimation on the change pattern of China's NPP due to differences in data and methods. The results show that the single model has a poor fitting effect on NPP in most regions of China (R2 < 0.4), the average NPP is 33%-97% higher than the remotely sensed value, but it can well reflect the decreasing trend from southeast to northwest China. The overall goodness of fit of the proposed NPP data is 0.85, and the goodness of fit in most vegetation zones is basically greater than 0.3. In the future 30 years, China's average NPP will continue to decrease from southeast to northwest, and the average value will show a fluctuating growth, which is expected to reach 8.8 μg/(m² s) in 2035 and 9.7 μg/(m² s) in 2050. With the elaspe of time, the main growth area under the RCP2.6 scenario will shift from southern to northern China. This is reflected in the fact that NPP in north China will increase significantly at a rate greater than 0.15 μg/(m² s) per year, but the growth rate will slow down and the area of significant growth will decrease in the southwestern and central-south regions. Under the RCP6.0 scenario, the main growth areas will retreat to the northeastern, southeastern and western regions, and the growth in the central and eastern regions will become insignificant. The high emission scenario will promote the growth of NPP before 2035 and inhibit the growth after 2035. The NPP will be extremely distributed under the RCP 6.0 scenario. For instance, the alpine desert grassland, temperate desert, shrub and semi-shrub desert in the northwest of Qinghai-Tibet Plateau will grow slowly or even stop growing.