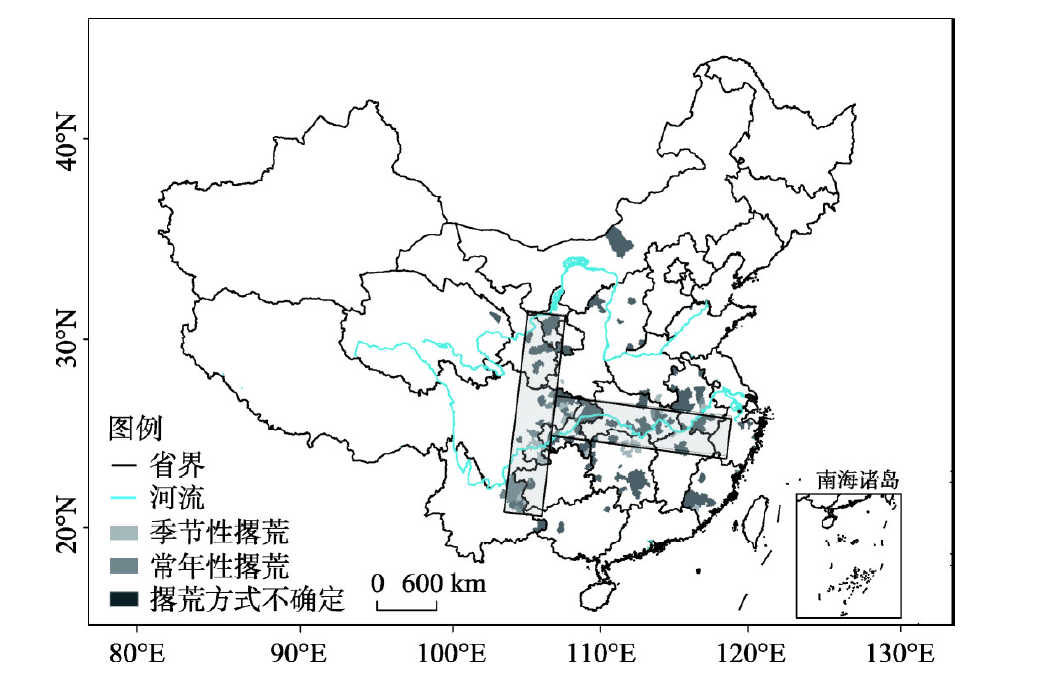
Cropland abandonment has increasingly occurred in China, which potentially affects national food and ecological security. This study collected existing publications focusing on cropland abandonment. Then, we extracted the key characteristics of cropland abandonment events, including time, location, magnitude, and driving force. The meta-analysis was carried out on these items to disclose the spatio-temporal pattern and main drivers of cropland abandonment in China in the last three decades. We found that there were a total of 163 counties in which cropland abandonment occurred according to the existing literature. These counties were mostly located in southern China and, in particular, exhibited a pattern of a T-shape on 90 degree anticlockwise rotation. The vertical axis exhibited a north-south belt across southeastern Gansu Province, eastern Sichuan Province, Chongqing, western Guizhou Province, and northern Yunnan Province. The horizontal axis exhibited a west-east belt along the middle to lower reaches of the Yangtze River across southern Hubei Province, northern Hunan Province,w and central to southern Anhui Province. In the provinces of Hunan, Sichuan, and Anhui, cropland abandonment can be found in 24, 23, and 21 counties, respectively; in Hubei, Chongqing, Fujian, Gansu, and Yunnan provincial-level areas, there are more than 10 counties with cropland abandonment. The formation of the “T” structure underwent two stages. Before 2010, there were 102 counties with cropland abandonment that mainly existed along the middle to lower reaches of the Yangtze River, where the horizontal axis occurred. Since 2010, there have been 63 counties with cropland abandonment, mostly existing in the north-south belt from southeastern Gansu to northern Guizhou, where the vertical axis occurred. The spatio-temporal patterns of cropland abandonment events matched well with the labor emigration from agriculture in the context of regional economic development and industrial restructuring. The low economic efficiency of agriculture and the shortage of agricultural labor are two common drivers leading to cropland abandonment in 86% and 78% of counties, respectively.
The existing research on the mechanism of LUCC cannot fully illustrate dynamics of land use/cover driven by long-distance interaction in the global context. To fill this gap, a theoretical framework of tele-coupling interpretation is intentionally introduced in this paper. Starting with a general overview of previous studies on the mechanism of LUCC in perspectives of human society development, and followed by the empirical evidence for these mechanisms, this paper proposes an initial framework of tele-coupling interpretation. It is concluded that remote connection, globalization, and urbanization are the three major forms of tele-coupling that have driven LUCC. Specifically, in terms of environmental interactions between long-distance natural systems, climate change and large-scale climate events have cross-regional impacts. For example, they can directly affect vegetation dynamics by changing climate factors such as temperature and precipitation, resulting in the climatic tolerance range of vegetation, which in turn could change the distribution pattern of vegetation, leading to the land use/cover change. For socio-economic interactions between distant human systems, the globalization process may drive the land use/cover change through transmission and feedback of various flows of information, technologies, capital and goods at different levels of administrative spaces. Regarding to urbanization, it could alter the land use/coverage in remote areas directly or indirectly through the process of production factor aggregation. Based on these elaborations, this paper further puts forward the key contents and basic steps of the application of tele-coupling framework in LUCC research. Firstly, a "time-space-event" trinity analysis path of land use/cover change is established, which links the spatio-temporal dynamics of land use/cover with the sequence of events that drive the change. This kind of analysis seeks to use specific social, economic, and natural events to explore the driving forces to land use/cover change. The operational analytical method with five steps is thus proposed for this purpose. Secondly, the distance decay curve method and the event sequence classification method inside and outside the area should be applied for decomposing driving forces to the near-remote land use/cover change. Finally, a comprehensive network-based inter-system study or cross-system synthesis is badly needed to better understand land use/cover change at the regional (global) scale. Cross-system synthesis is the key step to realize the transformation from micro case studies to a macroscopic comprehensive integration, and its primary mission is to clarify the mutual feedback of factor flows between multiple systems and their impact on land use/cover change. In conclusion, the new method is expected to achieve a synchronous explanation of land use/cover change driven by multiple long-distance systems, in an aim to have a holistic and better understanding of the human-nature coupling system at the regional (global) scale.
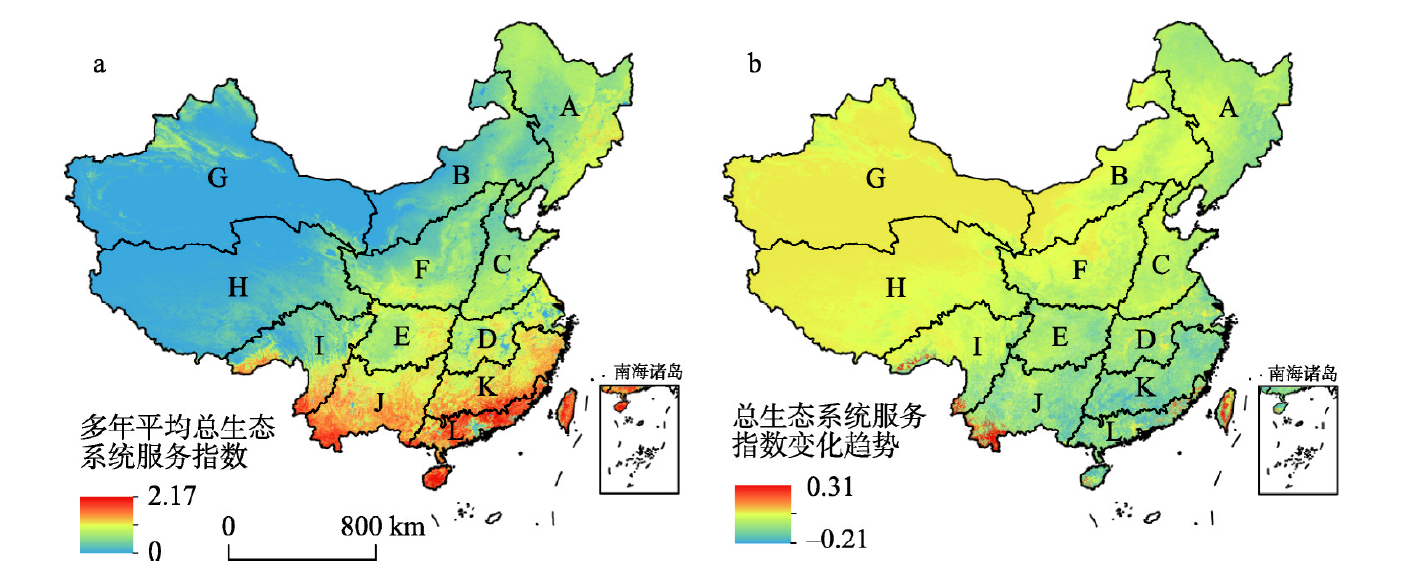
The ecological risk assessment was previously explored according to ecological entity characteristics, such as point source threat and regional landscape pattern change, and ignored the factors related to the human well-being. The academic contribution of the essay is to integrate ecosystem services into assessment system of ecological risk in a new perspective. In this paper, the spatial mapping of ecosystem services on China's land is reconstructed with the aid of GIS and RS. Moreover, the ecological risk analysis model is established in order to quantitatively expound the spatial pattern of the ecological risk based on ecosystem services, and identify ecological risk control priority regions at different confidence levels. The results showed that: (1) From 2000 to 2010, the average annual value of total terrestrial ecosystem services index in China was between 0-2.17, and slightly fluctuated between 0.30-0.57 over the years. Some 24.7% of the regions with significantly increasing value included Taiwan, Yunnan-Guizhou Plateau, inland Xinjiang of northwest China, 37.1% of the regions with significantly decreasing value, including northeast China, Qinghai-Tibet Plateau, central and eastern regions of China; (2) The risk losses of ecosystem services were exposed to different situations under different confidence levels. When the confidence level was 90%, the potential loss ratio of the total ecosystem services index was 24.19%, and the ecological risk index was 0.253. Furthermore, by analyzing the relationship between confidence level and ecological risk index, when the confidence level was high, the probability of risk was reduced correspondingly, but the losses correspondingly increased when risk occurred; (3) We investigated the scenario as an example under the 90% confidence level. The different eco-regions with the risk characteristics are as follows: the top six eco-regions with average ecosystem services risk index are Inner Mongolia Plateau, North China Plain, Loess Plateau, Northeast China Plain, Hengduan Mountain Region, and Qinghai-Tibet Plateau. The proportions of the eco-regions with extreme risk are 55.89%, 26.63%, 24.35%, 20.62%, 18.70% and 25.12%, respectively.
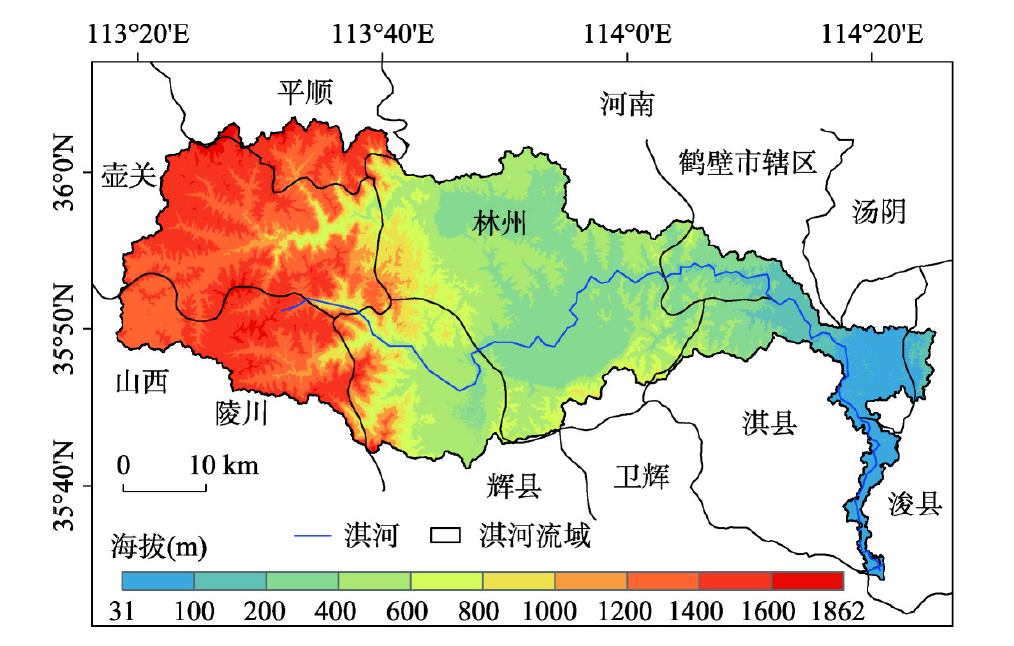
The change of regional land use is the main cause for the change of carbon storage in territorial ecosystem, which affects the process of carbon emission and sink. However, previous studies on the impact of future land use change on ecosystem carbon storage considering temporal and spatial scales in the basin are still absent. This study analyzed land use change from 2005 to 2015 in the Qihe River Basin, Taihang mountainous areas, and used Markov-CLUE-S composite models to predict land use pattern of this region in 2025, under three scenarios of natural growth, farmland protection and ecological conservation. Based on the data of land use, we used carbon storage module in InVEST model to evaluate carbon storage of territorial ecosystem during the past 10 years and the future. The results showed that: (1) The carbon storage and carbon density of the ecosystem in the Qihe River Basin in 2015 were 3.16×10⁷ t and 141.9 t/hm2, respectively, and they both had decreased by 0.07×10⁷ t and 2.89 t/hm2 during the 10 years. (2) From 2005 to 2015, the carbon density was mainly reduced in low altitude areas, and the ratio of the increased areas was similar to that of the reduced areas in the high altitude areas. The decrease of carbon density was mainly caused by expansion of construction land in the middle and lower reaches, and degradation of forestland in the upper reach of Qihe River Basin. (3) From 2015 to 2025, the carbon storage and carbon density of ecosystem will decrease by 0.03×10⁷ t and 1.38 t/hm2 respectively in the natural growth scenario, mainly due to the reduction of carbon sequestration capacity in low altitude areas. The farmland conservation scenario will slow down the decrease of carbon storage and carbon density (0.01×10⁷ t and 0.44 t/hm2), mainly due to the enhancement of carbon sequestration capacity in low altitude areas. The ecological protection scenario will increase carbon storage and carbon density significantly to 3.19×10⁷ t and 143.26 t/hm2 respectively, mainly appearing in the area above 1100 m. The ecological protection scenario can enhance carbon sequestration capacity, but it cannot effectively control the loss of farmland area. Therefore, the land use planning of the study area can comprehensively consider the ecological protection scenario and farmland conservation scenario, which not only increases carbon sink, but also ensures the farmland quality and food security.
It is of great significance to analyze the main environmental issues, coupled with their spatial heterogeneity, and divide the ecological function zones to achieve ecological security and optimization of territory development in a certain region. In recent years, ecological function zoning, widely concerned by scholars, has played a vital role in regional ecosystem management and sustainable development. There arose a problem that the spatial characteristics of ecological functions were hard to be reflected in the previous studies based on spatial average data over basins or geopolitical regions such as counties, cities and provinces. This paper, using the approaches of coupling self-organizing feature map (SOFM) and support vector machine (SVM), attempts to develop an automatic demarcation and zoning approach, and explores the best possible division of ecological functions in the city of Ordos with the index system of ecological function zoning in mind involving the ecosystem services as well as ecological sensitivity. Ordos, which is located in the transitional zone between temperate grasslands and desserts, has become a key research area of global terrestrial ecosystem. The ecological functional zoning indexes indicate that there appears an obvious spatial heterogeneity of ecosystem functions in Ordos. Accordingly, land grids have been clustered into 7 ecological function types by SOFM with clustering quality index (CQI) in view. Hence, Ordos has been divided into 11 ecological function zones owing to the implementation of SVM to identify the optimal division borders, in which the border demarcation is treated as a classification system in spatial domain. The optimal combination of SVM hyperparameters is determined by grid search method. In this study, machine learning algorithm has been adopted to cope with the situation where the bottom-up physical regionalization might weaken the spatial position attribute of the partition features, and to realize the quantitative conversion from classification to partition. It has turned out that such SOFM-SVM-coupled zoning approach could effectively improve the spatial accuracy of the partition, which can be considered as a new way to realize the automatic ecological zoning.
Urban heat islands resulting from land use and land cover change have become a major barrier to urbanization and sustainable development of ecological urban environments. Although many studies have focused on the interannual and seasonal characteristics of urban heat islands, there has been no comparative analysis of the urban surface thermal landscape at multiple spatio-temporal scales. This study described the spatio-temporal patterns of the urban surface thermal landscape in different seasons and by time of day (daytime/nighttime) in terms of quantity, shape, and structure using MODIS LST products, and revealed the evolution of the urban surface thermal landscape using mapping techniques and analysis of barycenter trajectories in metropolitan Beijing between 2003 and 2017. The conclusions were as follows: (1) The characteristics of the urban surface thermal landscape vary significantly in different seasons and by time of day. (2) The medium-temperature zone constitutes the largest proportion of the area of metropolitan Beijing, which is the most unstable area during the daytime and the instability of the sub-high-temperature and sub-low-temperature zones increased at night. (3) The stable zone is most important in terms of the change in the land surface thermal landscape, followed by the repeated-changes zone and the zone where the change occurred in the first 5 years. The changes of different temperature zones usually increased or decreased progressively. There was a cooling trend in the mountains. In the north mountain-transition zone, the process of transferring between sub-low temperature and medium temperature was repeated. There was a warming trend in the south. (4) The area of the high-temperature zone increased from 2003 to 2017 and its barycenter was concentrated in the city center; the barycenter of the low-temperature zone moved to the urban fringe. The ecological conservation development zone made the greatest contribution to the surface thermal landscape in metropolitan Beijing. The spatio-temporal distribution and evolution of the urban surface thermal landscape support management decisions aimed at alleviating the effect of the urban heat island.
Quantitative analysis of the influencing factors of vegetation phenology is not only helpful to accurate assessment of impacts of climate change on vegetation but also has great importance in the improvement of regional climate models, as well as accurate estimation of vegetation net primary productivity and carbon balance. Vegetation phenology monitoring based on remote sensing data has made great progress, however, few studies have focused on analyses of the influencing factors of vegetation phenology based on large-scale and time series remote sensing data. The use of the linear regression model in some existing studies has certain limitations due to the nonlinearity of vegetation phenology. In this paper, we propose a Monte Carlo based survival analysis method, which was applied to the forest regions of Northeast China. Start of season (SOS), end of season (EOS) and growing season length (GSL) were firstly extracted from time series AVHRR GIMMS NDVI data of the study area in the period of 1982-2009, using the double logistic curve fitting method. And then the survival analysis model of vegetation phenological influencing factors based on Monte Carlo estimation was constructed. Finally, the proposed method was applied to the forest regions in Northeast China to investigate possible influencing factors of vegetation phenology in the rejuvenation period and deciduous period. Results show that temperature, precipitation, and wind can influence phenology of the forest in the region, with temperature being the primary influencing factor for both start and end of seasons. Long-term changes of average temperature have more significant impacts on the forest phenology, compared with short-term temperature variations. The increase of wind speed before the EOS may lead to an early EOS. In addition to environmental factors, EOS tends to be later if SOS is early. The results also prove that the proposed survival analysis method can provide a good scheme to quantitatively analyze the influencing factors of the phenological periods.
Based on MODIS-NDVI and climate data, using an artificial influence model based on coefficient of variation to quantitatively calculate the human impact of vegetation cover(NDVIH) in China from 2001 to 2015, Sen+Mann-Kendall model and Hurst index were used to analyze the spatial-temporal feature and the future trends. It was found that: (1) In the year from 2001 to 2015, the Spatial Differentiation of NDVIH in China was more obvious from southern part to northern part, with an average annual mean value of -0.0102, the vegetation coverage decreased slightly under human activities, the negative impact area accounting for 51.59% which is slightly larger than the positive impact area. (2) The interannual variation of NDVIH in China is obvious, showing the negative impact volatility decreased, the rate of decline is 0.5%/10a; among which the positive and negative effects all showed an increasing trend, the positive growth rate (0.3%/10a) is much larger than the negative impact (0.02%/10a). (3) During 2001-2015, the center of gravity of positive impact has moved to the northeast, the center of gravity of negative impact has moved to the southwest, vegetation cover in northeastern China has improved under the influence of mankind, and human activities in the southwest have increased the degree of vegetation destruction. (4) The proportion of "negative impact reduction" and "positive impact increase" trend of NDVIH in China appeared to be the largest which accounting for 28.14% and 25.21% of the total, and the ecological environment is improving. (5) The reverse characteristics of NDVIH change were stronger than the same characteristic in China, mainly showed a negative impact which decreased at the first and then increased with the rate of 15.59% of the total area.
Soil moisture is the link between the land surface and the atmosphere, which plays an important role in the hydrological cycle. As the "Third Pole" and "Asian Water Tower", the Tibetan Plateau has an important influence on the climate of the surrounding areas such as the formation and maintenance of the Asian monsoon and it also profoundly affects the availability of Asian water resources. Based on the measured soil moisture data from 100 stations distributed in the three climate zones on the Tibetan Plateau, this paper assesses the ECV, ERA, MERRA and Noah datasets, selects the best evaluated dataset for surface soil moisture, and analyzes the influence of various meteorological factors on spatial and temporal patterns of soil moisture changes. Finally, the paper evaluates the changes of surface soil moisture during the next about 100 years and explores possible climate causes. The results show that: (1) The Noah dataset has the best assessment of surface soil moisture in the Qinghai-Tibet Plateau during the historical period. Among all the regions, Naqu obtains the best assessment of surface soil moisture in each dataset. (2) Among various meteorological factors, precipitation is the most important factor affecting the temporal and spatial patterns of soil moisture in most areas, but the temperature and solar radiation have a relatively high impact in the Himalayas, especially on the north slope of the mountains. (3) The surface soil moisture had a significant downward trend from 1948 to 1970. However, it did not fluctuate obviously from 1970 to 1990. From 1990 to 2005, there existed a certain upward trend. Conversely, it has a rapid downward trend since 2005. (4) There is a downward trend for surface soil moisture in different future scenarios. Compared with the RCP2.6 and RCP4.5 scenarios, the soil moisture declines obviously with a more significant downward trend after 2080 under the RCP8.5 scenerio. (5) In the future, both precipitation and temperature show an upward trend. There was a downward trend for the drought index in the RCP8.5 scenario, whereas, there is no significant change under the RCP2.6 and RCP4.5 scenarios. The drought index can explain the change of surface soil moisture in the future to a certain extent.
Climate change is a major driver of vegetation activity, and thus its complex processes become a frontier and difficulty in global change research. To understand the complex relationship between climate change and vegetation activity, the spatial distribution and dynamic characteristics of the response of NDVI to climate change from 1982 to 2013 in China were investigated by the geographically weighted regression (GWR) model. The GWR was run based on the combined datasets of satellite vegetation index (GIMMS NDVI) and climate observation (temperature and moisture) from meteorological stations nationwide. The results noted that the spatial non-stationary relationship between NDVI and surface temperature has appeared in China. The significant negative temperature-vegetation relationship was distributed in northeast, northwest and southeast parts of the country, while the positive correlation was more concentrated from southwest to northeast. And then, by comparing the normalized regression coefficients for different climate factors, regions with moisture dominants for NDVI were observed in North China and the Tibetan Plateau, and regions with temperature dominants for NDVI were distributed in the East, Central and Southwest China, where the annual mean maximum temperature accounts for the largest areas. In addition, regression coefficients between NDVI dynamics and climate variability indicated that the higher warming rate could result in the weakened vegetation activity through some mechanisms such as enhanced drought, while the moisture variability could mediate the hydrothermal conditions for the variation of vegetation activity. When the increasing rate of photosynthesis exceeded that of respiration, there was a positive correlation between vegetation dynamics and climate variability. However, the continuous and dynamic responding process of vegetation activity to climate change will be determined by spatially heterogeneous conditions in climate change and vegetation cover. Furthermore, the description of climate-induced vegetation activity from its rise to decline in different regions is expected to provide a scientific basis for initiating ecosystem-based adaptation strategies in response to global climate change.
The glacial lake inventory of China based on the unified and standardized specifications with 3S (RS, GIS and GPS) technology has been finished for the first time. The overall distribution of glacial lakes of China in 2015 has been mapped on the basis of 159 landsat 8 OLI remote sensing images, the second Chinese glacier inventory data and Google Earth image data by manual visual interpretation method. The results show that there are 17300 glacial lakes in China at present with a total area of 1132.83±147.449 km2, and the glacier-fed lake accounted for about 74.6% of the total area of glacial lakes and 66.5% of the total number in China. Meanwhile, the spatial distribution of glacial lake appears significantly heterogeneous. There are a huge number of glacial lakes in the outflow basin, and the Ganges-Brahmaputra is the most densely distributed basin of glacial lakes in China, where survive 7898 glacial lakes with an area of about 622.42±75.55 km2, accounting for the total number of 45.7% and 54.9% of the country, respectively. Additionally, the glacial lakes in China cover an altitude of 2167-6247 m. The glacial lakes area distribution at different altitudes in each mountain range roughly presents in normal shape and the peak value appears in the altitude bands of about 5000-5500 m, accounting for 36.7% (975.06±128.83 km2) of the total area. As far as the glacial lake distribution in different mountain ranges was concerned, the glacial lakes in the Nyainqentanglha Mountains and the Himalayas are the most concentrated ones among 13 mountains of western China, accounting for about 28.3% and 26.4% of the total area in China, respectively.
Based on the monthly runoff data of five stations in three outlets of Jingjiang river from 1956 to 2016, hydrologic drought characteristic variables were identified by run length theory. The probability distribution functions of drought duration, drought intensity and peak value were selected by Kolmogorow-Smirnov's goodness test. A Copulas function was constructed to deeply study the river hydrologic drought characteristics after the river connectivity variation in this region. The results showed that: (1) The year 1989 was the break point of the river system connectivity in three outlets of Jingjiang river (1956-2016). (2) The hydrologic drought characteristics changed significantly before and after river system connectivity break point. The frequency, duration, intensity and peak value of hydrologic drought increased. (3) The two-dimensional joint recurrence periods under the same single variable recurrence period in the pre-variation era in each site were much longer than those in the post-variation era but the two-dimensional co-occurrences return periods of pre-variation were shorter than those of post-variation. (4) The hydrologic drought duration, drought intensity and peak value in river system of the three outlets in Jingjiang river showed an increasing trend after river system connectivity variation. Under the same single variable recurrence period, the drought duration was longer, the drought intensity was greater and the peak value was higher. (5) The magnitude of hydrologic drought characteristics was different before and after variation of river system connectivity, and the variation ranges of hydrologic drought characteristics were different in different river systems.
Response of evolution of the salt marsh to the sediment discharge from Yangtze River was studied, based on the analyses of grain sizes, contents of particulate organic carbon (POC) and total nitrogen (TN), stable carbon isotope (δ13C) and C/N ratios for six cores in the eastern part of Chongming Island salt marsh after mid-1950s, as well as the change characteristics of the sediment discharge from Yangtze River. Results indicated that the change of the grain size for the eastern part of Chongming Island salt marsh after mid-1950s was controlled by the sediment discharge from the Yangtze River. Correlations between contents of organic matter (POC and TN) and contents of grains in different size fractions, and between δ13C and C/N ratios are different for six cores. In the 1960s, the sediment discharge from the Yangtze River was the most, and the sediments in different reaches of the river mixed with each other. This led to both poor correlations between the contents of organic matter (POC and TN) and contents of grains in different size fractions, and between δ13C and C/N ratios, respectively. There has been a decline of the correlations between δ13C and C/N ratios for the heavy reclamation since the 1990s. This indicated that evolution of the salt marsh in the eastern part of Chongming Island was controlled by the sediment discharge from the Yangtze River from the 1950s to the 1980s. Since the 1990s, evolution of the salt marsh in the eastern part of Chongming Island has been not only controlled by the sediment discharge from the river, but also influenced by human activities such as reclamation.
This paper reveals the principle of geographic big data mining and its significance to geographic research. In this paper, big geodata are first categorized into two domains: earth observation big data and human behavior big data. Then, another five attributes except for "5V", including granularity, scope, density, skewness and precision, are summarized regarding big geodata. Based on this, the essence and effect of big geodata mining are uncovered by the following four aspects. First, as the burst of human behavior big data, flow space, where the OD flow is the basic unit instead of the point in traditional space, will become a new presentation form for big geodata. Second, the target of big geodata mining is defined as revealing the spatial pattern and the spatial relationship. Third, spatio-temporal distributions of big geodata can be seen as the overlay of multiple geographic patterns and the patterns may be changed with scale. Fourth, big geodata mining can be viewed as a tool for discovering geographic patterns while the revealed patterns are finally attributed to the outcome of human-land relationship. Big geodata mining methods are categorized into two types in light of mining target, i.e. classification mining and relationship mining. The future research will be facing the following challenges, namely, the aggregation and connection of big geodata, the effective evaluation of mining result and mining "true and useful" knowledge.
Maps are a necessity in people's lives. Map cognition research, a science of investigating perception, learning, memory, reasoning and decision making of maps, has long been an important issue in the foundation of cartography. As a core part of map cognition research, studies on visual cognition of maps have made a series of achievements promoted by advancements of related fields (e.g., psychology, cognitive science and computer vision) and new techniques (e.g., eye tracking, EEG and functional magnetic resonance imaging). Particularly, eye tracking approach has gained much attention, which has been used as a crucial method to investigate map cognition. This paper reviews the new progress of eye tracking based visual cognition of maps which have been made since 2008. We summarized these progresses in six aspects: (1) stimulus: from static maps to dynamic and interactive maps; (2) research extent: from map cognition to map-based spatial cognition; (3) experiment environment: from lab environment to real environment; (4) map dimension: from 2D to 3D; (5) individual differences: from single dimension to multiple dimensions; (6) research purpose: from theory exploration to application. We also summarized future research challenges, difficulties and possible solutions. We hope this review can serve as an initial effort to open more endeavor for future eye tracking investigations into map cognition.