

1 引言
目前,地形对植被影响的研究方法主要包括统计分析[11-12]、离散小波变换(Discrete Wavelet Transform, DWT)[13]、地理加权回归(Geographically Weighted Regression, GWR)模型[13-14]等,但上述方法难以量化地形与植被之间的因果关系。结构方程模型(Structural Equation Model, SEM)是基于先验知识,探究多个变量之间因果关系的方法[15],被广泛用于生态学领域[16],如探测海拔、温度、降水和植被对物种多样性的直接和间接影响[17],以及气候、地形和人类活动相互作用对生物多样性的影响[18]等。此外,结构方程模型还可以探究当前获得的因果关系是否由单一因素或多因素导致。
归一化差值植被指数(Normalized Difference Vegetation Index, NDVI)是公认表征植被变化的有效参数之一,对植被生长的变化高度敏感,能较好监测植被变化[19⇓-21]。三江源地区位于青藏高原,是中国重要的生态屏障,主要以山地为主,地形差异明显,主要植被类型为草地,生态系统十分脆弱。因此,本文以三江源地区为研究区,基于2001—2018年NDVI数据,结合数字高程模型(DEM)数据,采用结构方程模型,研究地形因子(坡度、坡向和海拔)在植被对气候变化响应中的调控作用,以期探明地形因子对三江源地区植被的间接影响是否重要,以及随着地形因子的变化,其如何调控植被对气候变化的响应。
2 数据与方法
2.1 研究区概况
图1
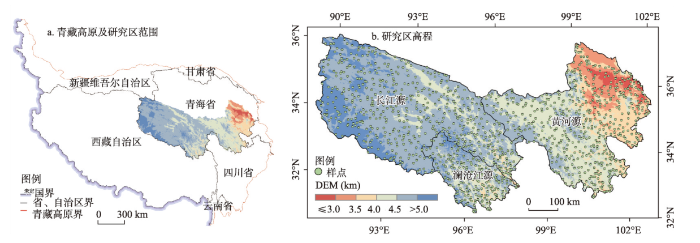
图1
三江源地区位置和采样点的空间分布
Fig. 1
Location of the Three-River Headwaters Region and spatial distribution of sampling sites
2.2 数据
2.2.1 NDVI数据
2.2.2 气象数据
2001—2018年气温和降水数据来源于国家生态科学数据中心(
2.2.3 其他数据
三江源地区矢量边界来源于国家青藏高原科学数据中心(
2.3 方法
2.3.1 结构方程模型
结构方程模型可以同时分析复杂系统中多变量之间的因果关系,探究变量之间的直接和间接关系,还可以对潜变量(人为创造的无法直接测量的变量)开展分析。结构方程模型可以消除其他变量的影响来量化一个变量的影响,还可以结合混合效应模型、Meta分析等增加结果的系统性和可靠性。分段结构方程模型是结构方程模型的一种特殊形式,一般多用于生态领域,它保留了传统结构方程模型的优势,减少了对数据的要求,可以分析多种分布的数据[27],还能局部指定各种模型,且局部错误的路径和参数估计不会影响模型其他部分。其运行过程如下:首先根据理论和先验知识制定一个概念模型[28](基于目前对地形、气候以及植被之间关系的理解设定变量之间的因果或相关关系),然后通过数据对概念模型进行整体拟合,如果拟合结果不达标,则根据有向分离(d-separation)将显著的缺失路径加入模型,重复这个过程直到获得最终模型[27,29]。
结构方程模型的结果通常用图形框架表示,变量之间的因果关系用单向箭头表示,箭头的起始点表示自变量,箭头指向响应变量[30],双向箭头代表相关关系。箭头旁边的数字是标准化路径系数,它表示两个变量之间直接关系的强度,系数的范围在-1到1之间,越靠近1或-1代表变量之间的关系越强,系数为0代表没有关系。一个变量对另一个变量的整体效应等于直接效应和间接效应之和,直接效应是该变量直接指向目标变量的路径系数,间接效应是从该变量指向目标变量的路径系数的乘积。
2.3.2 趋势分析
采用一元线性回归拟合各栅格点的NDVI变化趋势,分析2001—2018年三江源地区植被变化情况,计算公式如下:
式中:θslope为斜率,θslope > 0则NDVI呈增加趋势,反之则呈减少趋势;n为时间长度,本文取值为18;i = 1, 2, …, 18分别对应2001年、2002年、……、2018年。
利用F值检验NDVI变化趋势的显著性,公式如下:
式中:
2.3.3 相关分析
采用Pearson相关系数来表示NDVI与气温、降水之间的相关程度,相关系数计算公式为:
式中:
3 结果
3.1 NDVI空间分布与地形的关系
图2
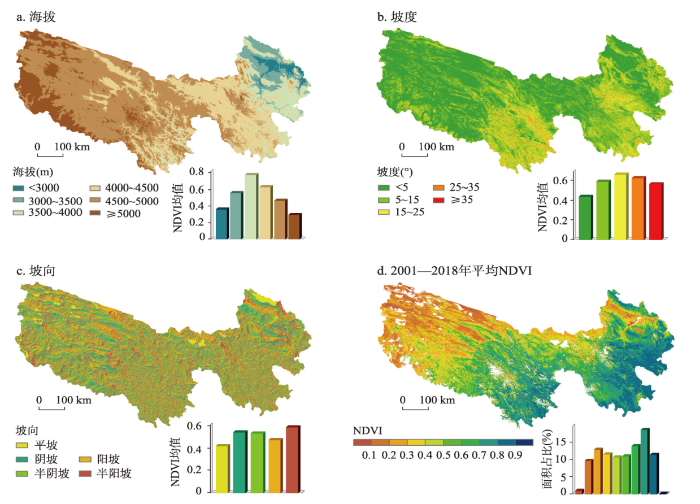
图2
三江源地区的地形要素以及NDVI空间分布
Fig. 2
Topographic elements and spatial distribution of NDVI in the Three-River Headwaters Region
3.2 NDVI与气候因子的年际变化
图3
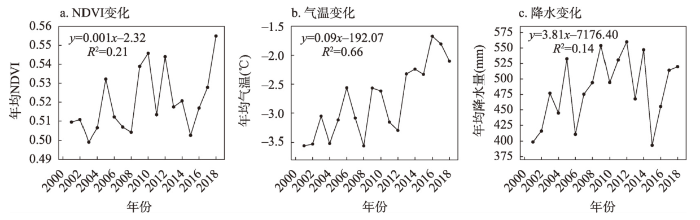
图3
2001—2018年三江源地区NDVI、气温与降水年际变化
Fig. 3
Interannual variations of NDVI, temperature and precipitation in the Three-River Headwaters Region from 2001 to 2018
3.3 NDVI变化趋势与地形的关系
2001—2018年三江源地区70.1%区域的NDVI呈增长趋势,包括16%的显著增长区域,主要位于长江源西北部、黄河源西北部和东北部。29.9%的区域NDVI呈减小趋势,主要位于长江源东部和西南部、黄河源东南部以及澜沧江源大部分地区,其中2.3%的区域降低趋势显著,主要位于长江源东北部、黄河源东南部(图4)。
图4
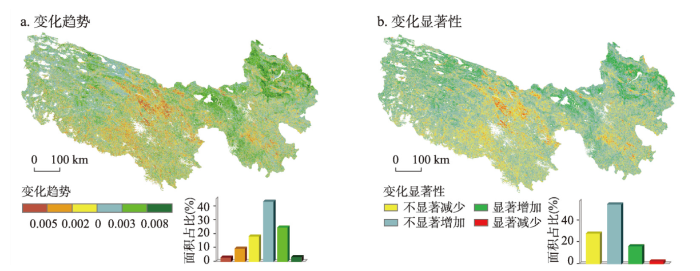
图4
2001—2018年三江源地区NDVI变化趋势和显著性
Fig. 4
The change trend and significance of NDVI in the Three-River Headwaters Region from 2001 to 2018
3.4 气候变化对植被的直接影响以及地形效应
图5表明,三江源地区NDVI与气温正相关面积占65.78%,相关系数均值为0.10,与降水正相关面积占80.41%,相关系数均值为0.23,整体上三江源地区NDVI与气温和降水都呈正相关,与降水的相关性更强。NDVI与气温、降水的相关系数空间分布差异明显,与气温正相关主要分布在长江源西北部、黄河源西部以及东北部地区,负相关主要分布在长江源南部、东部地区以及黄河源中部地区;NDVI与降水正相关分布在长江源大部分地区以及黄河源北部地区,负相关在澜沧江源以及黄河源东南部地区零星分布。
图5
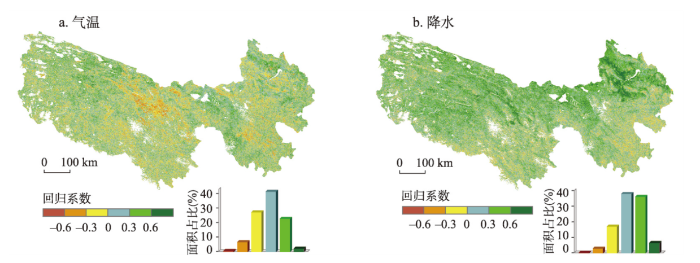
图5
2001—2018年三江源地区NDVI与气温、降水的相关性
Fig. 5
Correlation of NDVI with temperature and precipitation in the Three-River Headwaters Region from 2001-2018
图6a表明,降水对植被影响的总效应为0.55,气温对植被影响的总效应为0.35,两者对植被的总影响为0.9。本文将地形对植被的间接影响称为地形效应,各地形因子效应差异较大,坡度、坡向和海拔分别为0.31、0.03和-0.35,总地形效应为-0.01,约等于0,3类地形因子的效应互相抵消。气候作用和地形效应之和为0.89。坡度、坡向和海拔效应分别占总效应的34.83%、3.37%和39.33%。其中,坡度和坡向主要通过降水加剧了植被对气候变化的响应,而海拔主要通过气温来减缓植被对气候变化的响应。
图6
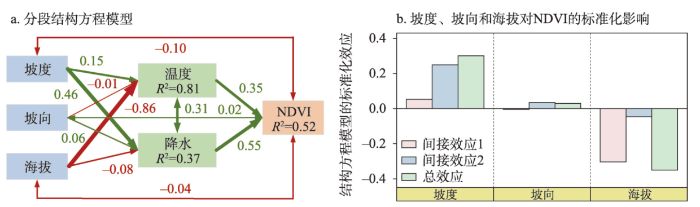
图6
坡度、坡向和海拔对NDVI影响的结构方程模型
注: 图a方框表示变量,箭头表示变量之间的关系,单箭头代表因果关系,双向箭头代表相关关系;绿线代表正效应,红线代表负效应,线的粗细代表标准化路径系数大小,深色代表显著性(p<0.05),浅色代表不显著,有效路径的粗细已根据标准化回归系数的大小进行缩放;图b中间接效应1和间接效应2分别指地形通过调控气温、降水对NDVI的影响。
Fig. 6
Structural equation modeling of the effects of slope, aspect, and elevation on NDVI
图7
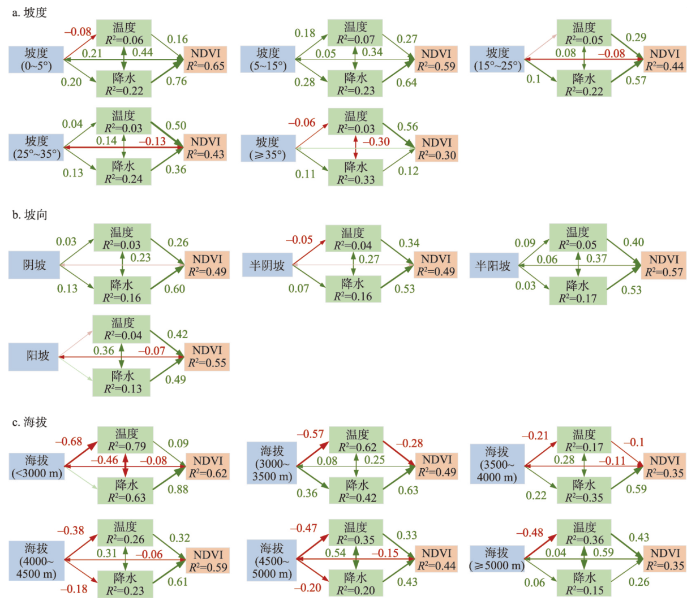
图7
地形和气候对NDVI影响的结构方程模型
Fig. 7
Structural equation model of topography and climate effects on NDVI
图8
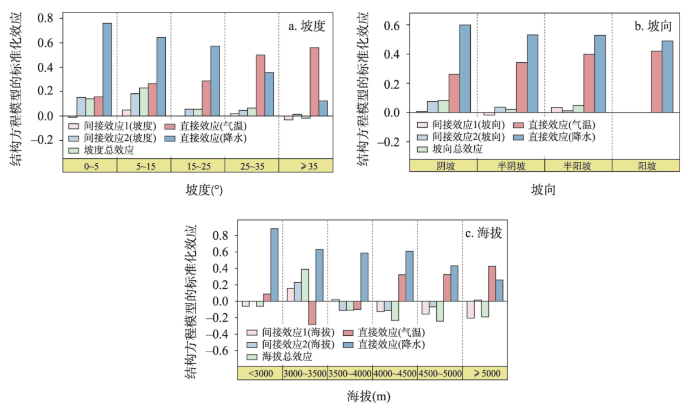
图8
地形和气候因子对NDVI的标准化影响
注:间接效应1和间接效应2分别是地形因子通过调控气温、降水对NDVI的影响,总效应是间接效应1与间接效应2之和,直接效应分别是气温、降水对NDVI的直接影响。
Fig. 8
Standardized effects of topography and climatic factors on NDVI
图8表明坡度、坡向和海拔分别在5°~15°、阴坡和3000~3500 m的调控作用最大。由于3000~3500 m海拔带面积较小,在三江源地区不具代表性,而海拔4500~5000 m调控作用仅次于3000~3500 m且面积较大(图2a)。为了研究结果更具代表性,本文选择坡度为5°~15°、阴坡、海拔为4500~5000 m的样点分析地形的调控作用随地形变化的规律。分析坡度的调控变化规律时,样点的海拔为4500~5000 m,坡向为阴坡;分析坡向的调控变化规律时,样点的海拔为4500~5000 m,坡度为5°~15°区间;分析海拔的调控变化规律时,样点的坡向为阴坡、坡度为5°~15°,所有样点均从图1采样点中选择。
3.4.1 坡度的调控作用
由图9可知,随着坡度增加,气温对植被的影响增加,降水对植被的影响减少。坡度主要通过降水对植被产生正向影响,其影响随着坡度增加先增加后减少。5°~15°的调控作用最大。仅≥ 35°的坡度通过气温对植被的影响才达到显著水平。
图9
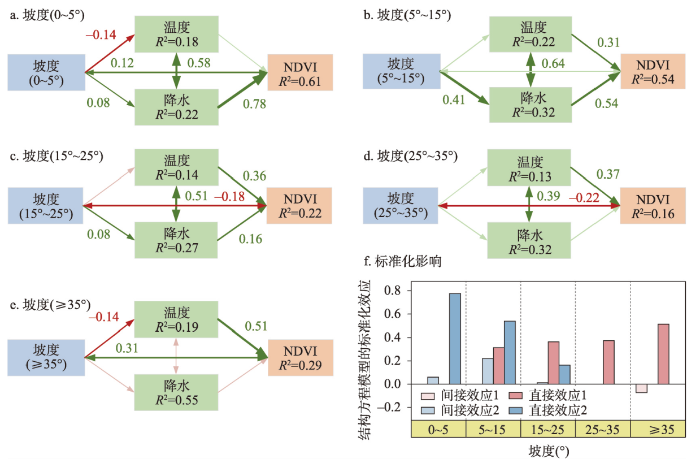
图9
坡度和气候因子对NDVI影响的结构方程模型
注:间接效应1和间接效应2分别是坡度通过调控气温、降水对NDVI的影响,直接效应1和直接效应2分别是指气温、降水对NDVI的直接影响。
Fig. 9
Structural equation modeling of the effects of slope and climate factors on NDVI
3.4.2 坡向的调控作用
由图10可知,在不同的坡向,气温和降水对植被影响的差异很大。在半阴坡,气温对植被的影响远远大于降水的影响,在其他坡向则是降水的影响最大。此外,坡向主要通过降水加剧植被对气候的响应,阳坡和半阳坡的调控作用大于阴坡和半阴坡。在半阴坡,坡向通过降水的调控作用最小;在半阳坡,坡向分别通过气温、降水的调控作用最大。
图10
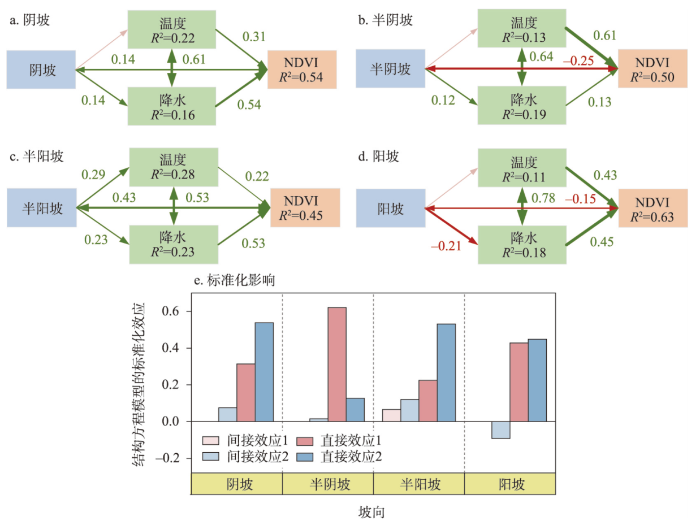
图10
坡向和气候因子对NDVI影响的结构方程模型
注:间接效应1和间接效应2分别是坡向通过调控气温、降水对NDVI的影响,直接效应1和直接效应2分别是指气温、降水对NDVI的影响。
Fig. 10
Structural equation modeling of the effects of aspect and climate factors on NDVI
3.4.3 海拔的调控作用
海拔主要通过气温间接影响植被(图11)。随着海拔的升高,气温对植被的影响由负效应向正效应转变,降水对植被的影响波动减小,海拔通过气温和降水使得植被对气候变化的响应从加剧逐渐转为减缓趋势。此外,在海拔小于4000 m时,海拔主要通过气温对植被产生正向影响;在海拔大于4000 m时,海拔主要通过降水对植被产生负向影响。
图11
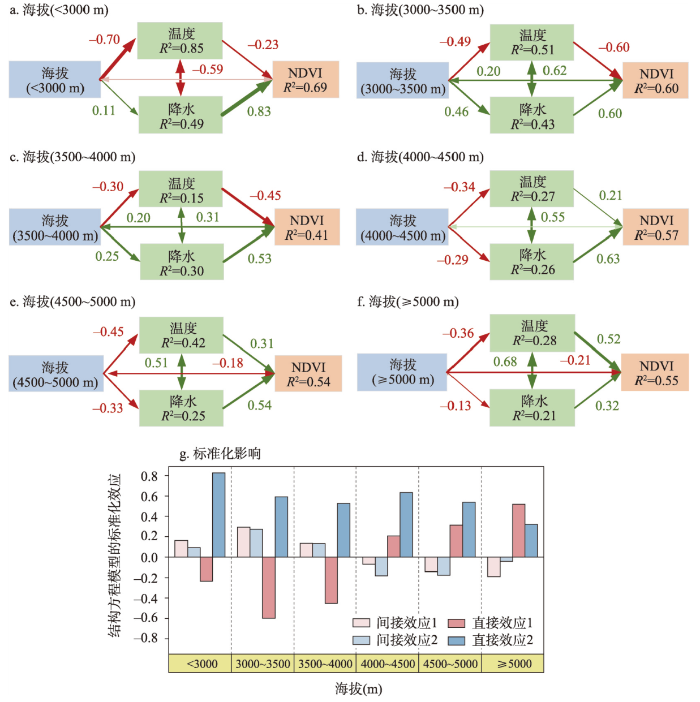
图11
海拔和气候因子对NDVI影响的结构方程模型
注:间接效应1和间接效应2分别是海拔通过调控气温、降水对NDVI的影响,直接效应1和直接效应2分别是气温、降水对NDVI的影响。
Fig. 11
Structural equation modeling of the effects of elevation and climate factors on NDVI
4 讨论
4.1 地形对NDVI变化的影响
海拔是影响植物生长水、热条件的主要因子。三江源地区植被增长趋势随海拔呈现先增大、后减少的反U型趋势,这与秦巴山区也有相似的规律[39-40]。在海拔4500~5000 m处,NDVI显著增加的面积最大,这可能是冻土消融以及气候暖湿化所导致的[41-42]。以往的研究表明,土壤含水量对植被影响较大且随坡度先增加后减少[43],因此NDVI均值随着坡度增加呈现先增加后减小的变化趋势(图2b)。Bochet等[44]研究表明,与阴坡相比,阳坡土壤的持水时间短,降水后阳坡土壤很快到达干燥点,可见阴坡的水源涵养能力大于阳坡。同时,阳坡因可用水分的制约,其植被覆盖率低,根系浅,土壤受风蚀和水蚀更强,水土流失更加严重[45]。因此,NDVI高值多分布在阴坡(图2)。
4.2 坡度对植被的调控作用
4.3 坡向对植被的调控作用
4.4 海拔对植被的调控作用
5 结论
本文聚焦地形对植被的间接影响以及地形因子如何调控气候变化对植被的响应,并探讨了在特定地形条件下,单一地形因子的变化如何调控植被对气候变化的响应。研究结论如下:地形因子对植被影响具有抵消作用,总体上地形对植被的影响可以忽略不计,但这种抵消效应是否适应于其他山区,还需进一步验证。各地形因子对植被具有重要的间接影响,地形在调控植被对气候变化响应方面具有重要作用。地形因子在影响植被对气候变化的响应中,海拔的影响最大,其次是坡度,坡向的影响较小。其中海拔主要通过调控气温来减缓植被对气候变化的响应,且随着海拔的升高,这种响应呈增加趋势;坡度则主要通过调控降水来加剧这种响应,且随着坡度的增加,这种响应呈先增加后减少的趋势;坡向也主要通过降水来加剧植被对气候变化的响应。本文通过随机点探测的规律代表了整个三江源地区,同样的方法可能能够推广到其他地区,但在具体实施过程中应进一步探究与完善,以解决大尺度下,复杂山区植被对气候变化响应机制的研究方法欠缺这一关键科学问题。
参考文献
Climate change in mountains: A review of elevation-dependent warming and its possible causes
DOI:10.1007/s10584-012-0419-3 URL [本文引用: 1]
A canonical response of precipitation characteristics to global warming from CMIP5 models
DOI:10.1002/grl.50420 URL [本文引用: 1]
Topographic controls on the spatial distribution of ground cover in the Tabernas badlands of SE Spain
DOI:10.1016/S0341-8162(03)00108-5 URL [本文引用: 1]
Impact of topography on the spatial distribution pattern of net primary productivity in a meadow
地形对草甸草原植被生产力分布格局的影响
β-Diversity and vegetation structure as influenced by slope aspect and altitude in a seasonally dry tropical landscape
DOI:10.1007/s10980-009-9332-1 URL [本文引用: 1]
Effects of topography and thickness of organic layer on productivity of black spruce boreal forests of the Canadian Clay Belt region
DOI:10.1016/j.foreco.2014.07.013 URL [本文引用: 1]
Elevation-dependent warming in mountain regions of the world
DOI:10.1038/nclimate2563 [本文引用: 2]
Spatial variation patterns of plant herbaceous community response to warming along latitudinal and altitudinal gradients in mountainous forests of the Loess Plateau, China
Effect of orography on precipitation in the western Himalayan region
DOI:10.1016/S0022-1694(96)03222-2 URL [本文引用: 1]
Analysis and estimation of geographical and topographic influencing factors for precipitation distribution over complex terrains: A case of the northeast slope of the Qinghai-Tibet Plateau
Due to the complex terrain, sparse precipitation observation sites, and uneven distribution of precipitation in the northeastern slope of the Qinghai–Tibet Plateau, it is necessary to establish a precipitation estimation method with strong applicability. In this study, the precipitation observation data from meteorological stations in the northeast slope of the Qinghai–Tibet Plateau and 11 geographical and topographic factors related to precipitation distribution were used to analyze the main factors affecting precipitation distribution. Based on the above, a multivariate linear regression precipitation estimation model was established. The results revealed that precipitation is negatively related to latitude and elevation, but positively related to longitude and slope for stations with an elevation below 1700 m. Meanwhile, precipitation shows positive correlations with both latitude and longitude, and negative correlations with elevation for stations with elevations above 1700 m. The established multivariate regression precipitation estimating model performs better at estimating the mean annual precipitation in autumn, summer, and spring, and is less accurate in winter. In contrast, the multivariate regression mode combined with the residual error correction method can effectively improve the precipitation forecast ability. The model is applicable to the unique natural geographical features of the northeast slope of the Qinghai–Tibet Plateau. The research results are of great significance for analyzing the temporal and spatial distribution pattern of precipitation in complex terrain areas.
The effects of topography on aboveground biomass and soil moisture at local scale in dryland grassland ecosystem, China
DOI:10.1016/j.ecolind.2019.05.002 URL [本文引用: 1]
Topographic controls on ecosystem evapotranspiration and net primary productivity under climate warming in the Taihang Mountains, China
Multi-scale spatial correlation between vegetation index and terrain attributes in a small watershed of the upper Minjiang River
Multiple effects of topographic factors on spatio-temporal variations of vegetation patterns in the Three Parallel Rivers region, southeast Qinghai-Tibet Plateau
Topographic factors are critical for influencing vegetation distribution patterns, and studying the interactions between them can enhance our understanding of future vegetation dynamics. We used the Moderate-resolution Imaging Spectroradiometer Normalized Differential Vegetation Index (MODIS NDVI) image dataset (2000–2019), combined with the Digital Elevation Model (DEM), and vegetation type data for trend analysis, and explored NDVI variation and its relationship with topographic factors through an integrated geographically-weighted model in the Three Parallel Rivers Region (TPRR) of southeastern Qinghai-Tibet Plateau (QTP) in the past 20 years. Our results indicated that there was no significant increase of NDVI in the entire basin between 2000–2019, except for the Lancang River basin. In the year 2004, abrupt changes in NDVI were observed across the entire basin and each sub-basin. During 2000–2019, the mean NDVI value of the whole basin increased initially and then decreased with the increasing elevation. However, it changed marginally with variations in slope and aspect. We observed a distinct spatial heterogeneity in vegetation patterns with elevation, with higher NDVI in the southern regions NDVI than those in the north as a whole. Most of the vegetation cover was concentrated in the slope range of 8~35°, with no significant difference in distribution except flat land. Furthermore, from 2000 to 2019, the vegetation cover in the TPRR showed an improving trend with the changes of various topographic factors, with the largest improvement area (36.10%) in the slightly improved category. The improved region was mainly distributed in the source area of the Jinsha River basin and the southern part of the whole basin. Geographically weighted regression (GWR) analysis showed that elevation was negatively correlated with NDVI trends in most areas, especially in the middle reaches of Nujiang River basin and Jinsha River basin, where the influence of slope and aspect on NDVI change was considerably much smaller than elevation. Our results confirmed the importance of topographic factors on vegetation growth processes and have implications for understanding the sustainable development of mountain ecosystems.
Influencing mechanism of regional ageing in China based on the Structural Equation Model
DOI:10.11821/dlxb202008002
[本文引用: 1]

Since the 1970s, great progress has been made in research on the spatio-temporal pattern of population ageing at multiple spatial scales by both domestic and foreign scholars. However, the analysis of the process mechanism of regional ageing is still insufficient. Based on the county-scale data in 2000 and 2010 censuses, the spatio-temporal pattern of population ageing is statistically analyzed. Moreover, the Structural Equation Model (or SEM) is developed to explore the path relationship between various variables. Consequently, the influencing mechanism of regional ageing process is thoroughly revealed. The main results are as follows. Firstly, the line from Baotou City of Inner Mongolia autonomous region to Tengchong County of Yunnan province (or BT Line) is a geographical demarcation of regional ageing disparities in China. Southeast of the BT Line witnesses contiguous areas of higher ageing counties which interspersed with lower ageing counties, whereas northwest of the BT Line is a continuous area of lower ageing counties with just one middle-level ageing belt located in the north margin. Secondly, the fitting results of SEM interpret the influencing mechanism of regional ageing disparities in China. Thirdly, life expectancy, fertility and migration are three endogenous factors of regional ageing process. Thereinto, life expectancy has significantly positive effect, while fertility and migration have significantly negative effects on regional ageing. Lastly, geographical environment has significant direct and indirect effects on regional ageing in China. In general, the income increase, social progress, and the improvement of living conditions and natural environmental quality would enhance regional ageing level, otherwise the improvement of urbanization level would decrease regional ageing level.
基于结构方程模型的中国县域人口老龄化影响机制
DOI:10.11821/dlxb202008002
[本文引用: 1]
利用2000年和2010年分县人口普查数据,分析中国县域人口老龄化的空间格局及变化,采用结构方程模型拟合人口老龄化影响因子之间的路径关系,探讨中国县域人口老龄化的影响机制。结果表明:内蒙古包头至云南腾冲是中国县域人口老龄化较为清晰的空间分界线,其东南部老龄化高值县区连片集中,低值县区夹杂其间;西北全域老龄化率普遍较低,仅在北缘横亘一条中值县区连绵带。结构方程模型的拟合结果很好地解释了中国县域人口老龄化空间差异的影响机制。迁移率、预期寿命和生育率是人口老龄化进程的内生因素,其中,预期寿命对县域人口老龄化有正向效应,迁移率和生育率则对县域人口老龄化有负向效应。社会经济、家庭状况和自然环境等因素是人口老龄化进程的外生因素,对中国县域人口老龄化有显著的直接和间接效应。收入增加、社会发展、居住条件改善以及环境舒适性提高等推高县域人口老龄化水平,城镇化水平提高则降低县域人口老龄化水平。
Quantifying the relative contribution of natural and human factors to vegetation coverage variation in coastal wetlands in China
Direct and indirect effects of elevation, climate and vegetation structure on bird communities on a tropical mountain
Effects of the interaction among climate, terrain and human activities on biodiversity on the Qinghai-Tibet Plateau
Asymmetric effects of daytime and night-time warming on Northern Hemisphere vegetation
DOI:10.1038/nature12434 [本文引用: 1]
Characteristics, drivers, and feedback of global greening
Sensitivity and areal differentiation of vegetation responses to hydrothermal dynamics on the southern and northern slopes of the Qinling Mountains in Shaanxi province
DOI:10.11821/dlxb202101004
[本文引用: 1]
The Qinling Mountains, located at the junction of warm temperate and subtropical zones, serves as the boundary between North and South China. Exploring the sensitivity of vegetation response to hydrothermal dynamics can be conducive to understanding the pattern and dynamics of main vegetation types and the mechanism of their response to changes in temperature and moisture. Importance should be attached to the laws of vegetation change in different climate zones. To reveal the sensitivity and areal differentiation of vegetation responses to hydrothermal dynamics, the spatial and temporal variation characteristics of NDVI and SPEI on the southern and northern slopes of the Qinling Mountains from 2000 to 2018 are explored using the meteorological data from 32 meteorological stations and the MODIS NDVI datasets. The results show that: (1) The overall vegetation coverage of the Qinling Mountains improved significantly from 2000 to 2018. The NDVI rise rate and area ratio on the southern slope were higher than those on the northern slope, and the vegetation on the southern slope exhibited better improvement than that on the northern slope. The Qinling Mountains showed an insignificant humidification trend. The humidification rate and humidification area of the northern slope were greater than those on the southern slope. (2) Vegetation on the northern slope of the Qinling Mountains was more sensitive to hydrothermal dynamics than that on the southern slope. Vegetation was most sensitive to hydrothermal dynamics from March to June on the northern slope, and from March to May (spring) on the southern slope. The vegetation on the northern and southern slopes was mainly affected by hydrothermal dynamics on a scale of 3-7 months, and it responds weakly to hydrothermal dynamics on a scale of 11-12 months. (3) 90.34% of NDVI and SPEI were positively correlated in the Qinling Mountains. Spring humidification in most parts of the study area could promote the growth of vegetation all the year round. The sensitivity of vegetation responses to hydrothermal dynamics with increasing altitude increased first and then decreased. The altitude of 800 to 1200 m was the most sensitive altitude for vegetation response to hydrothermal dynamics. The sensitivity of vegetation response at the elevation of 1200-3000 m decreased with the increasing altitude. The grass was the most sensitive vegetation type to hydrothermal dynamics on the northern and southern slopes of the Qinling Mountains, but most of other vegetation types on the northern slope were more sensitive to hydrothermal dynamics than those on the southern slope.
秦岭陕西段南北坡植被对干湿变化响应敏感性及空间差异
DOI:10.11821/dlxb202101004
[本文引用: 1]
秦岭位于暖温带与亚热带交界处,也是中国南北地理分界线,秦岭南北坡植被对干湿变化响应敏感性,可以折射出暖温带、亚热带地区主要植被类型对干湿变化的响应规律和机制特征,对深入理解不同气候带植被变化规律具有重要意义。本文利用秦岭山地32个气象站点的气象数据和MODIS NDVI时间序列数据集,探讨了2000—2018年秦岭南北坡NDVI和SPEI时空变化特征,揭示了南北坡植被对干湿变化响应敏感性及其空间差异。结果表明:① 2000—2018年秦岭植被覆盖情况整体显著改善,但秦岭南坡NDVI上升幅度和面积占比均高于北坡,南坡植被比北坡改善情况好。秦岭湿润化趋势不显著,但秦岭北坡湿润化速率和面积占比均大于南坡。② 秦岭北坡植被比南坡植被更易受干湿变化影响,秦岭北坡植被对3—6月总体干湿变化最为敏感,南坡植被对3—5月(春季)干湿变化最为敏感。秦岭南北坡植被主要受3~7个月尺度干湿变化影响,对11~12个月尺度的干湿变化响应较弱。③ 秦岭有90.34%的区域NDVI与SPEI呈正相关,大部分地区春季湿润化能促进全年植被生长;随海拔上升,植被对干湿变化响应敏感性先上升再下降,海拔800~1200 m是植被响应最敏感的海拔段,海拔1200~3000 m随海拔上升植被响应敏感性下降;南北坡草丛均是对干湿变化响应最为敏感的植被类型,但秦岭北坡多数植被类型对干湿变化响应比南坡敏感。
Spatial-temporal characteristics of three main land-use types in China based on MODIS data
基于MODIS数据的中国三种主要土地类型变化的空间特征分析
Spatiotemporal changes in extreme temperature and precipitation events in the Three-Rivers headwater region, China
DOI:10.1029/2017JD028226
URL
[本文引用: 1]
Extreme climate events affect sustainable development in many parts of the world. Although several studies of local extreme climate events exist, such events need more thorough investigation. Detailed studies of climatic variations that assess changes on both spatial and temporal scales are becoming increasingly necessary. In this study, 14 indices for extreme temperature and 12 indices for extreme precipitation were used to analyze the spatial distribution and temporal trends of extreme climate events in the three‐rivers headwater region (TRHR), China, over the past five decades. We found that the frequency of high temperature extremes has increased, whereas the frequency of dry extremes has decreased. Statistically significant upward trends emerged for the number of warm nights (TN90p) and the number of warm days (TX90p) in the TRHR, which increased at a rate of 11.75 and 6.79 days/10 years (p < 0.05), respectively. We also found a highly significant downward trend in the number of consecutive dry days with a rate of −4.05 days/10 years across the whole region. Overall, the TRHR has become warmer and wetter over the past 50 years and the frequency of extreme events has increased. Wavelet analysis indicated that there are significant relationships between extreme climate events in the TRHR and large‐scale ocean‐atmosphere circulation patterns, for example, the Pacific Decadal Oscillation and the El Niño–Southern Oscillation. Our findings will help local water managers and stakeholders ensure that there are effective measures in place to adapt to and mitigate the effects of potential future climate change in the TRHR.
Increased plant growth in the northern high latitudes from 1981 to 1991
DOI:10.1038/386698a0 [本文引用: 1]
Normalized Difference Vegetation Index dataset in the Three-River Headwaters Region from 2000 to 2018
[DB/OL].
2000—2018年三江源区归一化差植被指数数据集
Spatial interpolation dataset of meteorological data in the Three-River Headwaters Region from 2000 to 2018
[DB/OL].
2000—2018年三江源区气象数据空间插值数据集
PiecewiseSEM: Piecewise structural equation modelling in R for ecology, evolution, and systematics
DOI:10.1111/mee3.2016.7.issue-5 URL [本文引用: 2]
A stronger role for long-term moisture change than for CO2 in determining tropical woody vegetation change
DOI:10.1126/science.abg4618
URL
[本文引用: 1]
Anthropogenically elevated CO2(eCO2) concentrations have been suggested to increase woody cover within tropical ecosystems through fertilization. The effect of eCO2is built into Earth system models, although testing the relationship over long periods remains challenging. Here, we explore the relative importance of six drivers of vegetation change in western Africa over the past ~500,000 years (moisture availability, fire activity, mammalian herbivore density, temperature, temperature seasonality, CO2) by coupling past environmental change data from Lake Bosumtwi (Ghana) with global data. We found that moisture availability and fire activity were the most important factors in determining woody cover, whereas the effect of CO2was small. Our findings suggest that the role of eCO2effects on tropical vegetation in predictive models must be reconsidered.
Confirmatory path analysis in a generalized multilevel context
DOI:10.1890/08-1034.1
PMID:19323220
[本文引用: 1]
This paper describes how to test, and potentially falsify, a multivariate causal hypothesis involving only observed variables (i.e., a path analysis) when the data have a hierarchical or multilevel structure, when different variables are potentially defined at different levels of such a hierarchy, and when different variables have different sampling distributions. The test is a generalization of Shipley's d-sep test and can be conducted using standard statistical programs capable of fitting generalized mixed models.
A brief introduction of structural equation model and its application in ecology
DOI:10.3724/SP.J.1258.2011.00337
[本文引用: 1]
Natural systems are essentially complex. In most cases, fully understanding natural systems requires the capacity to examine simultaneous influences and responses among multiple interacting factors. Compared with traditional multivariate methods, structural equation model (SEM) could specify the causal or dependent relationships among variables using the prior knowledge of researchers before conducting relevant experiments, i.e. initial models. SEM could not only identify the individual path coefficient for each relationship, but also estimate the whole model fit to determine whether to revise the initial models. We attempt to introduce SEM from the following aspects: definition and types of variables in SEM, detailed procedures for how to analyze data through SEM, some applications of SEM in ecology and recommended software. We encourage more researchers to apply SEM in ecological data analyses in order to improve understanding of natural systems and advance the field of ecology.
结构方程模型及其在生态学中的应用
DOI:10.3724/SP.J.1258.2011.00337
[本文引用: 1]
基于多变量统计方法同时研究自然系统内多个因子之间的相互关系, 是阐释复杂的自然系统的一个重要手段。相比传统的多变量统计法, 结构方程模型基于研究者的先验知识预先设定系统内因子间的依赖关系, 不仅能够判别各因子之间的关系强度(路径系数), 还能对整体模型进行拟合和判断, 从而能更全面地了解自然系统。由于结构方程模型只在近年才被应用到生态学的数据分析中, 因此该文试图对其作一简略介绍, 包括结构方程模型的定义和变量类型, 结合事例研究展现结构方程模型分析的一般步骤、在生态学中的应用以及相关软件的介绍等。望能为相关研究人员提供直观的认识, 加强结构方程模型在生态学数据分析中的应用。
Functional traits explain the consistent resistance of biodiversity to plant invasion under nitrogen enrichment
DOI:10.1111/ele.v25.4 URL [本文引用: 1]
Temporal and spatial changes of vegetation coverage and its topographic differentiation in temperate continental semi-arid monsoon climate region
温带大陆性半干旱季风气候区植被覆盖度时空变化及其地形分异研究
Using SPOT VEGETATION for analyzing dynamic changes and influencing factors on vegetation restoration in the Three-River Headwaters Region in the last 20 years (2000-2019), China
Vegetation dynamics and responses to climate change and anthropogenic activities in the Three-River Headwaters Region, China
Managing the Three-Rivers headwater region, China: From ecological engineering to social engineering
DOI:10.1007/s13280-012-0366-2
PMID:23335004
[本文引用: 1]
The three-rivers headwater region (THRHR) of Qinghai province, China plays a key role as source of fresh water and ecosystem services for central and eastern China. Global warming and human activities in the THRHR have threatened the ecosystem since the 1980s. Therefore, the Chinese government has included managing of the THRHR in the national strategy since 2003. The State Integrated Test and Demonstration Region of the THRHR highlights the connection with social engineering (focus on improving people's livelihood and well-being) in managing nature reserves. Based on this program, this perspective attempts a holistic analysis of the strategic role of the THRHR, requirements for change, indices of change, and approaches to change. Long-term success of managing nature reserves requires effective combination of ecological conservation, economic development, and social progress. Thus, the philosophy of social engineering should be employed as a strategy to manage the THRHR.
Greening of the Earth and its drivers
DOI:10.1038/NCLIMATE3004
[本文引用: 1]
Global environmental change is rapidly altering the dynamics of terrestrial vegetation, with consequences for the functioning of the Earth system and provision of ecosystem services(1,2). Yet how global vegetation is responding to the changing environment is not well established. Here we use three long-term satellite leaf area index (LAI) records and ten global ecosystem models to investigate four key drivers of LAI trends during 1982-2009. We show a persistent and widespread increase of growing season integrated LAI (greening) over 25% to 50% of the global vegetated area, whereas less than 4% of the globe shows decreasing LAI (browning). Factorial simulations with multiple global ecosystem models suggest that CO2 fertilization effects explain 70% of the observed greening trend, followed by nitrogen deposition (9%), climate change (8%) and land cover change (LCC) (4%). CO2 fertilization effects explain most of the greening trends in the tropics, whereas climate change resulted in greening of the high latitudes and the Tibetan Plateau. LCC contributed most to the regional greening observed in southeast China and the eastern United States. The regional effects of unexplained factors suggest that the next generation of ecosystem models will need to explore the impacts of forest demography, differences in regional management intensities for cropland and pastures, and other emerging productivity constraints such as phosphorus availability.
Spatiotemporal pattern of gross primary productivity and its covariation with climate in China over the last thirty years
DOI:10.1111/gcb.13830
PMID:28727222
[本文引用: 1]
The uncertainties of China's gross primary productivity (GPP) estimates by global data-oriented products and ecosystem models justify a development of high-resolution data-oriented GPP dataset over China. We applied a machine learning algorithm developing a new GPP dataset for China with 0.1° spatial resolution and monthly temporal frequency based on eddy flux measurements from 40 sites in China and surrounding countries, most of which have not been explored in previous global GPP datasets. According to our estimates, mean annual GPP over China is 6.62 ± 0.23 PgC/year during 1982-2015 with a clear gradient from southeast to northwest. The trend of GPP estimated by this study (0.020 ± 0.002 PgC/year from 1982 to 2015) is almost two times of that estimated by the previous global dataset. The GPP increment is widely spread with 60% area showing significant increasing trend (p < .05), except for Inner Mongolia. Most ecosystem models overestimated the GPP magnitudes but underestimated the temporal trend of GPP. The monsoon affected eastern China, in particular the area surrounding Qinling Mountain, seems having larger contribution to interannual variability (IAV) of China's GPP than the semiarid northwestern China and Tibetan Plateau. At country scale, temperature is the dominant climatic driver for IAV of GPP. The area where IAV of GPP dominated by temperature is about 42%, while precipitation and solar radiation dominate 31% and 27% respectively over semiarid area and cold-wet area. Such spatial pattern was generally consistent with global GPP dataset, except over the Tibetan Plateau and northeastern forests, but not captured by most ecosystem models, highlighting future research needs to improve the modeling of ecosystem response to climate variations.© 2017 John Wiley & Sons Ltd.
Climate warming benefits alpine vegetation growth in Three-River Headwater Region, China
Spatiotemporal variation of vegetation coverage in Qinling-Daba Mountains in relation to environmental factors
DOI:10.11821/dlxb201505003
[本文引用: 1]
The Qinling-Daba (Qinba) Mountains, a key ecological zone of terrestrial ecosystem, has experienced a significant change of vegetation coverage in recent years, which is characterized by rapid climate change. Using MODIS-NDVI dataset, the current study investigated the patterns of spatiotemporal variation of vegetation coverage in the Qinba Mountains during the period 2000-2014. In addition, possible environmental factors affecting this variation were identified. Sen+Mann-Kendall model and partial correlation analysis were used to analyze the data, followed by the calculation of Hurst index in order to analyze future trends of vegetation coverage. The results of the study showed that (1) the Normalized Difference Vegetation Index (NDVI) of the study area revealed a significant increase during 2000-2014 (linear tendency 2.8%/10a). During this period, a stable increase was detected before 2010 (linear tendency 4.32%/10a), followed by a sharp decline after 2010 (linear tendency -6.59%/10a). (2) In terms of spatiotemporal variation, vegetation cover showed a "high in the middle and low in surroundings" pattern. High values of vegetation coverage were mainly found in the Qinba Mountains of Shaanxi Province, while low values of vegetation coverage were mainly observed in Longnan, Tianshui, and Gannan prefectures occupied by arable land. (3) The area covered with vegetation was larger than the degraded area, accounting for 81.32% and 18.68% of the total area, respectively. Piecewise analysis revealed that 71.61% of the total study area showed a decreasing trend in vegetation coverage during 2010-2014, of which, the extremely significant and significant decrease accounted for 6.38% and 3.45%, respectively. (4) The reverse characteristics of vegetation coverage change were stronger than the same characteristic in the Qinba Mountains. Some 46.89% of the entire study area is predicted to decrease in future, while 34.44% of the total area will follow a continuous increasing trend. (5) The change of vegetation coverage was mainly attributed to the deficit of precipitation. At the same time, vegetation coverage during La Nina years was larger than that during El Nino years. Statistical analysis showed that positive and negative anomaly pixels accounted for 28.37% and 71.63%, respectively during El Nino years and 80.48% and 19.52%, respectively during La Nina years. (6) Human activities can induce ambiguous effects on vegetation coverage: both positive effect (through the implementation of the ecological restoration project) and negative effect (through urbanization) were observed.
2000—2014年秦巴山区植被覆盖时空变化特征及其归因
DOI:10.11821/dlxb201505003
[本文引用: 1]
利用MODIS-NDVI数据,辅以趋势分析、Hurst指数及偏相关分析等方法,本文探讨了2000-2014年秦巴山区植被覆盖时空变化特征及未来趋势,并对其驱动因素进行分析。研究发现:① 近15年秦巴山区植被覆盖呈显著增加趋势,增速为2.8%/10a,其中2010年之前植被覆盖呈持续增加趋势,增速为4.32%/10a,而2010年之后呈连续下降态势,降速为-6.59%/10a;② 空间上,植被覆盖格局呈现“中间高、四周低”的分布特征,高值区主要分布在陕西境内的秦岭山地和大巴山山地;③ 秦巴山区植被覆盖呈增加和减少趋势的面积分别占81.32%和18.68%;然而,分段结果表明,2010-2014年有71.61%的区域植被覆盖呈下降趋势;④ 秦巴山区植被覆盖变化的反向特征强于同向特征,其中46.89%的区域将由改善转为退化,而持续改善地区仅占34.44%;⑤ 植被覆盖变化主要归因于降水的减少,同时拉尼娜年的植被覆盖整体好于厄尔尼诺年;⑥ 人类活动对植被覆盖造成双重影响,是植被覆盖变化的另一重要影响因素。
Spatial-temporal changes in vegetation characteristics and climate in the Qinling-Daba Mountains
秦巴山区植被覆盖变化及气候因子驱动分析
Elevation-dependent relationships between climate change and grassland vegetation variation across the Qinghai-Xizang Plateau
DOI:10.1002/joc.2015.35.issue-7 URL [本文引用: 1]
Vegetation changes in the permafrost regions of the Qinghai-Tibetan plateau from 1982-2012: Different responses related to geographical locations and vegetation types in high-altitude areas
Effects of topography on the distribution pattern of net primary productivity of grassland in Changji prefecture, Xinjiang
地形对新疆昌吉州草地净初级生产力分布格局的影响
Factors controlling vegetation establishment and water erosion on motorway slopes in Valencia, Spain
DOI:10.1111/rec.2004.12.issue-2 URL [本文引用: 2]
Influence of climatic and geographic factors on the spatial distribution of Qinghai spruce forests in the dryland Qilian Mountains of Northwest China
DOI:10.1016/j.scitotenv.2017.08.180 URL [本文引用: 3]
A data mining approach for understanding topographic control on climate-induced inter-annual vegetation variability over the United States
DOI:10.1016/j.rse.2005.05.017 URL [本文引用: 2]
Response of vegetation to water balance conditions at different time scales across the karst area of southwestern China: A remote sensing approach
DOI:10.1016/j.scitotenv.2018.07.148 URL [本文引用: 1]
Climate change with elevation and its potential impact on water resources in the Tianshan Mountains, Central Asia
DOI:10.1016/j.gloplacha.2015.09.015 URL [本文引用: 1]
The importance of permafrost in the steady and fast increase in net primary production of the grassland on the Qinghai-Tibet Plateau
Temperature change and its elevation dependency on the Tibetan Plateau and vicinity from 1971 to 2012
1971—2012年青藏高原及周边地区气温变化特征及其海拔敏感性分析
Precipitation trend: Elevation relationship in arid regions of the China
DOI:10.1016/j.gloplacha.2016.05.007 URL [本文引用: 1]
Dual influence of climate change and anthropogenic activities on the spatiotemporal vegetation dynamics over the Qinghai-Tibetan Plateau from 1981 to 2015
