

1 引言
二氧化碳排放的逐年增加,导致了全球气候变暖问题越来越显著[1]。在这个背景下,中国庄严承诺,力争2030年前二氧化碳排放达到峰值,努力争取2060年前实现碳中和[2-3]。厘清中国陆地的碳汇潜力对中国实现“双碳”目标具有重要的意义。陆地生态系统是全球主要碳汇之一[4],每年能吸收约28%的由人为活动产生的二氧化碳[5];且增加陆地生态系统碳储量,是应对气候变化的重要措施之一[6]。而土壤是陆地生态系统最大的碳库,全球陆地生态系统超过80%的碳存储于土壤中[7]。中国土壤碳储量约占全世界土壤碳储量6.73%[8],占中国总碳储量82.9%[9]。可见,研究和保护中国陆地生态系统土壤碳汇是实现“双碳”目标的必经路径和必要前提。
土地利用既是重要的碳源,也是重要的碳汇[10]。有研究发现,2011—2020年全球土地利用转变导致的碳排放占全球碳排放的14%[11]。但也有学者指出,农田、林地、草地经过施肥、灌溉等管理措施后相对于未经过管理措施的农田、林地、草地能吸收更多的二氧化碳,具有巨大的增汇潜力[12]。金琳等[13]认为,农田土壤碳库损失量的60%~70%左右可通过采用合理的管理措施重新固定。Yu等[14]的研究结果显示,农田土壤有机碳库在特定气候变化或实施特定管理措施情况下均会有明显增加,且农田管理的影响远远大于气候变化的影响。另外,森林在陆地生态系统碳循环及减缓全球气候变化中也发挥着重要的作用[15]。中国森林的碳汇约为163 Tg C a-1 [16]。森林管理碳汇是森林碳汇的重要组成部分,Walker等[17]认为全球未来固碳潜力为287 Pg C,改善现有森林的管理可提供近3/4的未实现潜力。此外,Zhang等[18]指出,草地也是重要的碳汇。中国草地面积约占中国总面积的41%,草地管理实践被认为是提高土壤有机碳积累的有效选择之一[19]。
随着地面观测和3S技术的发展,学者们以森林、草地清查数据或遥感影像数据为基础,开展了大量有关陆地生态系统碳储量的研究工作[6]。如Pan等[20] 开展了全球森林碳汇研究,Piao等[21]开展了中国陆地生态系统碳平衡研究,Yu等[22]基于1 km网格土地利用数据,估算中国土壤有机碳储量为89.1 Pg C。然而,已有研究所用的土地利用数据分辨率普遍偏低,特别是在全国尺度,土地利用数据分辨率主要为500 m或1000 m[23⇓⇓⇓-27],难以很好地表达精细尺度的碳储量及碳汇情况。且研究的年份主要在2017年以前,早年的中国土地的碳储量和碳汇研究无法很好地支持新时期中国碳达峰、碳中和的战略需求。
因此本文基于2000年、2020年30 m中国土地利用数据、中国气候区、中国温度带等多源数据,同时收集和参考了近年已发布的中国碳储量文献数据,开展了以下研究工作:① 估测2000—2020年中国农田及草地管理土壤碳汇;② 核算2000—2020年中国森林管理碳汇;③ 计算2000年、2020年中国土壤有机碳储量;④ 评估2000—2020年中国土壤有机碳储量变化情况①(①本文全国土壤碳储量计算深度为100 cm,与IPCC一致。);⑤ 估算2000—2020年中国土地利用转变导致土壤碳储量变化。旨在为中国以及国内各级政府制定实现“双碳”目标的政策提供更有力的研究基础和数据支持。
2 研究方法与数据来源
2.1 数据来源
2.1.1 碳密度及土地管理碳数据
本文所用2000年森林面积、2000—2020年森林转出面积来源于CLUD数据集[29]。单位面积蓄积量、2014—2018年森林生长率、2014—2018年森林消耗率来源于《中国森林资源报告(2014—2018)》,树干材积密度、生物量扩展系数来源于第七次森林资源清查。
2.1.2 土地利用数据
2.1.3 气候区及温度带数据
本文所使用气候区数据来源于中国科学院资源环境科学数据中心(
2.2 研究方法
本文所用的中国陆地土壤碳储量和土壤碳汇及管理碳汇估算框架涉及多种碳汇及碳储量估算。首先根据2000年、2020年土地利用数据、土壤密度数据、全国土壤分布数据、中国气候带及温度带数据,估算中国农田及草地管理土壤碳汇;然后根据2000年林地面积及2000—2020年林地转出面积、《中国森林资源报告(2014—2018)》,估算中国森林管理碳汇。其后根据2000年、2020年土地利用类型及土壤碳密度数据估算2000年、2020年中国土壤碳储量及2000—2020年中国土壤碳储量变化;最后将2000年及2020年土地利用类型叠加,得出2000—2020年动态栅格数据,估算2000—2020年中国土地利用转变导致碳储量排放。
2.2.1 碳储量和碳汇核算方法
(1)农田及草地管理土壤碳汇计算
式中:∆SOC代表管理土壤碳汇(Tg C a-1);SOCREFc代表土壤有机碳密度;FLUc代表土地利用的影响因素;FMGc代表土地管理的影响因素;FIc代表养分输入的影响因素;c代表气候区;A代表对应土地类型的面积。
(2)森林管理碳汇计算
森林管理碳汇根据侯振宏等[33]的研究,由以下公式计算:
式中:∆C代表森林管理碳汇(Tg C a-1);AFM,t为t年时森林管理面积(hm2);Vi,t为i省(市、区)在t年时的森林单位面积蓄积量(m3 hm-2);Di,t为i省(市、区)在t年时的林分蓄积生长率与林分蓄积消耗率之差(%);BEFi为i省(市、区)树干到全林的生物量扩展系数平均值;WDi为i省(市、区)平均木材密度;CFi为i省(市、区)平均生物量碳含量,参考已有研究设置为0.5[12]。
本文中,森林管理碳汇为2000—2020年间森林管理活动产生的碳汇。森林管理活动是指除造林、再造林和毁林以外的可引起碳储量变化的所有森林管理活动,如控制用火、森林防火、病虫害防治、森林更新、幼林抚育(除草、松土等)、修枝、施肥、灌溉、排水、采伐及采伐剩余物和枯死木管理等。其中森林管理面积为2000—2020年始终保持为森林的面积。
(3)土壤碳储量计算
土壤碳储量根据Xu等[6]的研究,由以下公式计算:
式中:SOC表示土壤有机碳储量(Pg C);SOCREFi表示第i种生态系统的土壤有机碳密度;Ai代表第i种生态系统土壤的面积。
(4) 土壤有机碳储量变化计算
土壤有机碳储量变化速率根据Xu等[6]的研究,由以下公式计算:
式中:
2.2.2 土地利用转变导致的土壤碳储量变化
土地利用转变导致的土壤碳储量变化根据Chuai等[26]的研究,由以下公式计算:
式中:C表示土地利用变化引起的总碳排放变化;
3 研究结果
3.1 2000—2020年中国农田及草地管理土壤碳汇
2000—2020年中国农田土壤经过施用有机肥、秸秆还田以及免耕等措施,农田管理土壤碳汇约为17.918 Tg C a-1(表1)。农田管理土壤碳汇较大的省份为山东、新疆、甘肃、河北、吉林、河南、内蒙古、黑龙江,数值范围为0.852~2.487 Tg C a-1,主要为农田面积分布较多的省份。农田管理土壤碳汇较小的省份为上海、北京、西藏、天津、海南、青海、福建,数值范围为0.021~0.150 Tg C a-1。
表1 2000—2020年中国各省区管理碳汇(Tg C a-1)
Tab. 1
| 省份 | 农田管理碳汇 | 草地管理碳汇 | 森林管理碳汇 | 省份 | 农田管理碳汇 | 草地管理碳汇 | 森林管理碳汇 |
|---|---|---|---|---|---|---|---|
| 北京 | 0.035 | 0.000 | 0.366 | 湖北 | 0.596 | 0.003 | 3.019 |
| 天津 | 0.069 | 0.000 | 0.004 | 湖南 | 0.465 | 0.001 | 3.587 |
| 河北 | 1.026 | 0.036 | 0.618 | 广东 | 0.291 | 0.002 | 8.020 |
| 山西 | 0.640 | 0.000 | 1.465 | 广西 | 0.495 | 0.001 | 6.165 |
| 内蒙古 | 1.242 | 17.133 | 7.122 | 海南 | 0.082 | 0.001 | 1.602 |
| 辽宁 | 0.772 | 0.001 | 2.742 | 重庆 | 0.258 | 0.037 | 1.149 |
| 吉林 | 1.076 | 0.028 | 4.751 | 四川 | 0.706 | 0.634 | 3.320 |
| 黑龙江 | 2.487 | 0.300 | 11.578 | 贵州 | 0.478 | 0.045 | 1.999 |
| 上海 | 0.021 | 0.000 | 0.001 | 云南 | 0.652 | 0.050 | 4.718 |
| 江苏 | 0.509 | 0.005 | 0.039 | 西藏 | 0.056 | 0.196 | 0.119 |
| 浙江 | 0.222 | 0.009 | 4.416 | 陕西 | 0.382 | 0.067 | 1.394 |
| 安徽 | 0.657 | 0.000 | 1.242 | 甘肃 | 0.930 | 0.219 | 0.906 |
| 福建 | 0.150 | 0.023 | 5.421 | 青海 | 0.102 | 0.794 | 0.159 |
| 江西 | 0.344 | 0.001 | 4.454 | 宁夏 | 0.220 | 0.012 | 0.017 |
| 山东 | 0.852 | -0.004 | 0.028 | 新疆 | 0.897 | 0.579 | 0.597 |
| 河南 | 1.206 | -0.001 | 0.604 |
注:台湾、香港、澳门数据暂缺。
2000—2020年间草地经过灌溉、施肥、物种改良等管理措施之后,草地管理土壤碳汇达到20.171 Tg C a-1(表1)。草地管理土壤碳汇较大的省份为甘肃、黑龙江、新疆、四川、青海、内蒙古,数值范围为0.219~17.133 Tg C a-1,主要分布在草地面积较为广泛的北部及西北地区。北京、天津草地管理土壤碳汇分别为238.833 t C a-1、29.696 t C a-1。其中上海、山西、安徽、河南、山东5个省级地区草地管理土壤为碳排放,分别排放3.145 t C a-1、231.189 t C a-1、307.648 t C a-1、0.001 Tg C a-1及0.004 Tg C a-1。上述省级地域主要分布在中国华北及沿海地区。
3.2 2000—2020年中国森林管理碳汇
本文估算的2000—2020年中国森林管理碳汇约为81.622 Tg C a-1。森林管理碳汇较多的省份为吉林、福建、广西、内蒙古、广东、黑龙江,上述省份碳汇数值范围为4.751~11.578 Tg C a-1(表1)。森林管理碳汇较多的省份主要为森林资源分布广泛的东北及南部地区,较少的省份为上海、天津、宁夏、山东、江苏、西藏,碳汇范围为0.001~0.119 Tg C a-1。主要分布在中国的东部沿海及西部地区。
3.3 中国土壤碳储量核算结果及变化
3.3.1 2000—2020年中国土壤有机碳储量
研究结果还显示,2000年和2020年中国的土壤有机碳储量(0~100 cm)分别为86.074 Pg C和86.771 Pg C,其中耕地土壤碳储量分别为16.592 Pg C和16.349 Pg C,林地土壤碳储量分别为32.131 Pg C和32.565 Pg C,草地土壤碳储量分别为29.464 Pg C和29.036 Pg C,湿地土壤碳储量分别为2.322 Pg C和2.787 Pg C,其他用地土壤碳储量分别为5.565 Pg C和6.034 Pg C。2000年土壤总碳储量排名前7的省份分别是云南、青海、四川、黑龙江、新疆、内蒙古、西藏,这些地区的土壤碳的存储量范围在4.772~9.868 Pg C之间(表2),主要为区域面积较大的省份。2020年土壤总碳储量排前7的省份与2000年一致,但碳储量数值范围与排名顺序略有不同。2000年土壤总碳储量排名后8位的省级地域分别为上海、天津、北京、海南、宁夏、台湾、江苏、重庆,土壤碳储量的变化范围为0.050~0.943 Pg C,主要为面积较小的直辖市、省份或者东部沿海省份,2020年土壤总碳储量排后8位的省级地区与2000年一致,但碳储量数值范围与排名顺序有一定的变化。2000年碳密度排名前6的省份为:福建、台湾、湖南、江西、浙江、广西,上述各省份碳密度变化范围为125.161~128.662 t C hm-2;到了2020年,贵州省成为前6的省份,福建省落到第7位。2000年碳密度排名后六位的省份为:新疆、宁夏、青海、天津、甘肃、和江苏,各省份碳密度变化范围为51.313~72.854 t C hm-2;直至2020年,上海成为后6位的省级区域,甘肃上升到第27位。
表2 2000—2020年中国不同省份土壤碳储量和碳密度及变化
Tab. 2
| 省份 | 2000年总碳储量(Pg C) | 2000年碳密度(t C hm-2) | 2020年总碳储量(Pg C) | 2020年碳密度(t C hm-2) | 2000—2020年碳储量变化(Tg C) | 2000—2020年碳密度变化(t C hm-2) | 省份 | 2000年总碳储量(Pg C) | 2000年碳密度(t C hm-2) | 2020年总碳储量(Pg C) | 2020年碳密度(t C hm-2) | 2000—2020年碳储量变化(Tg C) | 2000—2020年碳密度变化(t C hm-2) |
|---|---|---|---|---|---|---|---|---|---|---|---|---|---|
| 北京 | 0.175 | 106.642 | 0.165 | 100.548 | -9.857 | -6.007 | 湖南 | 2.697 | 127.337 | 2.74 | 129.367 | 42.704 | 2.016 |
| 天津 | 0.085 | 71.429 | 0.075 | 63.025 | -9.872 | -8.296 | 广东 | 2.166 | 120.534 | 2.163 | 120.367 | -2.727 | -0.152 |
| 河北 | 1.862 | 98.623 | 1.817 | 96.239 | -44.801 | -2.373 | 广西 | 3.057 | 128.662 | 3.072 | 129.293 | 14.573 | 0.613 |
| 山西 | 1.679 | 107.147 | 1.678 | 107.084 | -1.535 | -0.098 | 海南 | 0.433 | 122.316 | 0.432 | 122.034 | -1.418 | -0.401 |
| 内蒙古 | 9.58 | 80.981 | 9.787 | 82.730 | 207.591 | 1.755 | 重庆 | 0.943 | 114.442 | 0.965 | 117.112 | 21.812 | 2.647 |
| 辽宁 | 1.638 | 110.676 | 1.656 | 111.892 | 18.066 | 1.221 | 四川 | 5.335 | 109.774 | 5.454 | 112.222 | 119.728 | 2.464 |
| 吉林 | 2.197 | 117.236 | 2.235 | 119.264 | 38.14 | 2.035 | 贵州 | 2.182 | 123.907 | 2.208 | 125.383 | 25.852 | 1.468 |
| 黑龙江 | 5.581 | 117.992 | 5.678 | 120.042 | 96.437 | 2.039 | 云南 | 4.772 | 121.117 | 4.862 | 123.401 | 89.817 | 2.28 |
| 上海 | 0.05 | 78.864 | 0.041 | 64.669 | -8.552 | -13.489 | 西藏 | 9.868 | 82.066 | 9.416 | 78.323 | -452.271 | -3.762 |
| 江苏 | 0.781 | 72.854 | 0.706 | 65.858 | -75.375 | -7.031 | 陕西 | 2.11 | 102.527 | 2.151 | 104.519 | 41.455 | 2.014 |
| 浙江 | 1.304 | 127.843 | 1.278 | 125.294 | -25.813 | -2.531 | 甘肃 | 3.049 | 71.606 | 3.12 | 73.274 | 70.754 | 1.662 |
| 安徽 | 1.37 | 98.138 | 1.367 | 97.923 | -2.532 | -0.181 | 青海 | 4.969 | 68.794 | 5.182 | 71.743 | 212.792 | 2.946 |
| 福建 | 1.552 | 125.161 | 1.554 | 125.323 | 1.888 | 0.152 | 宁夏 | 0.451 | 67.922 | 0.452 | 68.072 | 1.188 | 0.179 |
| 江西 | 2.127 | 127.442 | 2.155 | 129.119 | 27.769 | 1.664 | 新疆 | 8.518 | 51.313 | 8.894 | 53.578 | 375.918 | 2.265 |
| 山东 | 1.322 | 83.724 | 1.251 | 79.227 | -70.919 | -4.491 | 台湾 | 0.457 | 126.944 | 0.468 | 130.000 | 11.101 | 3.084 |
| 河南 | 1.572 | 94.132 | 1.543 | 92.395 | -29.071 | -1.741 | 香港 | 0.012 | 107.743 | 0.012 | 107.743 | 0.283 | 2.541 |
| 湖北 | 2.18 | 117.267 | 2.194 | 118.020 | 13.873 | 0.746 | 澳门 | 0.0001 | 30.488 | 0.0001 | 30.488 | 0.003 | 0.915 |
| 合计 | 86.074 | 89.243 | 86.771 | 89.968 | 697.001 | 0.723 |
总的来说,2000—2020年中国土壤有机碳储量(0~100 cm)增加约0.697 Pg C(约34.850 Tg C a-1),其中耕地土壤碳储量减少约0.243 Pg C,森林土壤碳储量增加约0.434 Pg C,草地土壤碳储量减少约0.428 Pg C,湿地土壤碳储量增加约0.465 Pg C,其他土壤碳储量增加0.469 Pg C(图1)。草地生态系统土壤有机碳储量有较大幅度减少,耕地生态系统土壤有机碳储量小幅减少,而林地及湿地生态系统土壤有机碳储量有较大的提高。
图1
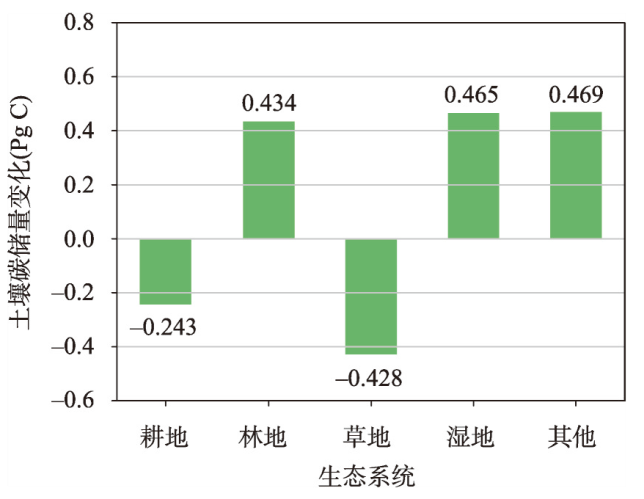
图1
2000—2020年中国陆地不同生态系统土壤碳储量变化
Fig. 1
Changes in soil carbon storage in different ecosystems of China from 2000 to 2020
另外,本文还统计2000—2020年不同省份土壤碳储量变化。研究结果表明,中国各省份土壤碳储量在研究时间段内有较大幅度的改变(表2)。其中碳储量增加最多的7个省份为甘肃、云南、黑龙江、四川、内蒙古、青海及新疆,增加的范围在70.754~375.918 Tg C。主要分布在北部及西部面积较大的省份。碳储量减少最多的6个省份为浙江、河南、河北、山东、江苏及西藏,减少的范围在25.813~452.271 Tg C,主要分布在华东经济发达及西部面积较大的省份。2000—2020年碳密度增加排名前6的省份为新疆、云南、四川、重庆、青海及台湾,增加范围为2.265~3.084 t C hm-2,主要分布在东北部及西部地区。碳密度减少最多的前6个省份为西藏、山东、北京、江苏、天津及上海,减少范围3.762~13.489 t C hm-2,除了西藏外,都分布在沿海经济发达的地区。
2000—2020年中国土地利用转变导致土壤碳储量减少约352.422 Tg C(图2)。其中固碳较多的土地转变类型为耕地转变为林地,总吸收量达到578.109 Tg C,草地转变为耕地和林地,分别吸收96.572 Tg C及313.518 Tg C;水域转变为耕地吸收103.148 Tg C,未利用地转变为耕地及草地分别吸收118.427 Tg C及1009.433 Tg C。释放碳较多的土地转变类型分别为耕地转变为草地、水域及建设用地,分别释放91.904 Tg C、132.574 Tg C和778.310 Tg C;林地转变为耕地释放592.830 Tg C,草地转变为未利用地释放811.930 Tg C(表3)。
图2
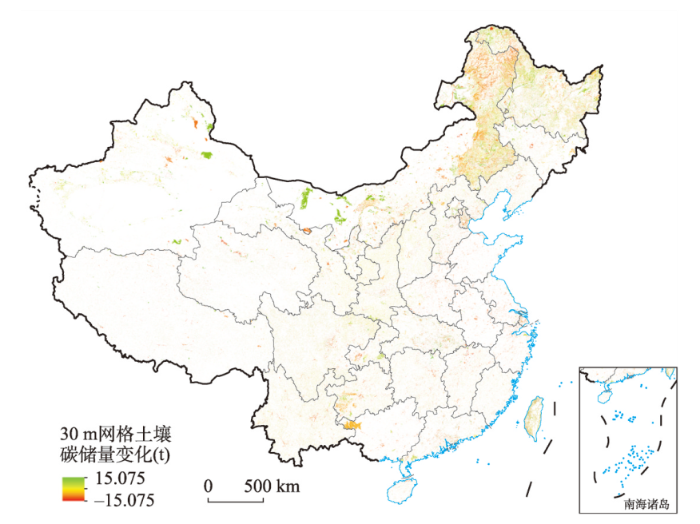
图2
2000—2020年中国地块尺度土地利用转变土壤碳储量变化
注:基于自然资源部标准地图服务网站GS(2016)1579号标准地图制作,底图边界无修改。
Fig. 2
Changes in soil carbon storage in China at parcel scale from 2000 to 2020
表3 2000—2020年土地类型转变导致土壤碳储量的变化
Tab. 3
| 土地类型转变 | 土壤碳储量变化(Tg C) | 土地类型转变 | 土壤碳储量变化(Tg C) |
|---|---|---|---|
| 农田转变为森林 | 578.109 | 草地转变为未利用地 | -811.930 |
| 农田转变为灌木 | 5.981 | 草地转变为建设用地 | -60.860 |
| 农田转变为草地 | -91.904 | 草地转变为湿地 | 4.180 |
| 农田转变为水域 | -132.574 | 水域转变为农田 | 103.148 |
| 农田转变为未利用地 | -9.222 | 水域转变为森林 | 9.440 |
| 农田转变为建设用地 | -778.310 | 水域转变为灌木 | 0.014 |
| 农田转变为湿地 | 0.166 | 水域转变为草地 | 20.250 |
| 森林转变为农田 | -592.830 | 水域转变为湿地 | 0.074 |
| 森林转变为灌木 | -24.983 | 未利用地转变为农田 | 118.427 |
| 森林转变为草地 | -20.612 | 未利用地转变为森林 | 0.590 |
| 森林转变为水域 | -4.835 | 未利用地转变为灌木 | 0.051 |
| 森林转变为未利用地 | -0.086 | 未利用地转变为草地 | 1009.433 |
| 森林转变为建设用地 | -54.778 | 未利用地转变为湿地 | 0.009 |
| 森林转变为湿地 | 0.001 | 建设用地转变为农田 | 7.548 |
| 灌木转变为农田 | -10.593 | 建设用地转变为森林 | 0.104 |
| 灌木转变为森林 | 39.662 | 建设用地转变为草地 | 0.116 |
| 灌木转变为草地 | -13.868 | 建设用地转变为湿地 | 0.001 |
| 灌木转变为水域 | -0.118 | 湿地转变为农田 | -6.174 |
| 灌木转变为未利用地 | -0.014 | 湿地转变为森林 | -0.218 |
| 灌木转变为建设用地 | -0.050 | 湿地转变为灌木 | 0.000 |
| 灌木转变为湿地 | 0.001 | 湿地转变为草地 | -2.605 |
| 草地转变为农田 | 96.572 | 湿地转变为水域 | -0.960 |
| 草地转变为森林 | 313.518 | 湿地转变为雪地 | 0.000 |
| 草地转变为灌木 | 11.597 | 湿地转变为未利用地 | -0.163 |
| 草地转变为水域 | -53.660 | 湿地转变为建设用地 | -0.067 |
研究结果还发现,土地利用变化导致各省份土壤碳储量发生较大幅度的变化。其中碳储量增加较多的省份为陕西、西藏、内蒙古、甘肃及新疆,增加的范围在2.179~6.850 Tg C a-1,主要分布在西部及北部面积较大的省份。碳储量减少较多的省份为湖南、安徽、江西、河南、浙江、黑龙江、江苏及山东,数值范围在2.060~5.157 Tg C a-1。主要分布在中国东部、东北以及中南部地区(图3)。
图3
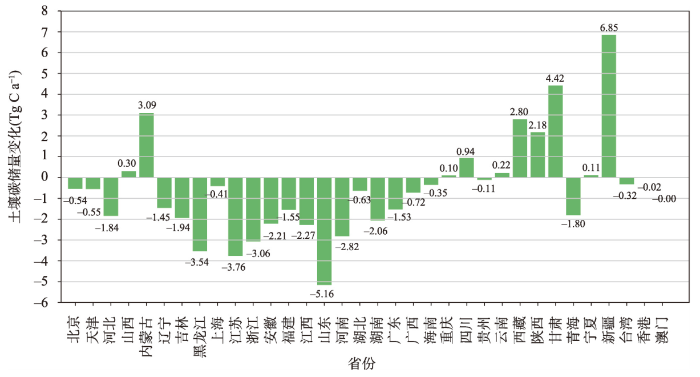
图3
2000—2020年各省区土地类型转变导致土壤碳储量的变化
Fig. 3
Changes in soil carbon storage due to land-use conversion in different provincial-level regions in China from 2000 to 2020
4 讨论
4.1 2000—2020年中国农田及草地管理土壤碳汇
本文基于30 m分辨率土地利用数据,估算2000—2020年中国农田管理土壤碳汇约为17.918 Tg C a-1,比1990—2010增加了17.1%[12]。本文结果与2000—2020年间已有研究结果接近[12,34,36]。农田生态系统土壤有机碳含量增加主要归因于秸秆还田与有机肥施用、化肥投入增加与合理的养分配比以及少(免)耕技术的推广[37⇓-39],其中,氮肥、秸秆还田和免耕可封存的碳量分别为5.96 Tg C a-1、9.76 Tg C a-1和0.80 Tg C a-1 [34]。可见,大力实施和推广秸秆还田和有机肥施用等农业管理实践和激励措施,将有助于提高中国农田土壤固碳能力[40]。另外,2000—2020年间中国草地管理土壤碳汇约为20.171 Tg C a-1,比1990—2010年中国草地管理土壤碳汇(12.4 Tg C a-1)增加了62.66%[12]。草地管理土壤碳汇最高的地区为内蒙古,这是由于该地区2000—2020年有大量低覆盖草地转化为中覆盖草地和高覆盖草地、且部分未利用地也在转变为草地而产生的结果,而西藏地区草地面积的大幅度减少仍然导致了中国草地碳储量的整体减少[4]。但中国现存大量的未利用地,为新增草地的产生提供了较大的空间。可见,中国草地具有较大的固碳潜力,在中国西部地区加强对放牧地区和行为的管控,有利于持续增加西部地区草地管理碳汇[18]。
4.2 2000—2020年中国森林管理碳汇
4.3 2000—2020年中国土壤有机碳储量
本文估算2000年和2020年中国土壤有机碳储量分别为86.074 Pg C和86.771 Pg C,与Yu等[22]、李克让等[41]、解宪丽等[42]及中国大部分土壤学家所认可的中国土壤有机碳储量约为90 Pg C[43]的研究结果接近,但也与其他一部分研究的结果有一定差异(Tang等[9]认为中国土壤碳库为74.98Pg C)。其原因可能是不同研究采用了不同的数据源、不同的算法导致的不同的研究结果[41⇓⇓⇓-45]。2000年与2020年各省份总土壤有机碳储量及土壤碳密度总排名变化不大。土壤碳密度较高的地区主要分布在中国南部及东北部地区。西部地区的省份因为行政面积较大,因此总体上土壤碳储量总量较多,但西藏地区草地的减少导致了土壤碳储量及土壤碳密度的较大程度的下降[4]。
4.4 2000—2020年中国土壤有机碳储量变化及土地利用转变土壤碳储量变化
2000—2020年土壤碳密度增加较高的省份主要分布在中国东北地区,这是由于东北地区固碳速率较高导致的[46]。中国土地利用转变释放的二氧化碳,主要由城市化过程中大量建设用地侵占了农田、林地等高碳储量用地所造成的(建设用地侵占农田排放了38.916 Tg C a-1,侵占森林排放了2.739 Tg C a-1)。但由于植树造林工程[27]及退耕还林等大型环境保护工程的实施,中国森林生态系统有较大幅度的改善,其中森林生态系统土壤碳储量增加0.434 Pg C。另外,由于大量的人口进城务工,农村劳动力及耕种人口减少[47],导致中国农田面积有所减少。根据2000—2020年土地利用分类数据统计,中国农用地总面积小幅减少了2633719.50 hm2,农田生态系统土壤碳储量减少了0.243 Pg C。2000—2020年中国草地总面积小幅减少了924922.53 hm2,草地生态系统土壤有机碳储量减少0.428 Pg C,其中西藏地区碳储量出现明显下降[4]。可见,中国的草地保护面临相对严峻的挑战。未来,中国应建立更多的草地类型的开放空间,用草地修复城市中的裸地;继续减少相关高碳汇省份的天然林的商品性采伐,在宜林荒山荒地等区域进行造林种草;增强区域保持水土、涵养水源,防风固沙的能力,改善区域的生态环境,增加区域的林地和草地碳储量[48]。且植树造林等大型环境工程所增加的碳汇可在碳排放交易中心进行配额交易[49]。
5 结论
本文基于2000年、2020年中国30 m分辨率土地利用数据、中国气候区和温度带数据,汇总近几年关于中国碳汇和碳储量的文献资料,以更加精细的空间分辨率估算了中国陆地近20年的土壤碳储量、农田、草地土壤管理碳汇及森林管理碳汇。本文的主要结论如下:
(1)本文使用中国30 m分辨率土地利用数据进行核算和分析,相对于已有研究使用的粗分辨率数据,能更好地避免空间数据的扭曲和失真[50],可以更精确地估算中国各省份碳储量及碳储量的变化,也能更好地支持县、镇一级乃至更精细尺度的碳储量的核算和分析。
(2)2000—2020年中国农田土壤管理碳汇约为17.918 Tg C a-1,草地管理土壤碳汇约为20.171 Tg C a-1,森林管理碳汇约为81.622 Tg C a-1。2000年和2020年中国土壤有机碳储量(0~100 cm)分别为86.074 Pg C和86.771 Pg C。2000—2020年中国土壤有机碳储量(0~100 cm)增加约34.850 Tg C a-1,碳密度增加约0.723 t C hm-2,土地利用转变导致土壤碳储量减少约17.621 Tg C a-1。
(3)目前中国农田、森林、草地仍然具有较大的固碳潜力。但相对来说,草地的保护形势相对较为严峻。因此,宜在草地丰富的地区继续加强对放牧的管控,在城市地区建立更多的草地类型的开放空间,用草地修复城市中的裸地,以促进中国草地碳汇的增加。对于林地来说,在宜林地区进行造林种草,对现有森林实施有效管理战略和扩大造林,能有效地增加中国土壤有机碳储量。对于农田来说,继续推广秸秆还田、有机肥施用、以及少(免)耕技术可以有效加强农田土壤的固碳能力。
本文对中国及各省区2000—2020年土壤碳储量、碳汇以及土地管理碳汇进行了核算和分析,研究结果有利于帮助管理者从整体上把握中国陆地土壤碳储量和土地管理碳汇的现状和变化趋势,有望为中国“双碳”目标的实现提供方法和数据的支持。
参考文献
Contribution of terrestrial carbon sink to future warming in China, the United States, Russia and Canada
DOI:10.11821/dlxb202101013
[本文引用: 1]

As a major climate forcing factor, CO2 is closely related to human activities, but many studies have overlooked the carbon absorption of terrestrial ecosystem to anthropogenic carbon emissions. China, the United States, Russia and Canada are the four countries with the largest area in the world at different socio-economic development stages. Quantifying the global radiative forcing contribution of CO2 emissions is important for assessing the climate effects of human and natural factors. Based on CO2 assimilation data, this study used a "carbon-climate" parameterization scheme to analyze the anthropogenic carbon emissions and its climatic effects while considering the climate effects of carbon sinks of terrestrial ecosystem. Then we obtained the net global radiative forcing contributions of the four countries. The results showed that the anthropogenic emissions of CO2 in all the four countries showed a significant increase (0.125 Pg C a -1). Meanwhile the carbon uptake of terrestrial ecosystems increased at a growth rate of 0.003 Pg C a -1. During the study period, the total anthropogenic carbon emissions of China and the United States accounted for 87.19% of the four countries while Russian terrestrial ecosystems had the strongest carbon absorption capacity, 14.69 Pg C. Correspondingly, as of 2016, the cooling effect of terrestrial ecosystems is -0.013 W m -2, which can offset 45.06% of the whole warming effects of anthropogenic carbon emissions, indicating that if the terrestrial ecosystems are not considered, the warming effect of anthropogenic carbon emissions will be significantly overestimated. Overall, the total anthropogenic carbon emissions of the four countries contributed 0.32 and 0.42 W m -2 of global radiative forcing, respectively, relative to the CO2 concentration levels before 2000 (initial year of this study) and before the Industrial Revolution. This study further explored the linear relationship between air temperature and radiative forcing. Compared with a single climate effect of anthropogenic or natural carbon emissions, the combined radiation forcing and the temperature change in the corresponding period had the highest consistency (30.3%).
中美俄加陆域碳汇对人为增温的消减贡献
DOI:10.11821/dlxb202101013
[本文引用: 1]
作为主要的气候强迫因子,CO<sub>2</sub>与人类活动密切相关,但很多研究往往忽视了陆地生态系统碳汇对人为排放CO<sub>2</sub>增温的消减作用。俄罗斯、加拿大、中国和美国是世界上地域面积最大、且社会经济处于不同发展阶段的4个国家,将短时期内CO<sub>2</sub>排放所引起的辐射强迫进行量化分析,对于评估人为和自然因素对气候的影响非常重要。本文基于CO<sub>2</sub>同化数据,利用“碳—气候”参数化方案,在分析人为碳排放及其气候效应的同时,考虑陆地生态系统碳汇的气候效应,进而得到4个国家的全球辐射强迫。结果显示:① 2000—2016年,4个国家人为排放的CO<sub>2</sub>均呈明显增加趋势(0.125 Pg C a <sup>-1</sup>),但陆地生态系统的碳汇作用也不断增强(0.003 Pg C a <sup>-1</sup>);其中,中美两国总的人为碳排放占了4个国家的87.19%,而俄罗斯陆地生态系统的吸收碳能力最强,总量达14.69 Pg C。② 截至2016年,陆地生态系统的降温效应达-0.013 W m <sup>-2</sup>,可消减人为碳排放增温效应的45.06%。充分说明若不考虑陆地生态系统,将会明显高估人为碳排放的增温效应。③ 整体上,相对于2000年和工业革命前的CO<sub>2</sub>浓度水平,4个国家总的人为碳排放分别贡献了0.32 W m <sup>-2</sup>和0.42 W m <sup>-2</sup>的全球辐射强迫。本文还进一步探讨了温度与辐射强迫的线性关系,相对于单一的人为或者自然因素而言,综合两者的辐射强迫,与相应时段的气温变化可解释度最高,达30.3%。
Identifying the key factors influencing Chinese carbon intensity using machine learning, the random forest algorithm, and evolutionary analysis
DOI:10.11821/dlxb201912012
[本文引用: 1]
As the Chinese government ratified the Paris Climate Agreement in 2016, the goal of reducing carbon dioxide emissions per unit of gross domestic product (carbon intensity) from 60% to 65% of 2005 levels must now be achieved by 2030. However, as numerous factors influence Chinese carbon intensity, it is key to assess their relative importance in order to determine which are most important. As traditional methods are inadequate for identifying key factors from a range acting simultaneously, machine learning is applied in this research. The random forest (RF) algorithm based on decision tree theory was proposed by Breiman (2001); this algorithm is one of the most appropriate because it is insensitive to multicollinearity, robust to missing and unbalanced data, and provides reasonable predictive results. We therefore identified the key factors influencing Chinese carbon intensity using the RF algorithm and analyzed their evolution between 1980 and 2014. The results of this analysis reveal that dominant factors include the scale and proportion of energy-intensive industries as well as fossil energy proportion and technical progress between 1980 and 1991. As the Chinese economy developed rapidly between 1992 and 2007, effects on carbon intensity were enhanced by service industry proportion and the fossil fuel price such that the influence of traditional residential consumption also increased. The Chinese economy then entered a period of deep structural adjustment subsequent to the 2008 global financial crisis; energy-saving emission reductions were greatly enhanced over this period and effects on carbon intensity were also rapidly boosted by the increasing availability of new energy and its residential consumption. Optimization of energy and industrial structures, promotion of technical progress, green consumption, and the reduction and management of emissions will be key to cutting future carbon intensity levels within China. These approaches will all help to achieve the 2030 goal of reducing carbon emission intensity from 60% to 65% of 2005 levels.
中国碳强度关键影响因子的机器学习识别及其演进
DOI:10.11821/dlxb201912012
[本文引用: 1]
碳强度影响因子数量众多,通过在众多因子中评估其重要性以识别出关键影响因子进而解析碳强度关键因子的变化规律,是中国2030年碳强度能否实现比2005年下降60%~65%目标的科学基础。传统的回归分析方法对于评估众多因子的重要性存在多重共线性等问题,而机器学习处理海量数据则具有较好的稳健性等优点。本文从能源结构、产业结构、技术进步和居民消费等方面选取了56个中国碳强度影响因子指标,采用随机森林算法基于信息熵评估了1980-2014年逐年各项因子的重要性,通过指标数量与信息熵的对应关系统一筛选出每年重要性最大的前22个指标作为相应年度关键影响因子,最终依据关键影响因子的变化趋势划分了3个阶段作了演进分析。结果发现:1980-1991年,碳强度的关键因子主要以高耗能产业规模及占比、化石能源占比和技术进步为主;1992-2007年,中国经济进入快车道增长时期,服务业占比和化石能源价格对碳强度的影响作用开始显现,居民传统消费的影响作用在增大;2008年全球金融危机后,中国进入经济结构深化调整时期,节能减排力度大大增强,新能源占比和居民新兴消费的影响作用迅速显现。为实现2030年碳强度下降60%~65%目标,优化能源结构和产业结构,促进技术进步,提倡绿色消费,强化政策调控是未来需要采取的主要措施。
Effect of "Ecological Province" construction on carbon emission reduction in China
DOI:10.11821/dlxb202011012
[本文引用: 1]
To explore the holistic governance of ecological environmental protection, China has started up a pilot project of "Ecological Province" construction since 1999. This is an important measure taken by the Chinese government to improve the ecological environment. Does this project affect carbon emissions? Answering this question can help us learn about the true effects of the "Ecological Province" construction project. Based on the provincial-level panel data from 2000 to 2015 in China, this paper focuses on exploring the effects using the methods of the quasi-natural experiment and counterfactual test. Moreover, this study tries to test the robustness of the effects using the methods of multi-stage DID model, propensity score matching-difference in difference model (PSM-DID model). The results show that: (1) "Ecological Province" construction project has a significant and robust effect on carbon emission reduction. (2) Its mechanism depends on several channels, including impeding the economic growth, protecting ecological environment and adjusting the industrial structure. (3) Nevertheless, there still exist some problems such as the regional disparity of implementing the project, the backward development of ecological industry and the lack of ecological innovation and technological progress. This study can provide a scientific basis for popularizing the experience of "Ecological Province" construction and promoting its effect on carbon emission reduction.
生态省建设的碳减排效应研究
DOI:10.11821/dlxb202011012
[本文引用: 1]
自1999年以来,中国开始生态省建设试点,探索加强生态环境整体性治理之路。生态省建设作为国家改善生态环境的重大举措,是否对二氧化碳排放产生影响是一个值得深入研究的问题。本文利用2000—2015年中国省级面板数据,采用准自然实验方法,构建双重差分模型,考察和评估了生态省建设的碳减排效应。研究发现:生态省建设不仅可以提高生态环境治理质量,而且具有显著且稳健的碳减排效应;生态省建设的碳减排作用主要是通过经济阻碍效应、生态保护效应及产业结构效应实现;生态省建设虽然对减少碳排放取得一定的成效,但依然存在区域建设不平衡,生态产业发展落后,生态创新、技术进步乏力等有待解决的问题。本文可为更好地推广生态省建设经验、提高生态省建设的碳减排效应提供科学依据。
Terrestrial carbon sinks in China and around the world and their contribution to carbon neutrality
中国及全球陆地生态系统碳源汇特征及其对碳中和的贡献
Carbon storage in China's terrestrial ecosystems: A synthesis
It is important to accurately estimate terrestrial ecosystem carbon (C) storage. However, the spatial patterns of C storage and the driving factors remain unclear, owing to lack of data. Here, we collected data from literature published between 2004 and 2014 on C storage in China's terrestrial ecosystems, to explore variation in C storage across different ecosystems and evaluate factors that influence them. We estimated that total C storage was 99.15 +/- 8.71 PgC, with 14.60 +/- 3.24 PgC in vegetation C (Veg-C) and 84.55 +/- 8.09 PgC in soil organic C (SOC) storage. Furthermore, C storage in forest, grassland, wetland, shrub, and cropland ecosystems (excluding vegetation) was 34.08 +/- 5.43, 25.69 +/- 4.71, 3.62 +/- 0.80, 7.42 +/- 1.92, and 15.17 +/- 2.20 PgC, respectively. In addition to soil nutrients and texture, climate was the main factor regulating the spatial patterns of C storage. Climate influenced the spatial patterns of Veg-C and SOC density via different approaches, Veg-C was mainly positively influenced by mean annual precipitation (MAP), whereas SOC was negatively dependent on mean annual temperature (MAT). This systematic estimate of C storage in China provides new insights about how climate constrains C sequestration, demonstrating the contrasting effects of MAP and MAT on Veg-C and SOC; thus, these parameters should be incorporated into future land management and C sequestration strategies.
Changes of soil organic carbon storage in Chinese terrestrial ecosystems from the 1980s to the 2010s
DOI:10.11821/dlxb201811008
[本文引用: 4]
<p>Soils store a large amount of the terrestrial ecosystem carbon (C) and play an important role in maintaining global C balance. However, very few studies have addressed the regional patterns of soil organic carbon (SOC) storage and the main factors influencing its changes in Chinese terrestrial ecosystems, especially using field measured data. In this study, we collected information on SOC storage in the main types of ecosystems (forest, grassland, cropland, and wetland) across 18 regions of China during the 1980s (from the Second National Soil Survey of China, SNSSC) and the 2010s (from studies published between 2004 and 2014), and evaluated whether trends changed over the 30-year period. The SOC storage (0-100 cm) in China was 83.46±11.89 Pg C in the 1980s and 86.50±8.71 Pg C in the 2010s, and the net increase over 30 years was 3.04±1.65 Pg C, with a rate of 0.101±0.055 Pg C yr<sup>-1</sup>. This increase was mainly observed in the topsoil (0-20 cm). Forest, grassland, and cropland SOC storage increased by 2.52±0.77, 0.40±0.78, and 0.07±0.31 Pg C, respectively, which can be attributed to the several ecological restoration projects and agricultural practices implemented. On the other hand, SOC storage in wetlands declined by 0.76±0.29 Pg C, most likely due to the decrease in wetland area and SOC density. These results, combined with those of vegetation C sink (0.100 Pg C yr<sup>-1</sup>), show that the net C sink in Chinese terrestrial ecosystems was about 0.201±0.061 Pg C yr<sup>-1</sup>, which offsets 14.85%-27.79% of the C emissions from fossil fuels from the 1980s to the 2010s. These estimates of soil C sink based on field measured data supported the premise that China's terrestrial ecosystems have a large C sequestration potential, and further emphasized the importance of forest protection and reforestation to increase SOC storage capacity.</p>
1980—2010中国陆地生态系统土壤碳储量的变化
DOI:10.11821/dlxb201811008
[本文引用: 4]
土壤作为陆地生态系统有机碳库的主体,在全球碳循环中起着重要作用。然而,当前区域土壤有机碳储量的变化情况及其碳源/汇功能仍然不清楚。利用中国1980s (1979-1985年)第二次土壤普查数据,同时收集整理2010s(2004-2014年)已发表的有关中国土壤有机碳储量(0~20 cm和0~100 cm)的文献数据,综合评估了1980s-2010s中国土壤有机碳储量的变化情况,并分析森林、草地、农田和湿地等生态系统土壤碳源/汇功能;同时结合现有的中国植被碳储量变化研究,进一步探讨了1980s-2010s中国陆地生态系统的碳源/汇效应。研究发现:① 1980s-2010s中国土壤(0~100 cm)有机碳储量净增长3.04±1.65 Pg C,增长速率为0.101±0.055 Pg C yr<sup>-1</sup>,其中表层土壤(0~20 cm)的碳汇效应明显;② 森林土壤是固碳主体,净增长2.52±0.77 Pg C,而草地和农田土壤增长有限,分别为0.40±0.78和0.07±0.31 Pg C;③ 湿地有机碳储量净减少0.76±0.29 Pg C;④ 中国陆地生态系统的碳汇效应较强,总碳汇量相当于同期(1980-2009年)化石燃料和水泥生产排放CO<sub>2</sub>总量的14.85%~27.79%。随着中国森林和草地生态系统植被和土壤的进一步保护、恢复和重建,中国陆地生态系统具有较大的碳汇潜力,在未来全球碳平衡中将发挥更大的作用。
Soil carbon pools and world life zones
DOI:10.1038/298156a0 [本文引用: 1]
Analysis on spatial distribution characteristics of soil organic carbon reservoir in China
DOI:10.11821/xb200005003
[本文引用: 1]
The paper respectively adopted physiochemical properties of every soil stratum from<sup>2</sup> 473 soil profiles of the second soil survey. The corresponding carbon content of soil is estimated by utilizing conversion coefficient 0 58. First, we calculated the carbon content of every stratum of different soil stirp in the same soil subtype. Then, we took soil stratum depth as weight coefficient to acquire the average physiochemical properties of various kinds of soil stirp. Finally, we got the average depth, organic content, duck density and carbon density of different soil subtypes through area averaging. The total carbon quantity of different kinds of soil can be calculated by the following expression: C j=0 58S jH jO W j where j is the soil type, C j is the carbon storage of j soil type, S j is the distribution area of j soil type, H j is the average depth of j soil type, O j is the average organic content of j soil type, and W j is the average bulk density of j soil type. In the second soil survey, the total amount of soil organic carbon is about 924 18?10 8 t and carbon density is about 10 53 kgC/m<sup>2</sup> in China according to the statistic country area 877 63?10<sup>6</sup>hm<sup>2</sup>. The spatial distribution characteristics of soil organic carbon in China are that the carbon storage increases with the increase of latitude in eastern China and the carbon storage decreases with the decrease of longitude in northern China. There is a transition zone where carbon storage varies greatly in China. Moreover, there is an increasing tendency of carbon density with the decrease of latitude in western China. Soil circle has implications on global change, but the difference in soil spatial distribution is substantial in China. Because the structure of soil is inhomogeneous, mistakes will be resulted in estimating soil carbon reservoir. It is thus necessary to farther resolve soil respiration, organic matter conversion and others related problems, and build uniform and normal methods of measurment and sampling.
中国土壤有机碳库及空间分布特征分析
DOI:10.11821/xb200005003
[本文引用: 1]
土壤有机碳库是陆地碳库的主要组成部分,在陆地碳循环研究中有着重要的作用。根据中国第二次土壤普查实测2473个典型土壤剖面的理化性质,以及土壤各类型分布面积,估算中国土壤有机碳库的储量约为924.18×10⁸t,平均碳密度为10.53kg/m<sup>2</sup>,表明中国土壤是一个巨大的碳库。其空间分布总体规律上表现为:东部地区大致是随纬度的增加而递增,北部地区呈现随经度减小而递减的趋势,西部地区则呈现随纬度减小而增加的趋势。
Carbon pools in China's terrestrial ecosystems: New estimates based on an intensive field survey
DOI:10.1073/pnas.1700291115
PMID:29666314
[本文引用: 2]
China's terrestrial ecosystems have functioned as important carbon sinks. However, previous estimates of carbon budgets have included large uncertainties owing to the limitations of sample size, multiple data sources, and inconsistent methodologies. In this study, we conducted an intensive field campaign involving 14,371 field plots to investigate all sectors of carbon stocks in China's forests, shrublands, grasslands, and croplands to better estimate the regional and national carbon pools and to explore the biogeographical patterns and potential drivers of these pools. The total carbon pool in these four ecosystems was 79.24 ± 2.42 Pg C, of which 82.9% was stored in soil (to a depth of 1 m), 16.5% in biomass, and 0.60% in litter. Forests, shrublands, grasslands, and croplands contained 30.83 ± 1.57 Pg C, 6.69 ± 0.32 Pg C, 25.40 ± 1.49 Pg C, and 16.32 ± 0.41 Pg C, respectively. When all terrestrial ecosystems are taken into account, the country's total carbon pool is 89.27 ± 1.05 Pg C. The carbon density of the forests, shrublands, and grasslands exhibited a strong correlation with climate: it decreased with increasing temperature but increased with increasing precipitation. Our analysis also suggests a significant sequestration potential of 1.9-3.4 Pg C in forest biomass in the next 10-20 years assuming no removals, mainly because of forest growth. Our results update the estimates of carbon pools in China's terrestrial ecosystems based on direct field measurements, and these estimates are essential to the validation and parameterization of carbon models in China and globally.
Carbon accounting for land use, land-use change and forestry in Guangdong province
DOI:10.11821/dlxb202303009
[本文引用: 2]
Land use, land-use change, and forestry, also known as LULUCF, are significant sources and sinks of carbon. A high-precision carbon accounting system for LULUCF should always be established as the primary building block for advancing low-carbon land use and sophisticated land management. This study uses the stock-difference method to account for carbon sources and sinks brought by LULUCF at the plot scale in Guangdong. According to the carbon accounting based on the surveys on soil, land use, and forest resources, Guangdong's LULUCF produced 29.673 million tons of carbon sinks in 2018, of which the biomass carbon sink contributed approximately 70% and the soil carbon sink around 30%. The major ways to increase LULUCF carbon sinks, therefore, are to increase plant cover and improve forest management. Different areas within the same land-use type have various carbon accounting values. Even within particular land-use types, such as forestland, wetland, cropland, settlements, and grassland, the carbon accounting values may fluctuate between being recognized as carbon sources and carbon sinks. In the era of reaching carbon peaking and carbon neutrality goals, it is difficult to meet the land-use management requirements with a carbon accounting technique assuming the carbon emission coefficient of every land-use type is constant. The carbon accounting of LULUCF in this study takes annual fluctuations in biomass and soil organic carbon pools into account, which complies with the United Nations Framework Convention on Climate Change criteria and is applicable on a national level in China. Meanwhile, the vegetation allometric growth model and the differentiation map of annual fluctuations of the soil carbon pool resulting from this study can be utilized to enable multi-scenario analyses of the carbon sources or sinks of lands at the plot scale. Finally, the results of the LULUCF carbon accounting offer some support for policymaking that emphasizes decreasing carbon sources and increasing carbon sinks in the management of land use and natural resources.
广东省土地利用及其变化和林业碳核算研究
DOI:10.11821/dlxb202303009
[本文引用: 2]
土地利用及其变化和林业(LULUCF)是重要的碳源和碳汇,探索建立高精度的LULUCF碳核算体系是推动土地低碳利用和精细管理的关键基础。本文以广东省为例,采用库—差别法,基于森林资源二类调查、土壤普查、土地利用等数据,在地块尺度上系统核算了因LULUCF产生的碳源和碳汇。研究表明,2018年广东省LULUCF碳汇为2967.3万t CO<sub>2</sub> a<sup>-1</sup>,其中生物量碳汇约占70%,土壤碳汇约占30%,提升土地植被盖度和加强林木经营是增加LULUCF碳汇最主要手段。相同地类不同地块的碳源或碳汇强度差异较大,林地、湿地、耕地、建设用地、草地等地类均可能出现跨碳源和碳汇类别的差异。土地利用“碳排放系数”为常数的碳核算方法难以满足“双碳”目标下土地利用的精细管理需要。本文提出的LULUCF碳核算综合了生物量及土壤碳库的变化,满足履行《联合国气候变化框架公约》要求,在全国范围具有适用性,植被异速生长模型和土壤碳库年度变化分异图可支撑地块尺度土地利用碳源或碳汇多情景分析,其核算结果可为土地利用和自然资源管理的低碳增汇政策制定提供参考。
Global carbon budget 2020
DOI:10.5194/essd-12-3269-2020
URL
[本文引用: 1]
. Accurate assessment of anthropogenic carbon dioxide (CO2) emissions and\ntheir redistribution among the atmosphere, ocean, and terrestrial biosphere\nin a changing climate – the “global carbon budget” – is important to\nbetter understand the global carbon cycle, support the development of\nclimate policies, and project future climate change. Here we describe and\nsynthesize data sets and methodology to quantify the five major components\nof the global carbon budget and their uncertainties. Fossil CO2\nemissions (EFOS) are based on energy statistics and cement production\ndata, while emissions from land-use change (ELUC), mainly\ndeforestation, are based on land use and land-use change data and\nbookkeeping models. Atmospheric CO2 concentration is measured directly\nand its growth rate (GATM) is computed from the annual changes in\nconcentration. The ocean CO2 sink (SOCEAN) and terrestrial\nCO2 sink (SLAND) are estimated with global process models\nconstrained by observations. The resulting carbon budget imbalance\n(BIM), the difference between the estimated total emissions and the\nestimated changes in the atmosphere, ocean, and terrestrial biosphere, is a\nmeasure of imperfect data and understanding of the contemporary carbon\ncycle. All uncertainties are reported as ±1σ. For the last\ndecade available (2010–2019), EFOS was 9.6 ± 0.5 GtC yr−1 excluding the cement carbonation sink (9.4 ± 0.5 GtC yr−1 when the cement carbonation sink is included), and\nELUC was 1.6 ± 0.7 GtC yr−1. For the same decade, GATM was 5.1 ± 0.02 GtC yr−1 (2.4 ± 0.01 ppm yr−1), SOCEAN 2.5 ± 0.6 GtC yr−1, and SLAND 3.4 ± 0.9 GtC yr−1, with a budget\nimbalance BIM of −0.1 GtC yr−1 indicating a near balance between\nestimated sources and sinks over the last decade. For the year 2019 alone, the\ngrowth in EFOS was only about 0.1 % with fossil emissions increasing\nto 9.9 ± 0.5 GtC yr−1 excluding the cement carbonation sink (9.7 ± 0.5 GtC yr−1 when cement carbonation sink is included), and ELUC was 1.8 ± 0.7 GtC yr−1, for total anthropogenic CO2 emissions of 11.5 ± 0.9 GtC yr−1 (42.2 ± 3.3 GtCO2). Also for 2019, GATM was\n5.4 ± 0.2 GtC yr−1 (2.5 ± 0.1 ppm yr−1), SOCEAN\nwas 2.6 ± 0.6 GtC yr−1, and SLAND was 3.1 ± 1.2 GtC yr−1, with a BIM of 0.3 GtC. The global atmospheric CO2\nconcentration reached 409.85 ± 0.1 ppm averaged over 2019. Preliminary\ndata for 2020, accounting for the COVID-19-induced changes in emissions,\nsuggest a decrease in EFOS relative to 2019 of about −7 % (median\nestimate) based on individual estimates from four studies of −6 %, −7 %,\n−7 % (−3 % to −11 %), and −13 %. Overall, the mean and trend in the\ncomponents of the global carbon budget are consistently estimated over the\nperiod 1959–2019, but discrepancies of up to 1 GtC yr−1 persist for the\nrepresentation of semi-decadal variability in CO2 fluxes. Comparison of\nestimates from diverse approaches and observations shows (1) no consensus\nin the mean and trend in land-use change emissions over the last decade, (2)\na persistent low agreement between the different methods on the magnitude of\nthe land CO2 flux in the northern extra-tropics, and (3) an apparent\ndiscrepancy between the different methods for the ocean sink outside the\ntropics, particularly in the Southern Ocean. This living data update\ndocuments changes in the methods and data sets used in this new global\ncarbon budget and the progress in understanding of the global carbon cycle\ncompared with previous publications of this data set (Friedlingstein et al.,\n2019; Le Quéré et al., 2018b, a, 2016, 2015b, a, 2014,\n2013). The data presented in this work are available at https://doi.org/10.18160/gcp-2020 (Friedlingstein et al., 2020).\n
Carbon emissions from land-use change and management in China between 1990 and 2010
Overall land-use change and management have contributed about 1.45 Pg of carbon to the total carbon released in China from 1990 to 2010.
Estimate of carbon sequestration under cropland management in China
DOI:10.3864/j.issn.0578-1752.2008.03.014
[本文引用: 3]
【Objective】For a long time, largely conventional tillage and burning straw cause much losses of Soil Organica Matter(SOM), which makes cropland be an emission source of Greenhouse Gas(GHG). In recent years, with no-tillage and straw returning being extended largely, as well as extensively using cropland management such as fertilizing and irrigating, organic carbon in cropland is rising again. It is supposed that cropland will be an important sink of GHG. By analyzing the change of soil organic carbon(SOC) under cropland management, carbon sequestration by cropland management in China was estimated and the character of carbon sink under cropland management in China was pointed.【Method】By reviewing lots of references and analyzing the change of SOC under cropland management in long-term experiment, we conceived cropland management scenarios. Meantime, according the areas partitioned by farming system in China, the quantity of carbon sink under cropland management was estimated and compared with the result of IPCC good practice guidance (GPG) Tier 2. Last, we used meta-analysis to estimate carbon sequestration by croplang management in China. 【Result】The total Chinese cropland carbon sink is 16.8~115.6Tg/a. It is different that SOC is influenced under different management in different area. Relationship between the annual ratio of SOC and original value in types of cropland management was analyzed. Both of them have distinct negative correlation. Saturation value of SOC is different under different managements.【Conclusion】The best management that increases SOC is using fertilizer and manure together. Next is straw returning, using manure and no-tillage. The last is using fertilizer, which even decreases the SOC. Last, We pointed the character of carbon sink under cropland management in China. Comparing with others, carbon sequestration of no-tillage, straw returning and using fertilizer and manure together is more.
中国农田管理土壤碳汇估算
Projected changes in soil organic carbon stocks of China's croplands under different agricultural managements, 2011-2050
DOI:10.1016/j.agee.2013.06.008 URL [本文引用: 2]
Imbalance of inter-provincial forest carbon sequestration rate (2010-2060) in China and its regulation strategy
DOI:10.11821/dlxb202207016
[本文引用: 2]
Forest ecosystem, as a predominant component of terrestrial ecosystem carbon sinks, has a high potential for carbon sequestration. Accurate estimation of the carbon sequestration rate in forest ecosystems at provincial level is a prerequisite and foundation for scientifically formulating the technical approaches of carbon neutrality and associated regulatory policies. However, research on future carbon sequestration rates (CSRs) for forest ecosystems for provincial-level regions (hereafter province) in China has rarely been reported. This paper quantitatively assesses the carbon sequestration rates of existing forest ecosystems of all the provinces from 2010 to 2060 using the Forest Carbon Sequestration model (FCS), in combination with large quantities of measured data in China under three future climate scenarios (RCP2.6, RCP4.5, and RCP8.5). Results showed that CSRs across provinces varied from 0.01Tg C/a to 36.74 Tg C/a, with a mean of (10.09±0.43) Tg C/a. There are apparent inter-provincial differences in view of forest CSRs. In terms of the spatial variations in CSRs on unit area basis within provinces, the eastern region has larger capacity to sequestration than the western region, while the western region has greater CSR per unit GDP and per capita. Moreover, there are significant negative correlations between the CSRs per capita in each province and the corresponding GDP per capita, under an assumption that GDP per capita is constant across provinces. In summary, there is a significant regional imbalance of the CSR among provinces, and major technical and policy changes are needed to realize their carbon sink potential sustainably. In view of the overlap between China's poor areas and high ecological carbon sink areas, it is indicated that the existing policies to support the traditional carbon trading are far from sufficient. It is urgent to take China's regulatory measures such as "regional carbon compensation" in line with the Chinese characteristics, so that people in western or underdeveloped regions can voluntarily/consciously strengthen forest protection and enhance forest carbon sinks on the basis of ensuring coordinated regional development, thus China's forests can play a greater role in carbon neutrality strategies.
2010—2060年中国森林生态系统固碳速率省际不平衡性及调控策略
DOI:10.11821/dlxb202207016
[本文引用: 2]
森林生态系统具有很高的固碳潜力,是陆地碳汇的主体。准确估算各省(自治区)森林生态系统固碳速率,是科学制定碳中和技术路线及相应调控政策的重要依据。然而,目前有关中国不同省份森林生态系统未来固碳潜力的研究非常罕见。利用中国森林生态系统固碳模型(FCS)并结合3种未来气候情景(RCP2.6、RCP4.5和RCP8.5),定量评估了2010—2060年间各省现存森林生态系统的固碳速率。研究发现:中国区域内各省的森林生态系统固碳速率介于0.01~36.74 Tg C/a,平均值为(10.09±0.43) Tg C/a。省际间森林固碳速率存在非常大的差异,其中东部地区各省的单位面积固碳速率大于西部地区;但考虑到单位GDP固碳速率和人均固碳速率后则表现为西部地区明显更大。此外,各省人均碳固存速率与其人均GDP之间存在显著负相关关系。因此,省际间森林生态系统固碳速率存在明显的区域不均衡性,要真正地持续实现其碳汇潜力需要在技术和政策层面做出重大调整。结合中国贫困区与高生态碳汇区的重叠,不能仅仅依靠传统碳贸易,亟需研究制定符合中国特色的“区域碳补偿”措施,在保障区域协调发展的基础上使西部或不发达地区民众能自愿/自觉加强对森林的保护、保持甚至提升森林碳汇,使森林在实现碳中和战略中发挥更大作用。
Climate change, human impacts, and carbon sequestration in China
DOI:10.1073/pnas.1700304115 PMID:29666313 [本文引用: 1]
The global potential for increased storage of carbon on land
Despite increased interest in land-based carbon storage as a climate solution, there are physical limits on how much additional carbon can be incorporated into terrestrial ecosystems. To effectively determine where and how to act, jurisdictions need robust data illustrating the magnitude and distribution of opportunities to increase carbon storage, as well as information on the actions available to achieve that storage. Here, we provide globally consistent maps for directing additional carbon storage under current and future climate, as well as a framework for determining how that storage could be gained through restoration, improved management, or maintenance of woody biomass and soil organic matter. Our estimates provide an upper bound on how improved land stewardship can mitigate the climate crisis.
Differential effects of conservational management on SOC accumulation in the grasslands of China
The carbon sequestration potential of China's grasslands
With the consequences of anthropogenic activities such as overgrazing and cropland expansion, grasslands in China suffer severe degradation since the 1980s. The national grassland restoration policy enacted at the beginning of the 21th century has the potential to increase plant growth and productivity and hence regional carbon (C) sequestration. Here, we assessed plant and soil organic C (SOC) stocks for both degraded and restored/non‐degraded plots at 802 sites in Northern and Northwest China using pairwise field sampling and quantified the C sequestration potential (CSP) of China's grasslands. A geostatistical model was performed to upscale the field measurements to national scale. Averaged across the 802 paired grassland sites, the mean plant biomass C and SOC density in the top 1 m depth were 0.44 ± 0.17 and 8.82 ± 1.78 kg C/m2, respectively. Compared to the degraded grasslands, the restored grasslands had an average of 0.11 ± 0.17 (29.2%) and 1.02 ± 1.28 kg C/m2 (12.3%) greater plant biomass C and SOC density, respectively. The geostatistical model produced a total CSP of 17.3 ± 2.3 Pg C in China's grasslands, with 94% in soils. If the CSP estimated in this study could be achieved, the current grassland SOC stock would increase by 61%, offsetting 11 yr (2000–2010) of national fossil CO2 emissions.
A large and persistent carbon sink in the world's forests
DOI:10.1126/science.1201609
PMID:21764754
[本文引用: 2]
The terrestrial carbon sink has been large in recent decades, but its size and location remain uncertain. Using forest inventory data and long-term ecosystem carbon studies, we estimate a total forest sink of 2.4 ± 0.4 petagrams of carbon per year (Pg C year(-1)) globally for 1990 to 2007. We also estimate a source of 1.3 ± 0.7 Pg C year(-1) from tropical land-use change, consisting of a gross tropical deforestation emission of 2.9 ± 0.5 Pg C year(-1) partially compensated by a carbon sink in tropical forest regrowth of 1.6 ± 0.5 Pg C year(-1). Together, the fluxes comprise a net global forest sink of 1.1 ± 0.8 Pg C year(-1), with tropical estimates having the largest uncertainties. Our total forest sink estimate is equivalent in magnitude to the terrestrial sink deduced from fossil fuel emissions and land-use change sources minus ocean and atmospheric sinks.
The carbon balance of terrestrial ecosystems in China
DOI:10.1038/nature07944 [本文引用: 2]
Regional patterns of soil organic carbon stocks in China
Soil organic carbon (SOC) is of great importance in the global carbon cycle. Distribution patterns of SOC in various regions of China constitute a nation-wide baseline for studies on soil carbon changes. This paper presents an integrated and multi-level study on SOC stock patterns of China, and presents baseline SOC stock estimates by great administrative regions, river watersheds, soil type regions and ecosystem. The assignment is done by means of a recently completed 1: 1,000,000 scale soil database of China, which is the most detailed and reliable one in China at the present time. SOC densities of 7292 soil profiles collected across China in the middle of the 1980s were calculated and then linked to corresponding polygons in a digital soil map, resulting in a SOC Density Map of China on a 1: 1,000,000 scale, and a 1 km x 1 km grid map. Corresponding maps of administrative regions, river watersheds, soil types (ST), and ecosystems in China were also prepared with an identical resolution and coordinate control points, allowing GIS analyses. Results show that soils in China cover an area of 9.281 x 10(6)km(2) in total, with a total SOC stock of 89.14 Pg (1 Pg=10(15)g) and a mean SOC density of 96.0 t C/ha. Confidence limits of the SOC stock and density in China are estimated as [89.23 Pg, 89.08 Pg] and [96.143 t C/ha, 95.981 t C/ha] at 95% probability, respectively. The largest total SOC stock (23.60 Pg) is found in South-west China while the highest mean SOC density (181.9 t C/ha) is found in north-east China. The total SOC stock and the mean SOC density in the Yangtze river watershed are 21.05 Pg and 120.0 t C/ha, respectively, while the corresponding figures in the Yellow river watershed are 8.46 Pg and 104.3 t C/ha, respectively. The highest total SOC stocks are found in Inceptisols (34.39 Pg) with SOC density of 102.8 t C/ha. The lowest and highest mean SOC densities are found on Entisols (28.1 t C/ha), and on Histosols (994.728.1 t C/ha), respectively. Finally, the total SOC stock in shrub and forest ecosystem classes are 25.55 and 21.50 Pg, respectively; the highest mean SOC density (209.9 t C/ha) was recorded in the wetland ecosystem class and the lowest (29.0 t C/ha) in the desert ecosystem class. Among five forest ecosystem types, Evergreen conifer forest stores the highest SOC stock (6.81 Pg), and Deciduous conifer forest shows the highest SOC density (225.9 t C/ha). Figures of SOC stocks stratified by Administrative regions, river watersheds, soil types and ecosystem types presented in the study may constitute national-wide baseline for studies of SOC stock changes in various regions in the future.
Perspectives on studies on soil carbon stocks and the carbon sequestration potential of China
DOI:10.1007/s11434-011-4693-7 URL [本文引用: 1]
Land-use changes lead to a decrease in carbon storage in arid region, China
Modeling changes in China's 2000-2030 carbon stock caused by land use change
Land use, total carbon emissions change and low carbon land management in coastal Jiangsu, China
DOI:10.1016/j.jclepro.2014.03.046 URL [本文引用: 2]
Effects of national ecological restoration projects on carbon sequestration in China from 2001 to 2010
DOI:10.1073/pnas.1700294115
PMID:29666317
[本文引用: 2]
The long-term stressful utilization of forests and grasslands has led to ecosystem degradation and C loss. Since the late 1970s China has launched six key national ecological restoration projects to protect its environment and restore degraded ecosystems. Here, we conducted a large-scale field investigation and a literature survey of biomass and soil C in China's forest, shrubland, and grassland ecosystems across the regions where the six projects were implemented (∼16% of the country's land area). We investigated the changes in the C stocks of these ecosystems to evaluate the contributions of the projects to the country's C sink between 2001 and 2010. Over this decade, we estimated that the total annual C sink in the project region was 132 Tg C per y (1 Tg = 10 g), over half of which (74 Tg C per y, 56%) was attributed to the implementation of the projects. Our results demonstrate that these restoration projects have substantially contributed to CO mitigation in China.
Estimation of China soil organic carbon storage and density based on 1∶ 1000000 soil database
The rapid and massive urban and industrial land expansions in China between 1990 and 2010: A CLUD-based analysis of their trajectories, patterns, and drivers
DOI:10.1016/j.landurbplan.2015.10.001 URL [本文引用: 2]
The 30 m annual land cover dataset and its dynamics in China from 1990 to 2019
DOI:10.5194/essd-13-3907-2021
URL
[本文引用: 1]
. Land cover (LC) determines the energy exchange, water and carbon cycle between Earth's spheres. Accurate LC information is a fundamental parameter for the environment and climate studies. Considering that the LC in China has been altered dramatically with the economic development in the past few decades, sequential and fine-scale LC monitoring is in urgent need. However, currently, fine-resolution annual LC dataset produced by the observational images is generally unavailable for China due to the lack of sufficient training samples and computational capabilities. To deal with this issue, we produced the first Landsat-derived annual China land cover dataset (CLCD) on the Google Earth Engine (GEE) platform, which contains 30 m annual LC and its dynamics in China from 1990 to 2019. We first collected the training samples by combining stable samples extracted from China's land-use/cover datasets (CLUDs) and visually interpreted samples from satellite time-series data, Google Earth and Google Maps. Using 335 709 Landsat images on the GEE, several temporal metrics were constructed and fed to the random forest classifier to obtain classification results. We then proposed a post-processing method incorporating spatial–temporal filtering and logical reasoning to further improve the spatial–temporal consistency of CLCD. Finally, the overall accuracy of CLCD reached 79.31 % based on 5463 visually interpreted samples. A further assessment based on 5131 third-party test samples showed that the overall accuracy of CLCD outperforms that of MCD12Q1, ESACCI_LC, FROM_GLC and GlobeLand30. Besides, we intercompared the CLCD with several Landsat-derived thematic products, which exhibited good consistencies with the Global Forest Change, the Global Surface Water, and three impervious surface products. Based on the CLCD, the trends and patterns of China's LC changes during 1985 and 2019 were revealed, such as expansion of impervious surface (+148.71 %) and water (+18.39 %), decrease in cropland (−4.85 %) and grassland (−3.29 %), and increase in forest (+4.34 %). In general, CLCD reflected the rapid urbanization and a series of ecological projects (e.g. Gain for Green) in China and revealed the anthropogenic implications on LC under the condition of climate change, signifying its potential application in the global change research. The CLCD dataset introduced in this article is freely available at https://doi.org/10.5281/zenodo.4417810 (Yang and Huang, 2021).
Climate classification in China//Anthology of Zhu Kezhen Editorial Team
中国气候区域论//《竺可桢文集》编辑小组
Carbon sink estimation and potential of forest management in China
中国森林管理活动碳汇及其潜力
Soil carbon sequestrations by nitrogen fertilizer application, straw return and no‐tillage in China's cropland
DOI:10.1111/gcb.2009.15.issue-2 URL [本文引用: 3]
To burn or retain crop residues on croplands? An integrated analysis of crop residue management in China
DOI:10.1016/j.scitotenv.2019.01.150 URL [本文引用: 1]
Trends in organic carbon content of farmland topsoil in mainland China over the past 20 years
近20年来中国大陆农田表土有机碳含量的变化趋势
Carbon sequestration and its potential in agricultural soils of China
Modeling soil organic carbon change in croplands of China, 1980-2009
CO2 mitigation potential in farmland of China by altering current organic matter amendment pattern
DOI:10.1007/s11430-010-4014-z URL [本文引用: 1]
An increase in topsoil SOC stock of China's croplands between 1985 and 2006 revealed by soil monitoring
DOI:10.1016/j.agee.2009.12.011 URL [本文引用: 1]
Vegetation and soil carbon stocks in China
中国植被和土壤碳贮量
Soil carbon stocks and their influencing factors under native vegetations in China
不同植被下中国土壤有机碳的储量与影响因子
Carbon sequestration in China's terrestrial ecosystems under climate change: Progress on Ecosystem Carbon Sequestration from the CAS Strategic Priority Research Program
中国陆地生态系统固碳效应: 中国科学院战略性先导科技专项“应对气候变化的碳收支认证及相关问题”之生态系统固碳任务群研究进展
A method of geo-information science for studying carbon cycle and its mechanism of terrestrial ecosystems
DOI:10.11821/yj2003040001
[本文引用: 1]
There exists about 1.4~1.7GtC missing sink in the global carbon budgets. The missing sink might happen in terrestrial biosphere and coastal continental shelf. However, this guess is lack of support from scientific observation data and research methods. Progress in geo-information science is paving way for studying carbon cycle and its mechanisms of terrestrial ecosystems. To address the scientific issues such as temporal and spatial pattern of terrestrial ecosystem carbon sink, and driving mechanism and scenarios of carbon cycle, this paper proposes a method of geo-information science for studying carbon cycle of terrestrial ecosystems.Bottom-up approach and top-down approach are combined by means of scaling models. The bottom-up approach is based on observations of comprehensive network of carbon storage and carbon cycle process of terrestrial ecosystems, adaptive experiments of biological processes, and researches on carbon transportation processes of rivers. the top-down approach is based on detecting land cover change and retrieving ecological parameters by using satellite data. Retrieval models of carbon budgets are developed by means of the capacity of satellite remote sensing that can frequently supply surface information of geographical processes and ecological processes. On the basis of analyzing data-at-points collected by stations of Chinese Ecosystem Research Network, stations of Chinese Forest Ecosystem Research Network, and observation stations of HINAFLUX, combined with the retrieval models, a numerical simulation model of terrestrial ecosystem carbon cycle is constructed by means of surface theorem, grid generation method and grid computing technique. Pattern and process of carbon cycle are to be simulated; natural and human impacts on carbon cycle of terrestrial ecosystems are to be analyzed; and evolution trends of carbon cycle process of terrestrial ecosystems are to be discussed under the condition of global climate change.
陆地生态系统碳循环及其机理研究的地球信息科学方法初探
Mapping the distribution, trends, and drivers of soil organic carbon in China from 1982 to 2019
A large but transient carbon sink from urbanization and rural depopulation in China
DOI:10.1038/s41893-021-00843-y [本文引用: 1]
Perspectives on the role of terrestrial ecosystems in the carbon neutrality'strategy
试论陆地生态系统碳汇在"碳中和"目标中的作用
The impacts of spatial resolutions on global urban-related change analyses and modeling
