

1 引言
作为理解中国区域与城乡发展的重要基础,透视省际人口流动的时空格局是过往研究的重要课题。已有研究多以整体流动人口为对象展开分析。从区域尺度看,中国人口流动的总体方向为农村流向城市、中西部流向东部沿海,流动人口在“胡焕庸线”东南侧的集聚趋势不断增强,而在西北侧则保持相对分散[2]。从省级尺度看,北京、上海、广东、浙江、江苏、福建等东部省市是流动人口的主要流入中心,近来也逐步在往中西部地区分散[3,5];从城乡空间属性看,城乡间的双向流动存在客观必然性,但长期以来并不显著且高度不平衡,乡—城流动占据绝对主导地位,近年来城—城流动有所增强[4,6];从网络联系看,由主要流入地和流出地省份构成了中国人口流动网络的核心节点,各节点联系程度增大,网络重心向东向北倾斜的非均衡性增强[7]。在少数涉及城乡属性流动人口划分及空间格局刻画的研究中,马小红等按照第六次全国人口普查(简称“六普”)资料中流动人口的户籍性质(农业和非农业)和现住地城乡类别两个维度,考察了所划分的城—城、乡—城、城—乡和乡—乡4类流动人口的规模、人口学和流动特征。在规模上,乡—城流动人口是主体,城—城流动人口次之,然后依次是乡—乡和城—乡流动人口;人口学特征上,乡—城流动人口最年轻、职业以产业工人和服务行业为主,而乡—乡流动人口则是文化程度最低、收入不稳定的人群,城—城和城—乡流动人口的相似性在于文化程度较高、职业有一定专业性;流动特征上,乡—城和乡—乡流动人口跨省流动比例最高,城—乡流动人口以本县跨乡镇为主,而城—城流动人口则是跨不同行政尺度的比例相对平均;4类流动人口在外流动时间平均都超过4年,呈现长期化的趋势[4]。马荷花等采用“六普”中流动人口的户口登记地和现住地的城乡类型来重新界定省际4类流动人口,结果表明乡—城流动仍是主要模式,然后依次为乡—乡、城—城和城—乡流动[8]。陆希刚等同样根据“六普”中户籍地和现住地所涉及的城市、镇、村聚落将流动人口划分为6类,并对各省的流动空间模式进行识别[9]。
国内外对于人口流动与区域经济发展关系的研究有丰富的积累。首先,区域经济发展对人口流动的影响一般是置于人口流动影响机理的框架中考察。在经典理论中,人口流动决策的主要动机是经济动机,即流出地的经济发展水平低有利于人口流出,而流入地的经济发展水平高则利于人口流入这一结论被反复证明,两地间的经济发展差异也被认为是影响人口流动的重要因素[10-11]。基于中国的实证分析同样支持上述结论,以推—拉理论为框架,实证考察改革开放以来省际人口流动影响机理的多数研究认为,不同地区在经济规模、产业结构、固定资产投资和外商投资、工资水平、就业机会等经济上的差异是影响流入地选择的重要因素[12⇓-14],且流入地城镇收入水平的吸引作用趋于增强[15];在对城—城流动人口流入地选择机制的研究中,地区经济发展、工资水平等变量也依然发挥显著的正向作用[16];在区分城乡4类流动人口的文献中,以人均收入比表征的两地间经济发展差异变量对4类人口流动的正向影响同样得到证实,并且相比于乡村流出人口,城市流出人口对该变量更敏感[10]。其次,针对中国的多数研究认可人口流动对于全国经济发展、人口净流入对于流入地经济发展有正向促进作用的结论[17⇓-19],分歧则在于人口流出和流入对于流出地的影响到底是正向还是负向。围绕人口流出对流出地经济发展影响的大部分研究认为,人口流出通常伴随着人力资本的流失而对其经济发展不利[20-21];此外,由于一国内部资本有着高度的流动性,资本会随着劳动力的流动而流向发达地区的“资本追逐劳动力”的现象,可能加剧对流出地经济发展的抑制作用[22]。持有另一种观点的人认为,没有户籍变动的人口流动和有户籍变动的人口迁移,对流出地经济发展的影响是不同的,人口迁出呈现为负向作用,而人口流出则有明显正向贡献,原因在于没有户籍变动的流动人口转移的汇款、带回流入地的先进技术或管理经验等形成的“反哺效应”有利于流出地的经济发展[18]。少数涉及人口流入对流出地经济发展影响的研究发现,人口流入并未显现对流出地经济发展的带动作用,反而因为流出地原有自然条件较差、产业基础薄弱、就业机会有限等而对其经济增长不利[17]。
上述研究为本文提供了重要的基础和启示,但关于中国省际人口流动时空格局的分析主要以整体流动人口为对象,而在为数不多涉及城乡属性区分的研究中,因划分方式的不同得到的结论也不尽相同,并且囿于数据还未能反映其最新状况及变化趋势;此外,对于省际城乡人口流动与区域经济发展关系的相关研究在结论上也尚未达成一致的看法,还需做进一步的深入探讨。进入新时代,不均衡不充分发展与人民日益增长的美好生活需要之间的矛盾成为中国社会的主要矛盾,而区域和城乡发展不平衡则是中国不平衡发展的主要体现。科学认识和把握中国省际城乡流动人口的时空格局及与区域经济发展的关系,将为贯彻落实新型城镇化和乡村振兴等国家战略,有效化解区域和城乡发展不平衡问题提供科学依据。本文拟基于第六次、第七次全国人口普查数据(简称“六普”“七普”),根据长表资料中流动人口的户籍地和现住地的城乡类型来划分省际城乡4类流动人口,利用描述统计识别城乡流动人口主流类型,并进一步通过流动率指标和计量模型考察2010—2020年城乡加速转型背景下中国省际城乡流动人口主流类型的空间格局演变及与区域经济发展的关系。
2 省际城乡流动人口的划分及其主流类型识别
2.1 省际城乡流动人口的划分
参照已有研究的做法,基于2010年第六次和2020年第七次全国人口普查分省资料,本文对城乡4类流动人口的划分为:① 根据普查长表资料的户口登记类型,将乡和镇的村委会的登记人口定义为“乡村人口”,将镇的居委会和街道的登记人口定义为“城镇人口”;将现住地为城市和镇的人口定义为“城镇人口”,现居住地为乡村的人口仍旧为“乡村人口”;② 将户口登记地和现住地的城乡变量两两交互,形成城—城、乡—城、城—乡和乡—乡4类流动人口。根据普查定义,省际流动人口指在调查时户籍地与现住地不在同一个省的人口,且因“六普”和“七普”户籍地和现住地的城、乡属性均采用2008年国家统计局《统计上划分城乡的规定》为统一划分标准,因此可进行时间上的纵向对比。此外,因普查资料中的省际城乡流动人口为抽样调查结果,在计算省际城乡流动的规模、占比和联系网络等数据时,根据抽样调查中常住人口样本数占实际常住人口的比例对调查结果进行推算。需要说明的是,尽管现住地和户口登记地的城乡类型划分存在一定程度的差异,但这种差异尚不足以对时空格局等主要研究结论产生较大影响[9]。人口数据包括中国31个省、直辖市、自治区(简称省市区),暂未包括港澳台地区数据。
2.2 省际城乡流动人口主流类型识别
省际城乡流动人口规模庞大且不断增长,城—城和乡—城流动成为当前中国城乡流动人口的主流类型。如表1所示,2020年中国省际城乡流动人口总规模约1.20亿人,比2010年增长了33.76%,10年间增长迅速的趋势明显。同2010年相比,各类型省际城乡流动人口的份额未发生大的变动。其中,乡—城流动占主导,两个年份各占比67.04%和67.55%;城—城流动则在规模和份额上均有提升,2020年其流动规模相比2010年增长了1.74倍,占比也由16.98%提升至19.54%;乡—乡流动规模有一定上升,但份额却下滑了3个百分点;城—乡流动规模小、份额少的同时其占比还比10年前低了0.6个百分点。基于最新变化可知,省际城乡流动人口规模基数大并持续增长的同时,乡—城流动占主体的地位保持稳定,城—城流动快速增长,乡—乡流动增长缓慢且占比有所下降,城—乡流动规模最小;城—城和乡—城流动人口两者合计以超过87%的份额成为当前中国城乡流动人口的主流类型。
表1 2010年和2020年中国省际城乡流动人口的规模和份额
Tab. 1
| 指标 流动类型 | 流动规模(万人) | 流动份额(%) | |||
|---|---|---|---|---|---|
| 2010年 | 2020年 | 2010年 | 2020年 | ||
| 城—城流动 | 1346.45 | 2338.32 | 16.98 | 19.54 | |
| 乡—城流动 | 5315.36 | 8085.03 | 67.04 | 67.55 | |
| 城—乡流动 | 110.92 | 160.52 | 1.40 | 1.34 | |
| 乡—乡流动 | 1156.21 | 1385.71 | 14.58 | 11.58 | |
| 合计 | 7928.94 | 11969.58 | 100.00 | 100.00 | |
3 城—城和乡—城流动人口的流动率指标与计量模型
3.1 流动率指标
假设某地i常住人口Pi,本地(户籍)常住人口Li,本地户籍人口Hi,流入人口Ii,流出人口Oi,它们满足以下等式:
该地i乡村地区的常住人口和户籍人口的等式可写成:
式中:Ur和Ru分别是英文Urban和Rural的缩写,对应城和乡的含义;LiUr和LiRu表示i地(户籍)城镇和乡村常住人口;LiUr_Ur和OiUr_Ur表示城—城流入人口和流出人口,LiRu_Ur和OiRu_Ur表示乡—城流入人口和流出人口;mijUr_Ur和mijRu_Ur分别为i流向j的城—城和乡—城人口流规模。为对省际城—城和乡—城流动特征评价及模型构建的需要,构造表2的公式。
表2 中国省际城—城和乡—城流动人口的流动率指标
Tab. 2
| 指标 | 公式 | |
|---|---|---|
| 城—城 流动 | 城—城流入率( | |
| 城—城流出率( | ||
| 城—城净流动率( | ||
| 两地间城—城流动率( | ||
| 乡—城 流动 | 乡—城流入率( | |
| 乡—城流出率( | ||
| 乡—城净流动率( | ||
| 两地间乡—城流动率( |
3.2 计量模型
3.2.1 区域经济发展对城—城和乡—城流动人口影响的计量模型
根据过往研究可知,基于经典的推—拉理论及其分析框架构建计量模型是考察人口流动影响因素的通常做法,本文开展区域经济发展对城—城和乡—城流动人口影响的分析也遵循这一做法。研究表明,影响人口流动的因素涉及地区间的距离、经济、社会和舒适性等诸多方面[14⇓-16]。其中,地区间的经济发展水平、工资收入、就业机会、产业结构等经济差距通常被认为是驱动人口流动的主要动机,在分析过程中本文将综合表征地区经济发展水平的人均GDP、表征地区经济增长状况的经济平均增长率、表征就业机会大小的城镇登记失业率引入模型;此外,地区间存在着的社会发展水平和舒适性的差异也是影响人口流动的重要变量,因此将小学生师比、年均温等作为相关的代理变量;还有,伴随人口流动过程中会产生各种费用和成本,克服这些成本流动成为需考虑的重要问题,把两地间的空间距离和两地间前期的流动存量分别作为克服交通成本和降低信息成本的代理变量。
式中:MRij表示流出地i省与流入地j省间的城—城或乡—城流动率,计算公式如表2所示;Rpcgdpji为流入地j与流出地i的人均GDP比值;Rjoblessji为j与i的城镇登记失业率比值;Rgrowthji为j与i 5年间经济平均增长率比值;Rstuteaji为j与i小学生师比比值;Rtemji为j与i年均温比值;Dij为省会城市间最短铁路距离;TRij为i与j之间前一阶段的流动存量(也称社会网络、流动链),用于表征流动者流动决策过程中获取就业、收入等信息的主要来源,计算方法参考Fan等的研究[12],利用i省流动至j省的人口流规模mij占i省人口流出规模的比重计算,因数据不可比性问题无法在2010年的模型中引入2000年城—城和乡—城流动人口的流动存量,故仅在2020年的模型中引入该变量;
对式(3)取对数,可得到对数线性方程:
3.2.2 城—城和乡—城流动人口对区域经济发展影响的计量模型
根据新古典经济增长理论,本文参考已有研究[17]构造包含省际城—城和乡—城流动人口的C-D生产函数,对2010年和2020年中国省际城—城和乡—城流动人口对全国、流入地和流出地3个层面的区域经济发展的影响作用进行考察。流入地模型空间单元是东部的北京、天津、上海、江苏、浙江、福建、广东、海南及西部的新疆、西藏和东北的辽宁,计11个省市区;流出地模型空间单元是中西部和东北的山西、河南、湖北、湖南、安徽、江西、广西、重庆、四川、贵州、云南、陕西、甘肃、青海、内蒙古、宁夏、黑龙江、吉林及东部的河北和山东,计20个省市区。对流入地和流出地模型的空间单元做这一处理的考虑是:两类流动人口在研究时段内会发生净流入与净流出的变动,考虑纳入流入地模型单元的是在研究时段内某省市区至少有3次及以上为净流入,而纳入流出地模型单元的则正好相反。
控制变量方面,自2001年中国加入世界贸易组织以来,经济全球化、信息化、科学技术与体制创新等正逐渐成为中国区域经济发展的主导因素,而传统的劳动力、土地等要素投入作用在下降[24]。综合考虑以上情况,确定表征投资强度的人均固定资产投资(invest)、表征产业结构的二三产业增加值占GDP比重(indus)、表征对外贸易与全球化的进出口贸易占GDP比重(trade)、表征科技创新的R&D研发支出经费占GDP比重的研发投入强度(R&D)4个指标。模型构建时,在方程两边同时取自然对数,具体公式为:
(1)全国和流出地区域模型形式:
(2)流入地区域模型形式:
式中:
计量模型中的气温、社会经济指标等控制变量数据均来自2011年和2021年《中国统计年鉴》及对应年份的《中国科技统计年鉴》;省会城市间最短铁路距离根据国家基础地理信息中心2010年和2020年的铁路网数据计算得到。
4 省际城—城和乡—城流动人口的空间格局演变
4.1 省际城—城和乡—城流动人口的空间分布及演变
4.1.1 城—城净流入进一步往沿海三大中心集中,净流出省市区数量和程度在增加
图1显示,城—城净流入在凸显北京、上海和广东三大沿海中心的同时,东北的辽宁、西北的新疆和西南的云南也维持一定的净流入率,而与之形成对比的是,这些吸引中心的周边或邻近省市区的净流出则在数量和程度上均有增强的表现,仅少数中西部省份净流出在减轻。沿海的北京、上海和广东作为净流入高值区的地位得以体现。具有国家层面综合城市功能的北京和上海的城—城净流入率遥遥领先且显著增长,进一步塑造了其在全国的核心地位,广东以2.51%~5%的净流入率,仅次于北京和上海,在吸引城—城流动人口上同样有着重要表现;而指示该三中心净流入集中度提高的另一特点是同属沿海的天津、山东和福建由净流入转为净流出,以及邻近长三角的中部省份河南和安徽净流出率的下降。辽宁和新疆净流入中心的维持,引发了东北和西北人口的进一步流失。其中,黑龙江净流出率下降明显,在2020年更是成为全国人口流失最重的省份,邻近新疆的甘肃、青海净流出率也在下降。相比而言,西南的四川、重庆、贵州和中部的湖南、江西、湖北净流出率在数值上则有小幅提升,且湖北上升趋势较明显,表明这些地区部分区域中心城市的吸引功能有所增强。
图1
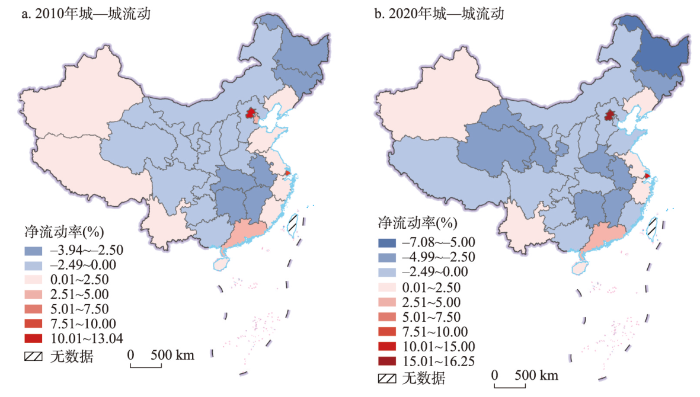
图1
2010年和2020年中国省际城—城流动人口的净流动格局
注:基于自然资源部标准地图服务网站GS(2020)4619号标准地图制作,底图边界无修改。
Fig. 1
The net mobility pattern of China's interprovincial urban-urban floating population in 2010 and 2020
4.1.2 乡—城流动人口的净流入区与净流出区虽未发生方向性逆转,但数值升降明显
由图2可知,净流入区中,乡—城净流入率在沿海地区呈现“此消彼长”的特征,而西部边疆的净流入率则在上升。作为华北吸引中心的北京和天津,其净流入率数值在下降,导致该区域的整体吸引力减弱;上海、浙江和广东依然保持强劲吸引力,福建、江苏和海南也有较高的净流入率,并由此形成了一个自江苏至海南的净流入中心“条带”;新疆和西藏的净流入率在2010年的基础上都有不同程度的提升,尤其是新疆的净流入率提升幅度明显,而与之邻近的省市区除了宁夏有一定增强外,青海和内蒙古的净流入率都在下降,由此在西北形成了以新疆为主的重要吸引中心。反观净流出区,除了四川和重庆的净流出率有所上升外,其他均表现为净流出率的下降。其中,湖南、广西和贵州跌入了与安徽和江西类似的重度净流出区,山西、河北、山东、河南、陕西等多数省份则维持在轻度或中度净流出区,呈现明显的“南重北轻”,而东北则是除辽宁仍保持净流入以外,黑龙江和吉林人口进一步流失;重庆人口流出势头的减缓程度比四川更明显。
图2

图2
2010年和2020年中国省际乡—城流动人口的净流动格局
注:基于自然资源部标准地图服务网站GS(2020)4619号标准地图制作,底图边界无修改。
Fig. 2
The net mobility pattern of China's interprovincial rural-urban floating population in 2010 and 2020
4.2 省际城—城和乡—城流动人口的空间联系及变化
4.2.1 城—城流动的沿海三大流动圈吸引力增强,东北、西南和西北地区内部联系加强
从图3来看,城—城流动人口中以北京、上海和江苏及广东为中心的三大跨区域大型流动圈吸引力不断增强的同时,西部的云南、新疆和东北的辽宁等地的吸引作用也在逐渐加强。京津冀流动圈的增强主要源于周边省市和东北的流入,以北京“一城独大”特征鲜明。该流动圈最重要的人口流的增加在于河北流向北京的O-D流规模由2010年的15万人以上跃升为2020年的35万人以上,增幅约达20万人;此外,由河南和山东汇入的O-D流也在2020年达到了15万人以上;东北的贡献则在于黑龙江—北京、辽宁—北京、吉林—北京、黑龙江—河北等O-D流均超过10万人。以上海和江苏为双中心的长三角流动圈形成了多向联系紧密的网络。该地区O-D流增幅的主要贡献以内部对流及安徽、河南、山东和江西等的汇入,其中最显著的是江苏—上海、安徽—江苏和安徽—上海的O-D流在2020年均在35万人以上,以及安徽—江苏和江苏—上海在2010—2020年的增幅在15万人以上。广东流动圈人口流来源广泛,形成的多源汇聚型网络进一步增强。两年份中该地区15万人以上的O-D流来源于河南、四川、江西、湖南、湖北和广西,并且除了河南以外,其余5省份在2010—2020年间均有5万人以上的增幅,塑造与强化了其“多源汇聚型”的特点。辽宁、云南和新疆分别是东北、西南和西北地区内部联系加强的中心。黑龙江和吉林人口流出趋势强化而辽宁则成为主要流入地;四川—云南、四川—重庆人口流的补充成为重庆净流出下降、云南净流入保持的重要来源;对新疆贡献最明显的是甘肃人口流入的增加。
图3
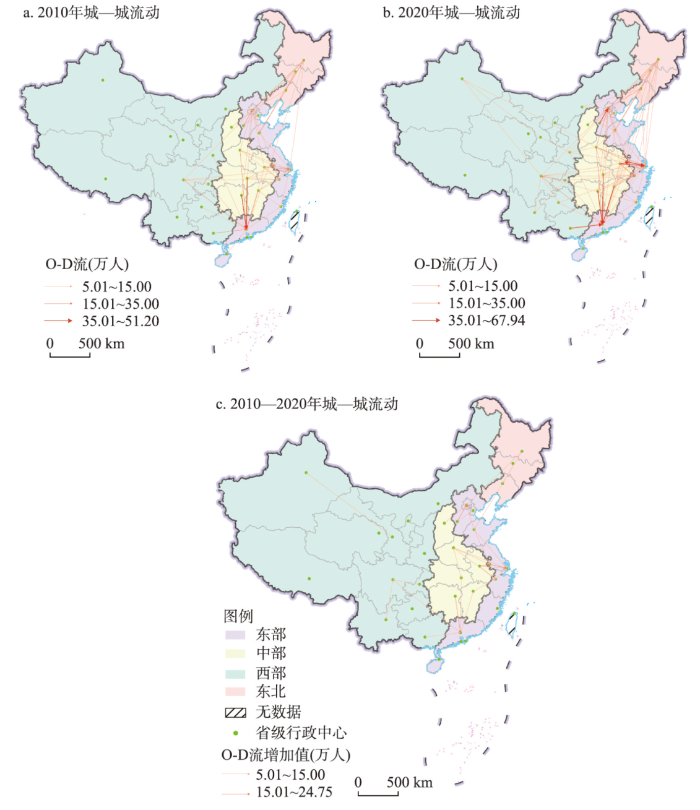
图3
2010—2020年中国省际城—城流动人口的O-D流及其增加值格局
注:基于自然资源部标准地图服务网站GS(2020)4619号标准地图制作,底图边界无修改;为突出重要O-D流的作用,O-D流及其增加值-5万~5万人区间的数值并未在图上显示。
Fig. 3
The O-D flow and its changing pattern of China's interprovincial urban-urban floating population from 2010 to 2020
4.2.2 乡—城流动的沿海流动圈连绵成带,内陆地区性流动圈在发育
乡—城流动人口中京津冀、长三角、广东和福建串联出沿海流动圈的连绵成带,但各流动圈的联系网络却变动各异,内陆地区性流动圈的发育得益于新疆、辽宁净流入强度的增强以及四川和重庆净流出强度的减弱(图4)。沿海流动圈变动的体现是长三角内部分异、广东显著增强、京津冀覆盖范围缩小以及福建流动圈的成型。长三角的分异在于,上海吸引人口的作用不升反降,浙江和江苏则显著提升。对上海O-D流降幅贡献最大的是安徽,其流入的人口比2010年降了近26万人,而从江苏、四川、重庆等流入的人口也有5万~15万人不等的降幅;相比而言,浙江和江苏两省流入人口增长显著,合计流入的O-D流增幅分别达到555万人和267万人。其中,对浙江O-D流增加贡献最大的是安徽与河南,均有100万人以上的增幅,贵州、江西、四川、湖南、湖北、江苏、陕西和山东增加的流也在10万~75万人不等;对江苏O-D流增加贡献最高的也是安徽与河南,分别增加了86万人和56万人,山东和云南也各贡献了10万人以上。广东流动圈成为全国O-D流增幅最显著的区域。2020年流入广东的流相比2010年增加了772万人,增幅最明显的流来自广西和湖南,分别增加了189万人和164万人,此外,江西、湖北、河南、云南、贵州、四川、福建、安徽和重庆等省市区增长也较明显。京津冀流动圈覆盖范围缩小的同时,增强了对邻近的河北和东北的吸引。范围缩小最重要的表现是全国其它地区流向北京和天津的占比不高,并且湖北、河南、安徽、四川等地流入的多股O-D流相比2010年有明显下降,降幅在5万~15万人不等;对周边地区吸引的增强体现在人口流增幅贡献在10万人以上的大型O-D流均来自河北、山西、黑龙江等地。福建流动圈的成型得益于江西、四川、贵州35万人以上人口流的持续输入以及河南、贵州、云南10万人以上人口流的增幅。以新疆和辽宁为流入中心的地区性流动圈,其发育程度高于西南(四川、重庆、贵州、云南)流动圈。新疆增强了对甘肃、河南和四川的吸引,辽宁则是吉林和黑龙江人口流入的中心,该两地区性流动圈的发育特征明显;此外,虽然得益于四川和重庆人口外流的减少以及西南地区内部人口对流的增加,但净流入中心的缺位导致西南流动圈还处在发育中。这些以邻近省市区流动为主且正在发育中的地区性流动圈呈点状散布于内陆的特点显示了其集聚人口功能在提升。
图4
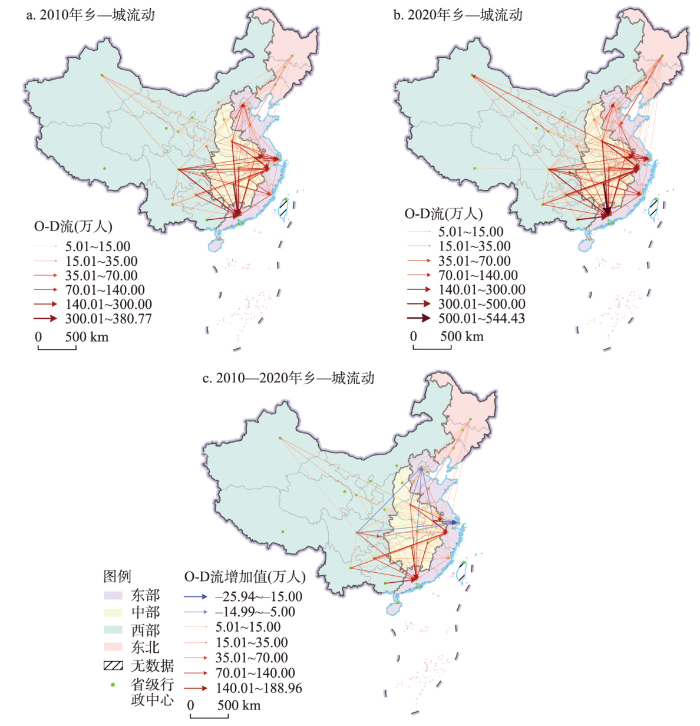
图4
2010—2020年中国省际乡—城流动人口的O-D流及其增加值格局
注:基于自然资源部标准地图服务网站GS(2020)4619号标准地图制作,底图边界无修改;为突出重要O-D流的作用,O-D流及其增加值-5万~5万人区间的数值并未在图上显示。
Fig. 4
The O-D flow and its changing pattern of China's interprovincial rural-urban floating population from 2010 to 2020
4.2.3 城—城和乡—城流动人口O-D流的空间联系变化源于两种重要渠道
同一流动人口类型的流入人口和流出人口在10年间相对关系的变动以及相同户籍属性的不同流动人口类型间的转变均会引发各省市区人口O-D流的空间联系变动。
对前述4种城乡流动人口类型2020年与2010年的流入人口和流出人口分别进行比值计算发现,城—城或乡—城流动人口其流入人口和流出人口10年间相对关系的变动仍是引发各自人口O-D流增加或减少的主要来源,且比值大于1的居多因而绝大多数以增加为主,只有部分省市区才是城—城与城—乡或乡—城与乡—乡这两类具有相同户籍属性的流动人口类型间的转变所致(图5)。具体而言,城—城或乡—城流动其流入人口和流出人口10年间相对关系的变动包括单一的流入人口增加或流出人口减少,抑或是流入人口增加幅度大于流出人口的减少,3种情况均会导致城—城或乡—城人口流的增加,这也是绝大多数省市区人口流增加的缘由。对于具有相同户籍属性的城—城与城—乡或乡—城与乡—乡流动人口而言,流入地乡村向城镇地域的转变、流动人口在流入地由乡村流向城镇或城镇流向乡村是引发城—城和乡—城人口O-D流变动的另一重要渠道。从流入视角看,天津、河北、江苏和青海城—城O-D流的增加与其城—乡流入减少而转变为城—城流入增加有关;天津、辽宁、黑龙江、江苏乡—城O-D流的增加则是其乡—乡流入减少而转变为乡—城流入增加所致;上海相对独特,其乡—城O-D流整体呈下跌趋势在于乡—城流入减少而转变为乡—乡流入增加。从流出视角看,北京和上海城—城O-D流的下降源于其城—乡流出减少转变为城—城流出增加,而四川、重庆和江西乡—城O-D流的下降则源于乡—乡流出减少转变为乡—城流出增加。
图5
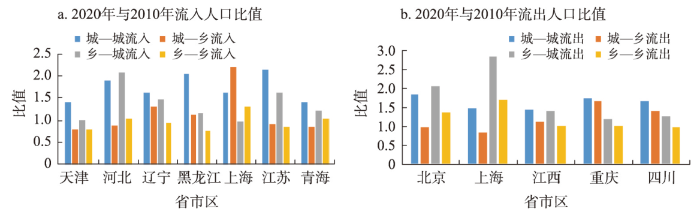
图5
2010年和2020年部分省市区城乡流动的流入人口和流出人口规模的比值
Fig. 5
In and out-move ratio of urban and rural floating population for several provincial-level regions in 2010 and 2020
5 省际城—城和乡—城流动人口与区域经济发展的关系
5.1 区域经济发展对省际城—城和乡—城流动人口的影响
基于3.2.1的计量模型开展区域经济发展对城—城和乡—城流动人口影响作用的回归分析,针对变量进行VIF共线性检验,所有模型中自变量VIF均值均小于10,说明变量之间不存在多重共线性,结果如表3所示。
表3 区域经济发展对城—城和乡—城流动人口影响的回归分析结果
Tab. 3
| 城—城流动 | 2010年模型(lnMRijUr_Ur) | 2020年模型(lnMRijUr_Ur) | ||||||||
|---|---|---|---|---|---|---|---|---|---|---|
| 变量标签 | 模型1 | 模型2 | 模型3 | 模型4 | 模型1 | 模型2 | 模型3 | 模型4 | 模型5 | |
| lnDij | -0.52*** | -0.52*** | -0.53*** | -0.53*** | -0.52*** | -0.52*** | -0.53*** | -0.53*** | -0.19*** | |
| lnRpcgdpji | 0.32*** | 0.21*** | 0.42*** | 0.34*** | 0.14*** | |||||
| lnRjoblessji | -0.19*** | -0.14*** | -0.15*** | -0.11*** | -0.06*** | |||||
| lnRgrowthji | -0.13*** | -0.13*** | 0.03 | 0.01 | 0.13*** | |||||
| lnRstuteaji | -0.20*** | -0.07** | -0.24*** | -0.15*** | -0.08*** | |||||
| lnRtemji | 0.27*** | 0.20*** | 0.33*** | 0.16*** | -0.06** | |||||
| Midij | -0.12*** | -0.12*** | -0.12*** | -0.12*** | 0.01 | |||||
| Westij | -0.04 | -0.04 | -0.07** | -0.07** | -0.03 | |||||
| NorEastij | 0.05** | 0.05** | 0.02 | 0.02 | 0.04** | |||||
| Eastij | 0.07*** | 0.07*** | 0.05 | 0.05* | -0.07*** | |||||
| lnTRij | 0.73*** | |||||||||
| 调整R2 | 0.269 | 0.373 | 0.446 | 0.473 | 0.269 | 0.443 | 0.375 | 0.468 | 0.764 | |
| 乡—城流动 | 2010年模型(lnMRijRu_Ur) | 2020年模型(lnMRijRu_Ur) | ||||||||
| 变量标签 | 模型1 | 模型2 | 模型3 | 模型4 | 模型1 | 模型2 | 模型3 | 模型4 | 模型5 | |
| lnDij | -0.44*** | -0.44*** | -0.46*** | -0.46*** | -0.44*** | -0.44*** | -0.45*** | -0.44*** | -0.29*** | |
| lnRpcgdpji | 0.57*** | 0.47*** | 0.58*** | 0.56*** | 0.46*** | |||||
| lnRjoblessji | -0.23*** | -0.12*** | -0.27*** | -0.20*** | -0.18*** | |||||
| lnRgrowthji | -0.17*** | -0.16*** | -0.01 | -0.03 | 0.03 | |||||
| lnRstuteaji | -0.34*** | -0.06** | -0.35*** | -0.19*** | -0.19*** | |||||
| lnRtemji | 0.16*** | 0.02 | 0.31*** | 0.03 | -0.12*** | |||||
| Midij | -0.07*** | -0.07*** | -0.08** | -0.08*** | -0.003 | |||||
| Westij | -0.06** | -0.06*** | -0.07** | -0.07*** | -0.02 | |||||
| NorEastij | 0.01 | 0.05** | -0.002 | -0.002 | -0.01 | |||||
| Eastij | -0.001 | -0.001 | -0.03 | -0.03 | -0.11*** | |||||
| lnTRij | 0.44*** | |||||||||
| 调整R2 | 0.190 | 0.515 | 0.430 | 0.571 | 0.189 | 0.528 | 0.322 | 0.568 | 0.686 | |
注:***、**、*分别表示回归参数在1%、5%、10%显著性水平显著;模型的回归系数均为标准化后的系数。
首先,人均GDP对城—城和乡—城流动都发挥显著的正向促进作用。说明流入地与流出地的经济发展差距依然是影响两类人口流动的重要因素,这与已有基于省际人口流动、城—城人口流动和分城乡属性人口流动等的研究结果一致[8,14⇓ -16],进一步验证了地区间经济发展的绝对差距是促成省际人口流动的内在动力这一结论。其次,从时间演变上看,该变量的推动作用随着时间的推移在增强。基于加入其他社会经济变量和地区虚拟变量的模型4可知,城—城和乡—城流动中该变量的弹性系数分别由2010年的0.21和0.47上升为2020年的0.34和0.56,加强趋势明显。再次,进一步加入流动存量后人均GDP对两类人口流动的影响作用大小出现明显差异。从包含流动存量的模型5看(2020年),相比于同年的模型4,人均GDP和空间距离对城—城和乡—城人口流动水平的影响程度都在下降,但不同的是,城—城流动中流动存量的弹性系数绝对值0.73高于空间距离的0.19和人均GDP的0.14,这与马志飞等对省际城—城人口流动的研究结论是相吻合的[16],而在乡—城流动中,弹性系数绝对值最高的仍是人均GDP的0.46,接着才依次是流动存量的0.44和空间距离的0.29,这也意味着虽然两类流动人口在流动过程中会考虑距离远近带来的阻碍,但如果流入地有能给自己提供就业信息或其他各种帮助的社会网络,则会抵消距离带来的抑制作用,并且这一促进作用在城—城流动中十分显著而在乡—城流动中则没有这么突出。
地区间其他社会经济发展因素和地区虚拟变量等控制变量也对城—城和乡—城流动有重要影响。其中,两地间就业机会大小的弹性系数显示,失业率低的地区受到青睐并吸引人口流入而失业率高的地区则相反,也就是说城—城和乡—城人口流动时会通过各种渠道收集工作、生活信息,在有了充分把握后才采取实际行动;经济增长率对城—城和乡—城流动的影响随时间的变化而变化,在2010年均体现为负向作用,而在2020年仅对城—城流动具有显著的负向作用,对乡—城流动则转变为统计不显著的正向作用,说明经济增长率的高低对人口流动的影响处在变动中且未必就是从增长率低的地区流向高的地区;表征社会发展和舒适性因子的小学生师比和年均温对两类人口流动的影响基本一致,但城—城流动对年均温更敏感,这说明重视流入地的基础教育质量是两类人口流动过程中都会考虑的重要问题,而城—城流动显然对于气候舒适性更青睐;地区虚拟变量显示,当流入地与流出地都在中部或西部内部,并不利于两类人口流动的发生,而当流入地与流出地均为东北内部的话,则能促进两类人口流动的发生,东部地区的虚拟变量仅显示对城—城流动的正向作用。
5.2 省际城—城和乡—城流动人口对区域经济发展的影响
根据3.2.2的计量模型分别对全国、流入地和流出地城乡流动人口对区域经济发展的影响效应进行回归分析,并对变量的多重共线性问题进行了检验。回归结果如表4所示。
表4 城—城和乡—城流动人口对区域经济发展影响的回归分析结果
Tab. 4
| 城—城 流动 | 全国模型(lnpcgdp) | 流入地区域模型(lnpcgdp) | 流出地区域模型(lnpcgdp) | |||||||||||||||||
|---|---|---|---|---|---|---|---|---|---|---|---|---|---|---|---|---|---|---|---|---|
| 2010年 | 2020年 | 2010年 | 2020年 | 2010年 | 2020年 | |||||||||||||||
| 变量标签 | 模型1 | 模型2 | 模型3 | 模型1 | 模型2 | 模型3 | 模型1 | 模型2 | 模型3 | 模型1 | 模型2 | 模型3 | 模型1 | 模型2 | 模型3 | 模型1 | 模型2 | 模型3 | ||
| lnInRUr_Ur (lnNetUr_Ur) | 0.45*** | 0.10 | 0.58*** | 0.39*** | (0.28) | (0.08) | (0.66*) | (0.27) | 0.07 | -0.12 | 0.13 | 0.10 | ||||||||
| lnOutUr_Ur | -0.23 | -0.02 | -0.29** | -0.09 | 0.13 | -0.07 | -0.15 | 0.04 | ||||||||||||
| lninvest | 0.44*** | 0.45*** | 0.21** | 0.24*** | 0.21** | 0.26** | 0.23 | 0.22 | 0.82*** | 0.85*** | 0.50*** | 0.46** | ||||||||
| lnindus | 0.23** | 0.19* | 0.49*** | 0.30*** | 0.01 | 0.03 | 0.19 | 0.23 | 0.12 | 0.15 | 0.38** | 0.40** | ||||||||
| lntrade | 0.44*** | 0.37*** | 0.32** | 0.15 | 0.35*** | 0.36*** | -0.20 | -0.03 | 0.05 | 0.02 | 0.20 | 0.23 | ||||||||
| lnR&D | 0.08 | 0.11 | 0.20 | 0.32** | 0.56** | 0.48** | 0.92* | 0.61 | 0.03 | 0.03 | 0.20 | 0.20 | ||||||||
| 调整R2 | 0.260 | 0.881 | 0.878 | 0.440 | 0.713 | 0.847 | 0.076 | 0.966 | 0.969 | 0.341 | 0.761 | 0.806 | 0.020 | 0.790 | 0.778 | 0.037 | 0.635 | 0.594 | ||
| 乡—城 流动 | 全国模型(lnpcgdp) | 流入地区域模型(lnpcgdp) | 流出地区域模型(lnpcgdp) | |||||||||||||||||
| 2010年 | 2020年 | 2010年 | 2020年 | 2010年 | 2020年 | |||||||||||||||
| 变量标签 | 模型1 | 模型2 | 模型3 | 模型1 | 模型2 | 模型3 | 模型1 | 模型2 | 模型3 | 模型1 | 模型2 | 模型3 | 模型1 | 模型2 | 模型3 | 模型1 | 模型2 | 模型3 | ||
| lnInRUr_Ur (lnNetUr_Ur) | 0.65*** | 0.15 | 1.05*** | 0.49*** | (0.43) | (0.21**) | (0.57*) | (0.22) | -0.22 | -0.17 | 0.32 | 0.18 | ||||||||
| lnOutUr_Ur | 0.11 | -0.03 | 0.46** | 0.04 | -0.41 | -0.15 | 0.20 | 0.10 | ||||||||||||
| lninvest | 0.44*** | 0.47*** | 0.21** | 0.17** | 0.21** | 0.38*** | 0.23 | 0.21 | 0.82*** | 0.81*** | 0.50*** | 0.45** | ||||||||
| lnindus | 0.23** | 0.10 | 0.49*** | 0.17 | 0.01 | -0.18 | 0.19 | -0.01 | 0.12 | 0.13 | 0.38** | 0.33 | ||||||||
| lntrade | 0.44*** | 0.31*** | 0.32** | 0.10 | 0.35*** | 0.35*** | -0.20 | -0.31 | 0.05 | 0.01 | 0.20 | 0.21 | ||||||||
| lnR&D | 0.08 | 0.20 | 0.20 | 0.46*** | 0.56** | 0.52*** | 0.92* | 1.07* | 0.03 | 0.02 | 0.20 | 0.26 | ||||||||
| 调整R2 | 0.282 | 0.881 | 0.885 | 0.487 | 0.713 | 0.828 | 0.093 | 0.966 | 0.984 | 0.246 | 0.761 | 0.771 | 0.099 | 0.790 | 0.781 | 0.056 | 0.635 | 0.597 | ||
注:***、**、*分别表示回归参数在1%、5%、10%显著性水平显著;流入地区域模型中,城乡流动的自变量考虑的是净流入率对区域经济发展的影响作用;回归系数用括号内的数值表示;模型的回归系数均为标准化后的系数。
城—城和乡—城流动对于全国经济发展总体表现为正向促进作用,而在流入地和流出地的作用上表现不尽相同。首先,城—城和乡—城人口流动总体上有利于全国经济发展。在全国模型中,城—城和乡—城人口流入都体现为对经济发展的正向促进作用,而城—城和乡—城人口流出则分别为负向抑制和正向促进作用,并且城—城人口流入的弹性系数大于人口流出,因而从两类流动人口的流入率与流出率其弹性系数的相对关系可知,城—城和乡—城人口的省际流动是有利于中国经济发展的,这也与现有绝大多数研究的看法一致[17-18]。其次,城—城和乡—城人口净流入有利于流入地区域的经济发展,并且这种影响随着时间的推移在增大。从两类流动人口的流入地模型可知,人口净流入率的弹性系数在2010年和2020年的模型中都为正值,且在2020年的模型1中具备了显著的统计学意义,这说明源源不断的城乡劳动力增加对流入地城镇地区的经济发展会有明显促进,且系数数值随时间演变有进一步增大也表明这一正向作用还在提升。再次,城—城和乡—城人口流入率与流出率的弹性系数不具备显著的统计意义。从流出地的模型结果看,两类流动人口的所有变量都未通过统计学的显著性检验,无法验证其对流出地经济发展的影响作用。
投资、产业结构、对外贸易与全球化、科技创新等控制变量对流入地和流出地经济发展的影响也反映了中国区域经济格局的动力结构变迁。如表4所示,从两年份所有模型控制变量的弹性系数变化可知,投资对经济发展的驱动作用在弱化,这在全国和流入地模型中有着显著体现,而在流出地模型中其则演变为与创新的影响有着“旗鼓相当”的关系;创新的正向作用明显提升,尤其在流入地和流出地2020年的所有模型中跃升成为区域经济发展的最主导因子;产业结构和对外贸易与全球化的影响整体上变化不大,说明着力发展二三产业、开展对外贸易仍在区域经济贡献中占有一定份额。这一变化提示,中国已从过去主要依靠“投资”驱动的区域经济发展模式转变为更多依靠“创新”,这在流入地的表现更为明显,因此未来流入地应在研发投入、各类技能型人才的培养与引进等更多体现这方面的制度建设与相应的配套政策制定;对于流出地而言,投资仍是推进其城镇化建设与经济发展的重要手段,因此需在投资与创新培育的配合上下更多功夫。
6 结论和讨论
本文基于全国“六普”和“七普”中流动人口的户籍地和现住地的城乡类型划分了省际城—城、乡—城、城—乡和乡—乡4类流动人口,在识别中国城乡流动人口主流类型的基础上,通过流动率指标和计量模型考察了2010—2020年城乡流动人口主流类型的空间格局演变及与区域经济发展的关系。本文的结论有:① 省际城乡流动人口规模基数大并持续增长的同时,乡—城流动占主导,城—城流动快速增长,两类人口以超过87%的份额成为当前中国城乡流动人口的主流类型。② 城—城和乡—城流动人口空间格局的演变为:城—城净流动中沿海的北京、上海和广东的净流入率提升,天津、山东和福建则由净流入转为净流出,而内陆地区除了辽宁、新疆和云南维持一定的净流入率外,绝大多数省份的净流出率都在下降,该特征塑造了北京“一城独大型”、长三角“多向联系紧密型”和广东“多源汇聚型”的跨区域流动圈及东北、西北和西南地区内部联系的增强;乡—城的净流动在沿海呈现为北京和天津净流入率齐降以及自江苏至海南有较高净流入率的“此消彼长”特征,而新疆和辽宁净流入率的上升则分别引发了邻近青海、内蒙古和黑龙江、吉林人口的进一步流失,该变化刻画了京津冀、长三角、广东和福建沿海流动圈连绵成带与变动各异的双重特性,以及新疆和辽宁流动圈的发育;这两类流动人口空间格局的演变源于同一流动人口类型的流入人口和流出人口10年间相对关系的变动以及相同户籍属性的不同流动人口类型间的转变。③ 城—城和乡—城流动人口与区域经济发展关系的计量结果显示,区域经济发展对两类人口流动的影响都显著为正的作用随着时间的推移在加强,当加入流动存量后其对城—城流动的促进作用下降,而在乡—城流动中则仍扮演首位作用;城—城和乡—城人口流动对全国经济发展、净流入对流入地经济发展为促进作用,而两类人口的流入与流出对流出地的影响则未得到验证。
基于上述结论并结合计量模型控制变量的变动,拟开展3个方面的政策讨论。① 把握城—城和乡—城流动人口的不同特点并分类施策。对于乡—城流动人口,应以创设更多就业机会和增加收入为前提,并在教育、医疗、住房等提供更包容与可及的均等化公共服务,回应他们的生活和发展需要,而对于城—城流动人口则还需在优质的社会发展和舒适性上提供更好的服务,满足其个性化和自我发展需求。② 理解城镇化中后期人口流动的重要转变,加快城镇体系空间布局优化。城镇化中后期的人口流动已不再是单一的乡—城流动形式,城—城流动越来越活跃的特征在日益凸显,伴随地区内城市间高快速交通网络、通信设施和公共服务等一体化水平的发展,预计未来城—城流动的规模和强度都将进一步增强,作为城—城流入重点地区的沿海三大城市群以及重要潜力区的西北、西南和东北等地,应发挥城市群和都市圈在吸引人口流入的优势,适时优化城镇体系空间布局,促进人口在不同规模、等级和功能城镇间的合理分布,引领其高效集约发展。③ 流入地和流出地均应发挥“人”作为创新主体的作用,在城镇化和经济发展方面实施针对性举措。表4中控制变量弹性系数的变动提示,创新已成中国经济发展的主驱动力,未来流入地应完善在研发投入、各类技能型人才的培养与引进等的制度建设并提供相应的配套政策,而流出地则需营造适合于产业转移和人口回流的良好环境,将投资与创新有效配合来推进本地的城镇化与经济发展。
囿于篇幅,本文仍有一些话题尚待展开。①“人户分离”人口作为一个存量概念,其变动反映的是流动规模或比例累积的增减,而基于该口径计算的流动率,严格意义上也只反映该状态的人口占总人口的比重,相比于具有真实空间变动概念的“迁移率”指标有局限,但在中国特有的制度背景下,作为10年间的存量数据,这一概念及相关数据在揭示中长期尺度的人口流动及其变动仍有其作用。② 尽管两次普查对城、乡属性均采用2008年国家统计局《统计上划分城乡的规定》为划分标准,但同一流入地可能在两次普查之间存在乡转变为城或城转变为乡的情况,而出现样本流入住址未变而流动类型的变化,导致对各类型流动特征及其变化的认知偏差,这一问题将在有更精细数据的支撑下开展定量评估工作。
参考文献
Research on the urban-rural integration and rural revitalization in the new era in China
中国新时代城乡融合与乡村振兴
Spatio-temporal evolution of migration in China from 1995 to 2015
DOI:10.11821/dlxb202202010
[本文引用: 2]

Based on the data of usual residence from 2000 and 2010 censuses and 1995 and 2015 micro-censuses and using the method proposed by Abel G. J., this paper estimates the O-D migration flows among prefectural-level administrative units in China for the period 1995-2015. By using the indicators of migration flows and migration rates, and the methods of GIS spatial analysis and community detection in social network analysis, it further reveals the characteristics of spatio-temporal evolution of migration in China since 1995. The results can be summarized as follows. (1) The scale and intensity of migration in China have been increasing, while their differences among regions have been gradually decreasing. This suggests that migration has experienced a gradual transformation from a "low-activity era" including a limited number of regions to a "high-activity era" involving the majority of regions. (2) Six regional types of migration among prefectural-level administrative units, namely, large-scale active net in-migration, small-scale net in-migration, large-scale active net out-migration, small-scale active net out-migration, active balanced migration and inactive migration, are identified. The spatio-temporal evolution characteristics of the regional types of migration in China indicate that each active migration regional type has been undergoing a change of continuous diffusion, while the inactive migration regional type has seen a significant reduction over time. (3) The spatial patterns of migration are quite different between regions on both sides of "Hu Line", manifested in the fact that the scale and intensity of migration flows on the southeastern side of the line is higher than that on the northwestern side, which means that the "Hu Line" is quite stable and robust in the last 20 years. (4) Patterns of migration flows indicate that while intra-provincial migration has continuously strengthened, inter-provincial migration has exhibited more complicated spatial patterns, mainly reflected in different changing trends of attractiveness to migrants among the three coastal city clusters, and the increasing migration flows within southwest China. As a result of combined effects of inter- and intra-provincial migration flows, the structure of migration flows in China's eastern, central and western regions has been undergoing changes, resulting in the internal differentiation of urban agglomerations and the declining spatial scope under their influence in the coastal areas, Hubei as the single independent "city community" in central China, as well as the relative stability in northwest China and continuous change in southwest China.
1995—2015年中国人口迁移的时空变化特征
DOI:10.11821/dlxb202202010
[本文引用: 2]
本文利用人口普查数据,估算了1995—2015年中国地(市)间人口O-D迁移流和迁移率,结合GIS空间分析和社会网络分析方法,揭示了20年间中国人口迁移的时空变化特征。研究发现:① 中国人口迁移由相对不活跃、局部地区参与的“低活性时代”,逐步走向相对活跃、绝大多数地区参与的“高活性时代”。② 人口迁移地域类型的时空演化过程呈现出各活跃型地(市)不断扩散,而非活跃型地(市)大幅缩减的特点。③ 人口迁移网络以“胡焕庸线”为界,东、西两侧迁移流“东密西疏”且差异悬殊,这一空间格局具有很强的稳定性和顽健性。④ 在人口省内迁移持续增强,以及跨省迁移中沿海三大城市群吸引力的“此消彼长”和西南地区吸引力不断增强的背景下,东中西部地区的人口迁移流场结构表现为:沿海地区主要城市群内部分化和影响范围减弱,中部地区(除湖北省)未能演化出以省为单元的独立社区,西部地区则是西北相对稳定而西南持续变动。
Migration transition in China
中国人口的迁移转变
A comparative study on four types of floating population
四类流动人口的比较研究
China's inter-provincial population flow based on the interaction value analysis
DOI:10.11821/dlyj201809015
[本文引用: 1]
Based on the national census data of 2000 and 2010 as well as population sample survey of 2005 and 2015, this article utilizes the interaction value to analyze the dynamics of floating population in China. The analysis of "population floating system" demonstrates that: (1) Floating population shows great aggregation, in which exist several "population floating systems". (2) The development of the Yangtze River Delta and the Bohai Economic Rim has witnessed the northward trend of the floating population. (3) The improving inter-provincial connections among the western region has gradually strengthened its importance in China since 2010. In addition, the unidirectional interaction value can not only indicate the scale of the population flows but also explain their directions: (1) The largest unidirectional interaction flow occurs mainly between provinces in eastern China and those in central or western China which are exporters of labor forces. Even though eastern China gathered most of the floating population, some provinces have gradually lost their dominance in attracting population from central and western China. (2) The floating population in China presents a "asymmetric bilateral pattern". With the decline of the three major population centers, return flows have become remarkable. (3) Some sub-centers of floating population emerged in the central and western regions, though they are still developing. (4) Population nearby floating has become increasingly prominent in the western region. According to the analysis above, population research can benefit from the interaction value model by considering the inter-provincial population flows among the whole system and presenting their directions. Meanwhile, making comparison of population flows between 2010-2015 for a better understanding of the new characteristics and patterns of floating population is meaningful in formulating population policies and promote regional coordination.
基于相互作用关系的中国省际人口流动研究
DOI:10.11821/dlyj201809015
[本文引用: 1]
基于2000年、2010年人口普查及2005年、2015年人口抽样调查数据,采用相互作用关系模型计算了中国“人口流动系统”和“单向相互作用关系值”。结果表明:① 人口流动具有明显的凝聚性,东部地区对流动人口的吸引力依然具有绝对优势;② 省际人口流动呈“非对称双向迁移模式”,人口回流的趋势已不容忽视;③ 长三角地区逐渐代替珠三角成为新的人口流动中心,人口流动开始北移;④ 中西部地区的人口流动分中心某种意义上已经出现,人口就近转移日渐凸显。将2010-2015年间省际人口流动新规律和特征与1995-2010年进行动态对比,对于制定未来人口和区域发展政策,继续缩小东西部地区之间的差距,最终实现区域协调发展具有重要意义。
Changes in the form of population migration and mobility in China and corresponding policy responses at the late-intermediate stage of urbanization
DOI:10.18306/dlkxjz.2020.12.008
[本文引用: 1]
The form of population migration and mobility constitutes a key element of the characteristics of migration. Since China has entered the late-intermediate stage of urbanization, it is very important to accurately identify and understand the transformation in the form of population migration and mobility. While a growing body of literature has been generated and significant progress has been made on China's population migration and mobility and its determinants, an important inadequacy of relevant research are often focused on rural to urban population migration and mobility, neglecting the multi-dimensional forms of population migration and mobility. Based on relevant theories and international experience relating to the transformation in the forms of population migration and mobility, and using data from the China Migrants Dynamic Survey (CMDS), Report on Monitoring and Investigation of Migrant Workers in China, and relevant statistics, this study examined the processes of the transformation in the forms of the population migration and mobility in China and their characteristics at the present stage and the issues and challenges arising therefrom. The results show that there have been significant changes in the forms of population migration and mobility in China, and such changes mainly manifest in the following aspects: First, there has been a steady increase in return migration and short-distance migration; Second, inter-urban migration has also significantly increased and become increasingly common; Third, the urbanization process of the floating population based on the rural-urban transfer of their hukou has started to accelerate, and their rural-urban multiple livelihoods has increasingly shifted towards the urban end; Fourth, there has been a developing trend of urbanization driven by housing purchases in both migrants' places of origin and destination. The study also identified issues and challenges in the process of transformation in the forms of population migration and mobility, including: First, there is a lack of sustainability in in situ urbanization promoted by return migration; Second, urban-urban migration are highly concentrated in a few provinces of the eastern region; Third, there are still many obstacles for the urbanization of rural migrants based on their hukou transfer. Finally, the article puts forward some policy recommendations from the perspectives of the construction of multi-level spatial system of urbanization of the floating population, the transformation of urban governance mode, and the promotion of the capacity for sustainable development of small towns in central and western regions.
城镇化中后期中国人口迁移流动形式的转变及政策应对
DOI:10.18306/dlkxjz.2020.12.008
[本文引用: 1]
人口迁移流动形式是构成人口迁移流动特征的一个关键要素。在中国进入人口城镇化中后期后,准确判断和把握人口迁移流动形式的转变是一项十分重要的工作。论文基于人口迁移流动形式转变的相关理论与国际经验,考察现阶段中国人口迁移流动形式转变的进程和特点及由此产生的问题与挑战。研究发现,中国人口迁移流动形式已发生转变,并突出表现为人口回流现象不断增多、省际和省内人口迁移流动此消彼长的趋势日益明显;城—城流动显著增加,人口的城-城间流动将渐成常态化;流动人口户籍城镇化进程开始加快,其城乡两栖生计的重心向城镇转移;住房驱动下的流动人口就地、异地城镇化渐成趋势等。同时,人口迁移流动形式转变过程中面临着人口回流推动的就近就地城镇化发展可持续性不足;城—城流动向东部少数省市聚集的态势明显;以户籍城镇化主导的农业流动人口市民化面临多重障碍等问题与挑战。最后,从流动人口城镇化的空间载体构建、城市治理方式转变、中西部小城镇自我可持续发展能力提升等方面提出相应的建议。
Analysis on the spatial structure of inter-provincial migrant in China
中国省际人口流动的空间结构特征研究
An empirical analysis of the causes of inter-provincial urban-rural migration in China: Evidence from the 6th population census
中国省际城乡人口流动成因的研究: 基于第六次人口普查数据
The spatial pattern of China's non-hukou migration: An analysis based on the dual perspective of regional difference and urban-rural gradient
区域差异和城乡梯度双重视角下的中国流动人口迁移空间模式
The laws of migration
DOI:10.2307/2979181 URL [本文引用: 2]
Modeling interprovincial migration in China, 1985-2000
DOI:10.2747/1538-7216.46.3.165 URL [本文引用: 2]
Increasing internal migration in China from 1985 to 2005: Institutional versus economic drivers
Inter- provincial migration and its determinants in the 1990's China
中国省际人口流动的机制研究
China's inter-provincial migration patterns and influential factors: Evidence from year 2000 and 2010 population census of China
中国省际人口迁移区域模式变化及其影响因素: 基于2000和2010年人口普查资料的分析
Spatial distribution, flowing rules and forming mechanism of inter-cities floating population in China
DOI:10.11821/dlyj020180280
[本文引用: 5]
The population flow between cities not only reflects the choice of the urban population who voted with their feet based on different development levels of urban economy, society, and public services, but also exerts a direct bearing on the success of rational and orderly movement of population, coordinated development of large, medium and small cities and the new-type urbanization strategies. Therefore, it is of practical significance to explore the spatial flowing laws and driving mechanism of urban-to-urban population flows in China for realizing rational and orderly distribution of population and the new-type urbanization strategy. In the context of the increasing amounts of urban-to-urban floating population in China, this paper discusses the results, processes, and causes of the spatial mobility of floating population in urban areas based on data of population census and dynamic monitoring of floating population. In addition, it studies the spatial distribution, flow trajectory and forming mechanism of urban-to-urban floating population. This paper uses Arcgis to visualize the spatial distribution and main flow trajectories of inter-cities floating population, then uses regression equations to analyze the main factors driving population movement between cities. The results of this paper indicate that the urban-to-urban floating population tends to flow to developed regions and metropolises, during the process of which the proximity of destination is considered; gaps among regions in terms of economic development, employment opportunities, and high levels of education and medical facilities are the internal impetus to the flow of urban-to-urban floating population, while comprehensive consideration will be given to obstacles such as money costs and psychological pressure generated by space friction; at the same time, the existing urban-to-urban floating population will reduce the flow costs, and stimulate the flow of urban-to-urban floating population according to existing routes by reducing the cost of inflows, and providing living and employment information. According to the stage division of population flow in the developed countries, it is discovered that the population movement in China is still transforming from the stage where people move from small cities and towns to metropolises. At this time point, the government should encourage the flow of population to large cities according to the natural law of population movement, decentralize the functions of the central area through the development of sub-centers and satellite cities, and promote the development of urban suburbanization, which are in line with the natural logic of urban development.
中国城城流动人口的空间分布、流动规律及其形成机制
DOI:10.11821/dlyj020180280
[本文引用: 5]
在人口城城流动日益成为中国人口流动的重要形式背景下,基于人口普查数据和流动人口动态监测数据,分别探讨城城流动人口空间流动的结果、过程和成因,也就是探讨城城流动人口的空间分布、流动轨迹及形成机制。研究表明:城城流动人口倾向于向发达地区和大城市流动,同时在流动过程中会考虑空间的邻近;地区间经济发展水平、就业机会以及高水平教育医疗设施的差距是诱发城城人口流动的内在动力,而在实际的流动过程中会综合考虑由于空间摩擦而产生的金钱成本、心理压力等障碍;同时,已有城城流动人口存量会通过减少适应流入地的成本、提供相应的生活和就业信息等方式降低流动成本,刺激城城流动人口按照已有路径流动。借鉴西方发达国家人口流动的阶段划分,认为中国人口流动仍然处于从小城镇进入大城市的阶段。在这一时间节点上,依据人口流动的自然规律,鼓励人口向大城市流动,并通过发展副中心和卫星城等形式疏散中心区功能,推动城市郊区化发展才符合城市发展的自然逻辑。
Study on inter-provincial migration's influence on regional economy development in China
中国省际人口迁移对区域经济发展作用关系之研究
Empirical analysis on impacts of migration with and without hukou change on China's provincial economy
Based on the preliminary investigation of spatial and temporal patterns of migration with and without hukou(i.e.,the household registration system)change and drawing on panel data in the past ten years,this paper uses random coefficient models to examine the impacts of migration on provincial economy growth in China.Analytical results show that:(a) migrations with hukou change across regions have been relatively stable,while migration without hukou change has increased rapidly and continuously since 2000 with extreme disparities across provinces;(b) the migration and mobility of the population is a Pareto improvement for China’s overall economy;(c) hukou in developed areas plays a role as the hourglass;(d) for most central provinces and some western provinces with large-size of out-migration,the negative impact of the loss of human capital due to large-scale out-migration on local economy began to come out;although out-migration has in general a positive impact,its contribution to local economic development is not as obvious as we expected.
人口迁移与流动对我国各地区经济影响的实证分析
在对近十年来我国人口迁移和流动的时空演变格局进行初步考察的基础上,文章利用面板数据的变系数模型分别实证考察了人口迁移和流动对我国各地区(省域)经济的影响。结果发现:(1)我国各地区间人口迁移相对平稳,而人口流动在2000年以后呈现出持续快速增长的态势,且空间流向极不均衡;(2)人口的迁移和流动对中国整体经济来说是一个帕累托改进;(3)户籍制度对于发达地区起到了人才沙漏的作用;(4)对于中部的绝大部分地区以及西部的一些人口输出大省,伴随人口迁出而引起的人力资本流失对当地经济的负面影响开始凸显出来,人口流出虽然基本出现一个正面影响,但对本地经济发展的贡献并不如我们预想的那么明显。
Internal migration and regional economic growth convergence: Panel data analysis of China (1980-2010)
中国人口流迁与区域经济增长收敛性研究
Effects of brain drain on human capital accumulation in labor emigrating regions
人口流动对输出地人力资本影响研究
Empirical analysis on the economic impacts of interprovincial out-migration in central region of China
中部地区省际人口流出对流出地经济影响的实证分析
The effect of inter-regional migration on economic growth and regional disparity
区域间劳动力迁移对经济增长和地区差距的影响
Spatial statistics and regional types evolution of China's county-level floating population during 1982-2010
DOI:10.11821/dlxb201712002
[本文引用: 1]
County-level units, which contain both counties and county-level cities, are the key floating population regulating units for China's new urbanization policy. This paper examines the statistical definitions of floating population for the censuses in 1982, 1990, 2000 and 2010. According to the principle of geographic data transformation among different spatial scales, the numbers of both the in-migrants and out-migrants at county level are calculated for each census. And the county-level spatial database of floating population is also built up. Besides, this paper puts forward a modified composite-index method to identify six types of the regional types of floating population, namely, large-scale active net in-migration, small-scale net in-migration, large-scale active net out-migration, large-scale active net out-migration, active balanced migration and inactive migration. Using this method, we analyze the spatial pattern evolution of China's floating population. The main results are listed as follows. (1) The regional types pattern of floating population transferred from inactive domination into active domination and from relative equilibrium into high polarization. Many regions turned into active net out-migration types. Most of the floating population moved into just a few cities which belongs to active net in-migration type. There were only 51 large-scale active net in-migration cities, but they occupied 55.85% of total inter-county in-migrants in China. (2) The spatial pattern of China's floating population regional types also presented a polarized feature. The Yangtze River Delta urban agglomeration and Pearl River Delta urban agglomeration in southeast coastal China are the main in-migrant floating population cluster regions, while Beijing, Tianjin and other provincial capitals are also main migration destinations with a monocentric pattern. The active net out-migration regions are mainly located in regions south of the "Qinling Mountains-Huaihe River" Line to the southeast of "Hu Line", which became the largest population losing area in China. (3) Social-economy was the major factor affecting the distribution of floating population regional types. Administration factor also gradually became a leading factor.
1982—2010年中国县市尺度流动人口核算及地域类型演化
DOI:10.11821/dlxb201712002
[本文引用: 1]
县市是中国新型城镇化发展过程中调控流动人口的重要单元。本文系统梳理了1982年、1990年、2000年、2010年四期人口普查的流动人口统计口径,根据地理流数据的空间尺度转换原则,核算四期人口普查县市尺度的流入人口和流出人口,构建对应的流动人口空间数据库。并提出新的修正复合指标法,划分出6种流动人口地域类型,包括大规模净流入活跃型、小规模净流入活跃型、大规模净流出活跃型、小规模净流出活跃型、平衡活跃型、非活跃型,据此分析中国流动人口地域类型的演化格局。主要结论为:① 中国流动人口地域类型经历了从不活跃到活跃、从相对均势到高度极化的演化过程,大部分地区逐步转化为净流出活跃型,流动人口向少数净流入活跃型县市集聚,51个大规模净流入活跃型县市集聚了全国55.85%的流入人口。② 中国流动人口地域类型在空间格局同样呈现高度极化的演化过程,形成长三角地区、珠三角地区2个流入人口高度集聚区,京、津及其他省会或首府等大城市则呈现单核式吸纳流入人口,净流出活跃型在“胡焕庸线”东南侧的“秦岭—淮河”以南地区呈现大面积扩张,成为中国最大的流出人口源区。③ 社会经济因素逐步成为影响流动人口集疏的主导因素,行政等级因素的作用也愈发突出。
Spatial evolution of economic development at county level in Jiangsu based on multivariate drive
The present research on the evolution of regional spatial pattern has focused less attention to the interaction relationship between the spatial pattern variable and its influencing factors. This paper aims to establish a variable-relationship model of economic development at county level in Jiangsu from 2000 to 2010, and uses the ESDA analysis model to conduct a study on the evolution process of its spatial pattern. The conclusions can be drawn as follows: (1) The spatial association features of all variables in the regional pattern evolution tend to be more remarkable, but different variables differ from each other in spatial differential features in different periods. (2) The ESDA detects that the variables in economic development and its influencing factors have different spatial corresponding degrees in the evolution process, which indicates different probable potential relationships between them. Furthermore, quantile regression gives different marginal effect degrees of different influencing factors on the economic development during 0.1~0.9 quantile points, which confirms the existence of the relationship mentioned above. (3) The result achieved by quantile regression optimal fitting reveals the evolution pattern of regional economic development is featured by the following aspects. Firstly, a "layered structure" of the "Suzhou-Wuxi" core hotspot and the "Huaian-Suqian" core coldspot will be formed. Secondly, the evolution pattern exhibits a greater evolution differentiation trend in low value cluster than in high value cluster, which manifests the prominent inland characters of core coldspot areas and the prominent coastal characters of sub-core coldspot areas. Lastly, the boundary of high and low value clusters is generally stable in the central Jiangsu. The results obtained above show that the evolution pattern of regional economic development by quantile regression optimal fitting has a high consistency with the realistic spatial evolution pattern.
多变量驱动的江苏县域经济空间格局演化
针对现有区域空间格局演化对影响要素及其作用关系研究缺失的问题,本文通过分位数回归建立江苏省2000-2010 年县域经济的变量关系模型,并在结合ESDA空间关联模型的基础上对其空间演化格局进行研究,得出以下结论:① 变量揭示的区域格局演化的空间关联特征有强化的表现,但不同变量在不同时段分异特征不同。② ESDA探测发现经济发展与变量演化过程可能的潜在关系不同而出现不同类型区空间对应程度的差异,分位数回归给出了不同变量对不同分位地区边际效应影响程度不同的细致信息,从而证实了上述关系的存在。③分位数回归最优拟合值揭示区域经济演化格局与实际吻合度较高,即形成“苏锡”核心热点区和“淮宿”核心冷点区的“圈层结构”,且低值簇内部的演化分异趋势大于高值簇而表现出核心冷点区显著的“内陆化”与次核心冷点区的“沿海化”特征,“高值簇”与“低值簇”分界线一直稳定于苏中地区。
