

1 引言
生态系统服务是人类直接或者间接从生态系统功能中获得的产品和服务,对于地球生命支持系统的运转不可或缺[1],是人类社会赖以生存和发展的基础。由于人类活动对生态系统的干扰日益加剧,生态系统服务功能不断衰减[2]。通过近20年生态保护和修复,中国各类自然生态系统恶化趋势基本得到遏制,重点生态功能区生态服务功能稳步提升,国家生态安全屏障骨架基本构筑[3]。然而,中国自然生态系统总体仍较为脆弱,部分地区重发展、轻保护所积累的矛盾愈加凸显[4-5]。中国在不同区域的生态建设目标与生态保护重点各不相同,导致在实际研究生态系统功能问题上,研究人员往往会根据生态系统服务和资源环境条件的空间分异规律,对区域生态系统功能区进行划分[6]。中国对于生态系统稳定性的研究起步较晚[8],黄建辉[9]、柳新伟等[10]最早对生态系统稳定性进行了理论阐述,陈集景等[11]综述了陆地生态系统稳定性的定义、空间格局及其影响机制,并提出目前研究存在的一些问题,此外针对一系列区域生态环境稳定性的评价模型[12]和评估方法[13-14]也为区域生态空间结构的调整和管控提出了策略。生态系统功能的好坏对维护生态系统的稳定性至关重要,但很少有学者从定量的角度评估生态系统功能的稳定性,如何促进区域生态质量和服务功能的稳步提升,全面构筑生态安全屏障,仍是今后较长时期生态保护和修复的核心目标。
青藏高原作为全球生物多样性保护热点地区和全球气候变化的敏感区,是中国乃至亚洲水资源的战略要地以及生态安全屏障的战略高地[15]。对于青藏高原生态功能,现有研究往往局限于某一种服务功能[16]或是某一典型区域服务功能的评估,比如三江源[17-18]、那曲市[19]、长江源区[20]、玉树州[21]等。然而,由于缺乏长时间序列上青藏高原生态系统主要功能及其变化的分析,难以全面掌握高原生态系统功能的整体状况,难以明晰生态系统功能重要性及稳定性变化,不利于深入地生态保护和修复,并且目前对青藏高原生态系统功能重要性和稳定性研究也并不多见。水源涵养、土壤保持、防风固沙、碳固定和生物多样性保护是青藏高原生态安全屏障的主要功能[15,22],故而本文基于水源涵养、防风固沙、土壤保持核心功能量化估算及时空变化分析,评估其生态系统功能及重要性、稳定性,并对青藏高原具有重要生态系统功能的生态系统进行分区,研究结果可为青藏高原生态系统功能维护、不同区域生态系统的保护与修复提供必要的科学支撑,对青藏高原地区的可持续发展至关重要。
2 数据与方法
2.1 研究区域与数据来源
本文的数据来源如下:
(2)土壤数据。1∶100万土壤类型图所附的土壤属性表和空间分布数据来源于西部环境与生态科学数据中心,采用Nomo图法估算得到土壤可蚀性因子。
(3)气象数据。在中国气象科学数据共享服务网(
(5)自然保护区与生态保护和修复重大工程数据。自然保护区数据来源于中国科学院资源环境科学数据中心全国自然保护区边界数据,生态保护和修复重大工程数据收集来源于国家林业和草原局政府网(
2.2 生态功能量化方法
2.2.1 水源涵养功能量化
本文利用改进参数的降水贮存量法估算青藏高原森林、草地、湿地等的水源涵养量,该方法适用于较大时空尺度生态系统水源涵养量的估算,具体参数改进与计算过程详见参考文献[31]。
2.2.2 土壤保持功能量化
利用土壤保持量评估土壤保持功能变化,该指标为没有植被覆盖状况下潜在土壤侵蚀模数与现实状况下土壤侵蚀模数的差值[32]。计算公式如下:
式中:
2.2.3 防风固沙功能量化
防风固沙是生态系统通过其结构与过程减少风蚀导致土壤侵蚀的作用[34],主要与风速、土壤、地形和植被等因素密切相关,本文用防风固沙量作为防风固沙功能服务的评估指标,该指标为裸土条件下的潜在风蚀量与有植被覆盖条件下实际风蚀量的差值。计算公式如下:
2.3 生态功能评估方法
2.3.1 生态功能重要性评估
生态系统功能受人类活动影响,同时也与人类的自身利益息息相关,因此本文依据《生态保护红线划定指南》[34]中的生态系统功能重要性评估方法对主要生态功能进行了重要性识别,以水源涵养功能为例,对归一化的水源涵养功能量进行从高到低排序并计算累加值,将累加的水源涵养功能量占其功能总量比例50%与80%所对应的栅格值作为生态系统功能评估分级的分界点,根据这两个分界点,在ArcGIS中将水源涵养功能重新划分为极其重要区域、重要区域和一般重要区域3个级别,极重要区域为生态功能的核心区域。
2.3.2 生态功能变化趋势分析
采用最小二乘法来计算水源涵养、土壤保持和防风固沙的年变化趋势,计算公式如下:
式中:
生态系统是形成各类功能的载体,然而不同生态系统数据存在一定的差异,因此本文对于不同生态系统功能变化研究仅考虑LUCC和CLCD以及GLobeland30数据在2010年分类完全一致的区域。
2.3.3 生态功能稳定性评估
生态系统稳定性指数公式如下:
式中:
根据生态系统功能稳定性分布特点,采用等间距分割法对每个生态系统功能稳定性进行分类,当ESI > 95时,生态系统功能稳定性为极稳定,ESI在85~95时为稳定,ESI在75~85为弱稳定,ESI在65~75为不稳定,ESI < 65为极不稳定。将各生态系统功能稳定性与CLCD数据2000—2020年来不变的生态系统类型进行综合制图,得到各生态系统功能的稳定性类型,其中A、B、C分别表示水源涵养、土壤保持、防风固沙功能,a、b、c则表示生态功能稳定性为弱稳定、稳定、极稳定,I~V依次代表农田、森林、草地、湿地、荒漠生态系统类型。
2.4 生态系统功能分区方法
中国在国家生态安全格局构建上,日渐形成了以自然保护区为核心,重点生态功能区、生物多样性保护优先区为重要补充的自然保护地体系[37]。因此,本文基于青藏高原各功能核心区域分布、稳定性评估的类型以及生态系统类型,将自然保护区作为重要区域、青藏高原生态保护和修复重大工程区域作为具有生态问题并重点需要修复区域,再结合不同的地理单元、行政单元的特点将青藏高原划分为3大类16个区域:A1~A6是以水源涵养为核心的生态系统功能区,B1~B5是以土壤保持为核心的生态系统功能区,C1~C5是以防风固沙为核心的生态系统功能区。然后针对不同的类型ABC、不同的地理单元(1~6)以及其核心生态功能定位、面临的主要生态问题等,确定不同区域需采取不同的措施,比如针对气候变化敏感的应对或适应措施、针对人类开发建设的修复措施、针对草原湿地退化的生态保护措施、针对生态资源的资产管理措施等。
3 结果分析
3.1 生态系统宏观格局变化
2000—2020年青藏高原湿地生态系统面积显著增加,约增加2079.4~11769.8 km2,草地生态系统面积明显减少,约减少2194.7~9807.9 km2(表1)。2000—2010年与2010—2020年相比,草地面积呈现明显的持续减少趋势,湿地面积呈现显著地持续增加趋势。由于不同来源生态系统类型数据的差异,农田、森林的面积变化趋势差异较大,以减少为主。
表1 2000—2020年青藏高原生态系统类型面积变化(km2)
Tab. 1
| 年份 | 数据源 | 生态系统类型 | ||||||
|---|---|---|---|---|---|---|---|---|
| 农田 | 森林 | 草地 | 湿地 | 城镇 | 荒漠 | 其他 | ||
| 2000—2010年 | i | -147.4 | -154.2 | -715.7 | 602.5 | 432.1 | -52.9 | 36.2 |
| ii | -516.6 | 4546.6 | -1441.5 | 7705.5 | 47.1 | -18980.8 | 8639.7 | |
| iii | -75.9 | 241.7 | -36284.7 | 7197.6 | 202.0 | 21188.9 | 7534.0 | |
| iv | -420.5 | -3249.8 | -16470.0 | 1722.4 | 6.2 | 16458.5 | 259.6 | |
| 2010—2020年 | i | -130.5 | -106.1 | -1478.9 | 1476.9 | 591.8 | -553.2 | 201.6 |
| ii | -939.2 | 2499.9 | -1748.5 | 4064.2 | 24.8 | 6901.9 | -10803.3 | |
| iii | 3885.9 | -294.9 | -83176.1 | 7741.2 | 2038.7 | 56565.5 | 13241.2 | |
| iv | -269.1 | -10938.3 | -214780.0 | 7247.4 | 2.2 | 47699.7 | -5776.2 | |
| 2000—2020年 | i | -277.9 | -260.4 | -2194.7 | 2079.4 | 1024.0 | -606.1 | 237.8 |
| ii | -1455.9 | 7046.6 | -3190.0 | 11769.8 | 71.9 | -12078.9 | -2163.6 | |
| iii | 3810.0 | -53.3 | -9807.9 | 3815.4 | 2240.7 | 77754.4 | 20775.2 | |
| iv | -689.6 | -14188.1 | -231250.0 | 8969.8 | 8.4 | 64158.2 | -5516.6 | |
3套数据在2000年、2010年、2020年的生态系统类型一致的区域面积分别占高原面积的59.9%、59.8%、52.7%。结果表明,青藏高原农田、草地、森林面积皆呈减少趋势,而湿地、城镇、荒漠面积都有不同程度的增加(图1)。
图1
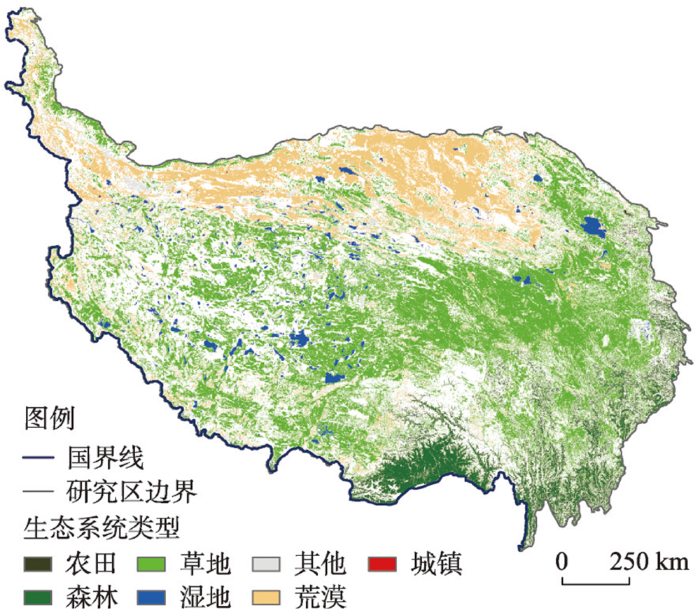
图1
2020年青藏高原不同数据源类型一致的生态系统空间分布
注:基于自然资源部标准地图服务网站GS(2020)4630号标准地图制作,底图边界无修改。
Fig. 1
Spatial distribution of ecosystems with different data source types in the Qinghai-Tibet Plateau in 2020
3.2 生态系统功能及时空变化
3.2.1 生态系统功能分布特征
2000—2020年青藏高原生态系统功能物质量中,水源涵养量约1186.98亿m3/a,单位面积水源涵养量约459.38 m3/(hm2·a),整体呈现东南部高、西北部低,自东南部向西北部逐渐降低的空间分布特征(图2a),水源涵养功能的极重要与重要区域主要分布在藏东南,分别占青藏高原面积的比例为12.7%、24.6%(图2d)。土壤保持量约为127.98亿t/a,单位面积土壤保持量约49.60 t/(hm2·a),高值多分布于高原南部(图2b),土壤保持功能的极重要与重要区域占比为13.9%、22.0%(图2e)。防风固沙量为20.34亿t/a,单位面积约8.29 t/(hm2·a),高值集中于高原中部而低值多出现在西北部和东南部(图2c),极重要与重要区域主要位于中西部(图2f),对应面积占比分别为14.2%与25.4%。
图2
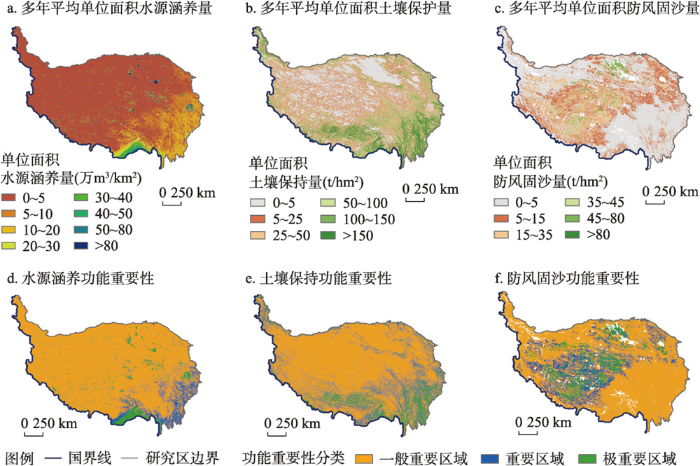
图2
2000—2020年青藏高原生态系统水源涵养、土壤保持、防风固沙功能的多年平均单位面积物质量及其重要性分类的空间分布
Fig. 2
Spatial distribution of annual mean mass per unit area and its importance classification of water conservation, soil conservation, windbreak and sand fixation functions in the Qinghai-Tibet Plateau ecosystem from 2000 to 2020
作为“亚洲水塔”,青藏高原生态系统水源涵养生态系统功能核心区集中分布在藏东南林区、三江源区、高原中部那曲地区,生态系统土壤保持功能核心区主要分布于高原东部、一江两河、及西北角区域,防风固沙功能核心区域则位于藏北羌塘高原、柴达木盆地以及共和盆地等荒漠地区。
3.2.2 生态系统功能时空变化
2000—2020年青藏高原生态系统水源涵养功能量整体呈现波动中上升趋势,年变化率为3.57 m3/(hm2·a)(图4a)。森林的水源涵养功能量远高于其他生态系统类型,且呈不断上升趋势,草地水源涵养功能量基本不变,湿地水源涵养功能量则呈轻微下降趋势(图4b)。2000—2020年生态系统土壤保持功能量整体呈波动中下降趋势,年变化率为-0.16t/(hm2·a)(图4d)。2000—2020年森林土壤保持功能量不断波动但整体基本不变,远高于其他生态系统类型,草地土壤保持功能量呈轻微下降趋势,荒漠和农田土壤保持功能量变化较小(图4e)。2000—2020年生态系统防风固沙功能量整体呈现波动中上升趋势,年变化率为0.23 t/(hm2·a)(图4g)。草地防风固沙功能量高于其他生态系统类型,在2002年达到最低后呈波动中不断上升趋势,荒漠与农田的防风固沙功能量变化趋势与草地生态系统类型基本一致,而森林的防风固沙功能量基本不变(图4h)。
图3
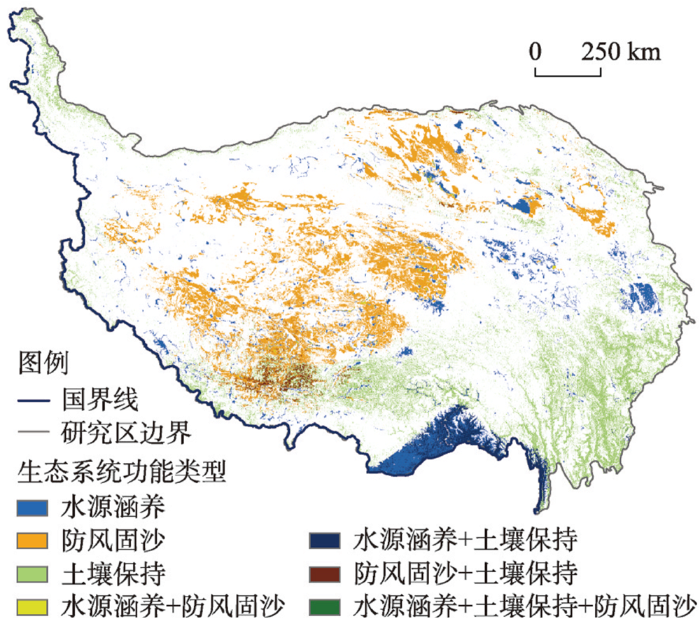
图3
2000—2020年青藏高原重要生态系统功能核心区域分布
Fig. 3
Distribution of functional core regions of important ecosystems on the Qinghai-Tibet Plateau in recent 20 years
图4
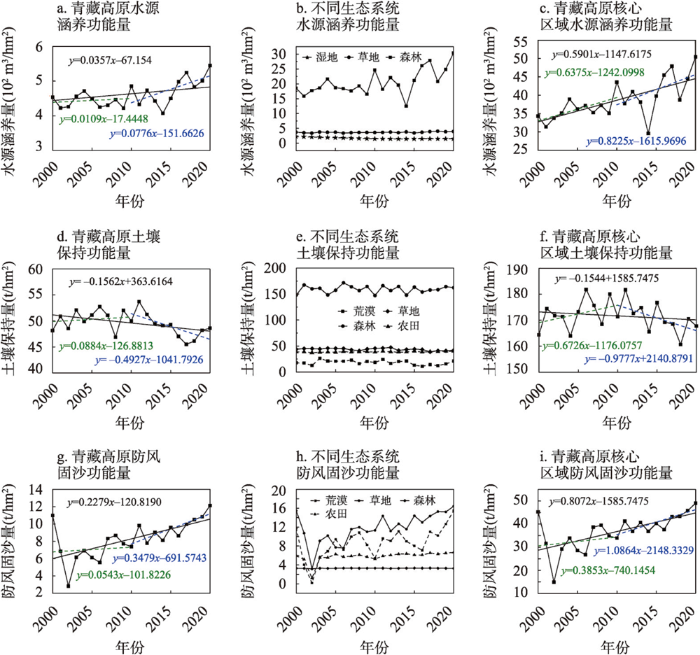
图4
2000—2020年青藏高原水源涵养功能量、土壤保持功能量、防风固沙功能量的年际变化统计
Fig. 4
Interannual variation statistics of water conservation function, soil conservation function, windbreak and sand fixation function over the Qinghai-Tibet Plateau from 2000 to 2020
青藏高原生态系统水源涵养功能核心区以森林为主,藏东南森林水源涵养功能量呈现明显增加趋势,大于100 m3/(hm2·a),高原大部分区域不足10 m3/(hm2·a),而高原东南角和北部的部分区域则呈-10 m3/(hm2·a)的减少趋势(图5a)。2000—2010年高原水源涵养功能量约444.43 m3/(hm2·a),整体呈轻微上升趋势,年变化率约1.10 m3/(hm2·a)。2010—2020年水源涵养功能量约476.69 m3/(hm2·a),呈较为明显的上升趋势,年变化率约7.76 m3/(hm2·a),整体上表现为东南增加、西北减少。土壤保持功能核心区也以森林为主,一江两河区域森林土壤保持功能量呈现明显增加趋势,而高原西北部呈-5 t/(hm2·a)的减少趋势(图5b)。2000—2010年高原土壤保持功能量约50.31 t/(hm2·a),整体呈轻微增加趋势,年变化率约0.09 t/(hm2·a)。2010—2020年土壤保持功能量约48.93 t/(hm2·a),呈明显的下降趋势,年变化率约-0.49 t/(hm2·a),整体上表现为南部增加,西北减少。防风固沙功能核心区则以草地与荒漠为主,柴达木盆地荒漠防风固沙功能量呈现明显增加趋势,大于2 t/(hm2·a),藏北羌塘高原草地防风固沙功能量呈轻微增加趋势,约1 t/(hm2·a),高原大部分区域稳定不变(图5c)。2000—2010年高原防风固沙功能量约7.05 t/(hm2·a),整体呈轻微增加趋势,年变化率约0.05 t/(hm2·a),整体上表现为中西部减少,四周稳定不变。2010—2020年防风固沙功能量约9.44 t/(hm2·a),呈明显的增加趋势,年变化率约0.35 t/(hm2·a),整体上表现为中西部增加,四周稳定不变。
图5
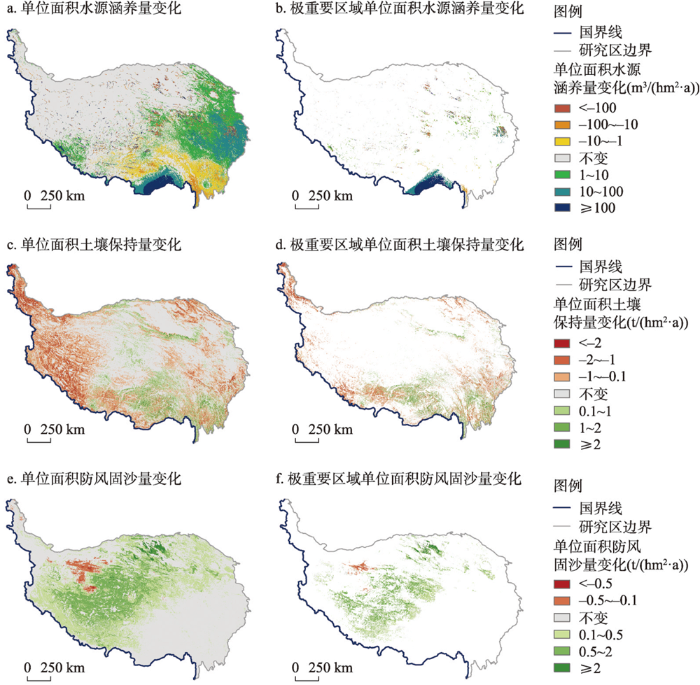
图5
2000—2020年青藏高原水源涵养功能量、土壤保持功能量、防风固沙功能量的时空变化分布
Fig. 5
Spatial and temporal variations of water conservation function, soil conservation function, windbreak and sand fixation function over the Qinghai-Tibet Plateau during 2000-2020
3.3 生态系统功能稳定性分析及分区
图6
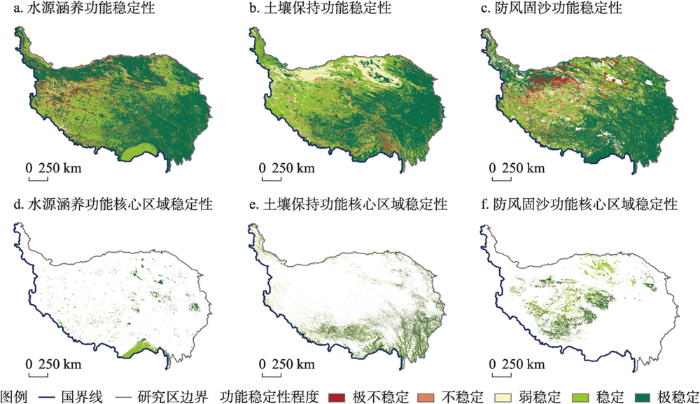
图6
2000—2020年青藏高原水源涵养、土壤保持、防风固沙生态系统功能稳定性分布
Fig. 6
Stability distribution of ecosystem functions for water conservation, soil conservation, windbreak and sand fixation over the Qinghai-Tibet Plateau from 2000 to 2020
图7
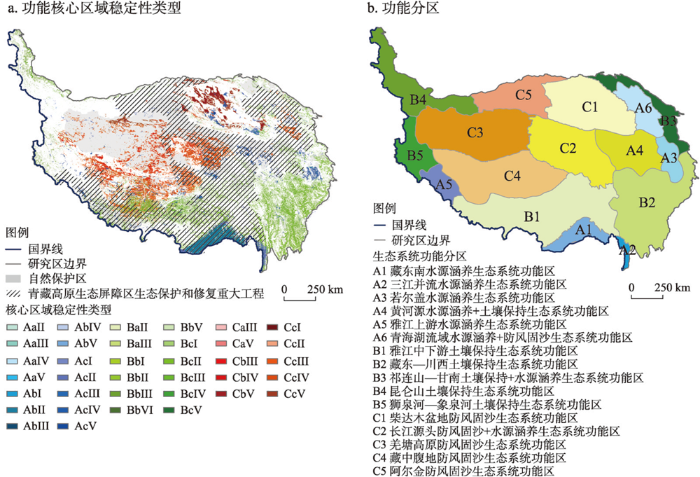
图7
青藏高原生态系统功能分区
Fig. 7
Service function partition of the Qinghai-Tibet Plateau ecosystem
水源涵养生态系统功能区(A):A1、A2以森林为主,核心生态系统功能稳定,以AbⅡ、AcⅡ为主,需要增强天然林保护措施、减少森林破坏以适应气候变化;A3~A5以草地稳定型(AbⅢ)为主,应加强高寒草原综合治理等保护修复措施,其中A3还需强化甘南高寒沼泽湿地保护,A4重点保护扎陵湖、鄂陵湖、冬格措纳湖等黄河源头湿地及野生动植物,A5聚焦雅鲁藏布江上游玛旁雍措等源头湿地;A6为水源涵养叠加防风固沙生态系统功能区,需聚焦青海湖流域强化草原保护修复、沙化土地治理等措施。
土壤保持生态系统功能区(B):B1、B2是以森林和草地为主的核心生态系统功能极稳定区,以BCⅡ、BcⅢ为主,B3是以森林、草地极稳定型为主的土壤保持和水源涵养双重生态系统功能区,应强化天然林和天然草原保护,抑制资源过度利用,提高森林、草原质量,整体提升生态系统功能;B4、B5以草地为主的土壤保持生态系统功能稳定型,需要加强防沙治沙和水土流失治理,遏制草原沙化趋势。
防风固沙生态系统功能区(C):C1、C5以荒漠为主的防风固沙生态系统功能稳定型,应深入加强荒漠化防治,通过调整产业结构提升生态资源的质量和功能;C2以草地为主的防风固沙和水源涵养双重生态系统功能极稳定型,作为长江源需加大河湖保护和黑土滩型退化草原修复,开展沙化土地综合治理,提高草原生产力和生态系统功能;C3、C4以草地为主的防风固沙生态系统功能稳定型,应加强毒害草治理、鼠虫害防治、季节性休牧、生物治沙等措施,以遏制土地进一步退化和荒漠化,加大对中度及以上退化草原草甸修复治理。
4 讨论
(1)本文评估分析得出2000—2020年青藏高原水源涵养和土壤保持生态系统功能呈现自东南向西北逐渐降低的空间特点,这与张顺昌[38]、朱殿珍[39]等的研究结果整体一致,虽然近年来青藏高原的水源涵养和防风固沙能力有所提升,但土壤保持能力却呈下降趋势。这些趋势与青藏高原气候、地形和植被动态变化息息相关[40-41],随着一系列生态保护工程的实施,青藏高原植被覆盖整体状况趋于好转[42],然而青藏高原生态环境本底极为脆弱,草原生态系统面积依旧呈减少趋势,主要受城镇快速发展及人类活动干扰加剧等因素的影响[43⇓-45]。未来需要持续深入跟踪监测并评估草原生态系统总体状况,并且加强退化草原生态系统的修复与可持续管理[46]。对于青藏高原水源涵养、土壤保持以及防风固沙核心功能区,应该着重整体保护,而其他区域需要权衡合理利用自然资源与加强生态保护建设,努力实现经济社会生态效益最大化。
(2)生态系统功能稳定性受气候变化与人类活动共同影响。以往研究表明水源涵养功能与降水、温度等气候因素呈正相关[40,47],青藏高原水源涵养功能在东南部大部分区域均为极稳定,而藏东南林区稳定性相对较弱表现为稳定(图6),该区域水源涵养量在2000—2020年间呈明显增加趋势(图5),并且降水和气温在该区域表现为极不稳定、不稳定(图8),这都增加了水源涵养功能的不稳定性,但该区域实施了藏东南“四江”流域重要地带防护林体系建设、藏东南高山河谷次生林区生态综合治理项目等多项生态保护修复项目取得了明显成效,提升了水源涵养的稳定性;高原西部羌塘高原水源涵养功能稳定性相对较差,虽然已经实施了一些生态保护和修复工程,但可能因为其多年降水呈极不稳定、弱稳定状态和耕地面积的增加、经济的不断增长[48]导致水源涵养功能尚未明显改善。降水、气温在高原柴达木盆地和阿尔金山大部分区域分别呈极不稳定、极稳定状态,柴达木自然保护区的建立、草原荒漠生态保护和修复等工程的实施使其生态系统质量有所改善,但土壤保持功能在该区域呈弱稳定,可能荒漠地区土壤保持功能稳定性对气候变化的响应更为敏感;剩余大部分地区土壤保持功能都呈极稳定,而对应区域气温、降水呈极稳定状态相对很少,这或许与实施的各项生态保护措施相关。青藏高原防风固沙功能呈不稳定状态的区域相对较多,羌塘高原西北与北部部分区域防风固沙功能极不稳定(图6),主要由于防风固沙量在该区域明显变化(图5),而藏中腹地、柴达木盆地防风固沙量也呈明显变化趋势,但防风固沙功能稳定性较好,这表明对羌塘高原腹地高寒草原进行的生态保护与修复以及柴达木盆地荒漠化的治理取得了部分成效,高原风速、降水等气候因素对防风固沙稳定性的影响难以明晰,下一步还需开展驱动因素拆解,量化更多生态系统功能变化的驱动因素,以便为青藏高原生态保护和管理提供详细的决策依据。
图8
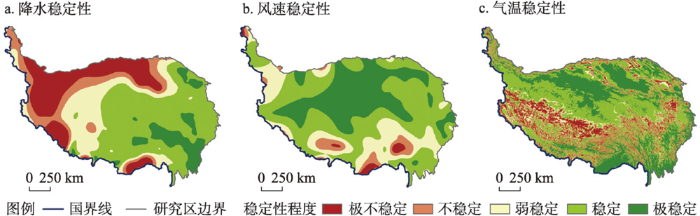
图8
2000—2020年青藏高原降水、风速、气温的稳定性分布
Fig. 8
The stable distribution of precipitation, wind speed and temperature over the Qinghai-Tibet Plateau from 2000 to 2020
(3)本文的不确定性存在如下几个方面:① 仅评估分析了青藏高原的水源涵养、土壤保持、防风固沙3项主要生态功能,尚未考虑碳固定、生物多样性保护、气候变化减缓、微气候调节等高原同样重要的生态功能,因此结果有待进一步优化;② 由土地利用变化数据演变而来的生态系统类型及变化数据,由于现有多套土地利用变化数据,而不同数据之间分类系统、数据源、分类方法、精度等皆存在明显差异,这给研究结果带来极大不确定性,本文中3套土地利用数据具备一致性的区域面积仅占青藏高原面积的59.9%、59.8%、52.7%;③ 关于生态系统稳定性的各类研究,由于其内涵、定义、对象、方法不一致而产生差异性结果,既有微观尺度的种群/群落稳定性,也有宏观尺度的结构/质量稳定性,本文聚焦时空尺度的功能稳定性,故而仅从生态系统功能这方面开展评估并实现功能区划。
5 结论
本文在明晰青藏高原生态系统宏观格局变化的基础上,基于2000—2020年生态系统水源涵养、土壤保持以及防风固沙功能量的估算,辨识了高原生态系统功能类型及其核心分布区,分析了主要生态系统功能的时空动态变化趋势,定量评估了2000—2020年主要生态系统功能的稳定性,进而开展了基于稳定性评估的青藏高原生态系统功能区划。得到主要结论如下:
(1)多套数据表明,2000—2020年青藏高原生态系统宏观格局动态呈现为湿地面积显著增加、城镇与荒漠面积不同程度增加,而草地面积明显减少,农田、森林亦以减少为主。
(2)青藏高原水源涵养、土壤保持、防风固沙生态系统功能的核心区面积占比分别为12.7%、13.9%、14.2%,其中水源涵养核心功能区主要分布在藏东南、三江源、甘南、那曲,防风固沙核心功能区聚集在藏北羌塘高原、柴达木盆地、共和盆地,而土壤保持核心功能区环绕高原特别是高原东部、西北角及一江两河区域。
(3)2000—2020年青藏高原水源涵养、防风固沙生态系统功能逐步提升,特别是森林水源涵养功能和草地防风固沙功能显著增强,而青藏高原土壤保持生态系统功能却呈明显下降趋势,尤其是高原西北部年减少率约-5 t/(hm2·a)。
(4)青藏高原水源涵养、土壤保持、防风固沙生态系统功能在高原东南部、中部为极稳定、稳定,而在高原西部水源涵养功能不稳定、高原北部土壤保持功能表现为弱稳定以及羌塘高原西北与北部部分区域防风固沙功能极不稳定。基于稳定性可将高原划分为三大类16个分区,因地制宜开展差异化的生态保护修复,水源涵养生态系统功能区注重林草湿整体保护,土壤保持区强化天然林和天然草原保护修复,防风固沙则以荒漠化防治为主以遏制草原退化沙化趋势。
参考文献
The value of the world's ecosystem services and natural capital
DOI:10.1038/387253a0 [本文引用: 1]
Spatial heterogeneous relationship between ecosystem services and human disturbances: A case study in Chuandong, China
China Ecological Environment Status Bulletin 2021 (Excerpt)
2021年中国生态环境状况公报(摘录)
Ecological changes and the tradeoff and synergy of ecosystem services in western China
DOI:10.11821/dlxb202201013
[本文引用: 1]

Since the implementation of the government initiative-the Development of Western Regions for 2000-2019, a series of major ecological construction projects have been launched, leading to great changes in the ecological conditions and ecological services of western China. This study calculated the amount of total ecosystem services in the western region from 2000 to 2019, and analyzed ecological changes and the characteristics of spatio-temporal variations in ecological services. And a relevant analysis method was applied to explore the trade-offs and synergy of service. It was found that the area of settlements and wetland ecosystems in the study area increased significantly from 2000 to 2015, whereas grassland showed a downward trend year by year. The vegetation fraction showed a decreasing zonal distribution from south to north. A fluctuating increase was observed during 2000-2019, with inter-annual and large spatial differences. The water conservation service had a slight downward trend from 2000 to 2019, and the main decreasing areas were distributed in southeastern Tibet, the western part of the Three Rivers Source Region, and the karst rocky desertification area. The soil conservation service showed an increasing but fluctuating trend, with the greatest increases observed in the Loess Plateau, western Sichuan and Yunnan provinces, northwest Tibet, and southeast Tibet. The windbreak and sand fixation showed a downward trend, and the sharp decline was mainly found in the central and western parts of Inner Mongolia, Tibet and parts of northern Xinjiang. Ecosystem supply, water conservation, and soil conservation were synergistically connected, they were observed north of the Huaihe River-Qinling Mountains, especially in Ningxia and Inner Mongolia. Ecosystem supply was mainly trade-offs with windbreak and sand fixation, and it was observed in the farming-pastoral transitional zone. The synergistic degree of ecosystem services in areas subjected to ecological engineering policy was greater than that in non-engineering areas. Quantitative assessment of ecosystem service changes and their trade-offs is helpful for scientific ecological management and maximizing ecological benefits.
西部地区生态状况变化及生态系统服务权衡与协同
DOI:10.11821/dlxb202201013
[本文引用: 1]
西部大开发战略实施20年以来,一系列重大生态建设工程使得西部地区的生态状况和生态服务发生了重要变化,本文分析西部地区生态状况变化及其生态服务时空变化特征,并运用相关分析法研究其服务功能权衡协同关系。研究发现西部地区2000—2019年间:① 聚落和湿地生态系统面积显著增加,草地有逐年下降趋势。② 植被覆盖度呈波动上升趋势,存在年际差异且空间差异较大。③ 水源涵养服务有轻微下降趋势,下降区域主要分布在藏东南地区、三江源西部地区、喀斯特石漠化地区等;土壤保持服务波动中呈上升趋势,上升区域主要黄土高原地区、川滇西部地区、藏西北地区、藏东南地区等;防风固沙服务呈下降趋势,大幅下降区域主要位于内蒙古中西部地区、西藏和北疆部分地区。④ 生态系统供给与水源涵养、土壤保持主要为协同关系,与防风固沙主要为权衡关系且分布在农牧交错带地区。⑤ 生态工程区内生态系统服务协同程度大于非工程区。定量评估生态系统服务变化及其权衡协同关系有助于进行科学化生态管理,最大化生态效益。
Assessing the impacts of Grain-for-Green Programme on ecosystem services in Jinghe River basin, China
Assessment of ecosystem services and ecological regionalization of grasslands support establishment of ecological security barriers in northern China
中国北方草地生态系统服务评估和功能区划助力生态安全屏障建设
Spatiotemporal ecosystem evolution and driving mechanism in the Qinghai-Tibet Plateau ecological barrier area
青藏高原生态屏障生态系统时空演变及驱动机制
Research status and hotspots analysis of forest ecosystem stability based on CNKI
基于CNKI的森林生态系统稳定性研究现状与热点分析
Biodiversity and ecosystem stability
DOI:10.17520/biods.1995006 URL [本文引用: 1]
生物多样性和生态系统稳定性
A conceptual analysis of ecosystem stability
生态系统稳定性定义剖析
Review on research of spatial pattern and influencing mechanisms of terrestrial ecosystem stability
陆地生态系统稳定性空间格局及影响机制研究综述
Evaluation of eco-environmental stability in Tibet
DOI:10.13249/j.cnki.sgs.2005.05.573
[本文引用: 1]
By making a evaluation index system and using AHP to determine the evaluation factor's weights, this paper builds the valuation model of eco-environmental stability of Tibet and uses the overlay function of raster-GIS to make a result map, and finds the distribution characteristics of eco-environmental stability of Tibet based on the analysis of result map. The study shows that the eco-environmental stability of Tibet is almost good and the unstable area that is only 9.78% of the total area of Tibet is distributed in the middle and low reaches of the Yarlung Zangbo river. To protect the eco-environmental of the unstable area from farther degenerating, the government should pay more attention on the eco-environmental construction work on this area.
西藏生态环境稳定性评价研究
Constructing ecological security patterns based on ecological service importance and ecological sensitivity in Guangdong Province
基于生态系统服务重要性和生态敏感性的广东省生态安全格局构建
Protection measures of plateau lake based on ecosystem sensitivity and importance of ecosystem function: The case of Lake Dalinor Basin
基于生态系统敏感性与生态功能重要性的高原湖泊分区保护研究: 以达里湖流域为例
Protection and construction of the national ecological security shelter zone on Tibetan Plateau
DOI:10.11821/xb201201001
[本文引用: 2]
The shelter function of Tibetan Plateau has an important effect on the ecological security in China, even in Asia. Under the joint influence of global change and human activities, ecosystem destabilizing and resources and environment pressure increasing emerge on the Tibetan Plateau, which have caused some problems, including significant glacier retreat, serious land degradation, aggravated soil erosion and water loss, increased threats to biodiversity along with decreased rare and specious biological resources, and natural disasters increasing. These problems have a great influence on regional ecological security shelter function on the plateau. Based on the relevant research and practical experience in ecological construction, some suggestions are proposed to strengthen ecological protection and construction of the national ecological security shelter zone on the Tibetan Plateau at present, namely, strengthening basic research on the Tibetan Plateau ecological shelter impacts and regional ecological security enhancement and climate change mitigation; developing the key technology of protection and construction of the national ecological security shelter zone on the plateau and demonstration; striving to set up a monitoring system of ecological shelter function, intensifying evaluation of protection and construction efficiency of ecological security shelter zone, perfecting evaluation systems and standards, and summarizing experience, so as to enhance the overall function of national ecological security shelter and to further take the initiative in dealing with global change.
青藏高原国家生态安全屏障保护与建设
DOI:10.11821/xb201201001
[本文引用: 2]
青藏高原对我国乃至亚洲生态安全具有重要的屏障作用。在全球变化和人类活动的综合影响下,青藏高原呈现出生态系统稳定性降低、资源环境压力增大等问题,突出表现为:冰川退缩显著、土地退化形势严峻、水土流失加剧、生物多样性威胁加大与珍稀生物资源减少、自然灾害增多等。这些问题严重影响了青藏高原区域生态安全屏障功能的发挥。针对当前高原生态安全状况,在总结相关研究成果和生态建设实践经验的基础上,提出了加强青藏高原国家生态安全屏障保护与建设的对策建议:加强气候变化对青藏高原生态屏障作用影响及区域生态安全调控作用的基础研究;系统开展高原生态安全屏障保护和建设关键技术研究与示范推广;部署建设生态屏障功能动态监测体系,加强生态安全屏障保护与建设成效评估,构建评估体系和标准,并凝练经验,以系统提升国家生态安全屏障的总体功能,在应对全球变化中占据主动地位。
Spatiotemporal variation characteristics and its driving forces of water conservati on function on the Tibetan Plateau from 1995 to 2014
1995—2014年青藏高原水源涵养功能时空演变特征及其驱动力分析
Spatial and temporal variation of soil conservation capability of vegetation in three-river headwaters region
三江源植被保持土壤能力的时空变化
Assessment on the effects of the first-stage ecological conservation and restoration project in Sanjiangyuan region
DOI:10.11821/dlxb201601001
[本文引用: 1]
In this paper, we developed a series of assessment indexes based on the evaluation of ecological effects, which consists of the ecosystem structure, qualities, services, and main impacting factors for these changes. Comprehensive monitoring and assessment methods that focused on the planning objectives of ecological conservation and restoration project were developed based on field observation, remote sensing monitoring and quantitative simulation of ecological processes. Then we assessed the ecological effects of the first-stage of ecological conservation and restoration project in Sanjiangyuan region by adopting the trend analysis of dynamics in ecosystem structure and services. The results showed that since the beginning of the project eight years ago, the macro-situation of ecosystem in this region has been getting better but not reached the best situation in the 1970s. The continued degradation trends of grassland have been initially contained, but it is difficult to achieve the expected objective of "the vegetation coverage of grassland increasing by an average of 20%-40%". The wetland and water-body ecosystems have been restored. The water conservation service of ecosystem and water supply capacity of watershed were increased, and the volume of?ecosystem water conservation reached the objective of increasing by 1.32 billion m3. The ecological restoration in the project regions tended to be better than that outside the project regions. In addition to climate change, implementation of the ecological conservation and restoration project had obvious and positive effects on vegetation restoration. However, the degradation situations of grassland were not fundamentally reversed, and the implementation of the project has not been curbing the increasing trend of soil erosion. Therefore, the local and preliminary characteristics of the first-stage of the project highlighted the long-term and arduous ecosystem conservation and protection in the Sanjiangyuan region.
三江源生态保护和建设一期工程生态成效评估
DOI:10.11821/dlxb201601001
[本文引用: 1]
基于生态系统结构--服务动态过程趋势分析,针对生态保护与建设工程预期目标,构建了由生态系统结构,质量,服务及其变化因素构成的生态成效评估指标体系,研究发展野外观测,遥感监测和生态过程定量模拟一体化的监测评估技术体系,评估了三江源生态保护和建设一期工程的生态成效.结果表明:工程实施8年以来,三江源区宏观生态状况趋好但尚未达到1970s比较好的生态状况,草地持续退化趋势得到初步遏制但难以达到预期"草地植被盖度提高平均20%~40%"的目标,水体与湿地生态系统整体有所恢复,生态系统水源涵养和流域水供给能力提高,区域水源涵养量达到了增加13.20亿m<sup>3</sup>目标;重点工程区内生态恢复程度好于非工程区,除了气候影响以外,工程的实施对促进植被恢复具有明显而积极的作用;然而,草地退化局面没有获得根本性扭转,工程实施尚未遏制土壤水蚀增加趋势,一期工程局部性和初步性特点突显出三江源区生态保护任务的长期性和艰巨性.
Spatial heterogeneity of ecosystem services and its influencing factors in typical areas of the Qinghai-Tibet Plateau: A case study of Nagqu City
青藏高原典型区生态系统服务空间异质性及其影响因素分析: 以那曲市为例
Ecological risk assessment and spatial identification of ecoloqical restoration from the ecosystem service perspective: A case study in source region of Yangtze River
基于生态系统服务视角的生态风险评估及生态修复空间辨识: 以长江源区为例
Profoundly entwined ecosystem services, land-use change and human well-being into sustainability management in Yushu, Qinghai-Tibet Plateau
DOI:10.1007/s11442-022-2021-6
[本文引用: 1]
The nexus exploration among land use/land cover change, ecosystem services and human well-being has been increasingly crucial in the context of Future Earth. However, the spatial heterogeneity and the entwining process among these three aspects have not yet been in-depth and systematically explored. Here we identified the spatiotemporal pattern of ecosystem services during the past 20 years in Yushu, the eco-fragile region and the centre of Qinghai-Tibet Plateau, as well as clarified its relationships with land use change and human well-being. We revealed that: (1) The structure of the ecosystem and land use in this area have been increasingly stable, and the ecological projects have exerted a positive impact. (2) Although the ecological environmental issues still need more attention, the ecosystem services of the area have been positively developing. (3) Derived by the ecosystem services increase, environmental projects and policies, the human well-beings of culture and education performed much better than other aspects. (4) It is crucial to carry out long-term ecological projects and increase educational investment for maintaining the stability of this ecologically fragile area. This study provides significant support for the regional ecological sustainability decision making, especially for the Qinghai-Tibet Plateau, the roof of the world.
Current condition and protection strategies of Qinghai-Tibet Plateau ecological security barrier
青藏高原生态安全屏障状况与保护对策
Measurement and dynamic changes of ecosystem services value for the Tibetan Plateau based on remote sensing techniques
青藏高原生态系统服务价值的遥感测算及其动态变化
Relief degree of land surface and its geographical meanings in the Qinghai-Tibet Plateau, China
DOI:10.11821/dlxb202007003
[本文引用: 1]
Relief degree of land surface (RDLS) is one of the key indicators in the fields of suitability assessment of human settlements (SAHS) as well as resources and environmental carrying capacity (RECC) evaluation at the regional scale. Currently, there is still a lack of in-depth research on the determination of the optimal window size for the RDLS calculation and evaluation and its correlation analysis with two topographical parameters, e.g., elevation and relative height difference. These issues further affect the effective representation of the RDLS in the delineation of local to regional topographic relief. Therefore, an objective understanding of the RDLS in the Qinghai-Tibet Plateau of China greatly contributes to promoting the construction of national ecological security barrier and regional green development. In this study, based on the 30 m Advanced Spaceborne Thermal Emission and Reflection Radiometer (ASTER) Global Digital Elevation Model (GDEM Version 2), the optimal window size for calculating and evaluating the RDLS in the Qinghai-Tibet Plateau was accurately determined using the average change-point method, and the first 30 m RDLS thematic map for the Qinghai-Tibet Plateau was generated accordingly. Next, the interrelation between the RDLS and elevation and relative height difference was quantitatively examined. Based on that, the effective representation or geographical meanings of the RDLS in the plateau were defined. The results/conclusions include: (1) The optimum window size for the RDLS calculation and evaluation in the study area based on the 30 m GDEM is a rectangular neighborhood of 41×41 pixels, equaling to an area of about 1.51 km2. The average change-point analysis approach shows that the optimum window size for regional RDLS analysis is unique. (2) The average RDLS of the study area is approximately 5.06, along with over 60% of the plateau ranging between 4.5 and 5.7. On the whole, the topographic relief increases from the northeast to the southwest and west parts. Gentle to small-relief landforms are mostly seen in the Qaidam Basin, the Southern Tibet Valley, and the Hehuang Valley (Yellow and Huangshui river valleys). Also, the differences in the local surface relief in varied latitudinal sections (along the mountain range) are small, while those at longitudinal level are big, showing hierarchical and regular fluctuations (crossing the mountain trending). (3) Correlation analyses showed that different values of the RDLS in the plateau correspond to geomorphic units with different elevations and relative height differences. The profile characteristics of the mountains in the Qinghai-Tibet Plateau based on different terrain reliefs indicate that the height above sea level of low mountains steadily increases first, then experiences sudden rise and severe fluctuation in surface relief, and finally forms the orderly ups and downs of the extreme mountains, e.g., the Himalayas.
青藏高原地形起伏度及其地理意义
DOI:10.11821/dlxb202007003
[本文引用: 1]
地形起伏度是区域人居环境适宜性与资源环境承载力的关键评价指标之一。当前有关其最佳评价窗口、及其与海拔—相对高差的相互关系仍缺乏深入研究,进而影响该指标对区域地形起伏的有效表征。客观认识青藏高原地形起伏度有助于促进其国家生态安全屏障建设与区域绿色发展。以先进星载热发射和反射辐射仪全球数字高程模型(ASTER GDEM, 30 m)地形数据(V2)为基础,本文利用均值变点分析法确定了青藏高原地形起伏度评价的最佳分析窗口,基于地形起伏度模型(RDLS)研制了青藏高原首套30 m地形起伏度专题图,据此分析了地形起伏度与海拔、相对高差的相互关系,并界定了地形起伏度对区域地形起伏状况的有效表征。主要结果/结论包括:① 基于GDEM的青藏高原地形起伏度评价最佳窗口为41×41个像元的矩形邻域,对应面积约为1.51 km<sup>2</sup>,均值变点分析表明区域地形起伏度评价最佳窗口有其唯一性。② 青藏高原地形起伏度均值约为5.06,超3/5区域地形起伏度介于4.5~5.7之间;整体上,青藏高原地形起伏程度由其东北部向西南部、西部递增,仅在柴达木盆地、藏南谷地以及河湟谷地出现低起伏地貌特征。且地表起伏在不同纬度剖面变化较为一致(沿山脉走向),但不同经度剖面起伏层次错落(横切山脉走向)。③ 相关性分析表明不同地形起伏度分别对应不同平均海拔、不同相对高差的地貌单元。青藏高原地形起伏度经纬向剖面分析表明,该区由东部的低山稳步爬升,山体经历骤然爬升(即地表起伏特征剧烈)后形成以极高山为主的有序错落起伏(喜马拉雅山脉)。
Spatiotemporal characteristics, patterns and causes of land use changes in China since the late 1980s
DOI:10.11821/dlxb201401001
[本文引用: 1]
Land-Use/land Cover Changes (LUCC) are a direct consequence of human and nature interactions. China's Land Use/cover Datasets (CLUD) were updated regularly at five-year intervals from the late 1980s to the year of 2010 with standard procedures based on Landsat TM/ETM + images. A dynamic zoning method was proposed to analyze major land-use conversions. The spatiotemporal characteristics, differences, and causes of land-use changes at a national scale were then examined. The main findings are summarized as follows: Land-Use Changes (LUC) across China indicated a significant variation in spatial and temporal characteristics in the past 20 years between the 20th and 21st centuries. The amount of cropland change decreased in the south and increased in the north, but the total area remained almost unchanged. The reclaimed cropland was shifted from northeast to northwest. The built-up lands were expanded rapidly, which were mainly distributed in the east and gradually spread out to the midwest. Woodland decreased first and then increased, but desert area was inverted. Grassland continued decreasing. Different spatial patterns of LUC in China were found between the late 20th century and the early 21st century. The original 13 LUC zones were replaced by 15 units with changes of boundaries in some zones. The main spatial characteristics of these changes included (1) an accelerated expansion of built-up land in the Huang-Huai-Hai region, the coastal areas of southeastern China, the midstream area of the Yangtze River, and the Sichuan Basin; (2) the shifted land reclamation in the north from Northeast China and eastern Inner Mongolia to the oasis agricultural areas in Northwest China; (3) the continuous transform from rain-fed farmlands in Northeast China to paddy fields; and (4) the effectiveness of the “Grain-for-Green” project in the southern agricultural-pastoral ecotones of Inner Mongolia, the Loess Plateau, and mountainous areas of southwestern China. In recent two decades, although climate change in the north impacted the change in cropland, policy regulation and economic driving forces were still the primary causes of LUC across China. During the first decade of the 21st century, the anthropogenic factors that drove variations in land-use patterns have shifted the emphasis from one-way land development to both development and conservation. The "dynamic zoning method" was used to analyze changes in the spatial patterns of zoning boundaries, the internal characteristics of zones, and the growth and decrease of units. The results revealed "the pattern of the change process," namely the process of LUC and regional differences in characteristics at different stages. The growth and decrease of zones during this dynamic LUC zoning, variations in unit boundaries, and the characteristics of change intensities between the former and latter decades were examined. The patterns of alternative transformation between the "pattern" and "process" of land use and the reasons for changes in different types and different regions of land use were explored.
20世纪80年代末以来中国土地利用变化的基本特征与空间格局
The 30 m annual land cover dataset and its dynamics in China from 1990 to 2019
DOI:10.5194/essd-13-3907-2021
URL
[本文引用: 1]
. Land cover (LC) determines the energy exchange, water and carbon cycle between Earth's spheres. Accurate LC information is a fundamental parameter for the environment and climate studies. Considering that the LC in China has been altered dramatically with the economic development in the past few decades, sequential and fine-scale LC monitoring is in urgent need. However, currently, fine-resolution annual LC dataset produced by the observational images is generally unavailable for China due to the lack of sufficient training samples and computational capabilities. To deal with this issue, we produced the first Landsat-derived annual China land cover dataset (CLCD) on the Google Earth Engine (GEE) platform, which contains 30 m annual LC and its dynamics in China from 1990 to 2019. We first collected the training samples by combining stable samples extracted from China's land-use/cover datasets (CLUDs) and visually interpreted samples from satellite time-series data, Google Earth and Google Maps. Using 335 709 Landsat images on the GEE, several temporal metrics were constructed and fed to the random forest classifier to obtain classification results. We then proposed a post-processing method incorporating spatial–temporal filtering and logical reasoning to further improve the spatial–temporal consistency of CLCD. Finally, the overall accuracy of CLCD reached 79.31 % based on 5463 visually interpreted samples. A further assessment based on 5131 third-party test samples showed that the overall accuracy of CLCD outperforms that of MCD12Q1, ESACCI_LC, FROM_GLC and GlobeLand30. Besides, we intercompared the CLCD with several Landsat-derived thematic products, which exhibited good consistencies with the Global Forest Change, the Global Surface Water, and three impervious surface products. Based on the CLCD, the trends and patterns of China's LC changes during 1985 and 2019 were revealed, such as expansion of impervious surface (+148.71 %) and water (+18.39 %), decrease in cropland (−4.85 %) and grassland (−3.29 %), and increase in forest (+4.34 %). In general, CLCD reflected the rapid urbanization and a series of ecological projects (e.g. Gain for Green) in China and revealed the anthropogenic implications on LC under the condition of climate change, signifying its potential application in the global change research. The CLCD dataset introduced in this article is freely available at https://doi.org/10.5281/zenodo.4417810 (Yang and Huang, 2021).
Global land cover mapping at 30 m resolution: A POK-based operational approach
Rainfall erosivity estimation using daily rainfall amounts
DOI:10.13249/j.cnki.sgs.2002.06.705
[本文引用: 1]
Rainfall erosivity shows the potential ability of the soil loss caused by rainfall and it is very important for predicting soil loss quantitatively. A rainfall erosivity model using daily rainfall amounts to estimate half-month rainfall erosivity directly was established from data of 71 weather stations in China. The average coefficient of determination for all stations was 0.718 and the average relative error estimating the annual average rainfall erosivity was 4.2%. Both parameters of α and β in the model were different in different regions. The parameter α was high correlative with parameter β and parameter β was related to rainfall characteristics, so both parameters could be estimated by using rainfall indexes. With the set of parameter values estimated by using rainfall indexs,the average coefficient of determination decreased to 0.697 and the average relative error estimating the annual average rainfall erosivity increased to 17.3%. The model worked very well in the regions where the rainfall was abundant and the result was on the low side when extreme storm erosivty was estimated. The daily rainfall erosivity model could be used to estimate the annual average rainfall erosivity and its seasonal distribution.
利用日雨量计算降雨侵蚀力的方法研究
Revised slope steepness factor for the universal soil loss equation
DOI:10.13031/2013.30576 URL [本文引用: 1]
Slope gradient effects on soil loss for steep slopes
DOI:10.13031/2013.28273 URL [本文引用: 1]
Assessing changes in soil conserved ecosystem services and causal factors in the Three Gorges Reservoir region of China
Wind erosion in Xilingol League, Inner Mongolia since the 1990s using the revised wind erosion equation
DOI:10.11820/dlkxjz.2014.06.011
[本文引用: 1]
Soil wind erosion is a major ecological environment problem in northern China. Xilingol League is located in the arid and semiarid areas. As one of the areas suffering from most serious wind erosion in northern China, its ecological environment is very fragile. Because of this environmental fragility, the area was included in the Beijing-Tianjin Dust Storms Sources Control Project that was officially approved by The State Council and implemented in 2002. In order to better understand the status of soil erosion and guide the regional desertification prevention, it is necessary to assess the variation of soil erosion and reveal the influences of weather and vegetation on soil erosion in Xilingol. In this study, based on wind speed, temperature, precipitation and other meteorology data, the normalized difference vegetation index, snow coverage and other remote sensing data, the Revised Wind Erosion Equation (RWEQ), which takes Newton's first law of motion as the foundation, was applied to evaluate annual soil losses caused by wind erosion. The results show that: The average soil erosion in Xilingol League between 1990 and 2010 was 0.34 billion tons. The intensity of soil wind erosion is low in most parts of Xilingol—these areas were mainly concentrated in the eastern, central and southern areas, where vegetation coverage is higher, wind erosion forces is lower, and rainfall is abundant. The areas with medium and higher intensity of erosion were mainly distributed in the Hunshandac desert of Suninteyou Banner, Zhengxiangbai Banner and Zhenglan Banner, where the soil is highly prone to wind erosion. Since the 1990s, soil erosion in Xilingol showed a deceasing trend. The reduction of wind erosion intensity is related to the weakened wind energy and improved vegetation cover. Wind erosion forces is the main driving factor of wind erosion—soil erosion was significantly correlated with the wind erosion forces (<i>r</i>=0.95, <i>p</i><0.05). Wind erosion in Xilingol occurred frequently in windy springs. At this time, the effect of soil erosion associated with low vegetation coverage is most significant. Soil erosion was significantly correlated with the spring vegetation coverage in regions of higher wind erosion forces (<i>r</i>>0.7, <i>p</i><0.01). Increased vegetation coverage effectively reduced soil wind erosion of the region in the recent 20 years. Low vegetation coverage makes the prevention of soil erosion more difficult and improving the grassland condition, especially in the spring season, is the key to controlling wind erosion of the soil. The RWEQ model was mainly used in the farmlands of the United States and cannot be directly applied in the grassland areas of China. In order to better apply the model in grasslands, the soil particle content was converted into the US system, surface roughness was measured by the roller chain method and withered vegetation coverage (obtained by photos) was introduced to replace flat residues on the surface of the soil. Even so, more research is needed to solve problems such as the influence of relief on soil wind erosion, the determination of noneroding boundaries, among others.
基于RWEQ的20世纪90年代以来内蒙古锡林郭勒盟土壤风蚀研究
DOI:10.11820/dlkxjz.2014.06.011
[本文引用: 1]
土壤风蚀是中国北方地区重要的生态环境问题。锡林郭勒盟位于中国干旱、半干旱地区,是中国北方典型风蚀区,其特殊的地理位置又使得本区成为华北重要的生态屏障,为此锡林郭勒盟全区均划入了京津风沙源治理工程区。为了更好地阐明锡林郭勒盟的土壤风力侵蚀过程,指导区域的荒漠化防治,,基于气象、遥感数据,利用RWEQ模型定量分析了20 世纪90 年代以来锡林郭勒盟的土壤风蚀时空格局,揭示土壤风蚀的主要影响因素。研究表明:锡林郭勒盟多年平均土壤风蚀量为3.39 亿t。土壤风蚀强度以微度和轻度为主,主要集中在植被较好,风蚀力较低,降雨量较高,雪被覆盖地表时间较长的东、中部地区以及南部地区。侵蚀强度为中度以上的侵蚀区集中在苏尼特右旗、正镶白旗和正蓝旗的浑善达克沙地;90 年代以来,锡林郭勒盟的土壤风蚀强度总体上呈减弱趋势,主要与风场强度的减弱,植被盖度等的变化有关。土壤风蚀多发生于风蚀力较大的春季,风蚀强度较大区域的春季植被盖度与风蚀量呈显著负相关(r>0.7,p<0.01),且近20 年植被盖度提升有效降低了该区域的土壤风蚀。
RWEQ: Improved wind erosion technology
The protection characteristics of key ecological functional zones from the perspective of ecosystem service trade-off and synergy
DOI:10.11821/dlxb202205016
[本文引用: 1]
Key ecological functional zones provide continuous ecosystem services and play an indispensable role in ensuring national ecological security and social sustainable development. From the perspective of ecosystem service trade-off and synergy, this paper discusses and analyzes the protection characteristics of key ecological functional areas. The data includes multi-source datasets such as ecosystem types, meteorological data, elevation data and soil data from 2000 to 2019. Methods of the dynamic degree of ecological spatial change, ecosystem service model and partial correlation coefficient were used for evaluation and analysis. This research selects the Qinling-Daba (Qinba) Mountains region with high similarity of natural and geographical conditions as the reference unit, takes ecosystem supply services and regulation services as the core content, and analyzes the trade-off and synergy relationship of ecosystem services based on the quantitative analysis of the characteristics of ecological spatial changes from 2000 to 2019. The results showed that the ecological status of the study area gradually improved, and the ecosystem tended to be stable after the delimitation of key ecological functional zones. The service capacity of key ecological functional zones is gradually increasing, and the average net primary productivity, total soil conservation and total water conservation are higher than those outside the key ecological functional zones by 25.95 gC/m2, 5.81×10⁸ t and 24.95×10⁸ m3, respectively. The synergy between soil conservation services and ecosystem supply services was positively correlated with the improvement of ecological status. Due to the impact of precipitation, the synergistic relationship between water conservation services and ecosystem supply services after 2010 became worse. Overall, the designation of key ecological functional areas in the Qinba Mountains has driven the "quantitative growth" of regional ecological space and the "qualitative improvement" of ecosystem services. However, the "synergy" of the relationship between ecosystem services is not obvious, and even changed to "trade-off", which requires the country to make more targeted ecosystem protection and management decisions in the future, and improve the overall benefits of ecosystem and support the sustainable supply of regional ecosystem services.
生态系统服务权衡与协同视角下的重点生态功能区保护特征
DOI:10.11821/dlxb202205016
[本文引用: 1]
重点生态功能区提供着源源不断的生态系统服务,在保障国家生态安全和社会可持续发展方面,有着不可或缺的基础作用。但是,以生态系统服务权衡与协同关系为视角,进而探讨分析重点生态功能区保护特征的研究案例相对较少。本文以秦巴重点生态功能区为评估分析区域,选择自然地理条件相似度极高的秦巴山区为参照单元,以生态系统供给服务与调节服务为核心内容,在定量分析2000—2019年期间的生态空间变化特征基础上,分析评估生态系统服务权衡与协同关系。结果表明:秦巴山区生态状况逐渐变好,重点生态功能区划定之后,生态系统趋于稳定;重点生态功能区服务能力呈逐渐增强的趋势,平均净初级生产力、土壤保持总量和水源涵养总量比重点生态功能区外分别高出了25.95 gC/m<sup>2</sup>、5.81亿t和24.95亿m<sup>3</sup>;土壤保持服务和生态系统供给服务的协同关系与生态状况改善呈正相关;由于受到降水的影响,2010年之后的水源涵养服务与生态系统供给服务的协同关系变差。总体来看,秦巴重点生态功能区的划定带动了区域生态空间“量的增长”和生态系统服务“质的提升”,但生态系统服务之间关系的“协调性”仍然不足,甚至从“协同”转为“权衡”关系,这要求未来国家需要制定更有针对性的生态系统保护管理决策,提高生态系统总体效益,支撑区域生态系统服务的可持续供给。
Evaluation of water conservation of China's ecosystems based on benchmark
基于水源涵养参照系的中国生态系统水源涵养功能优劣评估
Tradeoff and synergistic relationship among ecosystem services
青藏高原生态屏障区生态系统服务权衡与协同关系
Co-evolution of climate-vegetation-hydrology and its mechanisms in the source region of Yellow River
DOI:10.11821/dlxb202207011
[本文引用: 2]
Vegetation recovery under global change and its consequent evolution of eco-hydrological processes have modulated the water resources conservative capacity in the source region of the Yellow River (YRSR). Based on climatological data, remotely sensed vegetation index and geographical information, the integrated simulations of water and carbon cycles in the YRSR are presented, with the vegetation interface processes (VIP) distributed eco-hydrological dynamic model. Then the co-evolving mechanisms of hydrological and vegetation dynamics are investigated. Results show that warming and wetting climate in the YRSR has improved the vegetation growing condition and extended the growing period for more than 10 days in recent decades. Averaged NDVI from 2010 to 2020 increased by 4.5% relative to that from 2000 to 2009. Vegetation gross primary productivity (GPP) shows a significant uptrend with a rate of 4.57 gC m-2 a-1, 77% of which is contributed by climate change and elevated atmosphere CO2 fertilization, and the rest 23% is by vegetation greening. Evapotranspiration (ET) is increasing at a rate of 2.54 mm a-1 and vegetation water use efficiency (WUE, expressed as GPP/ET) is also improving at a relative rate of 5.1% a-1. Generally, annual ET, GPP and WUE and their trends are decreasing along the elevation below 4200 m. At basin scale, there are significant positive correlations between the vegetation greenness and the runoff coefficient with precipitation in the current and previous years, demonstrating a legacy effect of precipitation for vegetation recovery on water conservation capacity. The increased ET might be a benefit to the water recycle between land surface and atmosphere, which will alleviate the reduced potential of water yield owing to ecological restoration and establish trades-off and synergies among precipitation, vegetation and water yield. Conclusively, exploring the mechanisms of hydrological responses to climate change and vegetation recovery and its feedback will provide scientific support to the assessment of ecological engineering programs in the source regions.
黄河源区气候—植被—水文协同演变及成因辨析
DOI:10.11821/dlxb202207011
[本文引用: 2]
全球变化下黄河源区水文过程的演变影响流域生态系统的水源涵养功能,流域植被改变也影响水循环。本文基于气候、植被信息和VIP分布式生态水文模型,开展黄河源区水碳循环要素变化的集成模拟,分析了气候—植被—水文要素的协同演变机制。结果表明,2000年以来黄河源区气候呈暖湿化趋势;植被绿度明显提高,2010—2019年比2000—2009年平均增加了4.5%;生长季延长了至少10 d;植被生产力(GPP)显著上升,倾向率为4.57 gC m<sup>-2</sup> a<sup>-1</sup>;植被恢复措施对GPP变化的贡献约为23%,气候变化和大气CO<sub>2</sub>升高的施肥效应的贡献为77%。源区植被蒸散量(ET)呈增加趋势,倾向率为2.54 mm a<sup>-1</sup>,水分利用效率(WUE)亦提高,平均相对上升率为5.1% a<sup>-1</sup>。GPP、ET和WUE年总量及其变化率在海拔4200 m以下随高度上升而减小,之后变化趋缓。源区植被绿度和径流系数与当年和前一年降水呈显著正相关,反映降水蓄存于植物根层土壤的遗留效应。蒸散增强在一定程度上有利于源区地表—大气之间的水分再循环,帮助缓解生态恢复引起的产水能力下降,促进降水—植被—径流之间的良性互馈关系的形成。揭示水文对气候变化和植被恢复的响应和互馈机制,可为生态恢复措施对源区水源涵养功能的影响及效应的定量评估提供科学依据。
Effects of changed Asian water tower on Tibetan Plateau ecosystem: A review
“亚洲水塔”变化对青藏高原生态系统的影响
Study on vegetation change in the Qinghai-Tibet Plateau from 1980 to 2015
1980—2015年青藏高原植被变化研究
DOI:10.16258/j.cnki.1674-5906.2021.02.007
[本文引用: 1]
可下载PDF全文。
Interaction between urbanization and eco-environment in Tibetan Plateau
DOI:10.11821/dlxb202007005
[本文引用: 1]
Scientifically assessing the interaction between urbanization and eco-environment in the Tibetan Plateau is critical for optimization of urbanization speed and quality, and for the restoration and improvement of the eco-environment. Based on previous studies about the interaction between urbanization and eco-environment in the Tibetan Plateau, we established complete analysis models to examine the overall process, including comprehensive evaluation index analysis, coupling coordination degree measurement, coupling type identification, decoupling path exploration, and future trend prediction. We used a multi-scale comparison analysis method to clarify the differences between scales (across the Tibetan Plateau and its provinces and prefecture-level cities), identify the problem regions, and propose customized improvement measures. Here we show that the comprehensive evaluation index of urbanization has experienced a staged upward trend in different scales, and the overall urbanization index of Qinghai is higher than that of Tibet. However, the changing trends of the eco-environment index are different. The changes in eco-environment index of Qinghai show a decreasing trend, whereas Tibet's changes tend to be stable. The eco-environment index of prefecture-level cities is stratified. We also found that the changing trends of coupling coordination degree of urbanization and eco-environment in different scales were overall rising. The coupling type has changed from imbalanced recession type to nearly imbalanced recession type, and finally to grudgingly coordinated development type. However, most of these types are lagged urbanization types. The alternate change trend between strong decoupling and weak decoupling indicates a negative interaction between urbanization and the eco-environment at different scales. Thus, it can be inferred that the lagged urbanization is a prominent phenomenon. The result of predication shows that in the next 10 years the coupling coordination degree of urbanization and eco-environment will increase steadily in all geographic units, but there will be a gap in the growth rate.
青藏高原城镇化与生态环境交互影响关系分析
DOI:10.11821/dlxb202007005
[本文引用: 1]
科学评估青藏高原城镇化与生态环境交互影响的总体状况,对优化城镇化速度和质量,修复和提升生态环境状态具有重要意义。在梳理青藏高原城镇化与生态环境交互影响研究进展基础上,本文尝试构建一套完整的城镇化与生态环境交互影响分析模型体系,实现从综合评价指数分析、耦合协调度量化、耦合类型识别、解耦路径探索到未来趋势预测的全过程解析。以青藏高原及其省域、地级单元多尺度分析对比为手段,尝试厘清尺度之间的差异性,识别出问题区域,并提出针对性的改进措施。研究发现,青藏高原不同尺度间城镇化综合评价指数呈阶段性上升趋势,青海的整体城镇化指数高于西藏;生态环境指数变化趋势不同,青海呈下降态势,西藏则趋向平稳,各地级单元生态环境指数存在分层现象。青藏高原不同尺度城镇化与生态环境耦合协调度总体呈上升趋势,协调类型由失调衰退类向濒临失调衰退类转变,最后转为勉强协调发展类,基本属于城镇化滞后型。城镇化指数与生态环境指数呈现出强脱钩、弱脱钩交互出现的波动态势,说明不同尺度间存在城镇化与生态环境的负相互作用,消极城镇化现象突出。通过预测,青藏高原各地级单元在未来10年内,系统耦合协调度将稳步上升,但各地增长速度将存在显著差距。
Crop cover reconstruction and its effects on sediment retention in the Tibetan Plateau for 1900-2000
DOI:10.1007/s11442-017-1406-4
[本文引用: 1]
Geographically explicit historical land use and land cover datasets are increasingly required in studies of climatic and ecological effects of human activities. In this study, using historical population data as a proxy, the provincial cropland areas of Qinghai province and the Tibet Autonomous Region (TAR) for 1900, 1930, and 1950 were estimated. The cropland areas of Qinghai and the TAR for 1980 and 2000 were obtained from published statistical data with revisions. Using a land suitability for cultivation model, the provincial cropland areas for the 20th century were converted into crop cover datasets with a resolution of 1 × 1 km. Finally, changes of sediment retention due to crop cover change were assessed using the sediment delivery ratio module of the Integrated Valuation of Ecosystem Services and Trade-offs (InVEST) model (version 3.3.1). There were two main results. (1) For 1950-1980 the fractional cropland area increased from 0.32% to 0.48% and land use clearly intensified in the Tibetan Plateau (TP), especially in the Yellow River-Huangshui River Valley (YHRV) and the midstream of the Yarlung Zangbo River and its two tributaries valley (YRTT). For other periods of the 20th century, stability was the main trend. (2) For 1950-1980, sediment export increased rapidly in the Minhe autonomous county of the YHRV, and in the Nianchu River and Lhasa River basins of the YRTT, which means that sediment retention clearly decreased in these regions over this period. The results of this assessment provide scientific support for conservation planning, development planning, or restoration activities.
Spatialization method of grazing intensity and its application in Tibetan Plateau
DOI:10.11821/dlxb202203004
[本文引用: 1]
Spatialization of human activity intensity is the basis for examining regional differences of human activities and its change process, and it is also the scientific basis for accurately identifying the driving factors of land change and rationally regulating human activities. The current research on human activity intensity mostly uses mathematical methods to spatially assign indirect indicators, which lacks the reflection of the mechanism of human activity and also restricts the display of the spatial heterogeneity of human activity intensity. This paper took grazing activity on the Tibetan Plateau as the research object in an attempt to spatialize grazing intensity. First, based on grazing preferences and grassland management strategies, and from the perspective of grazing mechanism, we proposed a method to distinguish grazing areas and non-grazing areas; then, we used grazing density to measure the overall grazing pressure of grassland, and used grazing probability to describe the spatial difference of grazing pressure. In addition, we developed a spatial model of regional grazing intensity according to grazing density and grazing probability. As a case study, we used this model to spatialize grazing intensity of Zeku County, a typical pastoral area on the Tibetan Plateau, based on township-level animal husbandry data and basic physical geographic information. The results showed that the spatial model of grazing intensity we developed can reflect the spatial characteristics of grazing activity well, and the selection of direct indicators and objective assignment methods improve the accuracy of the spatialization results. It is also found that the results of this paper can more clearly reflected the spatial difference of grazing intensity within the county than the previous research results, and the change process of grazing intensity had a better coupling with the change of NDVI value over the same period. This paper could provide a useful reference for the research on spatialization methods of human activities.
青藏高原放牧强度空间化方法与应用
DOI:10.11821/dlxb202203004
[本文引用: 1]
人类活动强度空间化是分析人类活动区域差异及其变化过程的基础,也是准确辨识土地变化驱动因素、合理调控人类活动的科学依据。当前人类活动强度研究多以数理方法对代用指标进行空间化,缺乏对人类活动机理过程的反映,也制约了人类活动强度空间异质性的展现。本文以青藏高原放牧活动为研究对象,在综合放牧喜好和草地管理策略的基础上,从放牧行为机理的角度,提出了区分放牧区与非放牧区的方法;以放牧密度衡量草地整体放牧压力,以放牧概率刻画放牧活动的空间差异,构建了区域放牧强度空间化模型。并以高原典型牧业县—泽库县为例,基于乡镇级牧业数据和自然地理基础信息进行了实证研究。结果表明:空间化结果较好反映了泽库县放牧强度的空间特征;直接指标的选取和客观的赋值方法提高了放牧强度空间化结果的准确性;比现有研究结果更能体现出县域内放牧强度的空间差异,且放牧强度变化过程与同期NDVI值变化具有较好的耦合性。本文为人类活动空间化方法研究提供了有益参考。
Spatiotemporal evolution characteristics of livestock-carrying pressure in China and its implications for grassland ecosystem conservation pattern
DOI:10.11821/dlxb202011009
[本文引用: 1]
Being a key ecological security barrier and production base for grassland animal husbandry in China, the balance between grassland forage supply and livestock-carrying pressure in China's pasture regions directly affects grassland degradation and restoration, thereby impacting grassland ecosystem services. This paper analyzes the spatiotemporal variation in grassland vegetation coverage, forage supply, and the balance between grassland forage supply and livestock-carrying pressure in China's pasture regions from 2000 to 2015. We then discuss the spatial pattern of grassland ecological conservation under the impacts of grassland degradation and restoration, and livestock-carrying pressure. Over the last 16 years, the total grassland area in China's pasture regions decreased by 16,000 km2, with vegetation coverage degraded in 6.7% of grasslands but significantly restored in 5.4% of grasslands. The provisioning of forage by natural grassland mainly increased over time, with an annual growth rate of approximately 0.3 kg/hm2, but livestock-carrying pressure also increased continuously. The livestock-carrying pressure index (without any supplementary feeding) reached as high as 3.8. Apart from the potential livestock carrying capacity in northeastern Inner Mongolia and the central Tibetan Plateau, that in most parts of China's pasture regions is currently overburdened. Considering the actual supplementary feeding during the cold season, the livestock-carrying pressure index is about 3.1, with the livestock-carrying pressure mitigated in central and eastern Inner Mongolia. Assuming full supplemental feeding in the cold season, livestock-carrying pressure index will fall to 1.9, thus significantly alleviating pressure in Inner Mongolia and the Tibetan Plateau. Based on these data, we propose different conservation and development strategies to balance grassland ecological conservation and animal husbandry production in different regions, namely nature reserves, pastoral areas, semi-farming and semi-pastoral areas, and farming areas, according to prevailing patterns of grassland ecological protection.
中国草畜平衡状态时空演变指示的草地生态保护格局
DOI:10.11821/dlxb202011009
[本文引用: 1]
中国草原牧区作为重要生态安全屏障和草地畜牧业生产基地,其草畜平衡状态直接影响草地退化与恢复,进而影响草地生态系统服务能力的强弱。本文分析了2000—2015年主要草原牧区草地植被覆盖、牧草供给、草畜平衡状态的时空变化特征,深入探讨草地退化与恢复及载畜压力下草地生态系统保护与恢复空间格局。结果表明:过去16年主要草原牧区草地面积净减少约163万hm<sup>2</sup>,6.7%的草地出现植被覆盖退化,而5.4%的草地呈现植被覆盖明显恢复。天然草地牧草供给量以增加为主,年增率约0.3 kg/hm<sup>2</sup>,然而其载畜压力亦持续增加,不考虑补饲的载畜压力指数高达3.8,除内蒙古东北部、青藏高原中部仍有载畜潜力,其余多处于超载状态;考虑实际冷季补饲的载畜压力指数约3.1,内蒙古中东部有所缓解;假设冷季全额补饲则载畜压力指数减至1.9,内蒙古、青藏高原等区域明显缓解。叠加上述数据,本文针对自然保护地、牧区、半农半牧区和农区等不同区域的草地生态保护格局,提出了平衡草地生态保护与畜牧生产利用的不同发展策略。
Spatial patterns of ecosystem water conservation in China and its impact factors analysis
中国生态系统水源涵养空间特征及其影响因素
Comprehensive evaluation and spatial-temporal changes of eco-environmental quality based on MODIS in Tibet during 2006-2016
DOI:10.11821/dlxb201907012
[本文引用: 1]
In view of the lack of research on the screening and comprehensive evaluation of vegetation ecological parameters based on remotely sensed date products, this paper firstly proposes a method to evaluate the vegetation eco-environmental quality in Tibet by PCA (principal component analysis). Based on five indicators, including fractional vegetation coverage (FVC), leaf area index (LAI), gross primary productivity (GPP), land surface temperature (LST) and modified wet (Wet) from MODIS satellite data, the law and mechanism of spatial-temporal changes of eco-environmental quality in Tibet in the last 10 years are explored. The experimental results show that: (1) The comprehensive quality of the eco-environmental quality in Tibet is relatively fragile, and the spatial difference in eco-environmental quality is significant. It is excellent in the southeast but poor in the northwest. (2) During the period from 2006 to 2016, the eco-environmental quality in Tibet shows a trend of improving overall. In terms of time series, the proportion of areas improved and degraded in the past 10 years was 31.88% and 4.13% respectively. In terms of spatial distribution, the improved areas are distributed in the northwestwen, central and eastern parts, but but the degraded areas are distributed in the southeastern parts. (3) Improvements in hydrothermal conditions (especially the increase in precipitation) and human protection policies have led to improvements in the eco-environmental quality in the western and central Tibet. The strengthening of social and economic activities is the main reason for the deterioration of the eco-environmental quality in the southeast of Tibet.
基于MODIS的2006—2016年西藏生态质量综合评价及其时空变化
DOI:10.11821/dlxb201907012
[本文引用: 1]
针对缺少基于遥感数据产品的西藏地区植被生态参数筛选及综合评价的研究现状,以2006年和2016年西藏地区MODIS卫星遥感产品反演得到的植被覆盖度、叶面积指数、植被总初级生产力、区域热度与改进的湿度5项指标为基础,提出了基于主成分分析法的西藏植被生态环境质量评价方法,并探索了其时空变化规律及机理。结果表明:① 西藏地区植被生态质量整体较为脆弱,且区域差异明显,呈现东南优、西北差的分布格局。② 2006-2016年间西藏地区植被生态质量总体呈现变好的趋势。在时间序列上,2006-2016年间改善、退化的区域占比分别为31.88%和4.13%;在空间分布上,变好的区域分布在西北、中部和东部,变差的区域集中在东南部。③ 水热状况改善特别是降水量的增加和人为保护政策使得研究区西部和中部地区生态质量有所提高。社会经济活动加强是研究区东南部生态质量变差的主要原因。
