

1 引言
山洪是山丘区因短历时强降水诱发在特殊的下垫面下形成的急涨急落地表径流,常造成环境破坏、财产损失和人员伤亡的灾害[7⇓-9]。山洪灾害是多要素共同作用的地域综合体,具有显著的空间分异特征[10⇓⇓-13]。中国地形复杂、暴雨多发、气候多样,山洪灾害频繁发生[14⇓-16]。根据水利部官方多年统计,中国山洪灾害伤亡人数占洪涝灾害的近70%,已成为造成人员伤亡的主要自然灾害之一[17]。因此,开展山洪区划研究是山洪灾害防治管理的重要内容和迫切需要,不仅能有效刻画山洪发灾的空间分异格局,还有利于为缺资料地区山洪预报预警模型的参数区域化移用提供参考,进而为山洪灾害实施“分而治之”的防治和管理提供科学依据[7,9,15,18]。
山洪区划属于地理区划的研究内容之一[7,19⇓ -21],目前学界在综合自然区划[1,5,22]、地貌区划[23-24]、土壤区划[25-26]、气候区划[27-28]、生态区划[29⇓-31]、水文区划[32-33]和洪水区划[14,34]等地理区划开展了大量研究,在山洪区划方面也取得了诸多成果。如,针对山洪的分布特征,1996年赵士鹏[20]制定了中国的山洪灾害特征一致性区划图。针对山洪灾害的防治管理,2006年张平仓等[7]制定了中国的山洪灾害防治区划。这些全国尺度的山洪区划成果为山洪灾害的防灾减灾发挥了重要作用,然而既有的山洪区划由于观测资料的局限性划分出的区划单元界线相对粗略且区划单元数量有限,如中国的山洪灾害特征一致性区划图仅6个区划单元[20]。同时,随着全球气候变化的加剧和城市化的深入,影响山洪灾害的地表要素发生了剧烈变化,亟待利用当前丰富的对地观测资料对山洪区划进行完善和更新[4,21]。此外,中国政府近年来愈发重视山洪灾害问题,调查了1951—2015年期间的历史山洪事件,为更新和制定中国山洪区划方案提供了全面可靠的基础数据[8,9,12,35]。
鉴于此,本文面向山洪预警预报与防治管理需求,综合考虑山洪灾害的致灾因子和孕灾环境两方面的影响因素,构建中国山洪区划的原则、依据和理论框架,运用最新的山洪相关数据,制定中国山洪的一级和二级区划方案。
2 山洪区划的原则与依据
借鉴既有与山洪相关的地理区划成果[7,20,23,26 -27,32,36],本文在进行山洪区划时考虑3个方面原则:① 综合性与主导性原则;② 相似性和差异性原则;③ 完整性和等级性原则。因山洪的形成是降雨和地形地貌等多要素的综合作用结果,需考虑其综合性,而在一级和二级区划中需考虑不同的侧重,本文从孕灾环境和致灾因子的区域分异尺度差异角度考虑,以区域分异尺度较大的地形地貌作为一级区划的主导因素,以区域分异尺度较小的降雨作为二级区划的主导因素。相似性和差异性原则要求山洪区划单元内部的要素需尽量相似,区划要素在区划单元之间则需有较明显的差异性。完整性和等级性原则要求考虑到山洪特征类型的全面性和空间上的连续性和完整性,且不同等级之间的区划单元需有明确的所属和包含关系。
中国三级阶梯[37]、地貌区划[23]、地形区划[36]体现了山洪孕灾环境的空间分异,流域区划[37]、水文区划[32]体现了山洪水文情势地域上的分异规律,气候区划[27]反映了气候分布规律对山洪区域性的影响,土壤区划[26]也呈现出土壤质地地带性分布对山洪空间分异的影响,故中国山洪区划将这些区划作为依据。借鉴李旭旦提出的“界线束”方法[3],通过对这7种区划依据的空间叠加,以保留各类区划的边界特征,再将细碎图斑合并到相邻大图斑,生成中国山洪区划的基础空间单元(图1a)。山丘区是山洪发生的主要区域[38],为将山洪与非山洪形式的洪涝进行区分,本文仅利用中国山丘区(图1b)内的基础空间单元进行中国山洪区划。
图1
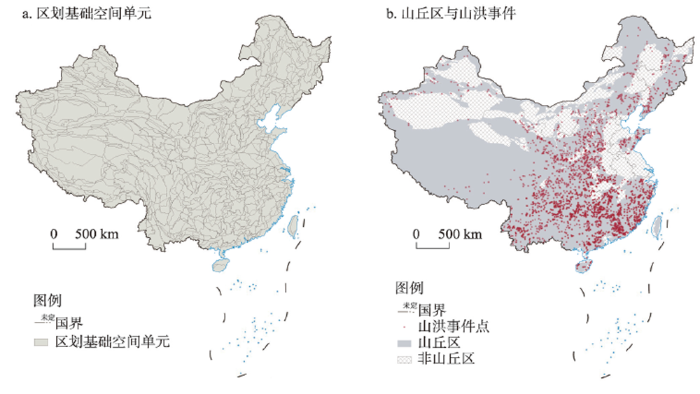
图1
中国山洪区划的基础空间单元和山丘区范围
注:基于自然资源部标准地图服务网站GS(2016)1585号标准地图制作,底图边界无修改。
Fig. 1
The basic spatial unit and mountainous area of the flash flood regionalization in China
3 山洪区划的理论框架
3.1 山洪区划指标体系
表1 中国山洪区划指标体系
Tab. 1
| 指标类型 | 指标名称 | 指标描述 | 指标来源 |
|---|---|---|---|
| 下垫面 | 高程 | 区域平均海拔高度(90 m×90 m栅格) | SRTM3 V4.1数据 ( |
| 高差 | 区域最大和最小高程之差(90 m×90 m栅格) | ||
| 坡度 | 根据高程数据计算得到(90 m×90 m栅格) | ||
| 流域相对高程 | 基于高程数据计算的距离最近河道的高程(90 m×90 m栅格) | MERIT Hydro ( | |
| 植被指数 | 小流域内年度植被指数的平均值 (1 km×1 km栅格) | 2015年度中国植被指数 ( | |
| 平原、台地、丘陵、小起伏山地、中起伏山地、大起伏山地、极大起伏山地的占比 | 根据地貌图集计算区域内7个地貌类型的占比(1 km×1 km栅格) | 《中华人民共和国地貌图集(1∶100万)》 ( | |
| 耕地、林地、草地、水域、建设用地、未利用地、海洋占比 | 根据土地利用数据计算区域内7个土地利用类型的占比(1 km×1 km栅格) | 2020年中国土地利用数据(1 km) ( | |
| 降雨 | 100 a、50 a、20 a、5 a、2 a一遇最大1 h降雨量 | 基于ERA5卫星降水再分析产品,采用皮尔逊III(P-III)曲线[39],计算不同时段不同频率降水设计值,得到最大1 h、3 h、6 h、12 h、24 h不同频率的25个降雨指标(0.25°×0.25°栅格) | ERA5卫星降水再分析产品 ( |
| 100 a、50 a、20 a、5 a、2 a一遇最大3 h降雨量 | |||
| 100 a、50 a、20 a、5 a、2 a一遇最大6 h降雨量 | |||
| 100 a、50 a、20 a、5 a、2 a一遇最大12 h降雨量 | |||
| 100 a、50 a、20 a、5 a、2 a一遇最大24 h降雨量 | |||
| 最大1 h、3 h、6 h、12 h、24 h降雨量均值 | 基于ERA5卫星降水再分析产品,统计计算出不同小时级的5个降雨均值指标(0.25°×0.25°栅格) | ||
| 年均降雨量 | 基于ERA5卫星降水再分析产品,统计年均降雨指标(0.25°×0.25°栅格) |
大量研究表明短历时强降雨是山洪灾害的致灾因子,是引发山洪的直接诱因,主要是在短时期内连续的高强度暴雨累积,加快了地表径流的形成,进而使得山区河流水位上涨,从而导致山洪的发生[8,11 -12,21]。由于雨量、雨强和降雨时长都密切影响着山洪的形成,因此,本文在一级区划的约束下,选择短历时强降水作为山洪二级区划的主导因素,按照降雨的时段长短、频率高低构建了不同等级下的降雨指标,用以研究不同时段、不同频率的降雨对山洪灾害的影响情况。综合考虑降雨数据的可靠性,选择ERA5卫星降水再分析产品,采用皮尔逊III(P-III)曲线[39],计算不同时段不同频率降水设计值,得到最大1 h、3 h、6 h、12 h、24 h不同频率的31个降雨指标,如表1所示。
3.2 山洪区划方法
图2

(1)数据预处理。处理用于山洪一级区划的地形地貌下垫面指标和用于二级区划的短历时强降雨相关的降水指标,并根据山洪区划依据生成山洪的区划基础单元,选取山丘区内的基础空间单元用于中国山洪区划,最后利用历史山洪事件点(图1b)生成山洪事件强度空间分布用于后续分析。
(2)选取下垫面和降雨关键因子。由于下垫面和降雨指标众多,指标中存在冗余和干扰的信息,利用随机森林定量化选取影响山洪一级和二级区划的关键因子。
(3)构建基于自组织映射神经网络(Self-Organizing Map, SOM)的混合聚类模型。综合运用SOM和层次聚类(Ward)各自的优势,以SOM进行一阶段聚类,然后对其结果利用Ward进行二阶段聚类,分别对山丘区内的基础空间单元进行山洪一级和二级关键因子的聚类,得到中国山洪区划的初始聚类结果。
(4)确定山洪区划单元界线。首先,利用聚类有效性指标对不同聚类数的基于SOM混合聚类结果进行评价,选取最优的聚类结果,并对相邻的同类空间单元进行合并。其次,对聚类结果中存在少量碎小斑块,计算各空间单元的面积变异系数及其一阶差分,实现碎小斑块的合并。最后,根据中国主要山脉[40]、山丘区边界和山洪区划依据对区划界线进行自上而下的控制和修正。对于二级区划,结合一级区划边界和山洪的区划依据进行后处理修正。
(5)分析和评价山洪区划方案。根据一级和二级区划结果,分析各区划单元分布的特征。同时,根据中国历史山洪事件点运用地理探测器对山洪一级、二级区划结果进行评价。
(6)命名与编码中国山洪区划方案。根据上述分析和评价结果,按照国家标准对中国山洪一级和二级区划方案进行命名与编码。
3.2.1 山洪区划数据预处理
针对以地形地貌为山洪一级区划的主导要素,预处理得到19个下垫面指标。针对以短历时强降雨为山洪二级区划的主导要素,基于1979—2020年ERA5卫星降水再分析产品,采用皮尔逊III(P-III)曲线[39],计算不同时段不同频率的31个降水指标。根据山洪相关的七种区划依据,通过空间叠加生成山洪的区划基础空间单元。对山丘区内的基础空间单元,分别计算19个下垫面指标与31个降雨指标在各区划基础单元上的均值,用于后续分析。根据历史山洪事件点,利用Getis-Ord Gi*工具,生成山洪事件强度空间分布,用于下垫面和降雨关键因子的选取。
3.2.2 山洪区划关键因子选择
常用的主成分特征选择方法通过线性变换提取主要特征变量,但并不能较好的保留数据信息且对最终降维得到的数量不能很好的估计[21]。近年来,通过基于随机森林的特征选择,可以找到与历史山洪事件相关性强的关键因子,以数量较少的特征来预测因变量[21]。因此,本文利用随机森林算法的特征重要性方法来实现区划关键因子选择。根据历史山洪事件点数据,首先训练随机森林模型,利用袋外样本数据测试模型中每棵树的袋外误差,用于确定指标的重要性。本文选择指标的重要性值超过所有指标重要性均值的指标作为关键因子,用于区划的聚类过程。根据随机森林模型结果,从19个下垫面指标中选出了12个关键因子用于山洪一级区划,包括高程、坡度、高差、流域相对高程、中起伏山地占比、小起伏山地占比、平原占比、林地占比、耕地占比、建设用地占比、植被指数。从31个降雨指标中选出了10个关键因子用于二级区划,包括100 a一遇最大1 h降雨量、100 a一遇最大6 h降雨量、50 a一遇最大1 h降雨量、5 a一遇最大24 h降雨量、2 a一遇最大1 h降雨量、2 a一遇最大24 h降雨量、年均降雨量、最大1 h降雨均值、最大12 h降雨均值、最大24 h降雨均值。
3.2.3 中国山洪区划的混合聚类模型
SOM是一种人工神经网络,它将多维数据点映射到低维空间中,相似的区划基础单元可被投影到地图上附近的神经元上[41]。SOM由两层网络组成,输入层中的神经元个数为用于山洪区划的关键指标数量,输出层被组织成二维网格的拓扑结构。SOM首先用神经元的权重向量
式中:
然后更新获胜神经元及其周围神经元的权重向量,如式(2)所示:
式中:
随着持续的自适应过程,算法递归收敛,其中相似的区划基础单元将链接到输出层的相邻区域。
Ward层次聚类法又称离差平方和法[42],是层次聚类汇总比较成熟的算法,也是区划研究中常使用到的聚类算法,能够强调区域内的一致性和区域间的差异性,以体现区划研究的核心。Ward对于区域中每个基本空间单元初始时自成一类,再计算类重心间方差,首先合并离差平方和增加幅度最小的两类,再逐级进行自下而上合并。假定已经将
全部类内部离差平方和如式(4)所示:
式中:
3.2.4 山洪区划界线划定
因聚类需进行参数优选,且其结果往往存在碎屑多边形等,不满足区划单元连续性的要求,无法直接作为区划结果。因此,需对聚类结果进一步优选,并对优选的聚类结果进行后处理。最后,结合主要山脉、山丘区边界和7种山洪区划依据对聚类结果进行自上而下的控制和修正,以划定最终的中国山洪区划界线,使最终的中国山洪区划方案符合山洪要素的空间分异规律。聚类有效性指标常用来判断聚类结果的质量和寻找最佳聚类数,主要包括外部与内部有效性指标[43]。外部有效性指标只有当数据集外部信息可用时,通过比较聚类结果的类别与已知标签的匹配度来评价,而内部有效性指标主要从类内的紧致度与类间的分离度来评价聚类结果的结构信息,从而确定最佳聚类数。本文选用DBI(Davies-Bouldin Index)[44]作为内部评价指标,利用外部聚类效果指数CQI(Clustering Quality Index)[45]对区划类别进行筛选,以类别数量作为惩罚项,叠加区域山洪关键因子的平均变异系数,来判断最佳聚类数量。因此本文通过DBI和CQI两个聚类有效性指标初步选择出最佳聚类结果。
DBI用来描述类内距离之和与类外距离之比,较低的值将意味着聚类更好,定义如式(5)所示:
式中:
CQI综合考虑了每个空间单元的山洪灾害关键因子,以期在同类别山洪灾害关键因子差异最小化的前提下计算得到最合适的区划类别数量,定义如式(6)所示:
式中:
对于聚类结果中的碎小斑块,计算各个区域面积的变异系数及其一阶差分,通过ArcGIS中的Eliminate工具将其进一步合并到具有最长公共边界的相邻区域内。
3.2.5 中国山洪区划评价
式中:
3.2.6 山洪区划命名与编码
中国山洪区划设计了两个层级的区划体系,一级区划为“区”,二级区划为“地区”。为保证区划单元命名的规范化与标准化,两个等级的山洪区划单元命名主要遵循以下原则:① 体系山洪区划方案的层级特征,标识出各个区划单元的主要特点;② 反映出山洪区划方案层级之间的对应关系,既要体现出不同层级的隶属或关联关系,又要显示同一级别各个区划单元之间特征递变规律;③ 要具有明确的地理信息标识,明确必要的自然背景及管理的侧重信息。在遵循上述原则的命名,可以更加直观地帮助了解基础的地理信息,以便山洪区划方案更好地服务于后续山洪灾害防治管理及推广。本文针对山洪一级区划的命名综合考虑地理位置、气候[27]、水量信息[32]和以历史山洪事件密度刻画的易发性,制定“地理位置+气温带+水量+易发性”的范式。二级区划命名在一级区划层级下反映主要的地理位置,编码顺序是从东北方向开始,以顺时针方向顺序编码命名。
为配合命名体系以及便于计算机处理分析、数据库管理、制图综合等多方面的需求,参考《信息分类和编码的基本原则与方法》(GB/T7027-2002)确定了中国山洪区划的编码方式。山洪一级区划对应大写罗马字母,山洪二级区划对应大写英文字母。
4 中国山洪区划方案
图3
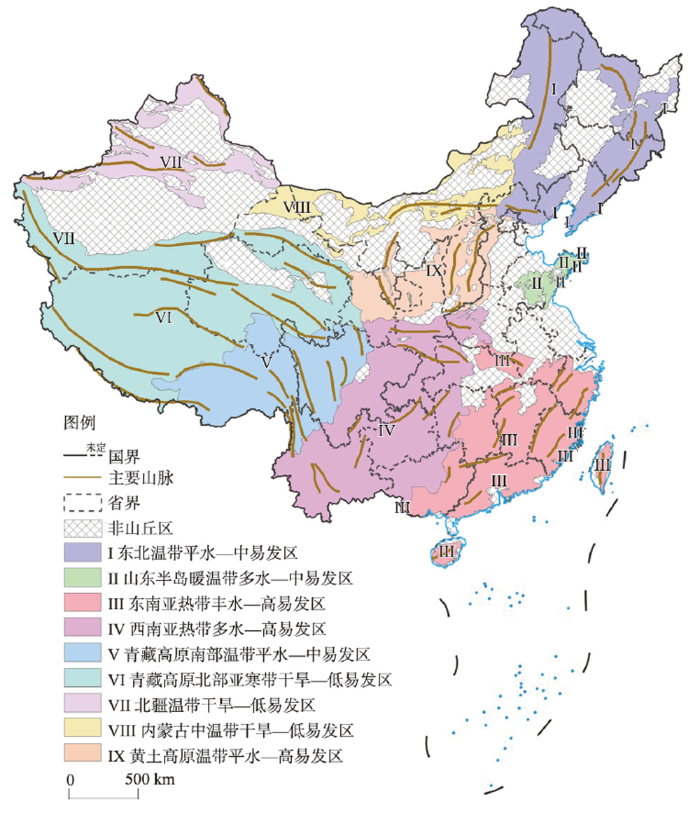
图3
中国山洪一级区划
注:基于自然资源部标准地图服务网站GS(2016)1585号标准地图制作,底图边界无修改。
Fig. 3
The first-grade regionalization scheme of flash flood in China
表2 中国山洪一级区划基本情况
Tab. 2
| 区代码 | 名称 | 面积(万km2) | 空间范围 |
|---|---|---|---|
| I | 东北温带平水— 中易发区 | 89.9 | 该区域为大兴安岭中低山,小兴安岭低山,长白山中低山地,燕山辽西中低山。 |
| II | 山东半岛暖温带多水—中易发区 | 7.4 | 该区域主要是山东半岛低山。 |
| III | 东南亚热带丰水—高易发区 | 88.6 | 该区域主要分布在东南山地丘陵。东部为浙闽低中山、粤闽中低起伏山和台湾低山,北部为大别山中低山,中部包括湘赣小起伏低山丘陵,西部为湘东中低山地,南部为粤桂低山和海南岛。 |
| IV | 西南亚热带多水—高易发区 | 125.3 | 该区域北部为秦巴中低山区,中部为川渝鄂低山丘陵区,南部为云贵高原和桂西北部中低山丘区。 |
| V | 青藏高原南部温带平水—中易发区 | 75.4 | 该区域位于青藏高原的南部地区,东部为川西高原和横断山脉,西部为藏东高山区。 |
| VI | 青藏高原北部亚寒带干旱—低易发区 | 176.6 | 该区域位于青藏高原的北部地区,北部为南疆阿尔金山和昆仑山高山区,东部主要为青海的大部分高山区,南部主要是喜马拉雅山极大起伏高山区,西部主要为喀喇昆仑山脉大起伏极高山区。 |
| VII | 北疆温带干旱— 低易发区 | 41.1 | 该区域位于北疆高山区,北部主要为阿尔泰高山区,南部主要为天山高山地区。 |
| VIII | 内蒙古中温带干旱—低易发区 | 33.4 | 该区域位于内蒙古山丘区,东部主要为阴山山脉地区,西部为内蒙古西部低山地区。 |
| IX | 黄土高原温带平水—高易发区 | 45.4 | 该区域位于黄土高原区域,东部主要为太行山地区,西部主要为贺兰山和六盘水地区。 |
图4
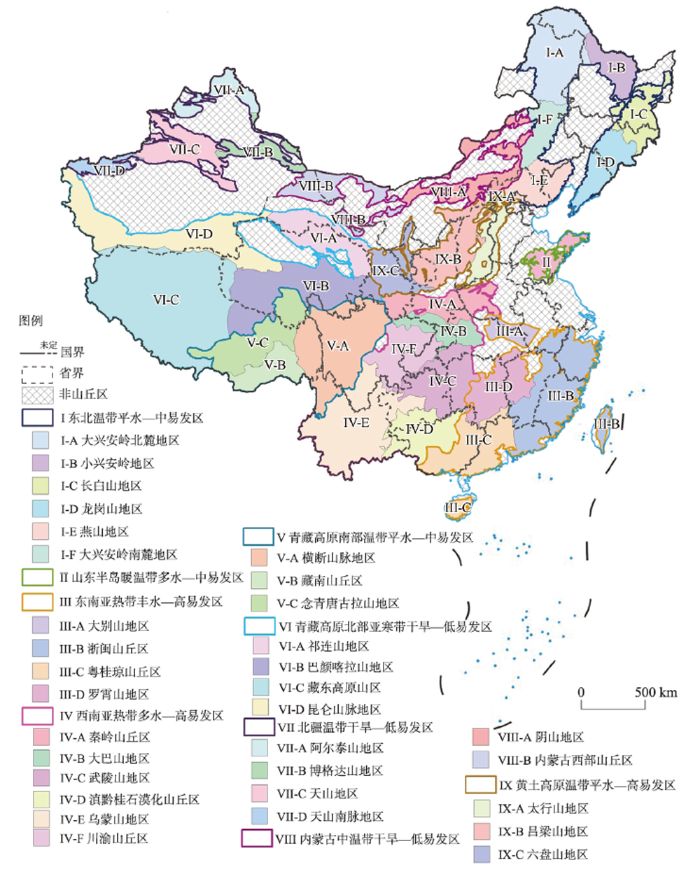
图4
中国山洪二级区划
注:基于自然资源部标准地图服务网站GS(2016)1585号标准地图制作,底图边界无修改。
Fig. 4
The second-grade regionalization scheme of flash flood in China
4.1 一级区划
首先,运用随机森林模型对中国山洪一级区划的地形地貌指标中筛选山洪区划的关键因子,定量化地确定山洪一级区划的指标,避免了传统区划中依靠经验选择指标进行指标分级区划的主观性偏差。其次,以山丘区内的基础空间单元为对象进行基于SOM混合聚类,并根据聚类有效性指标确定最佳聚类方案和中国山洪一级区划的初步结果。然后,结合中国主要山脉、山丘区边界和山洪区划依据,对山洪区划初步结果进行地形地貌空间分异规律的控制与修正。最终,得到图3所示的9个中国山洪一级区划单元:I东北温带平水—中易发区、II山东半岛暖温带多水—中易发区、III东南亚热带丰水—高易发区、IV西南亚热带多水—高易发区、V青藏高原南部温带平水—中易发区、VI青藏高原北部亚寒带干旱—低易发区、VII北疆温带干旱—低易发区、VIII内蒙古中温带干旱—低易发区、IX黄土高原温带平水—高易发区,各区划单元的基本情况如表2所示。
4.2 二级区划
首先选取山洪二级区划主导因素的短时强降雨指标,其次基于SOM混合聚类确定最佳聚类方案和山洪二级区划的初步结果,最后在一级区划和山洪区划依据的约束下,采取自上而下与自下而上相结合的思路得到33个中国山洪二级区划(图4)。一级区划中的I东北温带平水—中易发区被细分为6个二级地区、II山东半岛暖温带多水—中易发区未进一步细分、III东南亚热带丰水—高易发区被细分为4个二级地区、IV西南亚热带多水—高易发区被细分为6个二级地区、V青藏高原南部温带平水—中易发区被细分为3个二级地区、VI青藏高原北部亚寒带干旱—低易发区被细分为4个二级地区、VII北疆温带干旱—低易发区被细分为4个二级地区、VIII内蒙古中温带干旱—低易发区被细分为2个二级地区、IX黄土高原温带平水—高易发区被细分为3个二级地区。
5 讨论
5.1 最佳聚类方案的优选
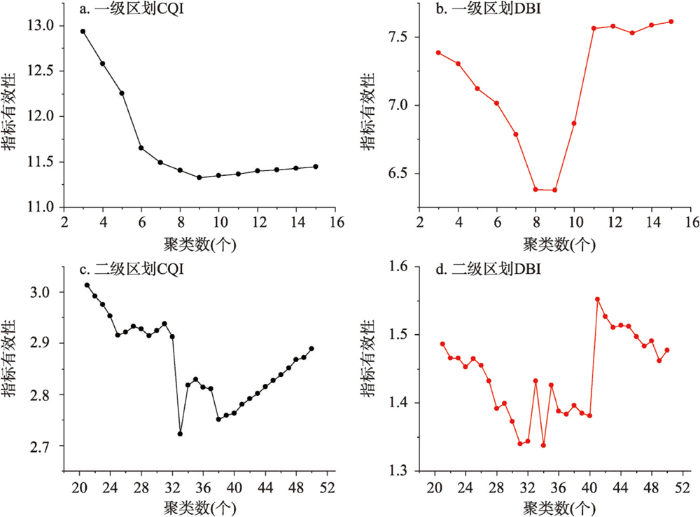
参考现有各类自然地理区划方案一、二级区划中的区划单元数量,本文在聚类时对中国山洪区划的一级区划初始设置聚类数量由3类逐渐增加到15类,二级区划初始设置聚类数量由21类逐渐增加到50类,并对每个聚类结果计算对应的CQI和DBI(图5)。从图5可以看出,一级和二级区划聚类结果的CQI随着聚类数量的增加均呈现先降低后升高的趋势,一级和二级区划分别在聚类数量为9和33的聚类结果时,CQI取得最小值,即认为当聚类类别数为9类和33类时,一级和二级区划的基于SOM混合聚类取得了最佳结果。同时,根据图5中的内部有效性指标DBI也发现一级和二级区划在聚类数量在9类和33类时取值较小。因此,本文选取聚类数量为9类的聚类结果作为中国山洪一级区划的初步结果,选取聚类数量为33类的聚类结果作为中国山洪二级区划的初步结果。
图5
5.2 中国山洪区划方案评价与分析
从图3可见,中国山洪一级区划的I、II和III区划单元位于第一级阶梯内,V和VI两个单元位于第三级阶梯内,其余四个单元位于第二级阶梯内,且一级区划的界线与中国三级阶梯界线吻合度较高。同时,区划单元IV和IX以秦岭分界,V和VI的分界以高大山脉界划分,各区划单元内均包含了较为完整的主要山脉。由此表明本文制定的中国山洪一级区划方案与山洪孕灾的地形地貌环境分异规律较为一致,进一步从孕灾环境的分异角度说明了其实际的含义。从图4可见,中国山洪二级区划根据山洪致灾的降雨因子在各一级区划单元内将不同密度的历史山洪事件划分开。如,III区划单元中的III-B和III-C两个子区与另外子区的山洪触发的降雨分异规律明显不同,且III-B和III-C两个子区的界线将不同疏密分布的历史山洪事件进行了较好区分,表明本文制定的中国山洪二级区划从致灾因子的空间分异角度比较合理地确定了区划的界线。
6 结论
本文面向山洪灾害预警预报与防治管理的迫切需求,以现有的与山洪密切相关的中国三级阶梯、地貌区划、地形区划、流域区划、水文区划、气候区划、土壤区划作为中国山洪区划依据,充分考虑了综合性、主导性、相似性、差异性、完整性和等级性的山洪区划原则,从山洪灾害的致灾因子和孕灾环境两方面构建了中国山洪区划的指标体系,采用了自上而下与自下而上相结合的区划思路并构建了基于自组织神经网络的混合聚类方法,制定了包含9个区划单元的中国山洪一级区划方案和33个区划单元的中国山洪二级区划方案。利用1951—2015年的全国历史山洪事件数据客观评价发现,本文制定的中国山洪区划方案对历史山洪事件的分布解释力较强且与历史山洪事件的疏密分布规律吻合度较高。
本文制定的中国山洪区划方案分别从下垫面和降雨角度刻画了山洪的地区分异规律,不仅有助于在中国因地制宜地部署山洪预报预警模型及其参数区域化移用,而且有利于制定合理的中国山洪灾害防灾减灾措施和推动中国山洪灾害防治管理事业的稳健发展。
参考文献
Understanding of and thinking over geographical regionalization methodology
对自然地理区划方法的认识与思考
Natural regionalization in China
中国自然区划问题
DOI:10.11821/xb196100005
[本文引用: 2]

(一)自然界是一个统一的整体,它是各种现象完整的、相互制约的有规律的组合,我们叫做自然综合体。由于各种自然现象是相互关联、相互制约的,因此,一个自然因素的地域变化必然会影响其他因素的变化;而人类在生产实践中利用自然、改造自然,对任何一个因素采取措施,也必将引起其他因素的相应的变化。
Delimitation of the geographic regions of China
DOI:10.1080/00045604709351955 URL [本文引用: 2]
Frontiers in terrestrial system research in China under global change
全球变化背景下中国自然地域系统研究前沿
DOI:10.11821/dlxb201609001
[本文引用: 2]
中国地域辽阔,基于陆地表层地域分异规律,开展自然地域系统研究是支撑自然资源有序开发和产业合理布局、保障区域可持续发展的重要基础。本文在总结分析中国自然地域系统及相关方法研究进展的基础上,探讨全球变化背景下自然地域系统研究前沿问题。1950s以来,伴随着社会经济发展,中国高度重视自然地域系统研究,包括综合自然区划、生态地理区划和综合区划工作,目前随着全球变化研究的深入,地域系统的动态研究被高度关注。在此过程中,研究方法从以专家智能集成为主的定性研究,逐步发展至以观测、实验和信息技术、数理模拟方法为主的定量研究。随着全球变化研究的日益深入,自然地域系统研究将与未来地球计划的理念、目标和研究内容结合,重点开展陆地表层关键要素相互作用机理及区域效应,地域系统对全球变化的动态响应,陆地表层地域单元界线定量化识别等研究,加强地域系统研究中自然要素与人文要素的结合。
Understanding of some problems in the study of comprehensive regionalization in China
关于开展中国综合区划研究若干问题的认识
The new progresses and development trends in the research of physio-geographical regionalization in China
DOI:10.11820/dlkxjz.2010.11.032
[本文引用: 1]
<p>As is well known, there exist similarities and differences among geographical regions, and zonality is a universal theorem governing geographical patterns. Physio-geographical regional system is a hierarchical system, which is formed by division or combination of natural features based on geographic relativity and geographic zonality. Researches on physio-geographical regional system aim at observing and studying natural complex of the earth’s surface, revealing rules of regional differentiations and exploring formation, development, division, combination, relativity and demarcation of natural regions at different scales, from a regional point of view. As a radical method to obtain geographical information, physio-geographical regionalization has always been studied and widely used by geographers. Studies on physio-geographical regionalization in China have made great progress in principle, methodology, and theory since the 1930s. It could provide a scientific basis for social and economic development and planning, and conservation, improvement and rational utilization of natural environment. Based on brief review of physio-geographical regionalization at home and abroad, the paper summarizes the characteristics of researches in recent years: various types of elements; distinct ecologicalization in comprehensive natural regionalization; a complete series of spatial scales; scarce creativity in technology and methods; emphasizing regionalization methodology; enhancing application of regionalization schemes. Then, the paper analyzes academic problems in the present researches: lack of epistemological study; weak methodological study. Finally, the paper explores the prospects of physio-geographical regionalization: continuous increase in requirement at the national level; strengthening the standardization of regionalization, and raises several trends in geographical regionalization.</p>
中国自然地理区划研究的新进展与发展趋势
DOI:10.11820/dlkxjz.2010.11.032
[本文引用: 1]
依据自然地带性和区域分异规律进行自然区划历来是自然地理学的重要研究内容。它不仅是获取地理知识的重要途径,而且可为拟定和实施社会经济发展规划以及保护、改良和合理利用生态与环境提供必要的科学依据。本文在简要回顾国内外自然地理区划研究发展历程的基础上,总结了中国近年来自然地理区划研究工作的特点:区划要素类型多样、自然综合区划“生态化”明显、区划空间单元及其尺度系列完整、区划技术方法鲜有创新、区划方法论有所重视、区划方案应用指向进一步强化。分析了当前自然地理区划研究工作中存在的学术问题:认识论研究欠缺、方法论研究薄弱。最后,对自然地理区划的未来发展进行了展望:持续增加的国家需求、不断规范化的区划工作,并提出了地理区划的几个发展趋势。
An elementary study on Chinese mountain torrents disaster prevention regionalization
中国山洪灾害防治区划初探
Spatial-temporal distribution and the influencing factors of mountain flood disaster in southwest China
DOI:10.11821/dlxb201907008
[本文引用: 4]
Studies on spatial-temporal characteristics and influencing factors of flash floods are key contents to the assessment and management of flash flood. Based on the historic flash flood data in southwest China from 1960 to 2015, the spatial and temporal distribution of flash flood and its influencing factors were analyzed by using the linear regression model, standard deviation ellipse, spatial autocorrelation, and logistic regression model. The results show that: (1) The annual frequency of flash floods in southwest China shows an exponential growth trend, and the annual variation reveals a stable, slow and rapid increase fluctuation during 1960-1980, 1981-1998 and 1999-2015, respectively; the monthly characteristics are obvious and precipitation is mainly concentrated in June, July and August. (2) The obvious spatial difference of flash flood is observed in the study area, and the high-density areas are mainly concentrated in central Yunnan plateau, Sichuan Basin and their surrounding mountainous areas. The flash flood distribution has a significant spatial positive correlation and spatial agglomeration (Moran's I index is 0.127, Z = 5.784, P = 0.007). (3) The gravity center of historical disasters has a distinct trend of moving to the west during the year. The standard deviation ellipse angle gradually weakens, the long axis gradually lengthens, and the short axis gradually shortens. (4) Rainfall factors have the maximum impact on flash floods, followed by human activity factors, and the minimal is surface environmental factors. Among the rainfall factors, the one-hour rainfall has the strongest impact on flash floods, and its dominant ratio reached 3.654. The results can provide techinical support for research on forming mechanism, monitoring and early warning, and implementation of disaster prevention and mitigation measures of flash floods.
西南地区山洪灾害时空分布特征及其影响因素
DOI:10.11821/dlxb201907008
[本文引用: 4]
山洪灾害时空特征和影响因素是山洪评估与管理的重要内容。根据1960-2015年中国西南地区历史山洪资料,采用线性回归、标准差椭圆、空间自相关和Logistic回归模型,深入分析了西南地区山洪灾害时空分布特征及其影响因素。结果表明:① 西南地区年度山洪灾害频次呈指数增长,年际变化呈现出稳定(1960-1980年)、缓慢波动增加(1981-1998年)、快速增加(1999-2015年)3个阶段;月际特征明显,山洪主要发生在每年6-8月,尤以7月频次最高;② 西南地区山洪灾害空间差异性显著,灾害高密度区主要集中于滇中高原地区、四川盆地和周边山地单元,山洪灾害数量分布呈显著的空间正相关,空间集聚特征明显(Moran's I指数为0.127、Z = 5.784、P = 0.007);③ 西南地区历史灾害点的重心在年内存在明显的向正西方向移动的趋势,年内标准差椭圆转角均逐渐弱化,长轴逐渐变长,短轴逐渐变短;④ 降雨因子对山洪的影响度最高,人类活动因子次之,地表环境因子最低,降雨因子中1 h降雨量对山洪的影响最强,优势比值达到3.654。研究结果可为西南地区山洪灾害形成机理、监测预警研究,实施防灾减灾措施等提供科技支撑。
Key techniques of flash flood disaster prevention in China
中国山洪灾害防御关键技术
Spatial-temporal pattern and driving factors of flash flood disasters in Jiangxi province analyzed by optimal parameters-based geographical detector
基于参数最优地理探测器的江西省山洪灾害时空格局与驱动力研究
Spatio-temporal evolution pattern and driving factors of mountain torrents in China since the founding of the People's Republic of China
DOI:10.1007/s11430-006-0408-3 URL [本文引用: 6]
建国以来中国山洪灾害时空演变格局及驱动因素分析
Risk assessment and zoning of mountain torrent disaster based on GIS in Jiangxi province
基于GIS的江西省山洪灾害风险评价与分区
A GIS-based approach to flood risk zonation
DOI:10.11821/xb200001002
[本文引用: 2]
Flood risk can, in general terms, be defined as probability time consequence. It consists of flood hazard analysis, vulnerability analysis and damage evaluation. A variety of methods have been developed and applied. Among them, Quantitative Risk Analysis (QRA) is a method of quantifying risk through systematic examination of the factors contributing to the flood hazard and affecting the severity of flood consequence, their interaction and relative contribution to the occurrence of the flood. The QRA technique is well established in many fields such as chemical engineering and hazardous materials processing. The application of QRA to flood risk is relatively new and still under development. While the basic risk assessment concepts and tools can be used, the methodologies need to be adapted. Category-based model for flood risk analysis is used to assign a value to each driven-factor such as triggering factor of rainfall, dam break, ground surface conditions of topography, land cover, and others. The keys to the model are to synthesis the spatial-referenced data and create the risk zone. The diffusion of Geographical Information Systems (GIS) technology opens up a range of new possibilities for hazard mitigation and disaster management. Microzonation is greatly facilitated by the kind of automation that GIS offers, especially as it involves comparison, indices and overlays in much the same way that GIS does. In this article, ArcInfo GIS has been chosen to quantitatively represent the influencing factors, spatialize the data into the uniform grid system, and transfer all the data item into the effect degrees on the probability of flooding. At last, with the support of Arc/Info GRID model, a categorical model for flood risk zonation has been put forward. The approach has been applied to the Liaohe river basin, the north-eastern of China, flood disaster risk zonation. The results show that the flood risk of the lower reaches of the Liaohe river is more serious than other places, which accord with the fact. The case study showes that the GIS-based category model is effective in flood risk zonation.
基于GIS的洪水灾害风险区划研究
DOI:10.11821/xb200001002
[本文引用: 2]
洪水灾害风险区划是洪灾评估与管理的重要内容,本文在分析洪灾形成的各主要因子的基础上,提出了基于地理信息系统的洪灾风险区划指标模型,并结合辽河流域具体情况,以降雨、地形和区域社会经济易损为主要指标,得出辽河流域洪灾风险综合区划。
A GIS based regional torrent risk zonation
DOI:10.11821/xb200501010
[本文引用: 2]
<p>This paper explores the methodology for compiling the torrent hazard and risk zonation map by means of GIS technique for the Red River basin in Yunnan province of China, where is vulnerable to torrent floods. Based on a 1:250,000 scale digital map, six factors including the number slope angle, rainstorm days, buffer of river channels, maximum runoff discharge of standard area, debris flow distribution density and flood disaster history were analyzed and superimposed to create the torrent hazard risk evaluation map. Population density, farmland percentage, house property, and GDP as indexes accounting for torrent hazards were analyzed in terms of vulnerability mapping. Torrent risk zonation by means of GIS automatically was overlaid on the two data layers of hazard and vulnerability. Then each grid unit with a resolution of 500 m × 500 m was divided into four categories of the risk: extremely high, high, medium and low. Finally the same level risk was combined into a confirmed zone, which represents torrent risk of the study area. The risk evaluation result in the upper Red River basin shows that the extremely high risk area takes up 17.9% of the total inundated area of 13 150 km<sup>2</sup>, the high risk area is 45.9% of 33 783 km<sup>2</sup>, the medium is 25.2% of 18 563 km<sup>2</sup> and the low risk is 11.0% of 8115 km<sup>2</sup>.</p>
基于GIS的山洪灾害风险区划
Research on spatio temporally-mixed runoff model and parameter regionalization for small and medium-sized catchments
中小流域时空变源混合产流模型及参数区域化方法研究
An integration of GIS and analytical models for evaluation of disasters caused by mountain torrents
DOI:10.11821/xb199605010
[本文引用: 1]
Mountain torrents is a kind of flash floods which bring about a great loss of life and damages of properties in mountainous area.in order to support decision making on disaster reduction and prevention,it is necessary for us to evaluate disasters of mountain torrents quickly and correctly. The difficulties in evaluating disasters of mountain torrents lie in the impossibility of hydrologic observation by conventional method because of the grest flowing velocity and washing force and the insufficiency of information got by remote sensing method because of the short duration of mountain torrents.In order to overcome such difficulties,a new method which is an integration of GIS an analytical models is explored in this paper.what we use is an external integration method,i.e.the analytical model is integrated with GIS system as an external procedure.In the process of evaluating disasters of mountain torrents,the role of GIS is to transform vector data into grid data and to query,access,display and analyse grid data;the role of analytical model is to simulate behaviors of water and sand within grid and among grid and to determine the disaster class for each grid.The procedure for evaluation of disasters caused by mountain torrents is as follows:firstly to establish a database including data collection,map digitization and input of tabular data;secondly,to analyse data including DEM analysis,analysis of drainage network and rastering;thirdly,to run the model which includes sekction of simulation parameters,simulation of flood and simulation of sand transprotation within the watershed;fourthly,to evaluate disasters which includes calculation of washing forces,analysis of disaster──bearing capacity and determination of disaster classes.Taking mountain torrents in the Sunhugou watershed on Aug.10,1969 as an example.we tested this methd.The result showes that integration of GIS and analytical mdel is an efficient method for evaluating disasters caused by mountain torrents.GIS promotes establishment of distributed hydrohgic model by management of spatial data; analytical model extends function of GIS by provision of hydrologic information such as water depth,flowing velocity and sedlment concentration.Compositeness of spatial ad temporal information in GIS is an important part in evaluating disasters caused by mountain torrents.Formation of disaster by mountain torrents is a dynamic process in which sufficient information can be got only by simulation of water and sand behaviors.Efficient management and output spatiotemporal information are a subject that need be further studied in GIS.
基于GIS的山洪灾情评估方法研究
DOI:10.11821/xb199605010
[本文引用: 1]
本文探讨了应用地理信息系统与分析模型相结合的方法评估山洪灾情的途径。山洪灾情评估的难点在于:因山洪速度快、冲击力大常规水文观测难以进行;同时又因山洪历时短暂和影响的空间尺度小,遥感方法难以取得足够的信息。通过建立基于GIS的水沙行为模型,在计算机屏幕上再现洪水场景,输出洪水过程中流速、水深、含沙量等信息,结合承灾体承灾能力分析,使山洪灾情得以准确评估。本方法以孙胡沟1969年8月10日发生的山洪为例进行验证,效果良好。
An elementary study on whole characteristics of mountain torrents disaster system in China and its hazard regionalization
中国山洪灾害系统的整体特征及其危险度区划的初步研究
The comprehensive geographical regionalization of China supporting natural conservation
中国自然保护综合地理区划
Geomorphological regionalization theory system and division methodology of China
DOI:10.11821/dlxb201905001
[本文引用: 4]
Geomorphological regionalization and geomorphological types are the two core contents of geomorphologic research. Despite that there are many research achievements on the study of geomorphological regionalization, defects still exist such as the inconsistence of landform indicators, the small quantity of division grades, the disparity of geomorphological characteristics, the difference of mapping results and the small scale of zoning maps. New requirements for the national geomorphological regionalization therefore should be proposed at the request of national geo-information surveying and other national specific projects. On the basis of combing the theories of geomorphological regionalization in China including plate tectonics and crustal features, geomorphological features from endogenic and exogenic forces, and differences and regional differentiations of geomorphological types, a new research program of China's geomorphological regionalization with five grades, that is, major region, sub-major region, region, sub-region and small region, was proposed based on the previous geomorphological regionalization proposed in 2013 which divided the whole China into 6 major geomorphological regions and 37 districts. The major contents of the new geomorphological regionalization program can be summarized as follows: (1) principles of the national multi-grades geomorphological regionalization were established, (2) hierarchical indicator systems of the geomorphological regionalization (i.e. characteristics of the terrain ladder under the control of tectonic setting, combinations of regional macro-form types, combinations of endogenic and exogenic force and basic types of morphology, combinations of regional morphological types, combinations of regional micro-morphological types) were constructed, (3) naming rules and coding methods of the geomorphological regionalization were proposed, (4) precise positioning techniques and methods of the multi-grades geomorphological regionalization based on multi-source data were developed. On the basis of this new geomorphological regionalization project, the partitioning works of national five-grade geomorphological regionalization of 1:250,000 of China were successfully completed. And the geomorphological regionalization systems of the whole China were divided into 6 major regions, 36 sub-major regions, 136 regions, 331 sub-regions and more than 1500 small regions. In addition, the database and the management information system of the national geomorphological regionalization were then established. This research is of important guiding significance for promoting the development of China's regional geomorphology and the application research based on geomorphological regionalization.
中国地貌区划理论与分区体系研究
DOI:10.11821/dlxb201905001
[本文引用: 4]
区划和类型是地貌学研究的两大核心内容。中国地貌区划已有诸多划分方案,比较而言,各种方案存在遴选指标不一、确定等级较少、反映特征各异、划分结果不同、成图尺度较小等不足。应中国地理国情普查等国家专项任务的需求,对较大尺度、多级地貌区划研究提出了新的要求。在梳理中国地貌区划的理论,包括板块构造与地貌圈特征、地貌形态与内外营力体系、地貌形态的类型组合与区域分异的基础上,基于2013年提出的中国地貌二级区划的新方案,归纳了全国多级地貌区划分的原则,提出了基于“大区—地区—区—亚区—小区”的全国五级地貌等级分区方案,建立了“大地构造控制下的地势阶梯特征—>区域宏观形态类型组合—>内外营力及基本形态类型组合—>区域内形态类型组合—>区域微地貌形态组合”的五级地貌分区指标体系,提出了五级地貌区划体系的命名规则和编码方式,构建了基于多源数据进行多级地貌区划单元精确定位的技术与方法,完成了全国1:25万尺度五级地貌区的划分,包括6个一级大区、36个二级地区、136个三级区、331个四级亚区、1500多个五级小区,并建立了全国地貌区划数据库。该研究对于促进中国区域地貌学的发展、基于地貌区划的应用研究等具有重要的指导意义。
Research on geomorphological regionalization of China
DOI:10.11821/xb201303001
[本文引用: 1]
According to research achievements of Chinese regional geomorphology over nearly 30 years, including landscape classification and landform mapping, this paper systematically discusses the specific steps and methods, principles and the standards for geomorphological regionalization. It is suggested that the basis and standard of geomorphological zoning at all levels not only include the similarities and differences of the combinations of geomorphology type together with the landform genesis, but also its dimension. Based on 1:4000 000 geomorphplogical map of China and the GIS technology, we made an analysis of reasons for the Chinese regional differentiation of the essential geomorphological types and their genesis and divided the whole China into six major geomorphological regions and 38 districts. Region I (eastern hilly plains) is located in the northern part of the low terrain unit of China, in which the largest plain areas of China are distributed. Plains and platforms are dominant and the fluvial accumulation landforms are well developed. This region includes seven districts. Region II (southwestern low-middle mountains) is located in the southern part of the low terrain unit of China, which is dominated by low-elevation hills and low- or middle-relief mountains with only 30% of its area occupied by plain and platforms. Fluvial geomorphologies are typical with a developed karst landform in Southwest China, which can be divided into five districts. Region III (central and northern middle mountains and plateau) is located in the northeastern part of the middle terrain unit of China, characterized by the plateau landform composed of the low- or middle-relief mountains, hills, platforms and plains. Loess landform is well developed. This region includes five districts. Region IV (northwestern middle and high mountains and basins) is located in the northwestern part of the middle terrain unit of China. It is composed of middle to high mountains interposed by flattened basins and is characterized by arid desert geomorphology, where mountains with basins are made up of plains, platforms and hills. This region can be divided into five districts. Region V (southwestern subalpine mountains) is located in the southern part of the middle terrain unit. With a typical karst landform, middle or high mountains with middle or high reliefs are widespread and are scattered by wide valley basins. This region includes five districts. Region VI (Tibetan Plateau) covers the high terrain unit of China. It is composed of plains and high mountains with elevations higher than 4000 m and 3/4 area of the region, and is characterized by glacier and periglacial landforms. This region can be divided into nine districts.
中国地貌区划新论
Reference for soil systematic classification in China
中国土壤系统分类参比
The soil regions of China
中国土壤区划的依据与分区
A new scheme for climate regionalization in China
DOI:10.11821/xb201001002
[本文引用: 4]
A new scheme for climate regionalization in China was established based on the daily observations for 609 meteorological stations during the period 1971-2000.During regionalization,current basic theories,classification methodologies and criteria system were used,besides,five principles were taken into consideration,mainly included zonal and azonal integration,genetic unity and regional relative consistent climate integration,comprehensiveness and leading factors integration,bottom-up and top-down integration,spatial continuity and small patch omission.The new scheme consists of 12 temperature zones,24 moisture regions and 56 climatic sub-regions.
中国气候区划新方案
Seasonal division and trend characteristic of air temperature in China in the last 41 years
1960—2000年中国不同季节的气温分区及趋势
Scheme of ecological regionalization in China
中国生态区划方案
Identifying ecoregion boundaries
DOI:10.1007/s00267-003-0163-6 URL [本文引用: 1]
Research on hydrological regionalization
水文区划问题研究
Zoning of Chinese flood hazard risk
中国洪水灾害危险程度区划
Reasons and risk assessment of housing damage in the national mountain torrent disaster prevention county
全国山洪灾害防治县房屋损毁风险评估及原因探究
DOI:10.3724/SP.J.1047.2017.01575
[本文引用: 2]
中国山洪灾害造成的经济损失在各类灾害损失中所占比重日趋增大,其中房屋损毁是造成经济损失和人员伤亡的重要因素。本文以房屋为研究对象,基于全国山洪灾害调查评价提供的数据,分析房屋暴露量的时空分布特征,构建山洪灾害房屋损毁风险评估模型,对房屋损毁风险进行分析及原因探究。结果表明:① 中国山洪灾害防治县以一层住宅为主,占比达50%以上的防治县分布范围大致与中国第二、三阶梯分界线一致;砖混结构仍为迄今为止中国山区农村运用最为广泛的房屋结构类型,其次为砖木结构,再次为钢混结构和其它结构;② 中国山洪灾害防治县房屋脆弱性呈现西北高、东南低的整体空间格局;房屋损毁风险呈现东部高、西部低的空间分布特征,且损毁风险较高的地区呈带状或集聚状态分布。损毁风险很高的地区集中于辽东半岛、山东半岛、海南岛及东南沿海地带,且在燕山-太行山区呈现沿东北-西南方向的条带状分布,损毁风险较高的地区主要分布于太行山区及长江中下游地区;③ 房屋类型对山洪灾害房屋损毁风险贡献度较高的地区主要为山东省、山西省及河北省;山洪强度对房屋损毁风险贡献率较高的地区主要呈3条条带状分布:燕山-太行山分布带、浙闽滨海丘陵分布带、两广滨海分布带。
Achievements and preliminary analysis on China national flash flood disasters investigation and evaluation
全国山洪灾害调查评价成果及规律初探
DOI:10.3724/SP.J.1047.2017.01548
[本文引用: 2]
山洪灾害调查评价是1949年来水利行业最大的非工程措施项目,是规模最大的全国性防灾减灾基础信息普查工程,历时4年,涉及全国30个省305个市2138个防治县(区),国土面积755万km<sup>2</sup>,人口近9亿。运用普查、详查、外业测量、分析计算等多种手段,掌握了中国山洪灾害防治区范围、人员分布、下垫面条件、社会经济、历史山洪灾害等基本情况,科学分析了山丘区小流域的暴雨洪水特性,评价了现状防洪能力,计算了预警指标,划定了危险区,为山洪灾害预警预报和应急救援决策提供了基础信息支撑。本文系统介绍了全国山洪灾害调查评价的核心要点,综述了调查评价成果,归纳了调查评价成果要素类型,揭示了全国山洪灾害防治区、人口、历史山洪灾害事件与预警能力的空间分布一致性,即山洪灾害各要素集中分布于青藏高原-四川盆地过渡带、川滇交界地区、黄土高原区、东部沿海地区及华北等地区,最后初步探讨了该成果的应用前景。全国山洪灾害调查评价成果将为中国山洪灾害监测预警预报体系建设及防灾减灾能力提升提供丰富的基础数据支撑。
Weight function method for calculating hydrological frequency parameters
计算水文频率参数的权函数法
The geographical legacies of mountains: Impacts on cultural difference landscapes
DOI:10.1080/24694452.2017.1352481 URL [本文引用: 1]
The self-organizing map
DOI:10.1109/5.58325 URL [本文引用: 1]
Hierarchical grouping to optimize an objective function
DOI:10.1080/01621459.1963.10500845 URL [本文引用: 1]
An extensive comparative study of cluster validity indices
DOI:10.1016/j.patcog.2012.07.021 URL [本文引用: 1]
A cluster separation measure
DOI:10.1109/TPAMI.1979.4766909 URL [本文引用: 1]
An ecological function zoning approach coupling SOFM and SVM: A case study in Ordos
DOI:10.11821/dlxb201903005
[本文引用: 1]
It is of great significance to analyze the main environmental issues, coupled with their spatial heterogeneity, and divide the ecological function zones to achieve ecological security and optimization of territory development in a certain region. In recent years, ecological function zoning, widely concerned by scholars, has played a vital role in regional ecosystem management and sustainable development. There arose a problem that the spatial characteristics of ecological functions were hard to be reflected in the previous studies based on spatial average data over basins or geopolitical regions such as counties, cities and provinces. This paper, using the approaches of coupling self-organizing feature map (SOFM) and support vector machine (SVM), attempts to develop an automatic demarcation and zoning approach, and explores the best possible division of ecological functions in the city of Ordos with the index system of ecological function zoning in mind involving the ecosystem services as well as ecological sensitivity. Ordos, which is located in the transitional zone between temperate grasslands and desserts, has become a key research area of global terrestrial ecosystem. The ecological functional zoning indexes indicate that there appears an obvious spatial heterogeneity of ecosystem functions in Ordos. Accordingly, land grids have been clustered into 7 ecological function types by SOFM with clustering quality index (CQI) in view. Hence, Ordos has been divided into 11 ecological function zones owing to the implementation of SVM to identify the optimal division borders, in which the border demarcation is treated as a classification system in spatial domain. The optimal combination of SVM hyperparameters is determined by grid search method. In this study, machine learning algorithm has been adopted to cope with the situation where the bottom-up physical regionalization might weaken the spatial position attribute of the partition features, and to realize the quantitative conversion from classification to partition. It has turned out that such SOFM-SVM-coupled zoning approach could effectively improve the spatial accuracy of the partition, which can be considered as a new way to realize the automatic ecological zoning.
耦合SOFM与SVM的生态功能分区方法: 以鄂尔多斯市为例
DOI:10.11821/dlxb201903005
[本文引用: 1]
辨析区域主要生态环境问题及其空间异质性,划定生态功能区,对保障区域生态安全和国土开发优化具有重要指导意义。以往自下而上的分区研究多基于行政区或流域开展,难以体现行政区或流域内部的生态功能分异。以鄂尔多斯市为例,基于生态系统服务与生态敏感性构建区域生态功能分区指标体系,耦合自组织特征映射(SOFM)网络与支持向量机(SVM)划定鄂尔多斯市生态功能分区。结果表明,区域内各生态功能分区指标呈现明显的空间分异特征,通过SOFM网络基于栅格进行指标聚类,构建分类效果指数筛选最佳聚类方案,将区域分为7种不同的生态功能类型。最终,利用SVM识别最优分区界线,将鄂尔多斯市分为11个生态功能区。本文构建分类效果指数实现多分类方案优选,使用机器学习算法解决自下而上的自然分区容易弱化要素空间位置属性的问题,完成了从分类到分区的定量转换,有助于提升分区的空间精度与客观性,为生态功能分区与分区边界划定提供了新的方法途径。
Geodetector: Principle and prospective
DOI:10.11821/dlxb201701010
[本文引用: 2]
Spatial stratified heterogeneity is the spatial expression of natural and socio-economic process, which is an important approach for human to recognize nature since Aristotle. Geodetector is a new statistical method to detect spatial stratified heterogeneity and reveal the driving factors behind it. This method with no linear hypothesis has elegant form and definite physical meaning. Here is the basic idea behind Geodetector: assuming that the study area is divided into several subareas. The study area is characterized by spatial stratified heterogeneity if the sum of the variance of subareas is less than the regional total variance; and if the spatial distribution of the two variables tends to be consistent, there is statistical correlation between them. Q-statistic in Geodetector has already been applied in many fields of natural and social sciences which can be used to measure spatial stratified heterogeneity, detect explanatory factors and analyze the interactive relationship between variables. In this paper, the authors will illustrate the principle of Geodetector and summarize the characteristics and applications in order to facilitate the using of Geodetector and help readers to recognize, mine and utilize spatial stratified heterogeneity.
地理探测器: 原理与展望
DOI:10.11821/dlxb201701010
[本文引用: 2]
空间分异是自然和社会经济过程的空间表现,也是自亚里士多德以来人类认识自然的重要途径。地理探测器是探测空间分异性,以及揭示其背后驱动因子的一种新的统计学方法,此方法无线性假设,具有优雅的形式和明确的物理含义。基本思想是:假设研究区分为若干子区域,如果子区域的方差之和小于区域总方差,则存在空间分异性;如果两变量的空间分布趋于一致,则两者存在统计关联性。地理探测器q统计量,可用以度量空间分异性、探测解释因子、分析变量之间交互关系,已经在自然和社会科学多领域应用。本文阐述地理探测器的原理,并对其特点及应用进行了归纳总结,以利于读者方便灵活地使用地理探测器来认识、挖掘和利用空间分异性。
Extracting knowledge from legacy maps to delineate eco-geographical regions
DOI:10.1080/13658816.2020.1806284 URL [本文引用: 1]
