

1 引言
现代港口已由传统的以装卸运输为主发展成为集装卸、转运、仓储、拆装箱、加工和信息处理为一体的综合物流服务中心,成为商品流、资金流、技术流、信息流的集散地。航运服务业已经成为推动港口城市空间结构调整与经济发展的关键驱动力,是提升枢纽港口城市全球竞争力的核心要素[1-2]。同时,伴随着互联网与全球化的驱动以及消费方式、生产方式的变革,全球供应链的地理格局正在不断改变[3]。港口企业之间的竞争,由单个港口企业之间的竞争,转变为港口企业所在的港口服务供应链之间的竞争[4-5]。因此,研究全球航运服务业活动在全球的空间组织及其地理影响,探讨不同类型的航运服务业在不同地理环境下的社会过程,分析不同尺度下航运服务业空间网络的结构特征及形成机理,具有重要的理论价值。
对全球城市的研究中,高端生产性服务业及其在全球城市等级制度和城市间网络形成中的作用受到了广泛的关注,但其所依据的高端生产性服务业企业主要包括金融、会计、律所、广告企业、管理咨询企业等,并不包括航运服务业企业[6]。航运服务业是生产性服务业的重要组成部分,在经济全球化中发挥着重要的作用。目前对航运服务业的相关研究中,Beaverstock[7]、Taylor[8]和王列辉等[9]探究了航运服务业的空间网络格局与演变,但研究聚焦于伦敦、新加坡等重要枢纽城市,缺少全球城市之间的横向比较。同时,受数据可获得性的影响,研究对象多侧重于实物运输[10-11],未将航运服务供应链中的其他航运服务业类型纳入研究,局限了对全球航运服务业格局的整体认识。Hall[12]、Slack[13]、陈再齐[14]、邱志萍[15]、高志军[16]对航运服务业分布影响机制分析方面进行了研究,叶士琳等汇总前人研究,将航运服务业的影响因素分为了市场因素、联系性因素、管理与政策因素、历史文化因素4大类[2]。目前航运服务业动力机制的研究较为丰富,但多集中于定性分析,且以整个航运服务业为研究对象,往往忽视了航运服务业内部的动力机制差异性。
对于航运服务业的定义,Fisher协会认为是由港航服务、航运管理等支持性服务业务相互联结而成的供应链[17]。按不同分类标准,可以将航运服务业分为不同类别,例如按产业链可分为上中下游,按附加值和影响力分为低中高端,按构成要素分为核心层、辅助层和支持层,分别表示航运主业、航运辅助业和航运衍生服务业[2,16,18]。本文结合构成要素和供应链视角,将作为“供应者”的船东、船舶管理、船舶修造行业分为上游航运辅助业,将作为“消费者”的航运金融、航运保险、海事法律行业分为下游航运衍生服务业。利用2019年劳合社海事企业名录中的企业总部—分支机构数据,探究上下游航运服务业的网络结构、时空演变和动力机制,以期为中国的国际航运中心建设发展提供理论支撑。
2 研究数据与方法
2.1 研究数据
航运服务业的主体数据来源于劳合社海事企业名录(Lloyd's Maritime Directory)。劳合社是英国最大的保险组织,成立至今已在全球100多个国家和地区设有办事处,其主营业务是水险,约覆盖世界上80%的远洋船舶。该数据具有权威性、体例一致性、覆盖面广等特点。本文利用2019年的劳合社海事企业名录,获取全球船东、船舶管理、船舶修造上游航运辅助业以及航运金融、航运保险、海事法律下游航运衍生服务业的企业数据,汇总上下游航运服务业的企业名称、企业办公地所在城市及所在国家,并通过劳合社海事企业名录以及企业官网,明确企业总部所在城市,构建了全球航运服务业分布数据库(表1)。2019年航运服务业分布在全球1706个城市,其中船东行业分布最广,73.4%的城市里都有分布,海事金融行业分布最少,占比仅4.7%。航运服务业联系城市对数总和达到62842对,其中船东行业的联系最密切,占比约为92.3%,其他行业相对较低。
表1 2019年全球航运服务业分布数据库一览表
Tab. 1
| 船东 | 船舶管理 | 船舶修造 | 海事金融 | 海事保险 | 海事法律 | 合计 | |
|---|---|---|---|---|---|---|---|
| 企业分布城市(个) | 1253 | 436 | 365 | 81 | 248 | 255 | 1706 |
| 企业联系城市(个) | 57371 | 1176 | 1014 | 449 | 840 | 1992 | 62842 |
注:数据从劳合社海事企业名录(Lloyd'S Maritime Directory)整理汇总。
表2 全球航运服务业的影响因素汇总表
Tab. 2
| 类别 | 具体指标 | 指标解释 |
|---|---|---|
| 地方经济 | 国内生产总值(美元) | 一个国家或地区的经济中年生产出的全部最终产品和劳务的价值 |
| 人均国内生产总值(美元) | 国内生产总值与人口总数的比值 | |
| 经济自由度指数 | 反映政府对经济的干涉水平,分值越高,干涉程度越小 | |
| 国际贸易额(美元) | 一个国家或地区商品和服务的进出口总额 | |
| 服务水平 | B2C电子商务指数数据 | 一个国家或地区与在线购物相关服务的水平 |
| 服务贸易额(美元) | 一个国家或地区服务进口和出口的总额 | |
| 国际旅游入境人数(人) | 常居住地不在该国或地区,居住时间不超过12个月,且不以从事获取报酬的活动为旅行目的的游客数量 | |
| 服务业就业人员占比(%) | 服务业就业人员占就业人口总数的百分比 | |
| 航空客运量(人) | 在所在国或地区注册的航空承运人的国内和国际航班乘客数 | |
| 物流绩效 | 班轮运输联通指数 | 一个国家或地区在全球班轮运输网络中的连通程度 |
| 出口清关效率(d) | 货物通过海关清关直接出口的平均时间 | |
| 物流绩效指数 | 一个国家或地区物流水平的总体表现,分数越高表现越好 | |
| 货柜码头吞吐量(TEU) | 通过陆运到海运或者海运到陆路方式运输的集装箱流量 | |
| 政治环境 | 发言权和问责制 | 国家公民在多大程度上能够参与选择他们的政府,以及言论自由、结社自由和媒体自由 |
| 政府效能 | 对公共服务质量、公职人员队伍素质、公职队伍独立于政治压力的程度、政策制订和执行的质量,以及政府对这些政策的承诺的可信度 | |
| 监管质量 | 政府为允许和提升私人部门发展而形成和执行良好政策监管的能力 | |
| 法律原则 | 社会成员对社会规则的信心和遵守规则程度 | |
| 控制腐败 | 公民把公共权力用于谋取私利的程度 | |
| 劳动力 | 人口总数(人) | 一个国家或地区所有公民的总人口数 |
| 人口增长(%) | 一个国家或地区当年的人口数量与前一年的人口数量的比值 | |
| 中等教育年限(a) | 一个国家或地区中学受教育的年限 | |
| Top100高校数量(所) | 一个国家或地区所拥有的Top100名校的数量 |
注:数据主要来源于世界银行,经济自由度指数源自《2019 Index of Economic Freedom》报告,报告由美国传统基金会发表,B2C电子商务指数来源于联合国贸易与发展会议,Top100高校数量指标采用了泰晤士2019年发布的高等教育世界大学排名,政府环境中的5项指标来自机构The Worldwide Governance Indicators,是基于调查机构、智库等近30多个基本数据来源所得。
2.2 研究方法
2.2.1 连锁网络模型
式中:Rab,j是单位链接,表示城市a和城市b在企业j上的服务值;Vaj指城市a在企业j的服务值;Vbj指城市b在企业j的服务值。将两个城市之间所有企业机构的单位链接进行加总,可以得到城市a、b之间的链接Rab。将其进行归一化处理后,将Rab与所有城际联系度中的最大值Rt相除,得到的数值序列介于0~1之间,称之为城际联系度Cab。
表3 航运服务企业总部与分支所在城市的赋值对应关系
Tab. 3
| 企业机构总数量(个) | 总部所在城市赋值 | 分支所在城市赋值 |
|---|---|---|
| > 15 | 5 | 3 |
| 8~14 | 4 | 2 |
| 2~7 | 3 | 1 |
| 0 | 0 |
假设城市数量为n,每个城市与其他任意m个城市之间形成了城市链接,该城市的总联系度由每个城市链接求和所得,即为城市联系度Ca:
2.2.2 负二项回归分析
本文基于回归分析模型,探究航运服务业各个供应链环节在地方经济、服务水平、物流绩效、政治环境、劳动力5大类影响因素中的动力机制。选取2019年航运服务业的截面数据,利用Stata软件,将上下游航运服务业的企业机构数量看作被解释变量,分别与上述影响因素变量进行回归分析。对计算结果进行自相关检验,发现部分变量之间存在较强的共线关系。为消除组内自相关,本文利用多重共线性检验和相关系数矩阵,通过反复对比矫正,删除了具有多重共线关系的国内生产总值、服务贸易额、航空客运量、政府效能、监管质量以及法律原则、中等教育年限等指标,关于全球航运服务业影响因素变量的基本信息见表4。
表4 影响因素变量的描述性统计
Tab. 4
| 变量 | 平均值 | 标准差 | 最小值 | 最大值 |
|---|---|---|---|---|
| 人均GDP(美元) | 15695 | 23352 | 126.9 | 181403 |
| 经济自由度 | 60.38 | 11.54 | 5.9 | 89.4 |
| 国际贸易额(美元) | 2.81×10¹¹ | 7.09×10¹¹ | 1.89×10⁸ | 5.25×10¹² |
| 电子商务指数 | 56.97 | 25.39 | 5.4 | 96.4 |
| 国际旅游入境人数(人) | 1.24×10⁷ | 2.95×10⁷ | 6100 | 2.12×10⁸ |
| 服务业就业人员占比(%) | 57.58 | 17.01 | 17.31 | 88.51 |
| 出口清关效率(d) | 7.638 | 5.191 | 1.1 | 39.3 |
| 物流绩效指数 | 2.871 | 0.559 | 1.71 | 4.2 |
| 班轮运输联通指数 | 28.19 | 26.51 | 0.658 | 151.9 |
| 货柜码头吞吐量(TEU) | 4.37×10⁶ | 1.95×10⁷ | 2366 | 2.42×10⁸ |
| 发言权和问责制 | 0.058 | 0.948 | -2.193 | 1.687 |
| 控制腐败 | -0.000716 | 0.967 | -1.723 | 2.17 |
| 人口总数(人) | 4.20×10⁷ | 1.54×10⁸ | 11646 | 1.40×10⁹ |
| 人口增长率(%) | 1.251 | 1.12 | -1.805 | 4.469 |
| Top100高校数量(所) | 0.581 | 3.347 | 0 | 40 |
由于被解释变量样本方差是均值的两倍以上,本文采用了负二项回归方法,同时,在置信区间内拒绝了alpha为零的原假设,最终采用了标准负二项回归模型,公式如下:
式中:Yi为被解释变量;λi为Yi的估计参数;K表示离散程度,服从均值为0,方差为α的伽马分布;offseti表示模型中的偏移量,通常为常数。
3 上下游航运服务业的空间分布差异
本节通过梳理2019年上下游航运服务业的空间组网联系及特点,揭示了全球不同城市在不同航运服务业类型中的表现,探究了全球航运服务业的网络演变。
3.1 全球层面上下游航运服务业分布差异
从2019年上游航运辅助业跨洲际联系角度,西欧与东亚之间的上游航运辅助业往来是最重要的,跨大西洋两岸与跨太平洋两岸的联系还是以中、低等联系度的城市对为主(图1),北美洲、南美洲与外界联系最高的联系线都是集中于个别城市的,这些“增长极”承担了对外联系最重要的任务。从大洲内部角度,亚洲城市的城际间联系最为密切,联系强度最高;其次是欧洲内部,南美洲、大洋洲内部城市上游航运辅助业联系强度为中等;而北美洲与非洲的内部联系则表现为不太密切。
图1
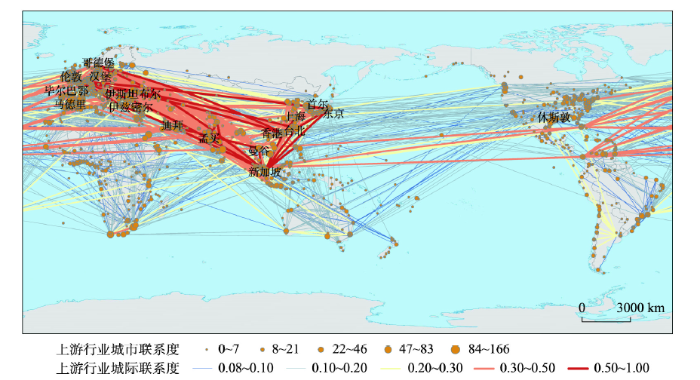
图1
2019年全球上游航运辅助业空间联系分布
注:基于可视化角度,上游选取城际联系度> 0.08、下游选取城际联系度> 0.04的城市对和城市联系度> 0的城市进行分析,下图同;基于国家自然资源部标准地图服务网站审图号GS(2016)1665号标准地图绘制,底图边界无修改。
Fig. 1
Spatial connection distribution of upstream shipping auxiliary industries in 2019
重要城市虽在各大洲均有分布,但亚洲、欧洲是主要的集聚地。在城市联系度排名前20位城市中,有10个位于亚洲。亚洲作为港口航运业发展最快的地区之一,在上游航运市场上具有强大的竞争力,中国的香港、上海、台北等港口城市在航运市场扮演了重要的角色;其中还有9个位于欧洲,但在城际联系度的空间网络上,除伦敦外并没有表现出强大的对外辐射作用,也正是说明了节点城市的覆盖范围与其在企业关联网络地位的相关性较小[23]。
2019年全球下游航运衍生服务业呈现以亚洲、欧洲为主,北美洲、大洋洲为辅的市场格局,较高联系度城市对主要表现为欧洲与亚洲的联系往来,其次为亚洲内部和欧洲、北美洲之间的联系(图2)。中等联系度城市对则主要集中于亚欧大陆内部,低等联系度的分布更为广泛,在各大洲之间都有涉及。
图2
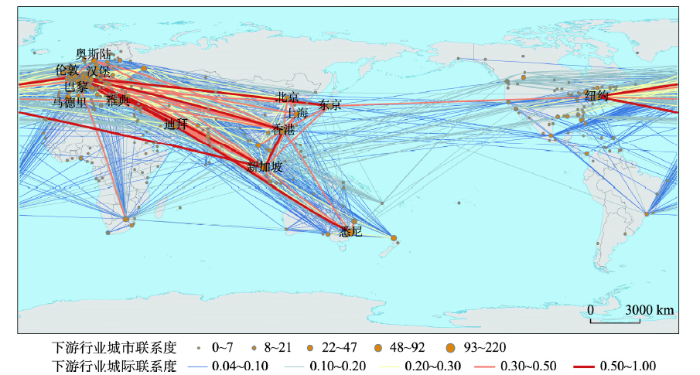
图2
2019年全球下游航运衍生服务业空间联系分布
注:基于国家自然资源部标准地图服务网站审图号GS(2016)1665号标准地图绘制,底图边界无修改。
Fig. 2
Spatial connection distribution of downstream shipping derivative service industries in 2019
与上游航运辅助业相比,下游航运衍生服务业联系度两级分化更为明显,低城际联系度的城市对数量明显更多,下游航运衍生服务业的主要节点城市分布更加分散化,北美洲和大洋洲下游发展比上游更好,拥有更多发展程度较高的城市。上游航运辅助业对实体物流具有高依赖性,而拥有丰富知识和人力资本要素的城市对下游航运衍生服务业拥有更高吸引力。在数量上,下游航运衍生服务业节点城市更少,沿海地区的港口城市几乎都有上游航运辅助业的分布,却不一定有下游航运衍生服务业,这也体现了作为供应链中承担“消费者”身份的下游航运衍生服务业仅集中于各地区的主要城市。
图3
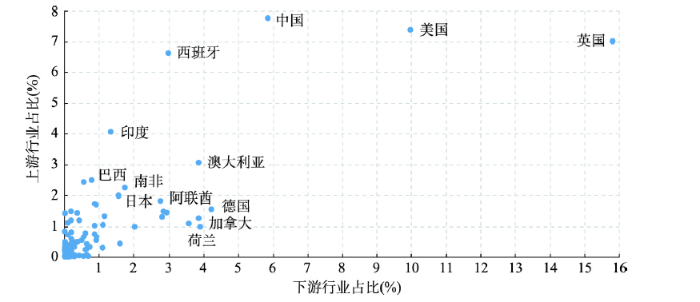
图3
2019年各国上、下游航运服务业占比
Fig. 3
Proportion of upstream and downstream shipping services in various countries in 2019
相比之下,下游航运衍生服务业的空间分布更不均衡(图3),各国占全球的比值差距更大,其中英国、美国遥遥领先,分别为15.83%、9.98%,伦敦、纽约是全球的海事金融中心;海上保险主要市场也集中在欧洲、美国。排名紧随其后的是中国(5.85%),中国作为唯一一个发展中国家位于第3,但与集装箱吞吐量总额相比,下游行业还有很大发展空间。占比1%~3%的国家有12个,剩下85个国家所占份额在1%以下,总体呈现与上游行业相似的金字塔结构,但下游行业中份额两级分化更加明显。下游行业主要是航运衍生的融资、保险、法律活动的企业,需要有一定的上游行业支撑,还与地区发展水平关系密切,因此在各国家间的发展差异更明显。
共有23个国家的上下游航运服务业都位于前30位,这些作为航运服务业领头者的国家,在上下游行业的发展上虽有差异,但上下游行业同属航运服务业,彼此之间的关系是相互联系、相互影响的[25]。中国、西班牙、印度等国的上游占比大于下游,下游行业还有很大发展空间,但难度很大;下游主导型如英国、美国,在下游行业占比都远大于上游行业占比,一方面是这类国家随着产业转移,实体物流的运输量在逐渐减少;另一方面是这些国家在下游行业特别是金融、保险等拥有强劲实力和传统优势。
根据劳氏日报发布的1999年和2019年全球100强集装箱港口排名数据,20年间北美洲、欧洲退出前百强的港口数量较多,而亚洲新进前百强的数量最多(图4)。从港口吞吐量增量来看,增长最明显的港口分布在亚洲地区,呈现全球航运重心东移的格局,特别是大量中国港口跻身全球集装箱港口前100强,反映了中国在海事运输上的迅猛发展,与上游行业地位一致,其中香港作了很大的贡献,内地城市还需加强发展。但从下游行业的发展来看,中国在全球的地位滞后于其货物运输在全球的地位[26]。美国退出前百强的港口多、新进前百强的港口少,美国在上游行业城市分布已比不上中国,但下游行业发展强于中国。欧洲退出前百强的港口也较多,但与美国不同的是,欧洲的上下游航运服务业都在发展,特别是下游航运衍生服务业在欧洲很多城市都发展迅速,说明欧洲城市由实体的物流运输转型为以航运金融、航运保险、海事法律等为主的航运服务业。
图4
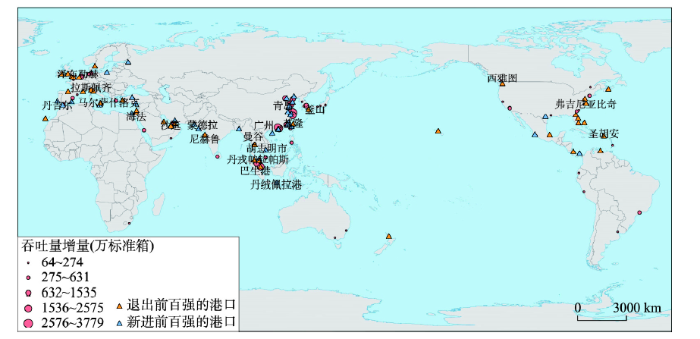
图4
1999—2019年全球前百强集装箱港口吞吐量变化
Fig. 4
Throughput change of top 100 container ports from 1999 to 2019
3.2 重要城市航运服务业联系结构
在全球体系中,不论是发达国家还是发展中国家都呈现主要城市—区域的分布(图5),它们承担了很多重要的功能。支撑这种马赛克模式兴起的主要城市—区域也正在不断成为全球航运服务业的重要引擎。无论是上游航运辅助业还是下游航运衍生服务业都呈现核心—边缘结构,差别在于上游航运辅助业的核心区集中在欧洲和亚洲,下游航运衍生服务业除了亚欧大陆的重要城市外,北美、大洋洲的城市也跻身核心区。
图5
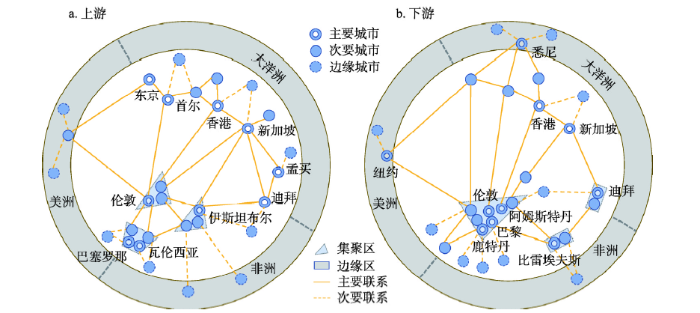
图5
重要节点城市联系结构马赛克图
注:图片改编自艾伦·J.斯科特的《浮现的世界: 21世纪的城市与区域》,江苏凤凰教育出版社,2017。
Fig. 5
Mosaic diagram of important node cities connection structure
上游航运辅助业主要呈现“哑铃型”分布,哑铃的一头为欧洲多个集聚区,这些集聚区都由一个或多个主要城市引领,如伦敦、伊斯坦布尔等;另一头为亚洲的带状分布区,带状骨架由新加坡、香港等主要城市支撑,次要城市和边缘城市则围绕骨架分布;美洲、非洲、大洋洲则属于边缘区,边缘地区参与上游航运辅助业市场的联系较弱,没有主要城市的存在,仅依靠其他地区的主要城市的对外辐射。
下游航运衍生服务业中,纽约和悉尼进入主要市场,亚洲的重要节点数量有所减少,说明亚洲的下游航运衍生服务业发展还有待提升。下游航运衍生服务业更倾向于具有悠久航运服务业传统的城市聚集,其在欧洲更加集聚,分布的城市也更广,地位也更加凸显,形成以伦敦、巴黎、鹿特丹、阿姆斯特丹为主的大集聚组团[27]。同时,组团周围还围绕着不少次要城市和边缘城市,海事金融、保险、法律行业对信息知识的传播、更新交流的便捷性要求更高,在一定空间范围内更显示出地理邻近性。
对上下游航运服务业前30位城市分别进行统计(表5),上游航运辅助业的分布以非首都海港城市为主,航运的核心生产活动主要在港口码头,船东、船舶管理、船舶修造等上游航运辅助业与装卸、搬运、仓储、检验等一系列传统航运活动十分紧密,因此非首都海港城市对于上游航运辅助业的吸引力更大。
表5 城市联系度前30位的城市性质
Tab. 5
| 上游航运辅助业 | 下游航运衍生服务业 | ||||
|---|---|---|---|---|---|
| 首都 | 非首都 海港城市 | 首都 | 非首都 海港城市 | 非首都 内陆城市 | |
| 新加坡 | 伊斯坦布尔 | 伦敦 | 纽约 | 法兰克福 | |
| 伦敦 | 巴塞罗那 | 新加坡 | 香港 | 米兰 | |
| 东京 | 孟买 | 巴黎 | 比雷埃夫斯 | 约翰内斯堡 | |
| 首尔 | 迪拜 | 阿姆斯特丹 | 鹿特丹 | ||
| 马德里 | 香港 | 奥斯陆 | 悉尼 | ||
| 曼谷 | 瓦伦西亚 | 东京 | 迪拜 | ||
| 开普敦 | 上海 | 雅典 | 上海 | ||
| 哥德堡 | 布鲁塞尔 | 汉堡 | |||
| 比雷埃夫斯 | 马德里 | 墨尔本 | |||
| 台北 | 阿布扎比 | 布里斯班 | |||
| 休斯敦 | 北京 | 奥克兰 | |||
| 毕尔巴鄂 | 曼谷 | 多伦多 | |||
| 汉堡 | 莫斯科 | 巴塞罗那 | |||
| 伊兹密尔 | 华盛顿 | ||||
| 萨福克 | |||||
| 吉达 | |||||
| 釜山 | |||||
| 胡志明市 | |||||
| 德班 | |||||
| 比戈 | |||||
| 加的斯 | |||||
| 金奈 | |||||
| 艾塞克斯 | |||||
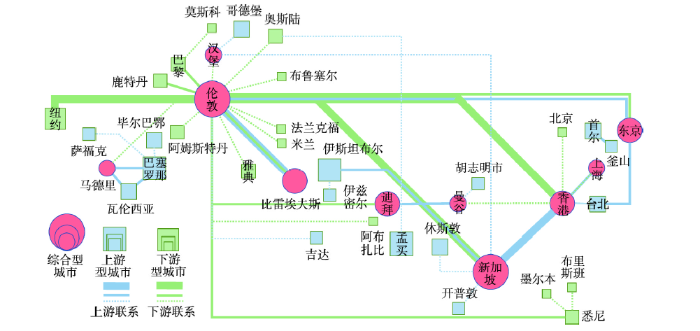
把拥有航运服务业的城市分为上游型城市、下游型城市和综合型城市3类(图6)。全球航运服务业网络形成双中心的结构,欧洲以伦敦这一综合型城市为中心,构建了辐射周边首都等大城市及跨洲际的下游航运衍生服务业网络,伦敦—纽约、伦敦—新加坡、伦敦—香港是全球三大下游航运衍生服务业通道;亚洲形成了以新加坡为中心、联系香港、上海等城市的上游服务业网络。上游型城市往往由于受港口码头的限制,容易与周围的城市形成上游小组团,如位于东亚的首尔—釜山、位于地中海的瓦伦西亚—巴塞罗那;下游型城市主要建立的是与综合型城市之间的联系,如纽约—伦敦、巴黎—伦敦、鹿特丹—伦敦、北京—香港等,这是由于综合型城市的历史、文化、语言、法律、制度等要素更加有吸引力。
图6
3.3 重要城市航运服务业特征分析
在上下游航运服务业中,伦敦和新加坡的城市联系度均位于前3,因此选取这两个城市进行分析。香港和上海是中国沿海两个非常重要的港口城市,选取对这两个港口城市的上下游航运服务业进行对比分析。
3.3.1 伦敦、新加坡的航运服务业特征
伦敦和新加坡都是综合型城市,但两个城市的侧重点有较大不同。伦敦在下游航运衍生服务业中的能级更高,联系度为220,远超排在第2位的纽约(92)和第3位的新加坡(80);而新加坡在上游航运辅助业中的能级超过伦敦,排在1587个城市的第1位,伦敦排在第2位。
伦敦的下游航运衍生服务业能级比上游航运辅助业更高,所辐射的城市节点数量更多。在下游航运衍生服务业的前10条联系中,伦敦占7条,分别是伦敦—新加坡、伦敦—香港、伦敦—纽约、伦敦—比雷埃夫斯、伦敦—迪拜、伦敦—巴黎、伦敦—东京;新加坡仅占3条,分别是新加坡—伦敦、新加坡—香港、新加坡—纽约(图7)。伦敦在国际海运服务市场中扮演着重要的角色,在国际市场中占有很大的份额,例如伦敦在海上保险(P&I Clubs)中占62%,在油轮租船市场中占50%,在干散货租船市场中占30%~40%,许多大型船舶经纪公司的总部都设在伦敦,如Clarksons、Braemar Seascope[29]。伦敦与重要节点如新加坡、香港等的联系度较高,而与一般节点城市的联系度则更低。伦敦的上游航运辅助业重要辐射中,首都城市数量要远小于非首都海港城市,而在下游航运衍生服务业联系中两者数量却相近。
图7
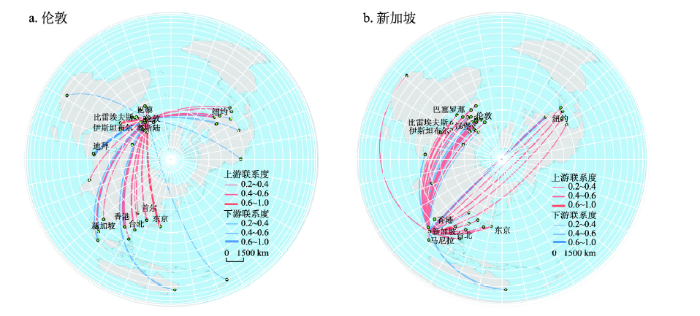
图7
伦敦、新加坡航运服务业对外辐射作用
Fig. 7
External radiation function of shipping services in London and Singapore
近些年新加坡致力于发展国际航运中心,其在航运服务业方面采取的一系列政策,包括积极引入国际船务相关公司进驻当地、为船舶维修行业降税等[30],推动新加坡在上游航运辅助业中占据最重要的地位。新加坡的上游航运辅助业辐射了数量最多的城市,与外界建立了最广泛最密切的联系,也验证了其连续6年位居全球43个国际航运中心榜首的地位,根据《2019新华·波罗的海国际航运中心发展指数报告》显示,新加坡以97.8的高分领跑其他国际航运中心。在上游航运辅助业的前10条联系中,新加坡占4条,分别是新加坡—香港、新加坡—伊斯坦布尔、新加坡—东京、新加坡—比雷埃夫斯;伦敦占3条,分别是伦敦—比雷埃夫斯、伦敦—东京、伦敦—香港(图7)。
随着新加坡等港口城市的兴起,伦敦作为世界头号国际航运中心的地位正受到挑战,2019年对外辐射联系中,伦敦的上游航运辅助业对外辐射能力已落后于新加坡,而亚洲是船舶制造业的主要集聚地,中国和印度等亚洲新兴国家进出口货物也在增加,这些因素都使得船东、船舶管理、船舶修造等上游航运辅助业向东转移。而与上游相比,新加坡在下游航运衍生服务业中对外辐射作用明显更弱,辐射范围更小,按照所辐射的城市性质,仍然有“上游航运辅助业侧重港口,下游航运衍生服务业侧重首都”的特点。
因此,无论从伦敦在航运服务业中的能级还是从联系的强度看,伦敦在海事保险、海事金融、海事法律等下游航运衍生服务业上居于绝对领先的位置;而新加坡在船东、船舶管理、船舶修造等上游航运辅助业上有一定的优势。
3.3.2 香港、上海的对外辐射网络对比分析
在上游航运辅助业网络中,香港的联系度为76,排在全球的第9位,上海的联系度为71,排在第12位,两者差距不大。但是如果考察两者的辐射范围和联系强度,则差别较大。香港—新加坡、香港—伦敦、香港—上海、香港—台北、香港—奥斯陆等的联系分别排在全球上游航运辅助业联系对的第1、6、12、16、24位。上海—香港、上海—天津、上海—广州、上海—厦门、上海—青岛、上海—大连是上海最重要的对外联系对,这些联系对分别排在第12、51、53、75、84和172位。香港的辐射范围涉及亚洲、欧洲等高等级城市,而上海的辐射范围更多局限在中国国内,且联系的强度远不如香港(图8)。
图8
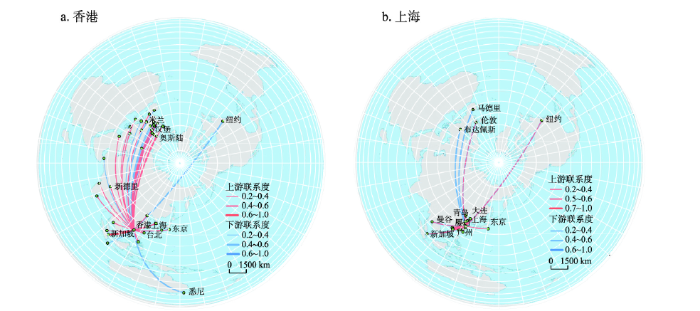
图8
香港、上海航运服务业对外辐射
Fig. 8
External radiation function of shipping services in Hong Kong and Shanghai
在下游航运衍生服务业网络中,香港的联系度为76,排名全球第5位,而上海的联系度仅为35,排在第14位,上海与香港的差距较大。作为全球下游航运衍生服务业排名第3的城市,香港是中国内地联系世界航运市场的桥梁,在“一带一路”倡议和粤港澳大湾区的经济机遇下,香港的地位得到进一步发展,在高质量的海事服务方面享有良好的声誉。香港辐射点均主要聚集在欧洲、亚洲、北美、大洋洲等的最重要城市,包括香港—伦敦、香港—新加坡、香港—纽约、香港—东京、香港—悉尼等,这些都是全球前20的联系对。上海的下游航运衍生服务业联系范围主要集中在亚洲,上海—香港、上海—伦敦、上海—北京、上海—新加坡是上海最重要的对外联系,这些联系对都排在40位之后,其重要性远不如香港(图8)。
全球航运重心的东移,主要体现在东亚地区航运地位的崛起,更主要的是中国沿海港口的发展,上海便是发展最快的港口城市之一,是中国航运资源最集中的地区[31]。2009年国务院第19号文提出,到2020年上海基本建成航运资源高度集聚、航运服务功能健全、航运市场环境优良、现代物流服务高效,具有全球航运资源配置能力的国际航运中心,这标志着上海从深水港等硬环境建设向国际航运中心软环境建设的转变。从2010年取代新加坡排名第1后,上海一直是全球集装箱吞吐量最大的港口。2005年香港全球最繁忙的集装箱港口地位被新加坡取代,此后,香港集装箱吞吐量排名不断下降,2019年仅排在第8位。但不管是上游航运辅助业还是下游航运衍生服务业,不管是本身的能级还是对外辐射的范围和强度,上海与香港的差距明显。集装箱运输量的增加是否会吸引航运金融、航运保险等下游航运衍生服务业的集聚?集装箱运输量的下降是否会导致航运服务业转移到运输量增加的城市?结果显示在上海和香港之间,2010年以来大规模的产业转移并未发生,航运服务业特别是下游航运衍生服务业的根植性是非常强的。
4 影响因素分析
4.1 上游航运辅助业的影响因素分析
2019年上游航运辅助业在经济自由度、电子商务指数、国际旅游入境人数、物流绩效指数、班轮运输联通指数、发言权和问责制等变量中表现出显著性。经济自由度从一定程度上体现了政府对国家经济的干预程度,传统基金会(The Heritage Foundation)将这一指标与经济增长率相联系,认为经济自由度指标越高,经济水平会更加繁荣[32]。经济自由度指数表现出显著性,意味着国民生活水平以及政府对经济的干涉程度会对上游航运辅助业的分布造成显著影响,良好的经济条件吸引大量资金、技术和劳动力集聚,稳定的社会环境保证这些要素平稳运行,这些影响因素共同作用为船东、船舶管理、船舶修造活动运营提供重要保障[33]。
根据回归结果(表6),在服务水平层面,电子商务指数和国际旅游入境人数对上游航运企业数量分布产生影响。电子商务是现代服务业的一个重要组成部分,其主体分布广泛,相应的物流运输范围也很大,这在一定程度上使得物流企业建立起完善的运输网络以提高其服务能力[34],而运输网络需要船东企业的核心支持和船舶管理、船舶修造的辅助支持,进一步推动上游航运辅助业企业的驻扎。国际旅游入境人数往往与地区服务业发展水平相关,入境访客人数上升,当地服务业和运输流动受到一定的促进作用,国内上游行业发展有更好的营商环境,在上游航运辅助业中,表现为船东船舶注册服务更加便捷,船舶管理更为合理且成本较低,船旗国管理制度良好,以及低税制度和相关修造体制完善[35-36]。
表6 负二项回归结果
Tab. 6
| 上游航运辅助业 | 下游航运衍生服务业 | ||||
|---|---|---|---|---|---|
| 影响因素指标 | 系数 | p > z | 系数 | p > z | |
| 人均GDP | -0.361 | 0.118 | 0.017 | 0.874 | |
| 经济自由度 | 0.370 | 0.047** | -0.358 | 0.509 | |
| 国际贸易额 | 0.031 | 0.840 | 0.261 | 0.022** | |
| 电子商务指数 | 0.673 | 0.002** | 0.642 | 0.041** | |
| 国际旅游入境人数 | 0.174 | 0.075* | -0.084 | 0.623 | |
| 服务业就业人员占比 | 0.105 | 0.430 | -0.303 | 0.192 | |
| 出口清关效率 | 0.063 | 0.355 | 0.245 | 0.085* | |
| 物流绩效指数 | 0.511 | 0.006** | 0.527 | 0.026** | |
| 班轮运输联通指数 | 0.536 | 0*** | -0.041 | 0.840 | |
| 货柜码头吞吐量 | -0.441 | 0.224 | 0.422 | 0.457 | |
| 发言权和问责制 | 0.066 | 0.023* | -0.355 | 0.234 | |
| 控制腐败 | 0.046 | 0.840 | 0.347 | 0.013** | |
| 人口总数 | 0.413 | 0.346 | -0.097 | 0.300 | |
| 人口增长率 | -0.175 | 0.227 | 0.081 | 0.594 | |
| Top100高校数量 | -0.044 | 0.605 | 0.255 | 0.075* | |
注:*表示在10%显著性水平下显著,**表示在5%显著性水平下显著,***表示在1%显著性水平下显著。
在物流绩效层面,班轮运输连通指数、物流绩效指数都表现明显正相关作用,系数值也较高,出口清关效率与货柜码头吞吐量对上游航运辅助业无显著影响。班轮运输连通指数表征了一个国家在全球班轮运输网络中的地位,反映了当地的航运需求变化以及承运人决策的多样性,班轮运输的连通度越高,该国家拥有的上游航运企业数量越多。班轮运输连通度较高的国家拥有较多固定船期的轮船公司、较高的网络地位以及广阔的市场需求,因此吸引了大量上游航运辅助业在此部署船舶或展开投资。物流绩效指数代表一个国家物流水平的总体表现,评分越高表示更高的物流水平,吸引着上游行业的投资建设,是上游航运行业发展的主要动力。
在政治环境方面,发言权和问责制变量影响着上游航运辅助业分布,控制腐败变量无显著性。发言权和问责制取自全球治理指数,侧重于反映社会管理水平,体现了政府治理的有效性。船舶和船舶管理在国家海上总体安全稳定的情况下,依旧是安全风险中突出的一项,也是政府治理关注的重点[37],政府有效的治理对船东、船舶管理、船舶修造等企业提供了坚实的保障。
4.2 下游航运衍生服务业的影响因素分析
在地方经济层面,人均GDP变量未对上、下游行业产生显著影响性,而国际贸易额表现出对下游行业的显著影响,下游行业对地方的外贸活动依赖性更强。海洋运输是实现国际贸易的重要纽带和桥梁[39],在跨境贸易活动时,尤其航运保险、海事法律企业比在境内发挥更大的作用。物流绩效层面对上、下游行业影响都较大,除物流绩效指数,出口清关效率对下游行业也呈现正相关,货物的出口通关速度直接影响着企业的运营效率,清关效率越高的地区,对企业集聚的吸引力更大。货柜码头吞吐量没有呈现显著性,这也侧面反映了实体物流与航运服务业之间存在一定的不协调性,据前文的分析,尤其与下游行业存在脱节,两者的关系究竟如何是值得下一步探讨的问题。
控制腐败变量与下游航运衍生服务业有正相关关系,政府治理对于海事法律具有监管作用,使得下游行业企业分布也受到一定的政治因素影响。Top 100高校数量指标仅对下游航运衍生服务业呈现显著影响,反映了下游航运衍生服务业对高端人才更加依赖,与上游航运辅助业以劳动力密集型企业集聚的特征有所不同。一些国家的下游航运衍生服务业发展相对滞后,一方面是由于其航运服务业市场体系结构不完整,供需关系不稳定,还有个重要的限制因素就是专业人才的缺乏。可见,巴拿马、巴西、印尼以及马来西亚具备较好的物流运输能力,但下游航运衍生服务业排名十分靠后,其中也有教育文化水平的限制作用,其国内缺乏精通航运和金融法律知识的复合型人才。
5 结论
(1)在上游航运辅助业中,亚洲、欧洲为主要分布集聚地,内部呈现以重要城市向外辐射的空间形态。亚洲已成为全球港口航运业发展核心,中国、印度、土耳其、日本吸引了较多上游企业的集聚,有较多重要节点城市的分布。欧洲主要以英国伦敦为重心向其他城市辐射,其他城市与外界联系相对较弱,而其他大洲也呈现由单个城市承担主要对外联系的空间格局。各国家间分布主要呈现金字塔结构,以中国、美国、英国、西班牙4个国家领先,各级间差异明显。上游航运辅助业主要依托于货物运输,受自然条件和区位条件等因素的影响较大,通常随货物运输转移而转移。上游航运辅助业重要节点城市以非首都海港城市为主,多是船东、船舶管理、船舶修造等行业的起源地。
(2)在下游航运衍生服务业中,欧洲、亚洲也是主要的市场,形成以英国伦敦为重心、向全球其他城市发散的格局,显示出伦敦在下游航运衍生服务业中重要的地位。此外,北美洲和大洋洲在下游行业的表现要比它们在上游的更好,这是亚洲在下游行业市场被挤占的体现。国家间分布差异呈现与上游相似的金字塔结构,份额最大国家包括英国、美国、中国,两极化差异更加显著,伦敦、纽约、香港分别是各国最主要的支撑,这3个城市正是主导世界金融网的“纽伦港”。这些下游行业发达的城市,在历史、文化、语言、法律、制度方面更具包容性,易吸引海事金融、海事保险、海事法律等行业的集中,因此拥有下游行业的首都城市数量要多于非首都海港城市,这一点正好与上游航运辅助业所集聚城市的性质相反,这也是由航运服务业属性所带来的影响。而在伦敦、新加坡等单个城市对外辐射的格局中,也呈现出上游以非首都海港城市为主,下游以首都城市为主的特征,这充分体现了城市性质对不同行业的吸引力有很大差异。
(3)从影响机制来看,对上下游航运服务业分布均产生影响的指标有:电子商务指数和物流绩效指数,当这两项指数越高时,航运服务业的企业数量也会越多,上下游行业之间的关系也是相互影响的。此外,影响上下游航运服务业的因素存在一定差异性,上游航运辅助业主要受经济自由、旅游人数、班轮运输联通度的影响;而下游航运衍生服务业则与对外贸易情况、清关效率和高校数量相关,更倾向于集聚在经济、文化更综合的地区。
(4)中国海运业的特点是规模较大,上游企业分布数量较多,2019年全球前10大集装箱港口排名,中国共有7个港口入围。但下游企业实力不强,特别是内地城市航运服务业水平较低,整体发展还不均衡。在“一带一路”倡议下,中国要由航运大国向航运强国转变,发展高端航运服务业对于中国港口巩固与提升国际航运的地位和功能具有重要意义。中国近年来大力发展航运业,但除香港外,其他城市在上下游航运服务业中的发展,与伦敦、新加坡等城市的差距明显。基于上文对上下游航运服务业的影响因素,提升国家在全球班轮运输网络中的连通性,培养航运复合型人才,提高航运服务业整体水平;另一方面,中国沿海港口城市的自然禀赋不同、航运服务业产业基础差异明显,需要因城施策,如上海在大力发展航运交易、航运金融、海事仲裁、信息咨询等高附加值业务,积极开展融资租赁等金融服务的同时,还要依托在海上运输、海洋工程、海洋研究的综合优势,加快建设成为全球海洋知识经济枢纽,这样既能在全球航运服务业网络中占据重要地位,也能与香港错位竞争,协同发展。
参考文献
International maritime services trends and the study of high-end maritime services development in Ningbo
国际高端航运服务业发展趋势与宁波的策略
Research on port and shipping service industry from the perspective of geography
地理学视角下的港航服务业研究进展
The geography of suppliers and retailers
The location and global network structure of maritime advanced producer services
DOI:10.1177/0042098010391294
URL
[本文引用: 2]

Within research on world cities, much attention has been paid to advanced producer services (APS) and their role within both global urban hierarchies and network formation between cities. What is largely ignored is that these APS provide services to firms operating in a range of different sectors. Does sector-specific specialisation of advanced producer services influence the economic geography of corporate networks between cities? If so, what factors might explain this geographical pattern? This paper investigates these theoretical questions by empirically focusing on those advanced producer services related to the port and maritime sector. The empirical results show that the location of AMPS is correlated with maritime localisation economies, expressed in the presence of shipowners and port-related industry as well as APS in general, but not by throughput flows of ports. Based upon the findings, policy recommendations are addressed.
Subcontracting the accountant! Professional labour markets, migration, and organisational networks in the global accountancy industry
DOI:10.1068/a280303
URL
[本文引用: 1]
In this paper, the notion of the labour market is discussed within the context of international migration of skilled labour in the accountancy industry. The principal arguments reported are that the labour-market practices of large accountancy firms have restructured the demand for professional labour on a global scale. Accounting staff are subcontracted to their firm's international office networks or multinational clients through secondment, transfer, or exchange procedures. Equally, those firms who are members of global accountancy networks subcontract their staff to the international independent member firms.
Advanced producer service firms as strategic networks, global cities as strategic places
DOI:10.1111/ecge.2014.90.issue-3 URL [本文引用: 3]
Changes of ports' connection across the Taiwan Straits in the global maritime network (1895-2016)
DOI:10.11821/dlxb201812002
[本文引用: 1]
Taiwan and the Chinese mainland face each other across the sea, and maritime transport is the most important means for the exchange of goods between the two sides of the Taiwan Straits. Affected by international politics and trade patterns, since the middle and late 19th century, the transportation links between the two sides of the Taiwan Straits have changed dramatically. Using the O-D data of vessels transiting between ports from the Lloyd's database between 1895 and 2008, we studied the changes in the transport links between ports on both sides of the Taiwan Straits at the national and global scales. The analysis concludes as follows: (1) Since before the beginning of modern times until Taiwan was ceded to Japan, Taiwan and the Chinese mainland had island-land relations, and Xiamen Port was the most important transit port to Taiwan. After the Japanese occupation, Taiwan became Japan's source of raw materials and a location in which to sell Japan's goods, and Taiwan, Japan, and the Chinese mainland were forming triangular transportation links. After the confrontation between the two sides of the strait, the United States intervened in the Taiwan Straits, and the transportation links between the ports on both sides of the Taiwan Straits were cut off. Taiwan, the United States, and Japan formed a triangular trade network. After 1979, Hong Kong Port became the most important transit port for cross-strait transport links. After direct flights across the Taiwan Straits were instituted, the port transportation links between Taiwan and the Chinese mainland continued to expand in breadth and depth. (2) Taiwan has obvious advantages in location, but because it is an island, the hinterland is narrow. Therefore, making full use of regional and geopolitical advantages, using the regional economic growth centre as its own foreland and forming a close sea transportation link is key to Taiwan's sustained economic development. Improving relations with the mainland, sharing in opportunities for the development of the mainland, and promoting the transport links between the two sides of the Taiwan Straits are opportunities for Taiwan.
1895—2016年全球海运网络中的海峡两岸港口运输联系变化
DOI:10.11821/dlxb201812002
[本文引用: 1]
台湾地区与中国大陆隔海相望,海上运输是两岸间货物往来的最主要方式。受国际政治和贸易模式的影响,从19世纪中后期以来,两岸港口运输联系变化剧烈。利用劳合社(Lloyd's)1895-2016年两岸港口间航线的O-D数据,从国家层面和全球层面研究海峡两岸港口运输联系的变化。主要结论为:① 近代开埠至割让给日本之前,台湾地区与大陆的海运联系紧密,厦门港是台湾地区最重要的中转港;日据之后,台湾地区成为日本的原料来源地和商品销售地,台湾地区—日本—中国大陆形成三角运输联系;两岸对峙后,两岸港口运输联系切断,台湾地区—美国—日本形成三角贸易网络;1979年后,香港港成为两岸运输联系的最重要中转港,两岸直航后,台湾地区与大陆间的港口运输联系在广度和深度上不断拓展。② 台湾地区区位优势明显,但由于是海岛,陆向腹地狭小,因此充分利用区位优势和地缘优势,把区域经济增长中心作为自身的海向腹地,以形成紧密的海上运输联系是台湾地区经济持续发展的关键。改善与中国大陆之间的关系、分享中国大陆发展的机遇、推动海峡两岸的港口运输联系是台湾地区的“天时”与“人和”。
Port competitiveness, efficiency, and supply chains: A literature review
This article examines such port competitiveness from the perspective of port efficiency and supply chains. Specifically, studies are examined that investigate port competitiveness from the traditional perspective and from the chain perspective. In doing so, methodological problems of the literature in investigating port competitiveness are deduced.
Development of port service network in OBOR via capacity sharing: An idea from Zhejiang province in China
Shifting proximities: The maritime ports sector in an era of global supply chains
DOI:10.1080/00343400903365110 URL [本文引用: 2]
The port service industry in an environment of change
DOI:10.1016/0016-7185(89)90028-6 URL [本文引用: 2]
The spatial characters and associated mechanism of port service industries in Guangzhou
DOI:10.13249/j.cnki.sgs.2010.01.30
[本文引用: 1]
The roles of a port are of importance in the local economy, which has drawn attentions in the many studies. Yet there are relatively few studies on the port service industries. The spatial characters and associated mechanism of the port service industries in Guangzhou were focused on. The pot service industries in Guangzhou wase highly spatial concentrated and Zhujiang-dependence. The spatial concentrating was steady while the shifting of enterprises was very frequent. The spatial distribution of the port service industries varied greatly with the different type. In general, it was apt to be concentrated to the trading port and the CBD. The spatial character is an synthesized outcome of the location, the nature of the industries, the evolution of the port spatial system, the urban planning influences and innovation of ICT.
广州市港口服务业空间特征及其形成机制研究
Research on the structure features evolution and driving factors of global liner shipping network: Based on the social network analysis of UN LSBCI data
DOI:10.2307/141855 URL [本文引用: 1]
全球班轮航运网络结构特征演变及驱动因素: 基于联合国LSBCI数据的社会网络分析
Connotation and formation mechanism of shipping service industry chain
航运服务产业链的内涵与生成机理
Countermeasures for the development of modern shipping service industry in Shanghai
上海市现代航运服务业发展对策
Spatial evolution and factors of global advanced maritime service industry
DOI:10.11821/dlyj020191031
[本文引用: 1]
The maritime service industry has become a key driving force for promoting the spatial structure adjustment and economic development of port cities and is also a core element for enhancing the global competitiveness of hub port cities. Based on the chain network model, the regression model and the list of British Lloyd's Maritime Enterprises, this paper studies the spatial shaping process of the node cities and inter-city links in the global advanced maritime service industry in 1982-2018. The study analyzes the relevance between the connectivity or the number of advanced maritime service producers in the node cities and the shipping, economic, political and cultural location factors. The analysis concludes as follows: (1) Advanced maritime service producers mainly gather in Europe, the Mediterranean and Asia-Pacific region. The east-west market formed by these three regions is the main line of the global advanced maritime service industry. The main spatial pattern changes from "T" shape to triangle. The barycenter of the network is constantly moving eastward and has moved from Europe to the Asia-Pacific region. (2) The network status of the node city is closely related to the strength of the connection between this node city and the top cities and has nothing to do with the extensiveness of the city connection. Node cities can quickly improve their strategic position by establishing strong links with international shipping service centers. (3) The location of the advanced maritime service industry is mainly influenced by capital, technology and market. Its layout is close to customers and markets. These three factors also affect the strength of the aggregation effect of high-end shipping service industry activities. The advanced maritime service industry tends to be knowledge-intensive. (4) With the influence of economic globalization and technological progress, the significance of the relevance between container throughput or regional economy and the layout of the advanced maritime service industry has increased. The significance of the population, ports and administrative centers disappear. The research results reveal the enlightenment and experience of the space-time evolution of the global advanced maritime service industry and provide useful references for the efficient development of international shipping service centers.
全球高端航运服务业的时空演化及影响因素分析
DOI:10.11821/dlyj020191031
[本文引用: 1]
发展高端航运服务业是港口城市产业转型的重要着力点。基于劳合社海事企业名录,利用连锁网络、回归模型等,研究1982—2018年全球高端航运服务业节点城市和城际联系的空间演变及影响因素。结果表明:① 全球高端航运服务业骨架由“T”字型向“大三角形”转变,网络重心不断东移,欧洲、地中海和亚太地区构成的东西向市场是其发展主线。② 节点城市的网络地位提升与该城市和前序城市建立的联系强度有密切关系,与覆盖的市场范围联系不大。③ 高端航运服务业的区位选择主要受资本、技术和市场的共同影响,其布局临近客户和市场,倾向于知识密集型的产业集聚。④ 集装箱吞吐量和地区宏观经济对高端航运服务业布局的显著性增强,人口数量、港口和行政中心的显著性消失。
Global city regions: Their emerging forms
Specification of the world city network
DOI:10.1111/gean.2001.33.issue-2 URL [本文引用: 1]
The cliquishness of world cities
DOI:10.1111/glob.2005.5.issue-1 URL [本文引用: 1]
Network structure of maritime producer services of the 21st Century Maritime Silk Road
DOI:10.13249/j.cnki.sgs.2020.10.010
[本文引用: 1]
Under the initiative of the Belt and Road Initiative (BRI), China should change from a large shipping country to a strong shipping country, and the development of maritime producer services, especially high-end maritime producer services, is of great significance to the consolidation and promotion of ports’ status and function in China. Based on the Taylor’s Network Interlock Model, using the distribution of 103 multinational corporations in 7 different types of maritime producer services in 1054 cities along the 21st Century Maritime Silk Road, a database is constructed to calculate the network characteristics. Studying the network structure of the maritime producer services which along the 21st Century Maritime Silk Road. And exploring whether the maritime producer services will also migrate after the migration of container transportation to East Asia. The results show that: 1) The maritime producer services is mainly concentrated in a few important node cities. The hierarchy characteristics of the maritime producer services network are obvious. The first-layer cities are Hong Kong, Singapore, Beijing, Shanghai and Dubai. Their relative network connection values are 1.00, 0.98, 0.89, 0.88, 0.86, which are much higher than other cities. Simultaneously the first two layers are all Asian cities, which shows that the maritime producer services in Asian is becoming more and more important. 2) The maritime producer services in Europe is numerous and has obvious agglomeration characteristics. The maritime producer services in Asia is mainly distributed along the coastline in the shape of a strip. At the level of 21st Century Maritime Silk Road, the links among London, Hong Kong and Singapore constitute a big triangle. At the Chinese level, the links among Shanghai, Hong Kong and Beijing constitute a small triangle. This network structure has emerged in recent years and shows the rapid development of maritime producer services in Chinese cities. 3) From the perspective of spatial distribution, maritime producer services are most densely distributed in Europe, East Asia and Southeast Asia. High-end maritime producer services are mainly concentrated in European cities which are mainly capitals or economic centers. Asian cities play an important role in the mid-end maritime producer services, especially in the freight forwarding industry. A total of 13 Asian cities rank in the top 20, indicating that as the center of gravity of global shipping moves to Asia, and the center of gravity of freight forwarding industry also moves to Asia. In terms of low-end maritime producer services, African cities have performed prominently in warehousing services, while Asian and European cities play an important role in shipbuilding. 4) High-end maritime producer services are often influenced by the city’s history, culture, language, and political system. It is rooted in the local area and tends to be in the capital and other inland cities. The middle and low-end maritime producer services, which is mainly dependent on the transportation, is greatly influenced by the factors such as natural conditions and location conditions. It tends to transfer with the transportation and tends to be distributed in the port city.
“21世纪海上丝绸之路”航运服务业网络格局研究
DOI:10.13249/j.cnki.sgs.2020.10.010
[本文引用: 1]
在“一带一路”倡议下,发展航运服务业对于巩固与提升中国在全球航运网络中的地位具有重要意义。构建103家跨国公司在“21世纪海上丝绸之路(海丝之路)”沿线1 054个城市的分布数据库,分析7种航运服务业在“海丝之路”沿线的网络特征。研究表明:① “海丝之路”沿线航运服务业网络的层级分布特征明显,处于第一层级的均为亚洲城市,说明亚洲航运服务业在航运服务业网络中地位重要。② 在“海丝之路”这一层面,伦敦、香港、新加坡等城市和地区构成大的联系三角,在中国层面,上海、香港、北京构成小的联系三角。③ 高端航运服务业主要分布在欧洲城市,亚洲城市在中端航运服务业方面占据重要地位,在低端航运服务业方面,非洲城市在仓储服务业表现突出,亚洲和欧洲城市则在船舶修造业实力雄厚。④ 高端航运服务业往往受城市的历史、文化、语言、法律、制度影响较大,对地方的根植性较强,倾向于首都等内陆城市,而中低端航运服务业主要依托于货物运输,受自然条件和区位条件等因素的影响较大,往往随货物运输转移而转移,倾向于分布在港口城市。
Market structure and horizontal growth strategies: A case study of the container shipping industry
DOI:10.1515/ger-2021-0075
URL
[本文引用: 1]
This article aims to review the structural transformation in the container shipping industry from 1995 to 2020 and identify the growth strategies of global carriers to enhance their market presence. Along with large investments in mega vessels, the growing deployment of charter capacity in all ship sectors has been a prominent trend in fleet expansion. The waves of mergers/acquisitions and bankruptcies have narrowed the group of global carriers. In addition to internal and external growth, they have been increasingly involved in strategic alliances to expand service coverage and compete well with powerful rivals. A few mega carriers have progressively captured the industry. In 2020, the Top 12 controlled 88 % of the global supply, and nearly 56 % was in the hands of the Top 4. Besides the substantial expansion of the four biggest carriers, we can identify the de-concentration within this gigantic group through the less inequality between their market shares.
Comparative analysis of blockchain technology to support digital transformation in ports and shipping
DOI:10.1515/jisys-2021-0131
URL
[本文引用: 1]
Blockchain is one of the technologies that can support digital transformation in industries in many aspects. This sophisticated technology can provide a decentralized, transparent, and secure environment for organizations and businesses. This review article discusses the adoption of blockchain in the ports and shipping industry to support digital transformation. It also explores the integration of this technology into the current ports and shipping ecosystem. Besides, the study highlighted the situation of the supply chains management in ports and shipping domain as a case study in this field. The investigated studies show that blockchain can be integrated into processes such as financial and document workflow. This review contributes to research by focusing on the adoption of blockchain in the ports and shipping industry to support digital transformation. It also aims to understand the existing port practice and map it with current tendencies based on blockchain. This study gives insight analysis to incorporate blockchain technology into ports and shipping processes globally.
Rank-size structure and coupling type of coastal port city system based on multifunctional perspective
DOI:10.13249/j.cnki.sgs.2020.07.002
[本文引用: 1]
Taking 47 major port cities of China from 2001 to 2015 as a sample, this article discusses the characteristics of rank-size, analyzes the hierarchical structure and divides functional coupling types based on the shipping logistics function of coastal port city system from a multifunctional perspective by using the law of rank-size. Some interesting conclusions were obtained. Firstly, from 2001 to 2015, the manufacturing industry function of coastal port city system was divided into double fractal structures and other functions were single fractal. After long-term evolution, the shipping logistics function of rank-size distribution tends to be balanced, and the commercial and trade function, the manufacturing industry function (non-scale areas one), the modern service function and the population migration function all tend to be centralized. Secondly, the hierarchical structure of coastal port city system is in pyramid mode, but the shape is changing towards a spindle structure gradually. And it generally forms 5 levels which are national pivotal, regional pivotal, regional sub-center, regional node and local node. Thirdly, from the multifunctional coupling type, the traditional functions of the port city are generally advanced and the high-end service functions are lagging behind. The urban function shows a slow and gentle development state. It shows that the multifunctional development of China's coastal port cities is still at a low level and the industrial system structure needs to be further optimized. Finally, the functions of regional pivotal and regional sub-center cities are all in the stage of rapid growth. Regional nodes and local nodes cities are still in the growth stage of traditional functions such as industry and trade.
多功能视角的沿海港口城市体系位序规模结构及耦合类型
DOI:10.13249/j.cnki.sgs.2020.07.002
[本文引用: 1]
运用位序规模法则,以2001—2015年中国47个主要港口城市为研究样本,探讨多功能视角的沿海港口城市体系位序规模特征及其层级结构,以航运物流为基础功能划分其多功能发展的耦合类型。研究表明:① 2001—2015年,沿海港口城市体系中制造业功能位序规模分布的无标度区出现双分形结构,层级分割特征显现,其余功能则为单分形;从长期演化看,仅航运物流功能位序规模分布由集中化向均衡化发展,商贸功能、制造业功能(无标度区一)、现代服务功能和人口集散功能则处于集中化态势。② 沿海港口城市体系层级结构由金字塔结构逐步向纺锤状结构过渡,普遍形成了全国性枢纽、区域性枢纽、区域性副中心、区域性节点与地方性节点5个层级。③ 从多功能耦合类型看,港口城市传统功能普遍超前而高端服务功能滞后,城市类功能提升速度较慢且趋于平缓,表明中国沿海港口城市多功能发展仍处于低水平,产业体系结构有待进一步优化。④ 从不同层级港口城市来看,区域性枢纽城市、区域性副中心城市各功能均处于快速增长阶段;区域性节点和地方性节点城市则仍处在工业和商贸等传统功能增长阶段。
Agglomeration effects or port-related benefits? (Re)Location patterns of basic maritime industries: The case of Dalian city, China
The spatial characters and associated mechanism of port service industries in Guangzhou
DOI:10.13249/j.cnki.sgs.2010.01.30
[本文引用: 1]
The roles of a port are of importance in the local economy, which has drawn attentions in the many studies. Yet there are relatively few studies on the port service industries. The spatial characters and associated mechanism of the port service industries in Guangzhou were focused on. The pot service industries in Guangzhou wase highly spatial concentrated and Zhujiang-dependence. The spatial concentrating was steady while the shifting of enterprises was very frequent. The spatial distribution of the port service industries varied greatly with the different type. In general, it was apt to be concentrated to the trading port and the CBD. The spatial character is an synthesized outcome of the location, the nature of the industries, the evolution of the port spatial system, the urban planning influences and innovation of ICT.
广州市港口服务业空间特征及其形成机制研究
An empirical analysis of maritime cluster evolution from the port development perspective: Cases of London and Hong Kong
DOI:10.1016/j.tra.2017.05.015 URL [本文引用: 1]
Singapore increases tax support for shipping industry
新加坡再增航运业税务支持
Spatial distribution and functional evolution of shipping service industry in Shanghai
DOI:10.13249/j.cnki.sgs.2021.10.010
[本文引用: 1]
The shipping service industry is not only the focus for Shanghai to build an international shipping center, but also an important industry to participate in the global city competition. Based on the data of shipping service enterprises (organization) in 1992, 2005 and 2019, this paper studies the spatial distribution and functional evolution of shipping service industry by means of weighted Kernel density analysis, nearest neighbor index and keyword co-occurance analysis. The results show that the distribution mode of the shipping service industry in Shanghai tends to aggregate as whole. The evolution of the spatial distribution has changed from the contiguous distribution along the urban rivers to the multi location and multi-core of industrial parks, ports and urban CBD. From the perspective of the functional evolution of shipping service industry, the composition of important function units is stable, and warehousing has occupied the first place. Emerging function units switch frequently, the burst strength of container transportation, e-commerce and ship techniques are high. At present, seven function unit clusters have formed, which are climbing along the value chain. Traditional port and shipping industry, financial industry and information industry are the key hub industries to connect clusters. Function diversification has a heterogeneous demand for resource bundles, and the spatial distribution of resources is not balanced. The dynamic adjustment and matching of the both is the fundamental reason for the formation of spatial distribution and functional evolution.
上海市航运服务业空间分布及功能演变
DOI:10.13249/j.cnki.sgs.2021.10.010
[本文引用: 1]
采用1992年、2005年、2019年上海市存续航运服务企业(组织)数据,运用加权核密度、最近邻指数以及关键词共现网络,研究其空间分布及功能演变,结果表明:上海市航运服务业的空间分布总体趋于集聚,早期沿城市内河形成连片分布,后向工业园、港口及城市CBD等多区位、多核心转变。从功能演变来看,重要功能元构成长期稳定,仓储保持首位。新兴功能元发展持续性不足,电子商务、集装箱运输、船舶技术突变强度高。已形成7个功能元聚类,呈价值链攀升态势。传统港航业、金融业及信息业是功能元聚类形成的关键行业。功能多元化对资源组合需求异质化,而资源在空间分布不均衡,两者动态调整匹配是空间分布及功能形成演变的根本原因。
An empirical analysis of the relationship between economic freedom and economic growth
经济自由度与经济增长关系的实证分析
Route network pattern and its influencing factors of container shipping enterprises
DOI:10.11821/dlyj020190414
[本文引用: 1]
Shipping enterprises are the organizers of container transportation. Their choice of routes and ports directly affects the construction of container network. In this paper, using the schedule data, 18 of the top 20 shipping enterprises are selected as the research objects to analyze the similarities and differences of their route network patterns, and to explore the influencing factors of their route configuration. We can find that, the route network of each enterprise has the characteristics of small world and scale-free, which means that it is controlled by a small number of highly connected hub ports. East Asia is the primary agglomeration area for each company’s schedule. Singapore, Shenzhen, Busan, Hong Kong and Shanghai occupy an important position in the route network of each company. And the enterprise route network shows a certain hub-and-spoke feature, which is a hybrid network where the hub-and-spoke connection and the point-to-point connection coexist. The differences of their networks are as follows: the market coverage and depth of each enterprise varies greatly, shipping giants such as Maersk and Mediterranean take both breadth and depth into account, CMA CGM and ZIM focus on market breadth, while Korea Marine Transport Company and Hamburg Sud tend to dig deep into the regional market; there are large differences in the spatial distribution of each company’s schedule, according to which, the shipping enterprises can be divided into four types, and as one of the types, Korea Marine Transport Company, Hamburg Sud, United Arab Shipping Company and Wan Hai Lines focus on specific regional market segments; the hub ports chosen by shipping enterprises are quite different, and some enterprises such as Korea Marine Transport Company and United Arab Shipping Company have their own hub ports that are not global hubs. The route configuration of shipping enterprises is affected by a variety of factors, such as source of goods of port hinterland, natural conditions and operation efficiency of ports, maritime protection policy, and enterprise scale and port investment. This study enriches the theory of transport geography, and reveals the route organization mode of shipping enterprises, which can provide guidance for the decision-making by port managers.
全球集装箱航运企业的航线网络格局及影响因素
DOI:10.11821/dlyj020190414
[本文引用: 1]
采用船期表数据,以全球前20位航运企业中的18家为研究对象,剖析各企业航线网络的异同点,并探讨企业航线配置的影响因素。研究表明:各企业航线网络均具有小世界和无标度特征,东亚是航班的首要集聚区,并且均为轴辐连接与点对点连接并存的混合式网络;各企业航线网络的市场广度和深度各异,根据航班的空间分布特征可将企业划分为4种类型,其中高丽海运、汉堡南美、阿拉伯轮船和万海航运专注于特定区域的细分市场,且拥有不同于全球枢纽港的企业枢纽港;港口腹地货源、港口自然条件及作业效率、海运保护政策、企业自身能力等是影响企业航线布局的重要因素。本研究有助于揭示航运企业的航线组织模式,为港口管理者决策提供参考。
An analysis of the competitiveness of urban logistics in Guangdong province based on principal component analysis
主成分分析法下对广东省城市物流竞争力的分析
"The Belt and Road" Initiative and the New Impetus of Hongkong Shipping Service Industry Development
“一带一路”倡议与香港航运服务业发展新动力
Hong Kong ship registration system and successful experience
香港船舶注册登记制度及成功经验
Research on cross-border logistics cooperation in China from the perspective of logistics performance index
物流绩效指数视角下中国跨境物流协作研究
Network vulnerability of ports around the South China Sea and the impact on Chinese maritime transport
DOI:10.3969/j.issn.1004-9479.2022.04.20220069
[本文引用: 1]
The dependence on the South China Sea for international trade in container transport has increased over time, with Asian foreign trade relying on the South China Sea transport corridor for 65% of all trade. Hence, accurate measurement of the vulnerability of ports in the South China Sea and assessment of the impact of port inoperability in the ASEAN region on different Chinese ports is necessary for China's shipping security assessment. This paper collects the container route data published by the shipping company network in 2018 to construct the container shipping network of ports around the South China Sea, and carries out the research on the vulnerability of the network and the evaluation of the impact on China through the methods of network node index and shortest path simulation. The conclusions of the study are as follows: South Sea shipping is weakly resilient to disruption. The failure of 15%-25% of the head ports would be a materially disruptive effect on the overall organization of the shipping network. Pusan and Singapore are the ports in need of priority protection in the region, while Haiphong, Shanghai, Qingdao, Tokyo, Surabaya, Yokohama, and Kobe are highly vulnerable in the region. When a hub port breaks down and stops running to handle cargo, there are few alternative ports that meet the three conditions of geographical proximity, betweenness centrality growth, and the same transport capacity. The shortest path is used to simulate Chinese port calls to ASEAN ports in the South China Sea corridor. Singapore and Port Klang were found to be the two major ports with a global influence on China's coastal ports. Laem Chabang, Manila, Cebu, San Fernando, and Haiphong have regional impacts. By assessing the vulnerability of ports in the South China Sea and trying to delineate the spatial extent of the impact of port failures, this paper complements the spatial study of vulnerability and makes suggestions and recommendations for the security strategy of shipping in the South China Sea.
南海周边航运网络脆弱性及对中国集装箱运输的影响
DOI:10.3969/j.issn.1004-9479.2022.04.20220069
[本文引用: 1]
随着中国对外贸易的发展,南海在中国对外运输中的重要性不断提升,评估南海周边航运网络失效对中国不同港口的影响程度十分必要。以2018年前18强船公司的集装箱航线数据为基础,构建南海周边港口的集装箱航运网络,通过网络节点指标、最短路径模拟等方法测度网络的脆弱性,并分析南海周边港口失效对中国的影响。全文主要结论如下:南海航运的抗毁性较弱,15%~25%的头部港口失效对整体航运网络组织会产生实质性的毁坏;釜山和新加坡是本区域最重要的港口,海防、上海、青岛、东京、泗水、横滨、神户等在区域中具有高脆弱性;评估港口失效后的替代港口方案,发现替代集装箱港口的可选择范围很小,很少有港口失效后能同时满足地理临近、介数增长和能力相当三大条件,在海上航运网络中港口失效带来的影响是难以修补的;以最短路径模拟中国港口对南海周边其他港口的挂靠情况,发现新加坡、巴生和釜山是对中国具有全局影响力的三大港口,林查班、马尼拉、宿务、圣费尔南多、海防等对其他港口具有点对点的局域影响。
