

1 引言
“碳达峰”“碳中和”已成为中国发展的重要内容。“碳中和”意味着二氧化碳的产生量与自然界吸收及人为固定的碳总量相当,从目前中国的工业发展水平来看,行业减排的碳汇需求十分巨大[1-2]。造林(包括造林和再造林)具备改善生态环境和缓解部分气候变暖功能,联合国2030年议程的17项可持续发展目标(SDGs)中有12项与林业有关[3],其中SDG 15关于生命和土地的主题明确提出,保护和恢复森林生态系统是世界各国面临的一项关键挑战[4-5]。通过对退化生态系统的修复、保育等措施,提高光合作用并将更多的碳以有机物形式固定在植物(尤其是森林)和土壤之中,是最重要的固碳过程[1],通过造林的间接CO2减排措施得到了国际社会的广泛认可和高度期望[6⇓⇓⇓-10],相关研究支持中国未来能够通过造林为碳汇做出更大贡献[11],因此,补充森林面积和提高现有森林质量,必然成为增加森林碳汇的必要前提和关键。
目前,对于潜在造林地的研究比较有限且多具有片面性,尚缺乏大尺度(国家或全球尺度)和高空间分辨率的研究。以往研究倾向于使用景观生态学方法和历史数据来确定适宜造林地的分布范围[8,12⇓ -14]。另外,有通过实地调查或遥感方法,基于气候、土壤和地形等森林生长条件的空间特征推断适宜造林的分布范围[15-16]。由于地形、气候、土地利用构成和生态环境背景的区域差异性,这些方法应用到大范围或者其他国家与地区存在一定的局限性,并且多数研究没有顾及区域造林的土地来源和困难程度。在全国尺度上,Zhang等根据中国各地自然顶极植被的空间分布,预测了当前和未来气候条件下森林的生态位,该研究强调了气候对森林分布的控制作用,方法上具有推荐适宜造林树种的优势[11]。然而,Zhang等研究中自然顶极植被的空间分布是基于早期1∶100万比例尺植被图和8 km×8 km大小的网格气候数据得出的[11],首先,由于植被图的时间较早且分辨率相对较粗,与区域土地利用/土地覆盖(Land Use/Land Cover, LUC)的实际状况相去甚远,不能客观反映潜在造林地的土地来源;其次,粗糙背景数据无法准确表达与地形有关的微气候特征;此外,基于不同尺寸网格计算的面积有所差异,通常粗网格带来的面积误差较大。因此,非常有必要基于高空间分辨率数据进一步获取全国范围内潜在造林地的详细空间分布。
林地是中国第二大土地利用类型。中国是世界上人工造林规模最大的国家之一,造林面积超过其他国家造林面积总和[17-18]。基于中国科学院全国1∶10万比例尺土地利用变化遥感持续监测数据显示[19],2000—2008年期间全国林地面积恢复较快,但若想长期保持森林面积稳定依然存在压力[20]。林地面积变化与城镇化等人类活动关系密切[21⇓-23],毁林不仅引起森林面积减少,集中连片的森林被分割为较小的独立斑块导致森林景观破碎化,严重降低森林质量和碳汇能力。根据2003—2008年第7次全国森林资源清查数据,中国森林破碎化情况较为普遍,有超过30.27%的森林连续分布面积不足10 hm2,化解森林破碎化、改善森林质量是中国在相当长时间内林业政策着力的重要方向[24-25]。因此,阻止森林面积消亡,保护和恢复森林面积,改善森林质量,充分发掘森林碳汇潜力,对于实现“碳中和”发展目标和践行新时代生态文明理念具有重要支撑作用。
在全国范围内规划增加森林面积和化解森林破碎化,首先需要明确潜在造林地的空间分布详细情况。因此,本文的主要研究目的是:① 通过确定潜在造林地的主要土地来源,综合分析生态—社会—环境等条件因素,估算潜在林地及其质量等级的空间分布,形成30 m分辨率潜在造林地空间分布产品;② 通过计算和比较潜在造林地和现有林地的多年平均气候生产潜力,对于潜在造林地的固碳能力有前瞻性地了解。研究成果有望为全国造林规划提供科学数据支持,以期促进国家生态文明建设和实现“碳中和”发展目标。
2 数据与方法
2.1 数据
本文使用的地理空间数据主要包括LUC数据产品、地形数据、气候数据、交通数据、生态地理区划及行政区划数据等。
(2)DEM数据。使用SRTM 30 m空间分辨率DEM数据。基于ArcGIS软件,计算坡度、坡向,并结合冬季风向数据提取中国西南地区干热河谷的背风坡空间分布信息。
(3)气候数据。温度和降水数据使用国家青藏高原科学数据中心网站(
(4)生态区划数据。使用国家地球系统科学数据中心网站(
(5)交通数据。使用OpenStreetMap星球网站(
2.2 方法
确定潜在造林地空间分布主要包含3个步骤(图1)。首先,基于GlobeLand30和GLC_FCS30两种LUC产品,以及地形坡度和高山林线,确定潜在造林地的基础土地来源。其次,运用加法原理,依据宏观气候格局、地形与微气候,以及气候变化综合评价区域的气候条件。再次,运用最小因子定律,基于地形坡度、交通和气候等地理时空数据,多要素综合判定潜在造林地的造林困难程度,以此作为潜在造林地的限制条件及质量等级划分依据。最后,根据历史气象资料和Miami模型,计算中国多年平均气候生产力,通过分析潜在造林地质量等级的空间分布及其气候生产潜力,支持全国范围内的植树造林规划。
图1
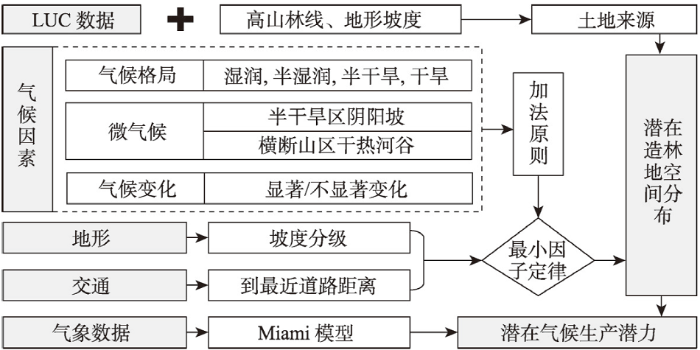
图1
潜在造林地及其气候生产潜力空间分布估算技术流程
Fig. 1
Flowchart to identify the potential forestation land and its climatic potential productivity in China
2.2.1 潜在造林地的土地来源
一般来说,林中空地、荒山以及不宜种植农作物的坡耕地比较适于植树造林,而其他如矿山生态修复土地等数量比较稀少,且不容易获取其在全国尺度上的空间分布。根据GlobeLand30和GLC_FCS30的LUC类型设置,本文仅以草地和坡度大于25°耕地作为潜在造林地的基础土地来源。林线是山地垂直自然带谱中森林分布的上限海拔高度,林线以上地区不能植树造林,是潜在造林地空间分布的禁止条件(图2a)。因此,本文首先结合林线分布数据和坡度数据,分别从GlobeLand30和GLC_FCS30两种LUC产品中提取出林线以下草地与坡度大于25°的耕地。
图2
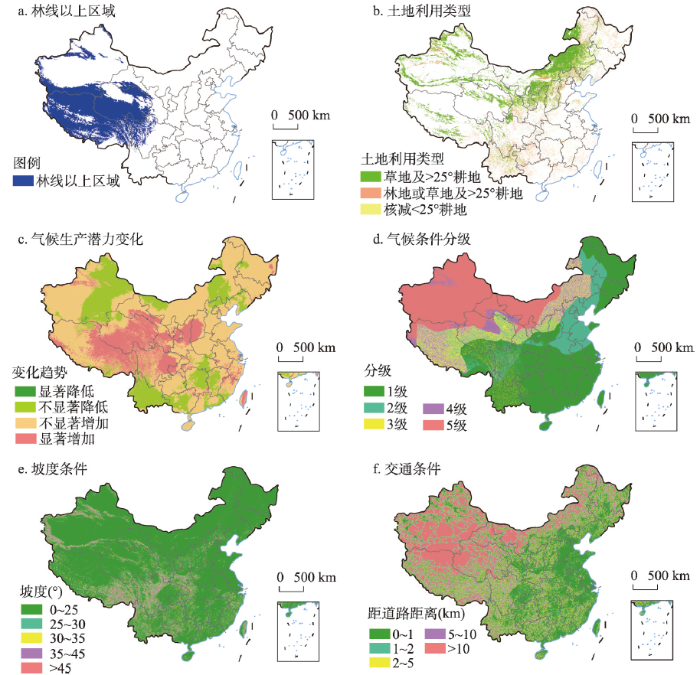
图2
中国潜在造林地土地来源及气候、地形和交通条件
注:基于自然资源部标准地图服务网站GS(2016)1603号标准地图制作,底图边界无修改。
Fig. 2
Land sources, climatic, topographical and traffic conditions for potential forestation land in China
鉴于两种LUC数据中同种地物类型的空间分布存在一定差异,本文进一步对获取的草地和坡度大于25°耕地信息做了细分和处理:一是如果在一种LUC产品中为草地或坡度大于25°耕地,但在另一种LUC产品中被划为林地,则认为这类土地为潜在重新(再)造林地的土地来源;如果在一种LUC产品中为草地,但在另一种LUC中为坡度小于25°耕地,为了同时兼顾粮食安全和最大程度保护耕地,将这类土地从潜在造林地中核减;最终,余下的草地或坡度大于25°耕地被视为潜在新造林地的土地来源(图2b)。
式中:
2.2.2 潜在造林地的限制条件及质量等级划分
林线以下的潜在造林地被认为是潜在造林地的最大面积,受区域地形和气候等条件影响,将来植树造林工程中实际远不能达到该最大面积,还需要进一步进行质量等级划分,从而区分出比较适合造林的潜在优先造林地范围。
(1)气候条件分级。气候条件干燥与湿润影响森林生长与植树造林成活率,将植树造林的气候条件分为5级(级数越低,植树造林困难程度越低)。本文从3个方面对气候条件进行分级:宏观气候格局、地形微气候和气候变化。
首先,提取中国生态地理分区数据的干湿气候分区,并依次将湿润区、半湿润区、干旱区的植树造林气候条件分别定为1级、2级和5级。
其次,考虑地形条件对水热条件的再分配。半干旱地区的山地阴坡和阳坡土壤水分蒸发存在一定的差异,阴坡相对利于植被生长,因此将半干旱区山地阴坡定为3级,阳坡定为4级。中国西南横断山区干热河谷的焚风效应能引起局部地表严重干旱,不利于植被的生长,但该区域在宏观气候分布图上基本上被划分为湿润区与半湿润区,显然低估了地形微气候对植树造林的影响。为此,本文基于坡向数据和冬季风主风向提取了怒江、澜沧江、金沙江、元江、南北盘江和岷江等流域背风坡的空间分布,然后在原先气候条件分级的基础上,将干热河谷背风坡植树造林困难程度增加2个等级(当等级大于5级时,仍归为5级)。
从地形要素类别准确性、地形零碎性和运算效率等方面综合衡量,研究认为DEM分辨率在330 m左右时地形要素提取效果较好,并定义坡向与冬季主风向夹角大于90°的坡面为背风坡[33]。本文使用ArcGIS软件的Aggregation功能将SRTM 30 m空间分辨率DEM数据按平均值聚合成300 m空间分辨率的DEM数据,然后计算山谷线、山脊线和山坡等地形要素。基于ERA5月度风场资料分别计算1991—2020年冬季1月份的U、V风速矢量平均值,采用反正切函数计算冬季风的多年平均风向[34],然后转换投影并重采样成300 m尺寸的栅格风向数据,再通过叠加栅格坡向数据和山坡数据提取背风坡的空间分布。ECMWF发布的第五代全球气候再分析资料数据集ERA5在国际上应用较广,虽然ERA5 0.1°风场资料的空间分辨率相对300 m分辨率地形数据较粗,但已是目前可获取的分辨率最高的风场资料,能反映区域背景风场信息,提取的背风坡空间分布比较有规律性,不易出现零碎空间分布。
再次,考虑气候变化对植被生长的影响。气候生产潜力是一种描述理想气象条件下植被最大生产力的指标[35],能综合反映气候变化对植被生长的影响。本文基于Miami模型计算植被的气候生产潜力,并采用Mann-Kendall非参数统计法计算1991—2020年中国植被气候生产潜力的变化趋势(图2c)。在宏观气候条件分级和地形微气候条件分级加和的基础上,进一步对于植被生产潜力显著增加的地区,植树造林的困难程度降低1个等级,反之对于植被生产潜力显著降低的地区,植树造林的困难程度增加1个等级(当等级小于1级时,仍归为1级;当等级大于5级时,仍归为5级)(图2d)。Miami模型考虑了与陆地生物生长及其分布关系密切的因子——温度和有效水分,由于这两种参数易于获得,因此该模型实用性强,应用较为普遍[35-36]。Miami气候生产潜力
式中:
式中:
(2)地形坡度条件分级。经统计,全国约90%的林地坡度位于35°及以下。整地是植树前的一项重要环节,由于25°及以下为国家允许的耕地垦种坡度范围,其地形条件必然适于植树造林,而45°以上为险坡,难以利用。因此,本文依次将0~25°定为1级,25°~30°定为2级,30°~35°定为3级,35°~45°定为4级,大于45°定为5级(图2e)。
(3)交通条件分级。路径距离影响植树造林及后期养护成本。基于DEM数据和OpenStreetMap道路矢量数据,使用ArcGIS的空间分析功能计算得到了全国范围内到最近道路的路径距离空间分布格网数据,并使用分位数法将其分类为5个级别(级数越低,植树造林困难程度越低)。最新OpenStreetMap道路矢量数据已非常详细,基本能够反映人迹到达情况。本文采用与分位数法获取的分类间隔最接近的整数作为分级依据,依次将路径距离0~1 km定为1级,1~2 km定为2级,2~5 km定为3级,5~10 km定为4级,大于10 km定为5级(图2f)。
(4)综合判定潜在造林地的质量等级。19世纪德国农业化学家Liebig提出的“最小因子定律”与管理学中的“短板理论”具有一致性,均强调关键限制因素对特定发展目标的限制性作用,因此本文依据“最小因子定律”综合判定潜在造林地的质量等级。将气候条件分级、地形坡度条件分级和交通条件分级结果的空间分辨率统一到30 m,通过计算条件分级的最大值,最终将全国潜在造林地的质量等级划分为5级,级数越低,说明植树造林困难程度越低,潜在造林地的质量等级越高。将潜在造林地的质量等级反映为植树造林的适宜程度,则1级为比较适宜,2级为适宜,3级为一般适宜,4级为不适宜,5级为极不适宜(图3)。1级为气候、地形和交通条件均最好,比较适宜植树造林,2级及以上等级受某种或多种条件不同程度限制,本文将1~3级确定为优先造林地,4~5级确定为其他造林地。
图3
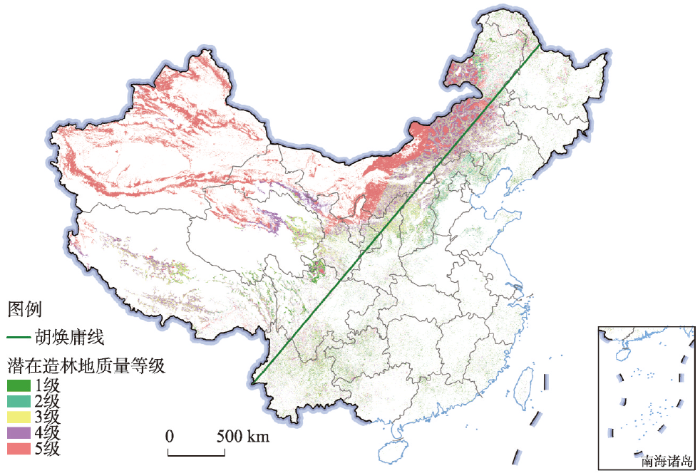
图3
2020年中国潜在造林地空间分布
注:基于自然资源部标准地图服务网站GS(2019)1823号标准地图制作,底图边界无修改,后图同。
Fig. 3
Spatial distribution of potential forestation land in China
3 结果分析
3.1 中国潜在造林地的空间分布特征
中国质量等级相对较高的潜在造林地偏少,随着质量等级的降低,潜在造林地的面积越多(图3),质量1~5级的潜在造林地面积依次分别为9.75万km2、18.99万km2、37.86万km2、40.24万km2和62.56万km2,面积合计169.40万km2。质量等级为1~3级的优先造林地面积合计66.61万km2,质量等级为4~5级的其他造林地面积合计102.79万 km2,分别占潜在造林地面积的39.32%和60.68%(表1)。经统计,在2020年的GlobeLand30和GLC_FCS30上同时为林地的林地面积184.06万km2,假使潜在优先造林地被全部开发用来造林,则森林面积在此基础上增加36.19%,全国森林覆盖率将增加6.94%。
表1 中国各省(市、自治区)不同等级潜在造林地面积(km2)
Tab. 1
| 省份 | 1级 | 2级 | 3级 | 4级 | 5级 | 优先 | 其他 |
|---|---|---|---|---|---|---|---|
| 北京 | 0.23 | 2081.68 | 291.69 | 181.06 | 41.99 | 2373.59 | 223.05 |
| 天津 | - | 258.79 | 18.82 | 7.06 | 0.72 | 277.61 | 7.79 |
| 河北 | 46.63 | 21538.72 | 14419.90 | 10242.97 | 328.73 | 36005.24 | 10571.70 |
| 山西 | 4203.92 | 13644.12 | 22109.80 | 10526.59 | 201.04 | 39957.84 | 10727.63 |
| 内蒙古 | 6383.31 | 24676.13 | 120868.96 | 195065.19 | 199932.95 | 151928.40 | 394998.15 |
| 辽宁 | 3476.69 | 8892.72 | 4698.80 | 654.65 | 17.67 | 17068.21 | 672.32 |
| 吉林 | 2092.35 | 2686.79 | 2331.27 | 1286.76 | 177.21 | 7110.41 | 1463.97 |
| 黑龙江 | 10696.89 | 6315.08 | 10803.20 | 8674.19 | 3986.05 | 27815.16 | 12660.25 |
| 上海 | 39.41 | 0.27 | 0.06 | 0.08 | 0.00 | 39.74 | 0.09 |
| 江苏 | 223.34 | 124.59 | 24.96 | 6.18 | 0.58 | 372.90 | 6.76 |
| 浙江 | 1599.77 | 1487.91 | 1003.10 | 427.39 | 46.80 | 4090.78 | 474.19 |
| 安徽 | 750.97 | 527.58 | 484.93 | 138.84 | 11.38 | 1763.48 | 150.22 |
| 福建 | 3361.48 | 2345.19 | 2246.52 | 713.25 | 39.45 | 7953.19 | 752.70 |
| 江西 | 2595.94 | 1308.24 | 1333.73 | 318.83 | 18.74 | 5237.91 | 337.56 |
| 山东 | 653.24 | 3567.67 | 1004.31 | 212.95 | 15.55 | 5225.22 | 228.50 |
| 河南 | 492.98 | 2931.87 | 1417.18 | 588.45 | 73.16 | 4842.03 | 661.61 |
| 湖北 | 1175.95 | 1829.64 | 2246.61 | 1223.86 | 147.87 | 5252.20 | 1371.74 |
| 湖南 | 3646.29 | 2777.29 | 3136.00 | 1114.86 | 89.67 | 9559.58 | 1204.53 |
| 广东 | 4456.31 | 2431.32 | 2268.83 | 694.62 | 68.58 | 9156.46 | 763.20 |
| 广西 | 2491.86 | 3349.71 | 4605.21 | 2934.20 | 604.42 | 10446.77 | 3538.62 |
| 海南 | 154.12 | 46.11 | 32.10 | 5.32 | 0.65 | 232.33 | 5.96 |
| 重庆 | 1174.93 | 3207.95 | 2792.36 | 1485.71 | 287.44 | 7175.24 | 1773.15 |
| 四川 | 12104.53 | 18114.31 | 24190.63 | 20002.26 | 5502.91 | 54409.47 | 25505.17 |
| 贵州 | 8688.43 | 8716.74 | 11017.11 | 5732.88 | 1195.65 | 28422.28 | 6928.54 |
| 云南 | 13215.96 | 15133.43 | 28449.40 | 16037.41 | 3007.01 | 56798.79 | 19044.41 |
| 西藏 | 4703.87 | 11930.17 | 48330.93 | 51899.35 | 14915.92 | 64964.98 | 66815.27 |
| 陕西 | 2928.42 | 8967.15 | 22919.75 | 13118.49 | 594.96 | 34815.32 | 13713.45 |
| 甘肃 | 4009.45 | 11822.58 | 24927.90 | 30725.87 | 33822.87 | 40759.92 | 64548.74 |
| 青海 | 1712.53 | 8426.19 | 18126.10 | 22556.16 | 33054.76 | 28264.82 | 55610.92 |
| 宁夏 | 76.09 | 646.79 | 2416.61 | 2869.16 | 14871.24 | 3139.49 | 17740.40 |
| 新疆 | - | - | - | 2796.50 | 312454.77 | - | 315251.27 |
| 台湾 | 353.01 | 144.37 | 119.12 | 127.06 | 60.79 | 616.49 | 187.86 |
| 合计 | 97508.88 | 189931.09 | 378635.89 | 402368.16 | 625571.55 | 666075.86 | 1027939.70 |
注:广东包含香港和澳门数据。
全国优先造林地中,质量等级1~3级的面积占比分别为14.64%、28.51%和56.85%。质量等级为1级的潜在造林地主要分布于气候湿润区,在云南、四川和黑龙江等省份分布较多,面积均大于1万km2(表1),其次分布在贵州省、内蒙古自治区东部和西藏自治区东南部,面积均大于4500 km2。质量等级为2级的潜在造林地主要分布在半湿润气候区,在东北和华北地区主要包括内蒙古自治区东部、河北省和山西省的南部等地,以及辽宁省,在西南地区主要包括四川、云南、贵州等省,以及西藏自治区东南部等地,在西北地区主要包括甘肃、陕西、青海等省的南部,其中在内蒙古自治区和河北的面积大于2万km2,在四川、云南、山西、西藏和甘肃等省份的分布面积均大于1万 km2。质量等级为3级的潜在造林地面积比质量等级1级和2级的面积明显增多,主要分布于中国的半干旱地区及一些地形条件相对复杂的地区,在北方主要集中于“胡焕庸线”的两侧,包括内蒙古自治区中部,以及河北、山西和陕西等省的北部,在南方主要分布于四川盆地周边及云贵高原,向西主要分布于甘肃省中部、青海省东部及西藏自治区南部,其中内蒙古自治区质量等级为3级的潜在造林地面积比较突出,面积大于12万 km2,其次为西藏自治区,面积大于4.5万km2,在云南、甘肃、四川、陕西和山西等省份面积均大于2万 km2,在青海、河北、贵州和黑龙江等省份均大于1万 km2。质量等级为4级和5级的其他造林地主要分布于西北气候干旱区以及西南的地形复杂地区,其中在内蒙古和新疆两个省份的分布面积占潜在其他造林地总面积的69.09%,受干旱气候环境影响,不建议开发利用[42]。
总体上,潜在优先造林地在“胡焕庸线”附近分布比较集中。内蒙古自治区潜在优先造林地分布面积最多,占全国潜在优先造林地总面积的22.81%,西藏自治区、云南省和四川省潜在优先造林地面积也比较突出,分别占全国潜在优先造林地总面积的9.75%、8.53%和8.17%,这4个省份的潜在优先造林地面积占比合计49.26%。此外,甘肃、山西、河北、陕西、贵州、青海和黑龙江等省份的潜在优先造林地面积也相对较多,合计占全国潜在优先造林地面积的38.00%。统计和比较各区域潜在优先造林地面积的全国占比,发现华北地区(包括北京、天津、河北、山西和内蒙古)潜在优先造林地面积全国占比最高,比例为34.61%;其次为西南地区(包括重庆、四川、贵州、云南和西藏),比例为31.79%;再次为西北地区(包括陕西、甘肃、青海、宁夏和新疆),比例为16.06%;东北(包括辽宁、吉林和黑龙江)、华东(包括上海、江苏、浙江、安徽、福建、江西、山东和台湾)、华南(包括广东、广西、海南、香港和澳门)、华中(包括河南、湖北和湖南)地区优潜在先造林地面积全国占比分别为7.81%、3.80%、2.98%和2.95%。华北地区潜在优先造林地面积全国最多,其中约2/3分布在内蒙古自治区。
在北方和西南地区的省份,虽然潜在优先造林地面积较多,但质量等级为3级的潜在造林地面积占比相对较高。位于华中、华南和华东地区的省份,虽然优先造林地面积相对较少,但质量等级为1级和2级的潜在造林地面积占比相对较高,且潜在优先造林地面积总和接近6.5万 km2,约占全国潜在优先造林地面积的1/10,因此,这部分适宜植树造林的土地资源尽管分省面积少,但总量不容忽视。
3.2 潜在新造林地和重新造林地的空间分布特征
潜在优先造林地是将来植树造林工程实施的主体,因此本文只分析潜在优先造林地中新造林地和重新造林地的空间分布特征。全国潜在新造林地面积39.67万km2,潜在重新造林地面积26.94万km2,分别占潜在优先造林地的59.56%和40.44%。潜在新造林地中,质量等级为1~3级的潜在造林地面积占比分别为8.74%、25.60%和65.66%,潜在重新造林地中质量等级为1~3级的潜在造林地面积占比分别为23.33%、32.80%和43.87%,因此,潜在重新造林地的平均质量等级相对较高。
潜在新造林地在中国北方主要分布于“胡焕庸线”的两侧,在中国南方主要分布于“胡焕庸线”的西侧,而潜在重新再造林地主要分布于“胡焕庸线”的东侧(图4)。内蒙古自治区潜在新造林面积最多,为12.82万km2,其次为西藏自治区,为5.46万km2,再次为甘肃省,为3.03万km2,四川、青海、山西、陕西、云南、河北等省份潜在新造林面积介于1.84万~2.90万km2之间,其余各省份的分布面积均不足1万km2。潜在重新造林地在云南省分布面积最多,为3.73万km2,其次在四川省,为2.54万km2,再次在贵州省、内蒙古自治区和黑龙江省,面积均大于2万km2,河北、山西、甘肃、西藏等省份潜在重新造林地面积均大于1万km2,其余各省份的分布面积均少于1万km2。总体来看,华南、华中和华东地区潜在重新造林地面积占各自区域优先造林地面积的比例相对较高,分别为92.23%、82.96%和81.33%;其次为东北三省,潜在重新造林地面积占优先造林地面积的比例为63.34%;再次为西南地区,除西藏潜在重新造林地面积占比较低,为15.92%外,其他4个省份包括四川、重庆、云南和贵州的潜在重新造林地面积占比均非常高,是该区域潜在优先造林地面积的62.63%。华北地区和西北地区潜在重新造林地面积比重相对较低,其中华北地区除内蒙古外的潜在重新造林地面积占比为42.29%(内蒙古为15.60%);西北地区潜在重新造林地面积占优先造林地面积的比例最低,仅为20.60%。
图4
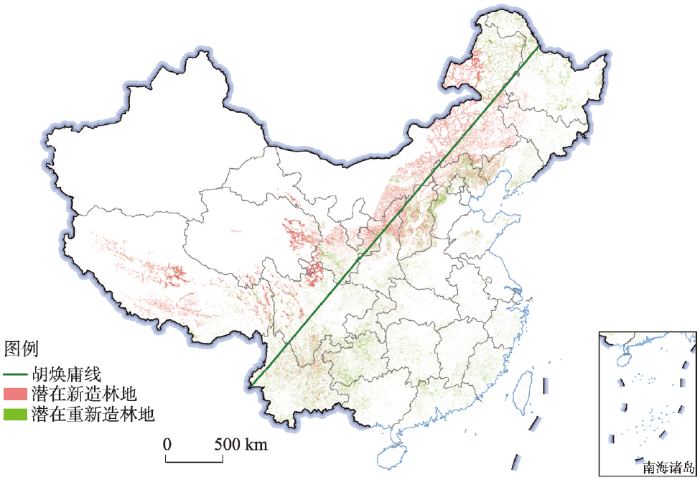
图4
中国潜在优先造林地中新造林地与重新造林地空间分布
Fig. 4
The suitable potential forestation land for afforestation and reforestation in China
3.3 潜在造林地的气候生产潜力
中国潜在造林地Miami多年平均气候生产潜力总和为11.17亿t,其中优先造林地为6.30亿 t,其他造林地4.87亿t。其他造林地面积约是优先造林地面积的1.54倍,但气候生产潜力仅是优先造林地的77.30%,性价比较低(图5)。假使潜在优先造林地被完全用来造林,则中国森林(在GlobeLand30和GLC_FCS30上共同为林地的林地面积)Miami多年平均气候生产潜力总值25.20亿t的基础上再增加25.00%。潜在优先造林地中,潜在新造林地的Miami多年平均气候生产潜力总值为3.02亿t,潜在重新造林地为3.28亿t,分别占潜在优先造林地气候生产潜力的47.94%和52.06%。尽管潜在重新造林地面积少于潜在新造林地面积,但其气候生产潜力总值却高于潜在新造林地。因此,在将来的植树造林建设中,不仅要规划布局新造林地,同时要加强东部等气候条件较好地区的森林恢复建设。
图5
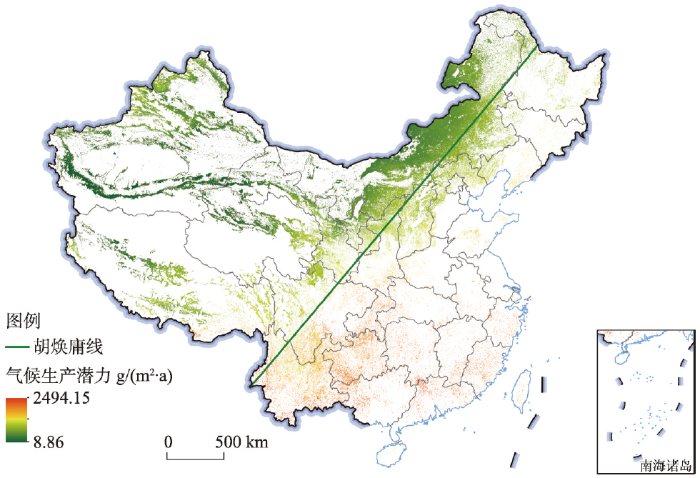
图5
中国潜在造林地Miami多年平均气候生产潜力空间分布
Fig. 5
Multiyear average Miami climatic potential productivity of the potential forestation land in China
内蒙古自治区潜在优先造林地的气候生产潜力总值最高,占全国潜在优先造林地气候生产潜力的13.86%;其次为云南省,占比为12.86%;再次为四川省,比例为9.38%。贵州省和西藏自治区优先造林地的气候生产潜力总值也相对较高,占全国优先造林地气候生产潜力总值的比例分别为7.16%和6.98%。以上5个省份优先造林地气候生产潜力占全国总量的一半以上,且其中4个省份处于西南地区。此外,山西、甘肃、陕西和河北等北方省份优先造林地气候生产潜力总值的占比也较高,分别为5.31%、5.08%、4.83%和4.52%,合计19.74%。
经统计,南方地区水热条件相对较好地区的潜在优先造林地,单位面积气候生产潜力相对较高,并且其气候生产潜力总值与潜在优先造林地面积基本上成正比,而水热资源相对较差的西部和北方地区,虽然气候生产潜力总值较大,但单位面积的气候生产潜力相对较低。华南、华东、华中潜在优先造林地面积虽少,但平均每平方千米的气候生产潜力分别高达1895.91 t、1713.74 t和1567.39 t;其次为西南地区,为1341.77 t(除西藏外);再次为华北、东北和西北地区,分别为815.65 t(除内蒙古外)、796.69 t和785.98 t;西藏和内蒙古分别为676.78 t和574.21 t。从总量来看,西南地区潜在优先造林地的气候生产潜力全国占比最高,为38.27%;其次为华北地区,为24.04%,再次为西北地区,为13.36%;华东、东北、华南和华中地区潜在优先造林地的气候生产潜力全国占比依次分别为6.89%、6.58%、5.97%和4.89%。华北地区潜在优先造林地面积全国最多,虽然西南地区潜在优先造林地面积与华北接近,但其气候生产潜力是华北地区的1.59倍。如不计西藏,西南地区总计以22.04%的优先造林地面积提供31.29%的气候生产潜力增量,在全国碳汇造林中具有举足轻重的作用。
4 讨论
4.1 潜在造林地的土地来源与政策影响
LUC遥感分类精度直接影响潜在造林地的空间分布。由于遥感分类时所使用的卫星影像的季相不同,分类样本和分类方法有差异,因此不同LUC分类产品中部分同一位置的地物不可避免存在类型不一致的情况,然而这种数据不一致也可以被充分利用,数据交叉使用能进一步保证潜在造林地土地来源的可靠性。首先,国家实行永久基本农田保护制度,永久基本农田经依法划定后,除国务院批准外任何单位和个人不得擅自占用或者改变其用途,因此,虽然GLC_FCS30和GlobeLand30是目前分类精度相对较高并且已经公开使用的两种30 m分辨率LUC遥感自动分类产品,本文仍进一步从土地来源中排除了为坡度小于25°耕地的可能性。其次,林、草是遥感分类时比较容易混淆的两种LUC类型,对于在一种LUC产品中被划分为草地或坡度大于25°耕地,但在另一种LUC产品中被划分为林地的土地单元,实际中可能往往表现为森林生境受到干扰导致林木长势较差,且主要分布于林地的边缘地带,因此,本文将这类土地单元归为潜在重新造林地。从得出的潜在重新造林地分布范围来看,潜在重新造林地主要分布于“胡焕庸线”以东地区,由于东部地区人口稠密,城市化水平较高,林地受人类活动影响也较大,因此潜在重新造林地空间分布具有很高的可信度。Zhang等指出[11],中国潜在造林地主要沿“胡焕庸线”分布,面积约33万km2,与本文估算的潜在新造林地面积基本在同等数量级,空间规律相似,但Zhang等的研究没有考虑退耕还林,也不能顾及当前已经是草地等土地类型但植被图上仍然是林地的土地面积。依本文估算结果,中国潜在重新造林地面积占潜在优先造林面积的4成,且其气候生产潜力更可观。因此,综合来看,顾及土地来源的潜在造林地估算方法更贴近实际情况。
自然资源部联合多部委发布的《关于进一步完善政策措施巩固退耕还林还草成果的通知》(自然资发〔2022〕191号)指出,1999年以来,中国先后实施两轮退耕还林还草工程,综合效益显著,同时也面临可退耕空间不足、成果巩固难度较大等问题,根据当前形势,为统筹耕地保护和生态安全,暂缓安排新增退耕还林还草任务,将工作重心转到巩固已有建设成果上来。依据本文方法估算的潜在优先造林地面积中,GlobeLand30和GLC_FCS30共同为坡度大于25°耕地的面积1.08万km2,GlobeLand30或GLC_FCS30为坡度大于25°耕地的面积6.75万km2,即坡度大于25°耕地占潜在优先造林地面积的1.62%~10.14%。如进一步控制坡度大于25°耕地的退耕,则潜在优先造林地面积将调整为59.86万~66.61万 km2,其中潜在新造林地面积36.94万~39.67万km2,潜在重新造林地面积22.92万~26.94万 km2。经统计,GlobeLand30和GLC_FCS30的2020年耕地面积均高于《第三次全国国土调查主要数据公报》的耕地面积,因此,依本文方法核算的潜在造林地分布对耕地保有量影响非常有限。同时也说明,在空间布局与规划分析中,LUC数据交叉使用得到的结果相比基于单一来源LUC数据更加可靠。
4.2 造林定义的局限性
《联合国气候变化框架公约》(UNFCCC)将Afforestation定义为“通过人工植树、播种或人工促进天然下种方式,使至少在过去50年不曾有森林的土地转化为有林地的直接人为活动”[43-44]。但过去50年或更长时期的详细森林空间分布通常不可获取,本文仅根据2020年数据分析潜在造林地的土地来源,得出的潜在新造林地不可避免包含历史上存在过林地但后来转化为草地或耕地的土地面积,与UNFCCC的造林定义有一定差别,但20世纪80年代末至2015年全国森林覆盖率基本稳定[20],并且中国已经实施了长期和大规模的植树造林工程,因此,这部分原本应为潜在重新造林地的土地面积必然极少,而且不影响潜在造林地的面积总量。
4.3 潜在造林地的限制因素
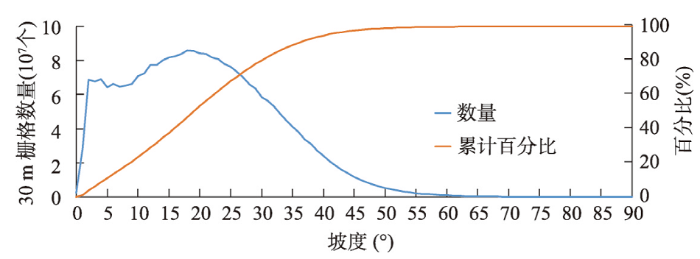
地形坡度过陡显然不利于植树造林工作的实施。关于地形坡度的影响,当前还没有推荐的关于造林的地形坡度划分标准。本文调查了全国森林随坡度分布情况,发现约70.60%的森林分布在坡度26°以下,80.09%在坡度30°以下,89.06%坡度在35°以下(图6),因此,将适合造林的地形坡度最大值设为35°。坡度等于或低于25°的地形是国家允许耕作的坡度,既然适于耕种,当然多数情况下也适于造林,因此本文将坡度0°~25°设为比较适宜级别。
图6
本文未考虑土壤因素对造林的影响。一方面,主要是因为气候控制着森林的分布[11];另一方面,本研究中潜在造林地的土地来源为草地和坡度大于25°的耕地,植被覆盖的存在可以部分保证一定的土壤深度,而且土壤质地和化学性质可以通过树种和生物技术适应。因此,未将土壤列为成潜在造林地空间分布估算的影响因素具有可行性。
4.4 气候变化对潜在造林地空间分布的影响
气候变化既可能构成植被生长的有利条件,也可能构成不利条件。Miami气候生产潜力涵盖了气温和降水两个气候因素,其变化能综合说明气候变化对植被生长的影响。1991—2020年Miami气候生产潜力变化显示气候变化对全国植被生长构成整体利好,Miami气候生产潜力显著增加区域占陆地国土面积的20.33%,不显著增加区域占比为56.76%,不显著减弱区域占比为22.73%,而显著减弱区域占比仅0.18%。Miami气候生产潜力显著增加的地区除青藏高原及周边等受林线控制的区域外,山西省中部及南部大部、陕西省陕北地区大部、甘肃省东部及南部、青海省中部、四川省东部及西藏南部等区域的气候生产潜力显著增加,在空间上连片集中分布,且在“胡焕庸线”以东地区面积也相当可观,Miami多年平均气候生产潜力相对较高(图2c、2d)。因此,上述区域是气候变化对于植被生长的重点利好区域。进一步对比潜在造林地估算方法中考虑气候变化与不考虑气候变化的两个方案,统计得出气候生产潜力显著增加能多出4.96万km2的潜在优先造林地面积,为区域植树造林和生态恢复建设带来了重要机遇。
4.5 潜在造林地的固碳能力
相关研究指出,在森林成长初期,森林的固碳能力随着林龄的增加而快速增强,到一定阶段之后便会减弱[48],通过大量样本对比研究表明,植树造林对土壤有机碳的影响取决于本底土壤的含碳量,如果土壤本底有机碳丰富,特别是土壤厚度比较深的区域,造林会降低土壤有机碳储量,而在土壤本底有机碳较为贫瘠的区域,造林会促进土壤有机碳的积累[49]。鉴于潜在造林地在未来付诸造林措施的时间上必然有先后,造成林龄不统一,区域林木种类也存在空间差异,想要获取全国尺度上潜在造林地的固碳能力,实际上可能只有在将来全国范围详细的造林时间和空间规划基础上才能实现[50-51]。本文基于Miami模型计算的多年平均气候生产潜力,与实际森林碳汇有较大差距,但对于全国范围内潜在造林地的固碳能力及其空间分布具有重要的前瞻性。
5 结论
本文基于2020年GLC_FCS30和和GlobeLand30两种30 m高空间分辨率LUC遥感分类数据,并结合地形与微气候、交通、林线、生态地理分区,以及Miami气候生产潜力变化等时空数据,以草地和坡度大于25°耕地为主要土地来源,使用Liebig“最小因子定律”估算了中国潜在造林地的面积和质量等级,形成了30m高空间分辨率中国潜在造林地空间分布数据,并分析了中国潜在造林地的空间分布特征,厘清了潜在优先造林地中新造林地和重新造林地的空间分布范围及其气候生产潜力贡献。主要结论如下:
(1)中国潜在造林地面积为169.40万km2,其中潜在优先造林地面积为66.61万km2,潜在优先造林地是将来植树造林工程实施的主体。1991—2020年Miami气候生产潜力变化显示气候变化对全国植被生长构成整体利好,尤其是山西、陕西、甘肃、四川、青海、西藏等省份大部分地区的Miami气候生产潜力显著增加,为区域潜在优先造林地的植树造林和生态恢复建设带来了重要机遇。
(2)全国潜在优先造林地中,潜在新造林地面积39.67万km2,潜在重新造林地面积26.94万km2,分别占潜在优先造林地的59.56%和40.44%,其中潜在新造林地在中国北方主要分布于“胡焕庸线”的两侧,在中国南方主要分布于“胡焕庸线”的西侧,而潜在重新再造林地主要分布于“胡焕庸线”的东侧。
(3)中国潜在优先造林地的Miami多年平均气候生产潜力总值为6.30亿t,潜在新造林地和潜在重新造林地的气候生产潜力分别是潜在优先造林地的47.94%和52.06%。鉴于潜在优先造林地中重新造林地面积虽然少于新造林地面积,但气候生产潜力总值却高于新造林地,因此,在将来的植树造林建设中,不仅要规划布局新造林地,同时要加强东部等气候条件较好地区的森林恢复建设。
(4)假使潜在优先造林地被全部开发用来造林,则中国森林面积在2020年数据(在GlobeLand30和GLC_FCS30上同时为林地的林地面积)的基础上增加36.19%,全国森林覆盖率将增加6.94%,全国森林气候生产潜力增加25.00%。华北地区潜在优先造林地面积全国最多,且将近2/3分布在内蒙古自治区,西南地区潜在优先造林地面积与华北接近,但其气候生产潜力全国占比最高,并且是华北地区的1.59倍。
关联数据信息:本文关联实体数据集已在《全球变化数据仓储电子杂志(中英文)》出版,获取地址:
参考文献
Spatial measurement and classification of forest carbon sink demand based on industry emission reduction
基于行业减排的森林碳汇需求空间测度与分类
China's response to a national land-system sustainability emergency
DOI:10.1038/s41586-018-0280-2 [本文引用: 1]
Sustainable development goals and the forest sector: A complex relationship
The United Nations adopted the Agenda 2030 with its core element, the 17 Sustainable Development Goals (SDGs), in September 2015. In order to achieve these goals within the coming years, intense efforts are required by all political and societal actors. Although the first definitions of sustainable development referred to the forest sector, the question remains: what contribution can forestry make to achieving the Sustainable Development Goals? Therefore, the direct positive and negative effects of forestry itself on sustainability are analyzed, and it is discussed how sustainable forest management could contribute to achieving other Sustainable Development Goals in addition to SDG 15. This analysis reveals that forestry plays a dual role, i.e., forestry can achieve positive sustainability effects but can also have negative impacts. It is thus recommended to use integrated assessment approaches to analyze whether a specific forest-related policy or strategy is contributing to sustainable development. Beside quantitative integrated assessments, the use of qualitative frameworks like the Framework for Strategic Sustainable Development is proposed. It is also suggested to operationalize the concept of second-order sustainability performance for the forest sector in future research.
Improve forest restoration initiatives to meet Sustainable Development Goal 15
Reforestation can sequester two petagrams of carbon in US topsoils in a century
Tree planting has the potential to increase carbon sequestration capacity of forests in the United States
DOI:10.1073/pnas.2010840117
PMID:32958649
[本文引用: 1]

Several initiatives have been proposed to mitigate forest loss and climate change through tree planting as well as maintaining and restoring forest ecosystems. These initiatives have both inspired and been inspired by global assessments of tree and forest attributes and their contributions to offset carbon dioxide (CO) emissions. Here we use data from more than 130,000 national forest inventory plots to describe the contribution of nearly 1.4 trillion trees on forestland in the conterminous United States to mitigate CO emissions and the potential to enhance carbon sequestration capacity on productive forestland. Forests and harvested wood products uptake the equivalent of more than 14% of economy-wide CO emissions in the United States annually, and there is potential to increase carbon sequestration capacity by ∼20% (-187.7 million metric tons [MMT] CO ±9.1 MMT CO) per year by fully stocking all understocked productive forestland. However, there are challenges and opportunities to be considered with tree planting. We provide context and estimates from the United States to inform assessments of the potential contributions of forests in climate change mitigation associated with tree planting.Copyright © 2020 the Author(s). Published by PNAS.
Identification of the land suitable for afforestation in karst area based on the evaluation of ecosystem service importance
基于生态系统服务功能重要性评价的喀斯特宜林地识别
Research progress of carbon sink forests in the context of global change
全球变化背景下碳汇林研究进展
Nature-based solution: Potential and economic benefits of carbon removal or carbon emission reduction through forestry approaches
基于自然的解决方案: 林业增汇减排路径、潜力与经济性评价
Where should China practice forestry in a warming world?
DOI:10.1111/gcb.v28.7 URL [本文引用: 5]
Identification of suitable areas for forest recovery based on principles of landscape ecology
DOI:10.1590/S0100-67622003000400018
URL
[本文引用: 1]
O manejo de áreas florestais com base em princípios de ecologia da paisagem é uma tendência do setor florestal, que tem como proposta o gerenciamento integrado dos aspectos econômicos, sociais e ambientais da atividade produtiva, envolvendo decisões complexas que podem ser auxiliadas pelas técnicas de geoprocessamento. No presente trabalho objetivou-se o desenvolvimento de uma metodologia para aplicação dos conceitos de ecologia de paisagem no planejamento do uso da terra em áreas de reflorestamento, por meio da utilização de um sistema de informações geográficas. Para tal, utilizou-se como área de estudo uma fazenda de reflorestamento da International Paper do Brasil, tendo sido estabelecidos cinco critérios para determinação de áreas para recomposição: fertilidade dos solos, mata nativa existente, corpos d'água, declividade e suscetibilidade à erosão. Esses fatores foram analisados, empregando-se os recursos de decisão multicritérios, em ambiente SIG. Como resultado foi obtido um mapa com áreas adequadas à recomposição florestal, segundo os critérios adotados. Com este mapa realizou-se uma simulação, alocando uma nova área de floresta nativa, e o resultado foi avaliado em nível de paisagem por meio de índices apropriados.
Identifying suitable multifunctional restoration areas for forest landscape restoration in Central Chile
Evaluating the effect of plain afforestation project and future spatial suitability in Beijing
DOI:10.1007/s11430-019-9636-0 [本文引用: 1]
Evaluating the potential of vegetation restoration in the Loess Plateau
DOI:10.11821/dlxb201705008
[本文引用: 1]
The "Grain for Green" project has been initiated in the Loess Plateau since 1999, and would be continuously promoted in the future. Therefore, it is of important significance to assess the vegetation restoration and its potential in the Loess Plateau. In this paper, based on the SPOT VEG NDVI dataset, the trend analysis, Hurst exponent method, statistical methods and geographical spatial analysis technology were adopted. Results showed that NDVI from 1999 to 2013 had a significant upward trend and the vegetation of 2/3 of the area would continue to improve. In loessal areas, the analysis of vegetation response curve indicated that vegetation coverage had a significant exponential relationship with drought index. Such relationship of gentle slope was more obvious than that of steep slope. The best vegetation response function of soil and rock-mountainous areas was linear function. Its correlation coefficient was lower than that of loessal areas. In the future, the average vegetation restoration potential of the Loess Plateau could reach 69.75%, which was high in the southeast and low in the northwest of the plateau. The region with better vegetation restoration would have lower vegetation restoration potential index. The vegetation restoration potential was mainly concentrated in the northern sandy land as well as in the western hilly and gully area. Subsequently, the differences of vegetation restoration rate for this region under different precipitation thresholds were remarkable, among which the area with precipitation of 375-450 mm had fast vegetation restoration. The measures "adaptation to water conditions" should be taken so as to avoid soil drying for afforestation. The results provided scientific support for the construction of ecological civilization on the Loess Plateau.
黄土高原植被恢复潜力研究
DOI:10.11821/dlxb201705008
[本文引用: 1]
黄土高原从1999年开始大规模退耕还林(草),植被覆盖发生了较大变化,对黄土高原植被恢复现状和恢复潜力进行评估具有重要意义。本文使用1999-2013年SPOT VEG NDVI数据,采用线性回归、Hurst指数分析法、统计学方法以及地理空间分析技术,对黄土高原植被恢复状况和潜力进行了探讨。结论主要为:① 1999年退耕还林(草)以来,黄土高原植被覆盖度呈显著上升趋势,黄土高原三分之二地区的植被将会持续改善;② 植被响应曲线分析表明,黄土区植被覆盖度和干旱指数呈显著的指数关系,且缓坡相关性大于陡坡。土石山区植被响应函数为线性函数,相关系数下降;③ 整个黄土高原地区平均植被恢复潜力为69.75%。植被恢复潜力值东南高而西北低,黄土高原东南地区植被恢复状况较好,其植被恢复潜力指数较小,而植被恢复潜力指数较高的地区主要为北方风沙区及西部丘陵沟壑区;④ 不同降水量条件下,植被恢复速度差别显著,其中降水量在375~575 mm之间的地区,植被恢复最快。植被恢复措施应该“因水制宜”,避免因造林带来的土壤干化加剧。研究结果以期为黄土高原生态文明建设提供科学支撑。
China's fight to halt tree cover loss
China and India lead in greening of the world through land-use management
DOI:10.1038/s41893-019-0220-7
PMID:30778399
[本文引用: 1]
Satellite data show increasing leaf area of vegetation due to direct (human land-use management) and indirect factors (climate change, CO fertilization, nitrogen deposition, recovery from natural disturbances, etc.). Among these, climate change and CO fertilization effect seem to be the dominant drivers. However, recent satellite data (2000-2017) reveal a greening pattern that is strikingly prominent in China and India, and overlapping with croplands world-wide. China alone accounts for 25% of the global net increase in leaf area with only 6.6% of global vegetated area. The greening in China is from forests (42%) and croplands (32%), but in India is mostly from croplands (82%) with minor contribution from forests (4.4%). China is engineering ambitious programs to conserve and expand forests with the goal of mitigating land degradation, air pollution and climate change. Food production in China and India has increased by over 35% since 2000 mostly due to increasing harvested area through multiple cropping facilitated by fertilizer use and surface/ground-water irrigation. Our results indicate that the direct factor is a key driver of the "Greening Earth", accounting for over a third, and likely more, of the observed net increase in green leaf area. They highlight the need for realistic representation of human land-use practices in Earth system models.
A 2010 update of National Land Use/Cover Database of China at 1:100000 scale using medium spatial resolution satellite images
DOI:10.1016/j.rse.2014.04.004 URL [本文引用: 1]
Three hundred years of forest and land-use change in Massachusetts, USA
DOI:10.1046/j.1365-2699.2002.00790.x URL [本文引用: 1]
Interactions among Amazon land use, forests and climate: Prospects for a near-term forest tipping point
DOI:10.1098/rstb.2007.0036
URL
[本文引用: 1]
Some model experiments predict a large-scale substitution of Amazon forest by savannah-like vegetation by the end of the twenty-first century. Expanding global demands for biofuels and grains, positive feedbacks in the Amazon forest fire regime and drought may drive a faster process of forest degradation that could lead to a near-term forest dieback. Rising worldwide demands for biofuel and meat are creating powerful new incentives for agro-industrial expansion into Amazon forest regions. Forest fires, drought and logging increase susceptibility to further burning while deforestation and smoke can inhibit rainfall, exacerbating fire risk. If sea surface temperature anomalies (such as El Niño episodes) and associated Amazon droughts of the last decade continue into the future, approximately 55% of the forests of the Amazon will be cleared, logged, damaged by drought or burned over the next 20 years, emitting 15–26 Pg of carbon to the atmosphere. Several important trends could prevent a near-term dieback. As fire-sensitive investments accumulate in the landscape, property holders use less fire and invest more in fire control. Commodity markets are demanding higher environmental performance from farmers and cattle ranchers. Protected areas have been established in the pathway of expanding agricultural frontiers. Finally, emerging carbon market incentives for reductions in deforestation could support these trends.
Analysis on socio-economic determinants of forest fragmentation in Beijing-Tianjin-Hebei region
京津冀森林破碎化的社会经济影响因素分析
Multi-scale assessments of forest fragmentation in China
DOI:10.17520/biods.2016257
[本文引用: 1]
We used the forest fragmentation model to assess forest fragmentation in China based on a 50-m forest cover map in 2010. Six different fragmentation types including interior forest, perforated forest, edge forest, patch forest, transitional forest and undetermined were obtained. We reported the forest fragmentation status in different administration scales (by country, province, and county) based on Chinese administration boundary map of 2010, At the national scale, the patch forest accounted for the largest proportion (49.05%), while the interior forest was the smallest (3.40%). At the regional scale, Northeast China had the lowest forest fragmentation, while Southwest China had moderate forest fragmentation. The highest forest fragmentation areas were mainly distributed in the North China Plain, Central China, Shandong Peninsula and the Huang-Huai-Hai Plain. At the provincial scale, the highest forest fragmentation was located in Shanghai and Tianjin, and the lowest forest fragmentation was located in Yunnan Province and Heilongjiang Province. At the county scale, the lowest forest fragmentation was located in counties in Shaanxi Province. Overall, our results have clearly shown that forest fragmentation occurs extensively and varies substantially over China in 2010. Our study will provide data support for the forestry administrative sector to conduct better forest management and to optimize forestry production and forest spatial patterns, which can improve forest ecosystem services and biodiversity conservation.
中国森林破碎化多尺度评价
DOI:10.17520/biods.2016257
[本文引用: 1]
基于2010年50 m空间分辨率森林分布图, 我们利用森林破碎化模型制作了中国森林6个不同破碎化类型 (内部森林、孔洞森林、边缘森林、斑块森林、过渡森林和未确定森林)的空间分布图。然后结合2010年中国行政区划图, 对比分析了不同尺度行政区域的森林破碎化情况。结果表明: 在国家尺度上, 斑块森林的比例最大(49.05%), 内部森林的比例最小(3.40%); 在区域尺度上, 东北地区森林破碎化程度最低, 西南地区森林破碎化程度次之, 华北平原、华中地区、山东半岛、黄淮海平原的森林破碎化程度最高; 在省级尺度上, 上海市森林破碎化程度最高, 天津市次之, 云南省及黑龙江省森林破碎化程度较低; 在县级尺度上, 陕西省所属的县森林破碎化程度最低。由此可知, 总体上我国森林破碎化情况较为严重, 但不同森林破碎化类型的空间分布存在较大差异。本研究可为各级林业部门管理森林资源以及优化林业生产和森林空间格局中提供数据支持, 提高森林的生态系统服务功能和生物多样性保护功能。
Research review and outlook of forest fragmentation and its solutions in China
中国森林破碎化及其化解研究综述及展望
China: Open access to earth land-cover map.
GLC_FCS30: Global land-cover product with fine classification system at 30 m using time-series Landsat imagery
DOI:10.5194/essd-13-2753-2021
URL
[本文引用: 1]
. Over past decades, a lot of global land-cover products have been released; however, these still lack a global land-cover map with a fine classification system and spatial resolution simultaneously. In this study, a novel global 30 m land-cover classification with a fine classification system for the year 2015 (GLC_FCS30-2015) was produced by combining time series of Landsat imagery and high-quality training data from the GSPECLib (Global Spatial Temporal Spectra Library) on the Google Earth Engine computing platform. First, the global training data from the GSPECLib were developed by applying a series of rigorous filters to the CCI_LC (Climate Change Initiative Global Land Cover) land-cover and MCD43A4 NBAR products (MODIS Nadir Bidirectional Reflectance Distribution Function-Adjusted Reflectance). Secondly, a local adaptive random forest model was built for each 5∘×5∘ geographical tile by using the multi-temporal Landsat spectral and texture features and the corresponding training data, and the GLC_FCS30-2015 land-cover product containing 30 land-cover types was generated for each tile. Lastly, the GLC_FCS30-2015 was validated using three different validation systems (containing different land-cover details) using 44 043 validation samples. The validation results indicated that the GLC_FCS30-2015 achieved an overall accuracy of 82.5 % and a kappa coefficient of 0.784 for the level-0 validation system (9 basic land-cover types), an overall accuracy of 71.4 % and kappa coefficient of 0.686 for the UN-LCCS (United Nations Land Cover Classification System) level-1 system (16 LCCS land-cover types), and an overall accuracy of 68.7 % and kappa coefficient of 0.662 for the UN-LCCS level-2 system (24 fine land-cover types). The comparisons against other land-cover products (CCI_LC, MCD12Q1, FROM_GLC, and GlobeLand30) indicated that GLC_FCS30-2015 provides more spatial details than CCI_LC-2015 and MCD12Q1-2015 and a greater diversity of land-cover types than FROM_GLC-2015 and GlobeLand30-2010. They also showed that GLC_FCS30-2015 achieved the best overall accuracy of 82.5 % against FROM_GLC-2015 of 59.1 % and GlobeLand30-2010 of 75.9 %. Therefore, it is concluded that the GLC_FCS30-2015 product is the first global land-cover dataset that provides a fine classification system (containing 16 global LCCS land-cover types as well as 14 detailed and regional land-cover types) with high classification accuracy at 30 m. The GLC_FCS30-2015 global land-cover products produced in this paper are free access at https://doi.org/10.5281/zenodo.3986872 (Liu et al., 2020).\n
Development of a global 30 m impervious surface map using multisource and multitemporal remote sensing datasets with the Google Earth Engine platform
DOI:10.5194/essd-12-1625-2020
URL
[本文引用: 1]
. The amount of impervious surface is an important\nindicator in the monitoring of the intensity of human activity and\nenvironmental change. The use of remote sensing techniques is the only means\nof accurately carrying out global mapping of impervious surfaces covering\nlarge areas. Optical imagery can capture surface reflectance\ncharacteristics, while synthetic-aperture radar (SAR) images can be used to\nprovide information on the structure and dielectric properties of surface\nmaterials. In addition, nighttime light (NTL) imagery can detect the\nintensity of human activity and thus provide important a priori\nprobabilities of the occurrence of impervious surfaces. In this study, we\naimed to generate an accurate global impervious surface map at a resolution\nof 30 m for 2015 by combining Landsat 8 Operational Land Image (OLI) optical images, Sentinel-1 SAR\nimages and Visible Infrared Imaging Radiometer Suite (VIIRS) NTL images based on\nthe Google Earth Engine (GEE) platform. First, the global impervious and\nnonimpervious training samples were automatically derived by combining the\nGlobeLand30 land-cover product with VIIRS NTL and MODIS enhanced vegetation\nindex (EVI) imagery. Then, the local adaptive random forest classifiers,\nallowing for a regional adjustment of the classification parameters to take into\naccount the regional characteristics, were trained and used to generate\nregional impervious surface maps for each 5∘×5∘ geographical grid using local training samples and multisource\nand multitemporal imagery. Finally, a global impervious surface map,\nproduced by mosaicking numerous 5∘×5∘\nregional maps, was validated by interpretation samples and then compared\nwith five existing impervious products (GlobeLand30, FROM-GLC, NUACI, HBASE and GHSL). The results indicated that the global\nimpervious surface map produced using the proposed multisource,\nmultitemporal random forest classification (MSMT_RF) method\nwas the most accurate of the maps, having an overall accuracy of 95.1 %\nand kappa coefficient (one of the most commonly used statistics to test\ninterrater reliability; Olofsson et al., 2014) of 0.898 as\nagainst 85.6 % and 0.695 for NUACI, 89.6 % and 0.780 for\nFROM-GLC, 90.3 % and 0.794 for GHSL, 88.4 % and 0.753 for\nGlobeLand30, and 88.0 % and 0.745 for HBASE using all 15 regional\nvalidation data. Therefore, it is concluded that a global 30 m impervious\nsurface map can accurately and efficiently be generated by the proposed\nMSMT_RF method based on the GEE platform. The global\nimpervious surface map generated in this paper is available at https://doi.org/10.5281/zenodo.3505079 (Zhang and Liu, 2019).\n
1 km monthly temperature and precipitation dataset for China from 1901 to 2017
DOI:10.5194/essd-11-1931-2019
URL
[本文引用: 1]
. High-spatial-resolution and long-term climate data are\nhighly desirable for understanding climate-related natural processes. China\ncovers a large area with a low density of weather stations in some (e.g.,\nmountainous) regions. This study describes a 0.5′ (∼ 1 km)\ndataset of monthly air temperatures at 2 m (minimum, maximum, and mean proxy monthly temperatures, TMPs)\nand precipitation (PRE) for China in the period of 1901–2017. The dataset\nwas spatially downscaled from the 30′ Climatic Research Unit (CRU) time\nseries dataset with the climatology dataset of WorldClim using delta spatial\ndownscaling and evaluated using observations collected in 1951–2016 by 496\nweather stations across China. Prior to downscaling, we evaluated the\nperformances of the WorldClim data with different spatial resolutions and\nthe 30′ original CRU dataset using the observations, revealing that their\nqualities were overall satisfactory. Specifically, WorldClim data exhibited\nbetter performance at higher spatial resolution, while the 30′ original CRU\ndataset had low biases and high performances. Bicubic, bilinear, and\nnearest-neighbor interpolation methods employed in downscaling processes\nwere compared, and bilinear interpolation was found to exhibit the best\nperformance to generate the downscaled dataset. Compared with the\nevaluations of the 30′ original CRU dataset, the mean absolute error of the new dataset (i.e., of the 0.5′ dataset downscaled by bilinear interpolation) decreased by 35.4 %–48.7 % for TMPs and by 25.7 % for PRE. The root-mean-square error decreased by 32.4 %–44.9 % for TMPs and by 25.8 % for PRE. The Nash–Sutcliffe efficiency coefficients increased by\n9.6 %–13.8 % for TMPs and by 31.6 % for PRE, and correlation\ncoefficients increased by 0.2 %–0.4 % for TMPs and by 5.0 % for PRE. The new dataset could provide detailed climatology data and annual trends of all climatic variables across China, and the results could be evaluated well using observations at the station. Although the new dataset was not evaluated before 1950 owing to data unavailability, the quality of the new\ndataset in the period of 1901–2017 depended on the quality of the original\nCRU and WorldClim datasets. Therefore, the new dataset was reliable, as the\ndownscaling procedure further improved the quality and spatial resolution of\nthe CRU dataset and was concluded to be useful for investigations related\nto climate change across China. The dataset presented in this article has\nbeen published in the Network Common Data Form (NetCDF) at\nhttps://doi.org/10.5281/zenodo.3114194 for precipitation (Peng,\n2019a) and https://doi.org/10.5281/zenodo.3185722 for air temperatures at 2 m\n(Peng, 2019b) and includes 156 NetCDF files compressed in zip\nformat and one user guidance text file.\n
Geographical differences in alpine timberline and its climatic interpretation in China
DOI:10.11821/xb200406009
[本文引用: 2]
<p>The variations of alpine timberline altitude with latitude and longitude in China were investigated and their relationships with climatic indices were analyzed in this study. The results are summarized as follows: (1) The altitude of alpine timberline in China changes significantly along latitudinal and longitudinal gradients. North of 30<sup>o</sup>N, the timberline altitude decreases with the increase of latitude at the rate of 112 m per latitude degree. South of 30<sup>o</sup>N, the latitudinal change shows a different pattern: the altitude does not vary significantly with latitude in the eastern part and increases with latitude in the western part. The timberline altitude drops with the increasing of longitude at similar latitudes, resulting from increased temperature conditions from east to west due to large-scale topographic and geographic factors. The highest timberline (4600 m) was observed in southeast Tibet (29<sup>o</sup>-32<sup>o</sup>N, 94<sup>o</sup>-96<sup>o</sup>N), the highest timberline in the world. (2) The timberline is limited by growing season temperature, i.e. Annual Biotemperature (ABT) of 3.5<sup>o</sup>C, Warmth Index (WI) of 14.2 <sup>o</sup>C·month, and Mean Temperature for Growing Season (MTGS) of 8.2 <sup>o</sup>C. The corresponding altitudes of these temperature thresholds change with geographic factors, and this change has led to the changes in the latitudinal and longitudinal timberline patterns and timberline variations from the oceanic to continental climate. (3) Precipitation affects obviously timberline altitude at the middle-high latitudes in China; timberline is higher in arid regions than in humid areas at the similar latitudes, caused by increase of temperature at the low humid conditions.</p>
中国高山林线的分布高度与气候的关系
Determination of world plant formations from simple climatic data
DOI:10.1126/science.105.2727.367 PMID:17800882 [本文引用: 1]
A New Classification of Climate in Eastern Asia as the Basis for Agricultural Geography
A GIS-based method for identifying and extracting micro-topography factors
基于GIS的微地形因子识别与提取
The calculation algorithms for average wind direction and their comparison
In this paper, four calculation algorithms for average wind direction and their comparison are given, these algorithms include arithmetic, scalar, unit vector and vector. The comparison of the results from these algorithms using the observation data was also made. Results are as follows: the results of arithmetic algorithm enlarge the percentage of south wind, the results of scalar algorithm cause a larger error when wind direction rotation cxceeds 360°. The unit vector has similar results with vector, and does not need wind speed. The unit vector is the best.
平均风向的计算方法及其比较
常用的平均风向4种计算方法分别是算术平均法、标量平均法、单位矢量法和矢量法,利用实测资料对各种方法的计算结果进行比较,结果表明:算术平均法加大了偏南风的比重;标量平均法在风向变化360°时有可能出现较大的误差,在应用时须加以注意;单位矢量法与矢量法的结果比较一致,且不需风速的同期观测资料,是一种比较好的方法。
Spatial and temporal variability of climatic potential productivity in Yunnan province, China
云南省气候生产潜力的时空变化
NPP model of natural vegetation and its application in China
自然植被净第一性生产力模型及其应用
Non-parametric tests against trend
DOI:10.2307/1907187 URL [本文引用: 1]
Review of methods for the detection and estimation of trends with emphasis on water quality applications
DOI:10.1002/(ISSN)1099-1085 URL [本文引用: 1]
Evolution regularity of precipitation in the Shiyang River Basin on Mann-Kendall features
从Mann-Kendall特征看石羊河流域降水量的演变规律
Trend analysis in reference evapotranspiration using Mann-Kendall and spearman's rho tests in arid regions of Iran
DOI:10.1007/s11269-011-9913-z URL [本文引用: 1]
Improper vegetation restoration leads to reduction of water resources
DOI:10.1360/N072020-0157 URL [本文引用: 3]
不恰当的植被恢复导致水资源减少
The Marrakesh Accords and the Marrakesh Declaration
Definitions of afforestation, reforestation, and deforestation in relations to carbon accounting
森林、造林、再造林和毁林的定义与碳计量问题
Vegetation restoration in northern China: A contrasted picture
DOI:10.1002/ldr.v31.6 URL [本文引用: 1]
The effect of ground treatment on the effectiveness of fly-seeded afforestation
浅谈地面处理对飞播造林成效的影响
Influence factors of afforestation by aerial seeding and improving measures in Shaanxi province
陕西省飞播造林影响因素及提高措施
Age-dependent forest carbon sink: Estimation via inverse modeling
DOI:10.1002/jgrg.v120.12 URL [本文引用: 1]
Divergent responses of soil organic carbon to afforestation
DOI:10.1038/s41893-020-0557-y [本文引用: 1]
Research progresses and prospects of carbon storage in forest ecosystems
森林生态系统碳储量研究进展与展望
Impacts of afforestation on the carbon stocks and carbon sequestration rates of regional forest ecosystems
造林对区域森林生态系统碳储量和固碳速率的影响
A large and persistent carbon sink in the world's forests
DOI:10.1126/science.1201609
PMID:21764754
[本文引用: 1]
The terrestrial carbon sink has been large in recent decades, but its size and location remain uncertain. Using forest inventory data and long-term ecosystem carbon studies, we estimate a total forest sink of 2.4 ± 0.4 petagrams of carbon per year (Pg C year(-1)) globally for 1990 to 2007. We also estimate a source of 1.3 ± 0.7 Pg C year(-1) from tropical land-use change, consisting of a gross tropical deforestation emission of 2.9 ± 0.5 Pg C year(-1) partially compensated by a carbon sink in tropical forest regrowth of 1.6 ± 0.5 Pg C year(-1). Together, the fluxes comprise a net global forest sink of 1.1 ± 0.8 Pg C year(-1), with tropical estimates having the largest uncertainties. Our total forest sink estimate is equivalent in magnitude to the terrestrial sink deduced from fossil fuel emissions and land-use change sources minus ocean and atmospheric sinks.
Climate change, human impacts, and carbon sequestration in China
DOI:10.1073/pnas.1700304115 PMID:29666313 [本文引用: 1]
