

1 引言
生态系统服务是指生态系统与生态过程所形成及所维持的人类赖以生存的自然环境条件与效用,是生态系统为人类提供的各种福祉的统称[1⇓-3]。不同类别的生态系统服务之间存在复杂的相互关系[4],其中,生态系统服务权衡/协同关系可以为管理者的决策提供有效依据而受到人们的关注[5⇓-7]。生态系统服务权衡是指一种生态系统服务的增加导致另一种生态系统服务减少的情形,协同是指两种生态系统服务同时增加或同时减少的情形[8],即不同生态系统服务之间此消彼长的关系为权衡,同增同减的关系为协同。生态系统管理的最终目标也是达到生态系统服务同增协同的“双赢”状态。然而,生态系统服务的权衡/协同关系存在很强的空间异质性[8],不同区域的生态系统处于权衡/协同关系的不同状态。例如,Howe等通过整合分析1324份研究案例发现权衡关系的出现是协同关系的3倍[9];Turkelboom等利用利益主体为中心的分析框架对24个研究案例进行分析,发现生态系统服务权衡关系的复杂性远超过文献描述,供给服务和文化服务之间权衡关系更为突出[7]。因此,识别生态系统权衡/协同关系的空间异质性及其影响因素对于生态系统优化管理至关重要[10]。
目前,生态系统服务权衡/协同关系的异质性研究主要聚焦在权衡/协同的空间尺度效应[11-12]、权衡/协同关系空间异质性的影响因素分析[13-14]、生态功能区优化及生态系统管理的政策制定等方面[15⇓-17]。研究发现同一类生态系统服务(如固碳、产水、土壤保持)在大尺度研究区域内,以协同关系为主[18-19],而在小尺度研究区域内,表现为权衡关系[20⇓-22],生态系统服务权衡/协同关系在空间分布上表现出尺度效应。在影响因素研究方面,生态系统服务权衡/协同关系的空间异质性受到生态修复工程实施[11]、区域城市化发展[23]、土地利用类型转变[24]等人类活动的影响和气候、土壤、海拔等自然因素的影响[13-14]。在生态功能区优化方面,有研究在识别区域生态系统服务权衡/协同关系空间异质性的基础上进行生态功能区的精细划分[25-26],并提出各功能区的特色与优化路径。目前国家和省级区域的生态功能区划是综合考虑自然、社会经济条件、生态系统特征的以县为单位的粗线条划分,从生态系统服务权衡/协同的角度其是否能反应生态功能区的主导功能、存在问题及如何调整是优化生态系统分区面临的重要问题。
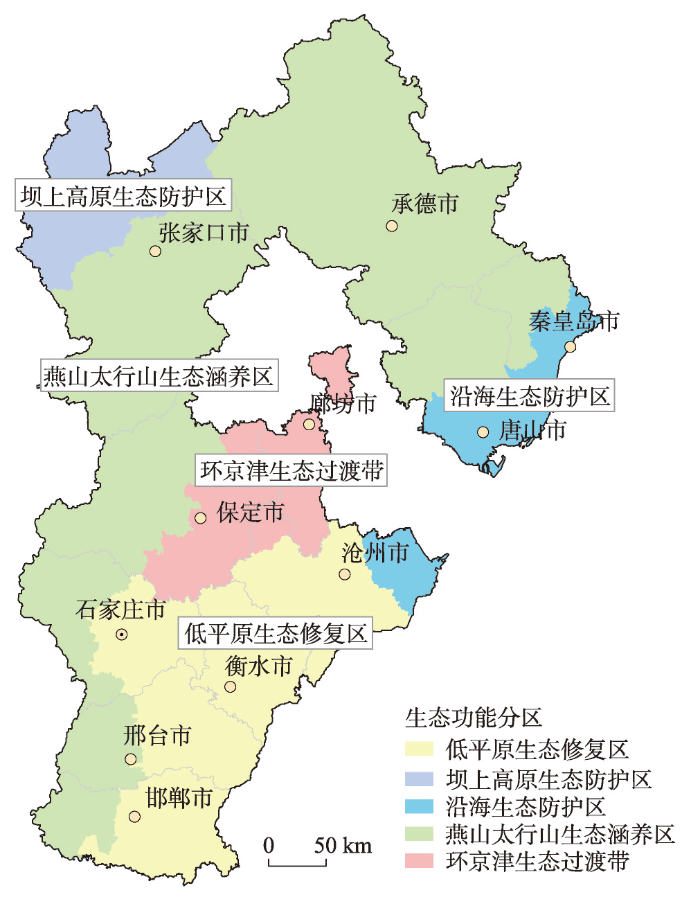
河北省地形地貌多样、生态系统类型丰富,同时环抱北京、天津,地理区位十分重要。在河北省建设京津冀生态环境支撑区“十四五”规划中,将全省分为环京津生态过渡带、坝上高原生态防护区、燕山太行山生态涵养区、低平原生态修复区、沿海生态防护区5个生态功能区。从生态系统服务权衡/协同的空间异质性特征来判断目前河北省生态功能分区是否合理是亟需解决的问题。因此,本文选择粮食生产、碳储存、水源涵养和土壤保持4种典型生态系统服务,运用空间叠置分析法探索河北省不同生态功能区生态系统服务权衡/协同关系的空间异质性及其原因,并针对性地提出各生态功能区存在的问题及解决建议,以期为区域尺度的生态功能区管理、规划提供理论支撑。
2 研究区概况与研究方法
2.1 研究区概况
河北省(36°05'N~42°40'N, 113°27'E~119°50'E)总面积约18.88万km2,下辖石家庄、唐山、秦皇岛、邯郸、邢台、保定、张家口、承德、沧州、廊坊、衡水11个地级市。河北省气候属温带大陆性季风气候,一年四季,冷热分明,多年平均降水量484.5 mm,一般集中在7—8月,雨热同期。省内地形地貌复杂多样,整体地势西北高、东南低,形成了以坝上高原、燕山—太行山地、河北平原为主的三大地貌类型。河北省是中国重要的粮食生产大省,2022年粮食总产量为3865.1万t,位居全国第7。河北省生产能力和生产潜力较高[27],为保障京津冀都市圈的粮食供应、维持社会经济良性循环发挥了重要作用[28]。
图1
2.2 指标选取及数据来源
陆地生态系统碳储存是通过降低大气CO2浓度减缓气候变化的重要途径之一[30],碳储存服务一直以来都是生态系统服务评价指标体系中调节服务的代表之一[1⇓-3],河北省生态系统多样在区域碳平衡中发挥了重要作用。水资源紧缺是河北省面临的严峻资源问题,由于河北省还承担着北京、天津储备水库的功能,水资源短缺已经成为京津冀都市圈经济发展的主要限制因素[31-32],选择水源涵养服务评估有助于从生态系统服务权衡/协同角度了解河北省水资源情况。土壤侵蚀是河北省面临的又一个重要环境问题[33],土壤保持可以通过调整生态系统结构与过程减少土壤侵蚀造成的危害[1,33],是生态系统重要的调节服务之一,与区域降水量、蒸散发量、土壤质地、地形地貌、植被覆盖等因素密切相关[34],体现了区域整体多种自然环境条件的情况。基于此,本文选择了粮食生产、碳储存、水源涵养和土壤保持4种典型生态系统服务作为评估的指标。
本文所用到的河北省土地利用类型数据、土壤质地空间分布数据、NDVI数据来源于中国科学院资源环境科学数据中心(
2.3 生态系统服务评估方法
2.3.1 粮食生产服务
式中:CPi表示栅格i的粮食产量;CPsum表示研究区域总的粮食产量;NDVIi表示栅格i的归一化植被指数;NDVIsum表示研究区域总的归一化植被指数。
2.3.2 土壤保持服务
式中:Q为土壤保持量;R为降雨侵蚀力因子;K为土壤可蚀性因子;LS为坡长坡度因子,该因子从《泛第三极重点地区20国LS数据》数据集中提取获得[41];C为植被覆盖因子;P为水土保持因子,根据不同生态系统类型进行赋值;LS、C、P均无量纲。
降雨侵蚀力因子R采用Wischmeier等[42]提出的利用各月降雨量推求的经验公式:
式中:R为栅格单元的降雨侵蚀力因子;i为月份;pi为某月降雨量;p为年降雨量。
土壤可蚀性因子K采用Williams等在EPIC模型中发展的计算公式[43]:
式中:K为土壤可蚀性因子;Sn=1-Sa/100;Sa为土壤砂粒含量;Si为土壤粉粒含量;Cl为土壤粘粒含量;SOC为土壤有机碳含量。
植被覆盖因子C采用NDVI指数计算的植被覆盖度来得到,公式如下:
式中:C为植被覆盖因子,无量纲,介于0~1之间;f为植被覆盖度指数;NDVIi为栅格i的NDVI数值;NDVIsoil为裸土象元的NDVI数值;NDVImax为纯植被象元的NDVI数值。
2.3.3 水源涵养服务
式中:Qwr为水源涵养量;Ai为第i类生态系统的面积;Pi为产流降雨量;Ri为地表径流量;ETi为蒸散发量;i为生态系统类型;n为生态系统类型总数。
2.3.4 碳储存服务
本文采用植被碳储量来表征生态系统的碳储存或碳汇服务,包括森林、草地、湿地等自然生态系统。由于受到人为因素的强烈干扰其碳周转快速,本文不考虑农田生态系统碳储存服务。森林碳储量数据来自于中国科学院生态环境研究中心《中国森林地上和地下植被碳储量数据集(2002—2021)》,该数据集的预测精度达到89%,可准确地反映中国森林植被碳储量的空间格局以及年际变化情况[46]。本文从该数据集中提取河北省森林地上和地下碳储量,并叠加得到森林总碳储量。草地和湿地碳储量数据的获取分为两步:① 从国家生态数据中心资源共享服务平台中提取河北省草地和湿地生物量数据;② 结合从文献中提取的河北省草地和湿地植物的平均碳含量系数[47-48]计算得到二者的碳储量结果。森林、草地、湿地碳储量数据叠加得到河北省生态系统碳储存服务功能量分布。
2.4 生态系统服务权衡与协同分析方法
空间叠置法是一种基于排序分级框架的生态系统服务权衡/协同量化方法,其通过对多种生态系统服务供给能力进行等级划分并在空间上叠加,以生态系统服务量间的高低关系判断生态系统服务间的权衡/协同关系。在该方法中,权衡是指一个空间栅格单元或生态系统中1种或2种服务供给能力强而其他服务能力弱的不均衡状态,协同是指多种服务供给能力均较强或较弱的均衡状态[49]。虽然这是一种静态的数量方法,但其优点在于可将多种生态系统服务综合考虑来表征其权衡/协同状态,能够直接表征生态系统的主导功能,并将权衡与协同关系的空间异质性在空间上的差异清晰、直观地表达出来。该方法是生态系统权衡/协同关系分析的有效方案,可以用来判断生态系统在某一时间节点上生态系统服务功能是否达到高协同的理想状态。因此该方法在近些年被国内外学者重视起来,在生态系统服务权衡/协同关系的综合量化、空间异质性分析、生态功能区优化等方面发挥了重要作用[50⇓⇓-53]。
本文使用空间叠置分析法对研究区域内不同生态区、不同类型生态系统服务之间的权衡/协同关系进行分析和展示,该方法可清晰地反映出不同生态系统服务之间权衡/协同关系在空间上的分布特征[20]。具体操作方法为:首先对不同生态系统服务数据进行标准化处理,即每个栅格单元的生态系统服务值与研究区域内该服务的最大值相比,之后采用自然断点法分为低、中、高3个等级,对应编号1、2、3(表1);其次,对分级后的生态系统服务栅格数据在ArcGIS10.2软件中进行空间叠置(新代码=粮食生产×1000+碳储存×100+土壤保持×10+水源涵养),得到不同等级组合的生态系统服务空间分布结果;最后,根据权衡/协同的定义[54],对空间叠置结果进行分类,将不同生态系统服务之间的关系分为强权衡、弱权衡、高协同、低协同4种(表2)。本文中,强权衡为1种服务供给能力强而其他服务较弱的情形;弱权衡为2种或3种服务供给能力强而其余服务较弱的情形;强协同为4种服务能力都达到中级及以上的情形;低协同为4种服务能力都为中级及以下的情形。
表1 各生态系统服务能力分级
Tab. 1
| 服务类型 | 低(1) | 中(2) | 高(3) |
|---|---|---|---|
| 粮食生产 | 0~0.349 | 0.349~0.804 | 0.804~1 |
| 碳储存 | 0~0.118 | 0.118~0.298 | 0.298~1 |
| 土壤保持 | 0~0.059 | 0.059~0.212 | 0.212~1 |
| 水源涵养 | 0~0.094 | 0.094~0.271 | 0.271~1 |
表2 生态系统服务权衡/协同划分标准及统计
Tab. 2
| 服务关系 | 亚类 | 供给能力组合 | 组合个数 | 组合示例 |
|---|---|---|---|---|
| 权衡 | 强权衡 | 1高3低 | 4 | 3111、1311 |
| 1高1中2低 | 12 | 3211、3121 | ||
| 1高2中1低 | 12 | 3221、3122 | ||
| 弱权衡 | 2高2低 | 6 | 3311、3131 | |
| 2高1中1低 | 12 | 3321、3312 | ||
| 3高1低 | 4 | 3331、3313 | ||
| 协同 | 高协同 | 4高 | 1 | 3333 |
| 3高1中 | 4 | 3332、3323 | ||
| 2高2中 | 6 | 3322、3232 | ||
| 1高3中 | 4 | 3222、2322 | ||
| 4中 | 1 | 2222 | ||
| 低协同 | 3中1低 | 4 | 2221、2212 | |
| 2中2低 | 6 | 2211、2121 | ||
| 1中3低 | 4 | 2111、1211 | ||
| 4低 | 1 | 1111 |
3 结果分析
3.1 河北省生态系统服务总量及空间格局
表3 河北省不同生态区生态系统服务统计
Tab. 3
| 服务类型 | 生态区 | 单位面积服务能力 | 区域总量 (万t) | 河北省占比 (%) | ||
|---|---|---|---|---|---|---|
| 最小值 | 最大值 | 平均值 | ||||
| 粮食生产 (kg hm-2 a-1) | 低平原生态修复区 | 333.46 | 5001.83 | 4376.38 | 1449 | 37.85 |
| 燕山太行山生态涵养区 | 1333.82 | 5001.83 | 4135.64 | 1257 | 32.84 | |
| 环京津生态过渡带 | 1244.90 | 5001.83 | 4302.87 | 526 | 13.73 | |
| 坝上高原生态防护区 | 1333.82 | 5001.83 | 3638.83 | 311 | 8.12 | |
| 沿海生态防护区 | 111.15 | 5001.83 | 4287.50 | 286 | 7.46 | |
| 河北省 | 3828 | |||||
| 碳储存 (t C hm-2) | 低平原生态修复区 | 0.00 | 31.27 | 1.27 | 316 | 3.69 |
| 燕山太行山生态涵养区 | 0.00 | 51.62 | 9.84 | 7984 | 93.19 | |
| 环京津生态过渡带 | 0.00 | 31.93 | 0.97 | 123 | 1.43 | |
| 坝上高原生态防护区 | 0.00 | 34.74 | 2.59 | 35 | 0.41 | |
| 沿海生态防护区 | 0.00 | 32.12 | 1.66 | 109 | 1.28 | |
| 河北省 | 8567 | |||||
| 土壤保持 (t hm-2 a-1) | 低平原生态修复区 | 0.00 | 1238.07 | 8.72 | 3682 | 0.78 |
| 燕山太行山生态涵养区 | 0.00 | 6166.20 | 437.79 | 453230 | 96.40 | |
| 环京津生态过渡带 | 0.00 | 1421.35 | 8.36 | 1394 | 0.30 | |
| 坝上高原生态防护区 | 0.00 | 530.00 | 19.96 | 2748 | 0.58 | |
| 沿海生态防护区 | 0.00 | 3115.35 | 76.94 | 9108 | 1.94 | |
| 河北省 | 470161 | |||||
| 水源涵养 (t hm-2 a-1) | 低平原生态修复区 | 0.00 | 1490.10 | 70.93 | 29881 | 4.55 |
| 燕山太行山生态涵养区 | 0.00 | 3665.93 | 477.36 | 492731 | 75.01 | |
| 环京津生态过渡带 | 0.00 | 2011.85 | 143.82 | 23889 | 3.64 | |
| 坝上高原生态防护区 | 0.00 | 2791.27 | 594.58 | 81439 | 12.40 | |
| 沿海生态防护区 | 0.00 | 2120.33 | 271.94 | 28934 | 4.40 | |
| 河北省 | 656875 | |||||
图2
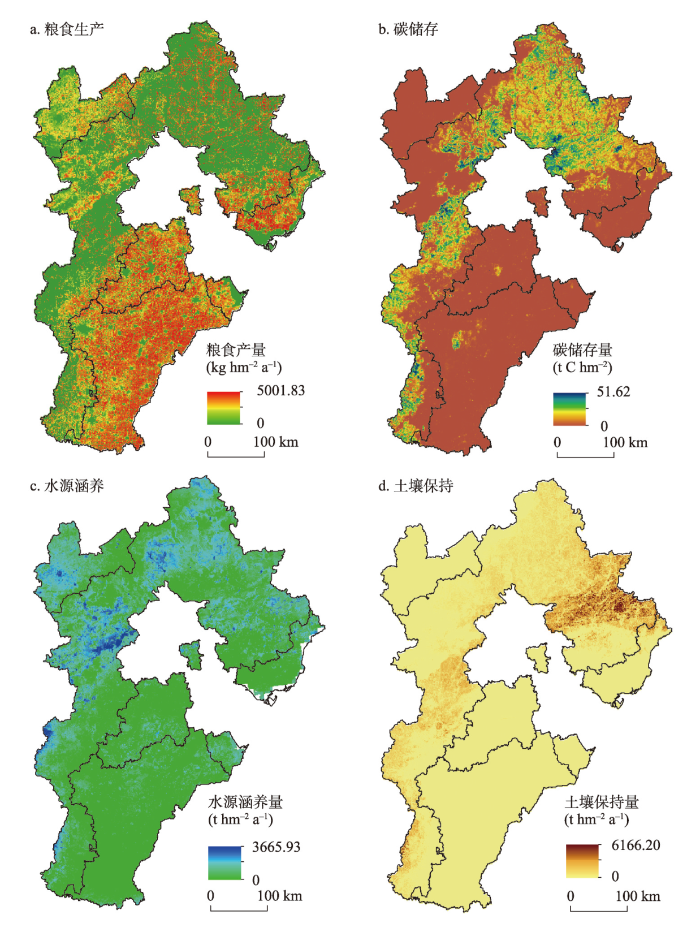
图2
2017年河北省生态系统服务空间分布
Fig. 2
Spatial distribution of ecosystem services in Hebei province in 2017
3.2 河北省不同生态区生态系统服务等级差异
从图3可以看到,粮食生产服务高值区在河北省不同生态功能区都有分布,其中高值区占比较高的生态功能区为低平原生态修复区(64%)、环京津生态过渡带(55%)和沿海生态防护区(42%),中值区占比除坝上高原生态防护区达到46%,其余生态功能区该比例均在15%左右,低值区在燕山太行山生态涵养区占比最高(71%)。
图3

图3
不同生态功能区生态系统服务各等级面积占比
注:图中PY表示低平原生态修复区,YS表示燕山太行山生态涵养区,HJJ表示环京津生态过渡带,BS表示坝上高原生态防护区,YH表示沿海生态防护区。
Fig. 3
Area proportion of ecosystem services at different levels among different ecological function zones
碳储存服务中,只有燕山太行山生态涵养区和坝上高原生态防护区有部分高值区分布,占比分别为19%和8%,中、高值区占比总和分别达到52%和16%,其他生态功能区均以低值区为主(占比84%以上)。
土壤保持服务中,仅燕山太行山生态涵养区和沿海生态防护区有少量高值区分布,且占比非常低,分别为7%和1%,中、高值区占比总和分别为41%和6%,其余各生态功能区均为低值区(100%)。
水源涵养服务高值区在各生态功能区均有分布,其中燕山太行山生态涵养区(17%)和坝上高原生态防护区(21%)分布比例较高,与高值区分布相比,中值区在各生态功能区分布比例有所增加,燕山太行山生态涵养区和坝上高原生态防护区中高值区分布比例总和均达到或超过50%;除坝上高原生态防护区外,低值区分布占比在其他各生态功能区均达到了50%以上。
3.3 河北省生态系统服务权衡/协同关系
河北省不同生态系统服务之间以强权衡和低协同关系为主(图4),强权衡和低协同的比例分别达到48.15%和45.92%,其次为弱权衡5.09%和高协同0.83%(表4)。在各个生态区也是以强权衡和低协同为主,不同的是这两种关系在不同生态区的高低具有差异(表4)。低平原生态修复区和环京津生态过渡带表现为强权衡面积比例高于低协同,燕山太行山生态涵养区和坝上高原生态防护区表现为低协同面积比例高于强权衡,沿海生态防护区二者基本相当。高协同关系所占面积比例最少,主要出现在燕山太行山生态涵养区和沿海生态防护区(图4),在各自生态区所占比例分别为1.49%和0.08%,其他3个生态区高协同所占比例几乎为零(表4)。
图4
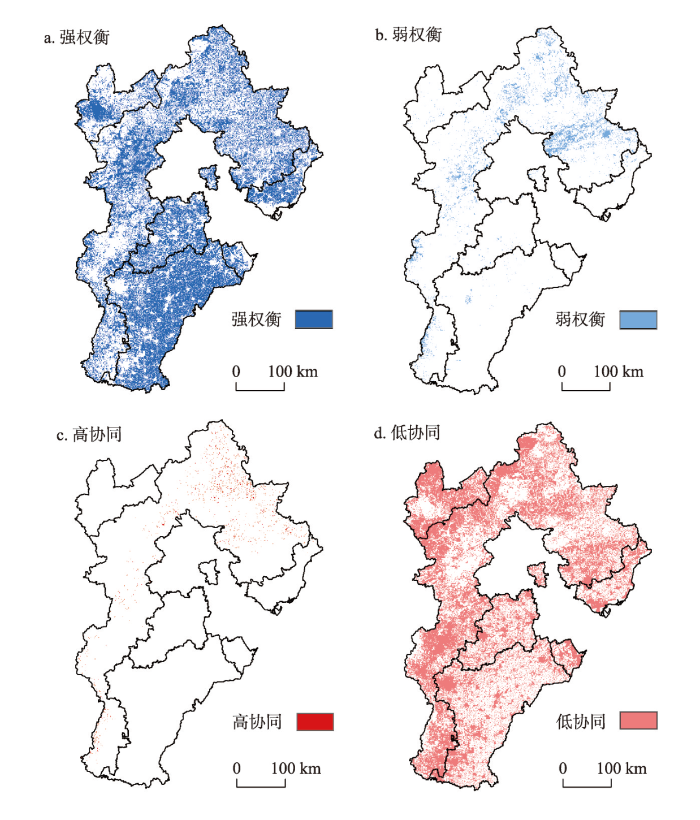
图4
河北省生态系统服务权衡/协同关系
Fig. 4
Ecosystem services trade-off/synergy of Hebei province
表4 不同生态区权衡/协同面积比例(%)
Tab. 4
| 生态区 | 低协同 | 高协同 | 强权衡 | 弱权衡 |
|---|---|---|---|---|
| 低平原生态修复区 | 35.54 | 0.00 | 63.95 | 0.50 |
| 燕山太行山生态涵养区 | 48.04 | 1.49 | 41.77 | 8.70 |
| 环京津生态过渡带 | 42.57 | 0.00 | 56.73 | 0.69 |
| 坝上高原生态防护区 | 63.45 | 0.00 | 35.98 | 0.57 |
| 沿海生态防护区 | 49.13 | 0.08 | 49.83 | 0.97 |
| 河北省 | 45.92 | 0.83 | 48.15 | 5.09 |
本文将有一种生态系统服务功能占主导功能的权衡关系定义为强权衡。如果强权衡下的主导功能与该生态区的功能定位一致,也是一种比较理想的生态系统状态。本文统计了不同生态区强权衡关系下4种服务作为主导功能的面积占比(表5)。结果表明,低平原生态修复区、环京津生态过渡带和沿海生态防护区以粮食生产为主导功能的面积占比最高(均为90%左右),说明导致这3个功能区生态系统强权衡的直接原因是粮食生产能力。燕山太行山生态涵养区粮食生产、碳储存、水源涵养作为主导功能的占比三者基本相当(为30%左右),这3种功能在该生态功能区强权衡关系形成中均发挥了重要作用,而且碳储存和水源涵养作为主导功能的面积比例之和达到61%,基本体现了该生态功能区生态涵养的主导功能。坝上高原生态防护区则为水源涵养作为主导功能的占比最高,该功能是该生态功能区强权衡关系形成最重要的原因,水源涵养能力强也说明了该生态区植被保护、植被建设方面具有显著成效,在高原生态防护方面发挥了有益作用。
表5 不同生态区主导功能面积比例(%)
Tab. 5
| 生态区 | 粮食生产 | 碳储存 | 土壤保持 | 水源涵养 |
|---|---|---|---|---|
| 低平原生态修复区 | 98.81 | 0.72 | 0 | 0.48 |
| 燕山太行山生态涵养区 | 33.83 | 29.93 | 8.58 | 27.66 |
| 环京津生态过渡带 | 96.56 | 0.33 | 0.01 | 3.10 |
| 坝上高原生态防护区 | 42.05 | 0.43 | 0 | 57.52 |
| 沿海生态防护区 | 89.94 | 0.06 | 3.08 | 6.93 |
不同地类由于主导功能的差异其生态系统服务之间的关系可能不同。本文对各生态系统服务数据标准化,消除量纲的影响,并统计各生态区、不同地类4种生态系统服务的标准化数据均值,通过玫瑰图反应各生态区不同地类生态系统服务的关系(图5)。4种生态系统服务在不同地类中的关系主要表现出3种模式。① 单一功能主导模式。在耕地中粮食生产占主导功能,在不同生态区的耕地中均如此;坝上高原生态防护区除耕地外的其他地类均表现出水源涵养的主导功能。② 两种功能均衡模式。环京津生态过渡带除耕地外的其他地类和低平原生态修复区的水域、建设用地、未利用地均表现出水源涵养和碳储存相对均衡的状态。③ 3种功能鼎力模式。燕山太行山生态涵养区除耕地外的其他地类和沿海生态防护区的林地、草地均表现出水源涵养、碳储存、土壤保持都较强的状态。总的来说,不同地类的生态系统服务之间的关系有所不同,同一地类在不同生态区其生态系统服务之间的关系也会存在差异。
图5

图5
河北省各生态区不同地类生态系统服务玫瑰图
注:CP表示粮食生产,CT表示碳储存,WC表示水源涵养,SC表示土壤保持。
Fig. 5
Ecosystem services for different land-use types in ecological function zones of Hebei province
4 结论与讨论
4.1 讨论
在理想条件下,多数研究认为,同一个生态系统其所有生态系统服务之间呈现“高协同”关系或者“正向协同”是利益最大化的表现,这是生态系统管理的最终目标[20,54 -55]。但现实状况中往往只有部分甚至少数区域能够达到这种状态,多数表现为一种或两种为主导的“权衡”关系,甚至还有生态系统服务都不太理想的“低协同”状态[56-57]。在这种情况下,通过人为干预,制定相应管理规定,将“低协同”关系为主的生态系统转换为以一种或两种服务功能为主导的“强权衡”关系,在短期内会是既能发挥生态系统主要功能,又易于实现的可行目标[49,56]。根据环保部印发的《全国生态功能区划(修编版)》,其确定生态功能区的第一条原则即为主导功能原则,该原则指出:区域生态功能的确定以生态系统的主导服务功能为主;在具有多种生态系统服务功能的地域,以生态调节功能优先;在具有多种生态调节功能的地域,以主导调节功能优先。因此,从生态系统权衡/协同的角度来看,生态功能区划的主导功能原则即为生态系统服务间的关系表现为强权衡,且强权衡中的主导功能要与生态区的功能定位相吻合。
河北省生态功能区权衡/协同关系中强权衡面积占比达到48.15%,而高协同地区占比仅为0.83%。这说明在河北地区生态系统服务高协同的状态确实很难达到,强权衡关系的地区可以占到河北省国土面积的约一半。在进一步的强权衡关系主导功能分析中发现,燕山太行山生态涵养区以碳储存、水源涵养和土壤保持作为主导功能的区域占到该功能区面积的66%,坝上高原生态防护区以水源涵养作为主导功能的区域占到该功能区面积约57.5%,充分体现了这两个生态区在生态涵养、防护方面的主要作用。低平原生态修复区、环京津生态过渡带、沿海生态防护区强权衡关系的主导功能均为粮食生产,其粮食生产功能作为主导功能的区域均占到其功能区面积的90%以上,这是河北省作为全国粮食大省的重要体现,在国民社会、经济安全中发挥了重要作用,但是在生态修复、防护中的作用还需再加强。总的来说,从生态系统服务权衡/协同关系的角度来看,河北省生态功能区划分体现了国家生态功能区划的主导功能原则,符合河北省不同地形、地貌、地类实际情况,将为河北省国土空间安全、发展提供基础支撑。
另一个主要的问题是,河北省不同生态功能区权衡/协同关系中低协同面积占比达到45.92%,说明河北省有将近一半的国土面积处于生态系统服务最不理想的状态。根据本文生态系统服务权衡/协同分析,强权衡为不同生态系统服务“1高3低”“1高1中2低”“1高2中1低”的状态,低协同为“4低”“1中3低”“2中2低”“3中1低”的状态。可以看出,要实现低协同向强权衡的关系转变并不难,只需将低协同中的“1中”或“1低”转变为“1高”即可实现,而且在调整的过程中最好是将要提升的生态服务类型与所处生态区定位的主导功能保持一致,这样既实现了生态系统服务关系从低协同到强权衡的转变,又与当地的生态功能区定位吻合,实现另一种意义上的“双赢”。
本文以河北省生态系统服务为案例,分析了河北省五大生态功能区服务功能的权衡/协同关系,提出了“强权衡关系与生态功能区主导功能一致即为生态系统阶段性管理目标实现”的观点,并指出了低协同关系如何向强权衡关系转变的建议。依据本文生态系统服务权衡/协同关系的结果和存在问题,针对不同生态功能区的未来发展提出以下建议:① 燕山太行山生态涵养区虽然目前已体现了其碳储存、水源涵养和土壤保持的主导功能,但是燕山地区的森林以人工纯林为主,应逐步向混交林转变,促使其向着更加健康稳定的混交异龄复层林发展,发挥更大的生态涵养功能;② 低平原生态修复区目前以粮食生产服务为主导,在未来保障粮食产量的基础上,应更加注重降低农业面源污染,加大精准施肥、精准灌溉力度,提供更多有机、绿色的粮食;③ 环京津生态过渡带目前也是以粮食生产服务为主导,未来应在雄安新区“千年秀林”、白洋淀生态保护修复工程等工作的基础上,进一步提升该地区森林、水域的生态容量,为京津冀城市发展提供生态空间保障;④ 坝上高原生态防护区目前以水源涵养能力为主导的地区面积占近60%,未来应继续加强对该地区重要水源涵养区的保护与修复,处理好草地保护与放牧的关系,进一步提升该地区涵养水源和防风固沙的能力;⑤ 沿海生态防护区目前是以粮食生产服务为主,生态防护能力不足,未来应加强海岸带环境保护与修复,而且要建设海洋牧场、充实“蓝色粮仓”,增强“向海洋要食物”的能力。
本文以河北省2017年数据为例,基于空间叠置分析法进行了生态系统服务权衡/协同关系分析,并针对不同生态功能区的未来发展提出了建议,但也存在以下不足:首先,本文只以一年的数据研究了河北省不同生态功能区生态系统服务权衡/协同关系的现状,未来可应用空间叠置法通过多年连续数据从时间、空间二维角度深入探讨生态系统服务权衡/协同关系的变化。其次,本文选择的生态系统服务项目较少,选择了该地区4种典型生态系统服务,若再增加几项,生态系统服务权衡/协同关系可能会有不同的结果,需要未来更深入的探讨。最后,关于生态系统服务权衡/协同关系空间变异的影响机制分析本文未做探讨,这也是目前该研究方向亟需深入的问题和难点[20,58]。其成为难点的原因主要是因为生态系统服务权衡/协同指标没有进行很好的数值量化,虽然也有研究通过冗余分析[59-60]、地理探测器[61]等方法来分析,同时以相关系数或均方根误差来量化的生态系统服务权衡/协同关系的形成机理,但是生态系统服务权衡/协同关系的方向和强度还受到关系变化的速率、显著性等综合的影响,单独进行相关系数或均方根误差并不能真正揭示生态系统服务权衡/协同关系变化的内在机理。空间叠置法也存在类似的问题,在该方法中生态系统服务权衡/协同的关系是进行的等级划分,权衡和协同并没有统一的量化强度,所以目前也很难进行其空间异质性的机理探讨。因此,目前生态系统服务权衡/协同关系的结果主要用于评价和建议,很难找到普适性的机理解释,未来需要再优化指标和方法来进行生态系统服务权衡/协同关系的机理探索。
4.2 结论
本文以河北省生态系统服务为研究对象,评估了2017年河北省粮食生产、碳储存、土壤保持、水源涵养四大服务功能的总量及空间格局,通过空间叠置法分析了不同生态功能区生态系统服务的权衡/协同关系,主要结论如下:
(1)河北省不同生态系统服务之间以强权衡和低协同关系为主,强权衡和低协同的面积占比分别达到48.15%和45.92%,其次为弱权衡(5.09%)和高协同(0.83%)。
(2)强权衡关系是一种既能发挥生态系统主要功能,又易于实现的生态系统服务关系。河北省的强权衡关系生态系统的主导功能与其所处生态区功能定位基本一致,河北省生态功能区划分体现了国家生态功能区划的主导功能原则。
(3)低协同区的生态系统服务可通过将其与所处生态区定位的主导功能服务类型由低或中等级提升至高等级,实现生态系统服务关系从低协同到强权衡的转变,从而更好地服务于生态功能区的定位。
参考文献
The value of the world's ecosystem services and natural capital
DOI:10.1038/387253a0 [本文引用: 2]
Improvements in ecosystem services from investments in natural capital
DOI:10.1126/science.aaf2295
PMID:27313045
[本文引用: 2]

In response to ecosystem degradation from rapid economic development, China began investing heavily in protecting and restoring natural capital starting in 2000. We report on China's first national ecosystem assessment (2000-2010), designed to quantify and help manage change in ecosystem services, including food production, carbon sequestration, soil retention, sandstorm prevention, water retention, flood mitigation, and provision of habitat for biodiversity. Overall, ecosystem services improved from 2000 to 2010, apart from habitat provision. China's national conservation policies contributed significantly to the increases in those ecosystem services. Copyright © 2016, American Association for the Advancement of Science.
Understanding relationships among multiple ecosystem services
DOI:10.1111/j.1461-0248.2009.01387.x
PMID:19845725
[本文引用: 1]
Ecosystem management that attempts to maximize the production of one ecosystem service often results in substantial declines in the provision of other ecosystem services. For this reason, recent studies have called for increased attention to development of a theoretical understanding behind the relationships among ecosystem services. Here, we review the literature on ecosystem services and propose a typology of relationships between ecosystem services based on the role of drivers and the interactions between services. We use this typology to develop three propositions to help drive ecological science towards a better understanding of the relationships among multiple ecosystem services. Research which aims to understand the relationships among multiple ecosystem services and the mechanisms behind these relationships will improve our ability to sustainably manage landscapes to provide multiple ecosystem services.
Ecosystem service bundles for analyzing tradeoffs in diverse landscapes
Modeling multiple ecosystem services, biodiversity conservation, commodity production, and tradeoffs at landscape scales
DOI:10.1890/080023
URL
[本文引用: 1]
Nature provides a wide range of benefits to people. There is increasing consensus about the importance of incorporating these “ecosystem services” into resource management decisions, but quantifying the levels and values of these services has proven difficult. We use a spatially explicit modeling tool, Integrated Valuation of Ecosystem Services and Tradeoffs (InVEST), to predict changes in ecosystem services, biodiversity conservation, and commodity production levels. We apply InVEST to stakeholder‐defined scenarios of land‐use/land‐cover change in the Willamette Basin, Oregon. We found that scenarios that received high scores for a variety of ecosystem services also had high scores for biodiversity, suggesting there is little tradeoff between biodiversity conservation and ecosystem services. Scenarios involving more development had higher commodity production values, but lower levels of biodiversity conservation and ecosystem services. However, including payments for carbon sequestration alleviates this tradeoff. Quantifying ecosystem services in a spatially explicit manner, and analyzing tradeoffs between them, can help to make natural resource decisions more effective, efficient, and defensible.
When we cannot have it all: Ecosystem services trade-offs in the context of spatial planning
DOI:10.1016/j.ecoser.2017.10.011 URL [本文引用: 2]
Trade-offs across space, time, and ecosystem services
Creating win-wins from trade-offs? Ecosystem services for human well-being: A meta-analysis of ecosystem service trade-offs and synergies in the real world
DOI:10.1016/j.gloenvcha.2014.07.005 URL [本文引用: 1]
Progress and perspective on ecosystem services trade-offs
DOI:10.11867/j.issn.1001-8166.2015.11.1250
[本文引用: 1]
Trade-offs and synergies -widely exist among ecosystem services, which is the core of ecology, geography and resources sciences. Deepening the understandings of the spatial characteristics, driving mechanism, and scale effects of trade-offs and synergies will no doubt shed light on human well-being and the “win-win” policy of environment and human. This paper identified the norms related to trade-offs and synergies of eco-services, and then clarified the theoretical foundation of this topic was clarified. Following that, the driving mechanism and scale effects of trade-offs and synergies of eco-services were investigated. Finally, we proposed future direction and questions for research work, including improving classification and assessment method on ecosystem services, expanding quantitative approaches on trade-offs and synergies of eco-system, and policy oriented ideology to sustainable development of environment and human.
生态系统服务权衡/协同研究进展与趋势展望
DOI:10.11867/j.issn.1001-8166.2015.11.1250
[本文引用: 1]
生态系统服务之间存在的此消彼长的权衡或彼此增益的协同关系,是生态系统服务管理研究的重要内容。科学理解生态系统服务权衡/协同的作用特征、表现形式、驱动机制和尺度效应,对于提升人类福祉和实现人类社会和生态系统的“双赢”有重要意义,也是当前生态经济学、环境经济学、地理学等众多学科的研究热点和前沿。在综合分析国内外相关文献的基础上,总结了生态系统服务权衡/协同研究的理论基础,评述了生态系统服务权衡/协同表现形式、驱动机制和尺度效应的国内外研究进展和不足,并进一步探讨和展望了未来生态系统服务权衡/协同研究的重要内容,包括生态系统服务分类和评估优化,服务之间相互作用的量化模型、与自然—人文复合系统之间的反馈机制和尺度效应。
Temporal variation and spatial scale dependency of ecosystem service interactions: A case study on the central Loess Plateau of China
DOI:10.1007/s10980-017-0497-8 URL [本文引用: 2]
Temporal variation and spatial scale dependency of the trade-offs and synergies among multiple ecosystem services in the Taihu Lake Basin of China
DOI:10.1016/j.scitotenv.2018.09.135 URL [本文引用: 1]
Relationships of multiple landscape services and their influencing factors on the Qinghai-Tibet Plateau
DOI:10.1007/s10980-020-01140-3 [本文引用: 2]
Spatial-temporal heterogeneity of ecosystem service interactions and their social-ecological drivers: Implications for spatial planning and management
Spatially explicit quantification of the interactions among ecosystem services
DOI:10.1007/s10980-017-0527-6 URL [本文引用: 1]
Landscape functional zoning at a county level based on ecosystem services bundle: Methods comparison and management indication
Ecological function zoning of Nansi Lake Basin in China based on ecosystem service bundles
DOI:10.1007/s11356-023-27723-6 [本文引用: 1]
Trade-offs and synergy between ecosystem services in national barrier zone
DOI:10.11821/dlyj020180578
[本文引用: 1]
The better understanding of the trade-off and synergy relationship between different services is the foundation for the sustainable management of decision-making of various ecosystem services. In 2018, the national key special project titled as “Typical fragile ecological restoration and protection research” clearly pointed out that it was necessary to optimize the ecosystem services pattern of “Two ecological barriers and three shelters”, and the optimization of services is inseparable from the accurate understanding of trade-offs and synergies. Therefore, it is important and urgent to carry out trade-offs and synergies research in National Barrier Zone ecosystem services on a national scale. In this paper, the RUSLE model, CASA model and InVEST water yield model were used to evaluate the spatial distribution pattern of soil conservation, carbon sequestration and water yield services in the National Barrier Zone during 2000-2015, and to analyze the trends of the three ecosystem services. Correlation analysis and root mean square deviation were used to quantify the trade-offs and synergies between different services in the overall aspect and spatial aspect of each sub-barrier zone. The conclusions are as follows: (1) The spatial pattern of three ecosystem services of National Barrier Zone decreased from southeast to northwest and temporally, soil retention and water yield increased significantly with slope of 20.64 t/ (km 2·a) and 4.13 mm/a, respectively. Carbon sequestration showed a slight upward trend (p=0.96). The promotion of services is significantly helpful to the protection of national ecological security. (2) The correlation coefficient among soil retention, carbon sequestration and water production was greater than 0, indicating that the three ecosystem services were synergistic in all sub-barrier zones. Spatially, there is a strong heterogeneity between the trade-offs and synergies, and it is found that the pixel ratio of trade-off between carbon sequestration and water production is 49%, while that between carbon sequestration and soil retention is 27% in the forest barrier of Northeast China. Therefore, it is highly recommended to consider the differences of services in the trade-off relationship among all the sub-barrier zones and spatial areas to make the policy for the construction of sustainable ecological environment.
国家屏障区生态系统服务权衡与协同
DOI:10.11821/dlyj020180578
[本文引用: 1]
对不同服务间存在的此消彼长的权衡关系和相互增益的协同关系的正确认知,是开展多种生态系统服务可持续管理决策的前提。2018年国家重点专项“典型脆弱生态修复与保护研究”中明确指出要优化“两屏三带”生态系统服务格局,而服务的优化离不开对权衡与协同关系的准确认知。因此,在国家尺度上开展国家屏障区生态系统服务权衡与协同研究具有重要性和迫切性。本文采用RUSLE模型、CASA模型和InVEST产水模型分别评估国家屏障区2000—2015年土壤保持、固碳和产水服务的空间分布格局,并分析三种服务的变化趋势,采用相关分析法和均方根偏差法量化不同服务在各子屏障带整体和空间上的权衡与协同关系。结论如下:① 国家屏障区的三项服务在空间上均呈现由东南向西北减少的格局, 而在时间上,土壤保持与产水显著增加(p2</sup>·a)和4.13mm/a,而固碳呈现微弱的上升趋势(p=0.96),服务的提升有利于保障国家生态安全。② 在各子屏障带整体上,土壤保持、固碳及产水间相关系数基本大于0(p
Spatio-temporal characteristic of terrestrial ecosystem services and their trade-offs and synergies in China from 2000 to 2018 based on a process model
基于过程模型的2000—2018年中国陆地生态系统服务时空动态及其权衡与协同分析
Multi-scale analysis of trade-off/synergy effects of forest ecosystem services in the Funiu Mountain Region
DOI:10.11821/dlxb202005007
[本文引用: 4]
Forest ecosystem service trade-offs and synergies are important research topics for several disciplines. The multi-scale analysis of service trade-offs and synergies assists in the implementation of more effective forest resource management. Based on multi-source data including forest distribution, topography, NDVI, meteorology and soil conditions, key forest ecosystem services, including total forest volume, carbon storage, water yield, soil retention and habitat quality were mapped and evaluated for the Funiu Mountain Region through integrated deployment of the CASA model, the InVEST3.2 model and the ArcGIS10.2 software. The characteristics of trade-offs and synergies among different ecosystem services were then mapped and considered across multiple spatial scales (i.e., by region, north and south slopes, vertical belt) using the spatial overlay analysis method. The main results are as follows: (1) Mean forest volume is 49.26 m 3/hm 2, carbon density is 156.94 t/hm 2, water supply depth is 494.46 mm, the unit amount of soil retention is 955.4 t/hm 2, and the habitat quality index is 0.79. (2) The area of forests with good synergy is 28.79%, and the area of forests with poor synergy is 10.15%, while about 61.06% of forests show severe trade-offs and weak trade-offs. The overall benefits of forest ecosystem services in the study area are still low. In the future, bad synergy and severe trade-off areas should be the focus of forest resource management and efficiency regulation. (3) Synergy between ecosystem services is better for forest on south slope than that on north slope. Deciduous broad-leaved forest belt at moderate elevations on south slope in the mountains (SIII) has the highest synergies, while that at low elevations on north slope (NI) exhibits the lowest synergy levels.
伏牛山地区森林生态系统服务权衡/协同效应多尺度分析
DOI:10.11821/dlxb202005007
[本文引用: 4]
森林生态系统服务权衡与协同研究已成为当前相关学科的研究热点和前沿,对服务权衡与协同关系的多尺度分析有助于更加有效地实施森林资源管理。综合森林类型图、NDVI、气象和土壤等多源数据,借助CASA模型、InVEST 3.2模型和ArcGIS 10.2软件,开展伏牛山地区森林生态系统服务评估,运用空间叠置方法从多个空间尺度(区域、南北坡、垂直带)探讨服务权衡与协同效应。结果表明:① 研究区森林生态系统平均蓄积量为49.26 m <sup>3</sup>/hm <sup>2</sup>,碳密度为156.94 t/hm <sup>2</sup>,供水深度为494.46 mm,土壤保持量为955.4 t/hm <sup>2</sup>,生境质量指数为0.79。② 区域尺度上,28.79%的森林服务之间存在高协同效应,10.15%的森林存在低协同效应,61.06%的森林存在强权衡和弱权衡效应。③ 南北坡尺度上,南坡服务之间的协同关系优于北坡。垂直带尺度上,南坡中山落叶阔叶林带(SIII)服务之间协同关系最好,北坡低山落叶阔叶林带(NI)协同关系最差。
Gradient effects of ecosystem services trade-off relationships in the Daning River Basin
大宁河流域生态系统服务权衡关系梯度效应
Temporal and spatial variation of ecosystem service value and its trade-offs and synergies in the peripheral region of the Poyang Lake
DOI:10.13249/j.cnki.sgs.2022.07.010
[本文引用: 1]
It is of great significance to study the temporal and spatial variation characteristics of ecosystem services value (ESV) and the trade-offs and synergies among various services to realize the coordinated development of regional ecology and economy. Based on the revised equivalent factor table and combined with the land use data of 7 periods from 1988 to 2020, the study of spatio-temporal evolution characteristics of ecosystem services value (ESV) in the peripheral region of the Poyang Lake is explored by data processing and spatial analysis of GIS technology. At the same time, the ecosystem service trade-offs and synergies model is introduced to analyze the trade-offs and synergies of seven ecosystem service functions. The results show that: 1) From 1988 to 2020, the ecosystem service value in the peripheral region of the Poyang Lake increased from 57.79 billion yuan to 59.25 billion yuan, showing the fluctuation characteristics of first increasing, then decreasing and then increasing. During the whole study period, ESV of water area is the largest, followed by woodland and arable land. The main contributing factors of ESV change are water area, grassland and woodland. From the perspective of single ecological service value, the regulation service value is the largest during the study period, accounting for more than 77% of the total ESV. 2) The spatial distribution characteristics of ecosystem service value in the study area are closely related to land use types. In recent 32 years, the spatial distribution of ecological service value in the study area has shown obvious imbalance. The area with the highest ecological service value is the area with abundant water resources, and the area with the lowest ecological service value is the contiguous area with concentrated construction land. ESV significantly decreased in areas with the greatest intensity of construction land expansion, including Nanchang urban area, Jiujiang urban area, and urban built-up areas of other districts and counties. The areas with increased ESV are evenly distributed in the northeast and northwest of the study area, as well as the southeast and southwest near the outside of the study area. 3) In the study period, the synergistic relationship is the dominant relationship among ecosystem services, while the number of the trade-off’s relationship is small and mainly existed between food production and other services. The results indicate that there is conflict between food production and environmental protection, and there is competition between cultivated land and other land use patterns in the study area. During 1988-1999 and 1999-2009, the other six ecosystem services showed synergistic relationship except for food production service. From 2009 to 2020, the degree and direction of interaction among ecosystem services have changed, and the maximum value of trade-offs and synergies have increased. The trade-offs and synergies between ecosystem services has a profound impact on the balanced development of regional ecological environment protection and economy. Moreover, trade-offs and synergies play an important role in coordinating multiple goals, maximizing human well-being and supporting the sustainable use of social-ecosystems. The research results can provide reference information for promoting the coordinated development of ecological environment protection and economy in the peripheral region of Poyang Lake.
鄱阳湖环湖区生态系统服务价值时空变化及权衡协同关系
DOI:10.13249/j.cnki.sgs.2022.07.010
[本文引用: 1]
基于修订的当量因子表,结合1988—2020年7期土地利用数据,运用GIS数据处理和空间分析等方法探究了鄱阳湖环湖区生态系统服务价值的时空演变特征,同时引入生态系统服务权衡协同度模型对食物生产、水文调节、土壤保持等7项生态服务功能进行权衡与协同分析。结果表明:① 1988—2020年鄱阳湖环湖区生态系统服务价值从577.95亿元增至592.50亿元,呈先增后减再增的波动变化特征。② 生态系统服务价值的空间分布表现为明显的不均衡性,ESV显著减少的区域为南昌市区、九江市区以及其它各区县的城镇建成区,生态系统服务价值增加的区域均匀分布在研究区东北和西北地区以及靠近研究区外侧的东南和西南地区。③ 协同关系为生态系统服务之间的主导关系,权衡关系较少且主要存在于食物生产与其他服务之间。
Spatiotemporal variation of essential ecosystem services and their trade-off/synergy along with rapid urbanization in the Lower Pearl River Basin, China
Spatio-temporal quantification of the trade-offs and synergies among ecosystem services based on grid-cells: A case study of Guanzhong Basin, NW China
DOI:10.1016/j.ecolind.2018.06.069 URL [本文引用: 1]
Exploring spatial correlations between ecosystem services and sustainable development goals: A regional‑scale study from China
DOI:10.1007/s10980-022-01542-5 [本文引用: 1]
Spatio-temporal evolution and optimization regionalization of trade-off and synergy of land use functions in ecologically fragile and poverty areas: A case study of Zhangjiakou city
生态脆弱贫困区土地利用多功能权衡/协同格局演变与优化分区: 以张家口市为例
Grain productivity potential of cultivated land and yield gap analysis in China
中国耕地粮食生产能力及产量差测算
Space difference research of the grain production in Hebei province
DOI:10.11849/zrzyxb.2010.09.012
[本文引用: 1]
In order to reveal the spatial distribution pattern of food production in Hebei Province, and formulate regional development of food safety policy suitable to local conditions, this paper using the Exploratory Spatial Data Analysis (ESDA) combined with GIS spatial analytical technology and structured spatial adjacent matrix, analyzed spatio-temporal changes and regulations in grain production of 138 counties in Hebei Province of China from 1986 to 2006. Research showed that grain production presented aggregated global spatial patterns at provincial level with an average Moran’s <em>I</em> index of 0.346. Grain yield shows significant local spatial clustering pattern, distributing mainly in the Tangshan-Shijiazhuang piedmont high-yield area (HH) and the Zhangjiakou-Bashang Plateau and Chengde low-producing areas (LL). Counties fell into the quadrant of the HH and LL accounted for 55.07%, 66.67% and 71.74% of the total sample size in 1986, 1996 and 2006, respectively. Grain production has a strong spatial correlation, a significant pattern of local clustering, and aggregation in the study phase, as well as continuous enhancement in the local context in Hebei Province; but it also reflects the spatial heterogeneity in distribution of grain yield, showing the local distribution pattern of discrete and the weakening degree of dispersion. The study also revealed, through the average center model, the focus of grain production has shifted 42.7 km to the north-southwest direction in the region. The dialectical relationship between economic development and intensive land use is the main reason for the focus transfer of rain production. Grain production in Hebei Province is divided into climate yield and economic yield, correlation analysis showed that input factors affecting grain production from 1986 to 2006 are diversified. The main factors which affected food production are the effective irrigated area, fertilizer application rate, the total power of farm machinery, grain sown area and so on. Finally, policies and measures of regional food safety were proposed, based on space difference research of the grain production.
河北省粮食产量空间格局差异变化研究
DOI:10.11849/zrzyxb.2010.09.012
[本文引用: 1]
为揭示河北省粮食产量空间格局分布特征,因地制宜地制定区域粮食安全生产政策,论文运用ESDA空间相关分析理论结合GIS技术,分析了1986—2006年河北省138个县的粮食产量空间差异变化规律、特征和成因,并提出相应的粮食安全生产政策与措施。研究结果表明:研究期内省域范围内粮食产量Moran’s I指数的平均值为0.346,存在较强的空间聚集格局;粮食产量局部空间集聚显著区主要分布在唐山—石家庄山前平原区高产区(HH)和张家口—承德坝上高原低产区(LL),1986年、1996年、2006年落入HH和LL象限的县分别占总样本数的55.07%、66.67%和71.74%,粮食产量空间集聚效果显著;20 a内粮食产量重心由北向西南方向转移42.7 km;粮食产量的主要影响因素为有效灌溉面积、化肥施用量、农业机械总动力、粮食播种面积等。
Progress and trends of land spatial regulation, unbalanced development and spatial externalities
国土空间管制、土地非均衡发展与外部性研究: 回顾与展望
Carbon sequestration in China's terrestrial ecosystems under climate change: Progress on ecosystem carbon sequestration from the CAS Strategic Priority Research Program
中国陆地生态系统固碳效应: 中国科学院战略性先导科技专项“应对气候变化的碳收支认证及相关问题”之生态系统固碳任务群研究进展
A study on water resources carrying capacity in Jingjinji region
DOI:10.11849/zrzyxb.2006.05.002
[本文引用: 1]
China is one of the countries facing the most serious water shortage crisis.In recent years,the water problem has become more and more projecting,especially for urban area where water shortage has been a common problem-water demand is mounting up rapidly due to population burgeon and improvement of living people's standards.The serious dearth of water has turned out to be a bottleneck in the region's social and economic development,which makes the research on water resource more pressing.In this paper,we mainly study the water resources carrying capacity(WRCC),as the groundwork of the study of water resources security stratagem,which plays an important role in the harmonious development of regional water-ecology-socio-economy complex system.Jingjinji region located in the Haihe River valley is chosen as a typical area to study the water shortage problem.This region includes Beijing,Tianjin and eight cities in Heibei province:Shijiazhuang,Tangshan,Qinhuangdao,Baoding,Zhangjiakou,Chengde,Cangzhou and Langfang,which is around Greater Beijing Economic Hub and is the core area of the Bohai Bay Trade Hub.Mean while it is severely short of water resources,the average water resources of which is only 370×108m3,1.3% less than the national average level,but it carries about 10% of the national population,food and GDP. A model of water resources is developed for analyzing the carrying capacity of water resources in different years in this region.The model for calculating WRCC is established by taking the "population capacity capacity" as its synthetic index and using the system optimizati-on method.And a formula of load factors is also used to compute the potential of water resources in different areas. The final results indicate that:1)There are still 684×108m3 of potential water resources which come from rain and flood in the region,and could be exploited.2)In the years of normal precipitation(p=50%),according to the "having enough to eat and wear" life standard,the population that water resources can carry is larger than that of nowadays;while,if according to the "better-off"life standard,the water resources cannot support today's population.3)In drought years,in developed area,the population can be carried by lowering the living standard,however,in underdeveloped areas,when having a long-term drought,the population cannot be supported.4)Although the water carrying capacity of Jingjinji region may be improved after completing the South to North Water Transfer Project,the living standard might not be improved,for it can be offset by the increasing population.So,the rudimentary method for solving the problem of water scarcity is stringent population control.
京津冀地区水资源供需平衡及其水资源承载力
Evaluation of water resources carrying capacity in the Beijing-Tianjin-Hebei region based on quantity-quality-water bodies-flow
DOI:10.18402/resci.2020.02.14
[本文引用: 1]
The Beijing-Tianjin-Hebei Region has low per capita water resources, high water use pressure, and prominent water resources problems. Therefore, it is urgent to carry out a comprehensive evaluation of water resources carrying capacity in this area in order to provide some theoretical basis and practical experience for the comprehensive planning and efficient utilization of water resources, regional sustainable development, and so on. This study first analyzed the background of water resources utilization in the Beijing-Tianjin-Hebei Region and the water resources problems faced by the region; second, based on the analysis of water resources system, a comprehensive evaluation index system of water resources carrying capacity in the region based on quantity-quality-water bodies-flow was established; finally, the analytic hierarchy process (AHP) and entropy weight methods were used to combine subjective and objective weights of evaluation indices, and the TOPSIS evaluation model was used to calculate the comprehensive score of water resources carrying capacity. The results show that: (1) The overall lack of water resources, the over-exploitation and utilization of water resources, and the continuous overexploitation of groundwater in the Beijing-Tianjin-Hebei Region have resulted in the loss of water ecological functions and the formation of concentrated and connected groundwater funnel areas; (2) The comprehensive evaluation scores of water resources carrying capacity in 2006-2016 show a fluctuating growth trend, indicating that the carrying capacity of water resources has been strengthened, but the total score is generally low and the pressure on water resources is grim. Based on this situation, the Beijing-Tianjin-Hebei Region urgently needs to build regional and watershed water resources linkage mechanisms, and take the Beijing-Tianjin-Hebei collaborative development policy as an opportunity. According to the conditions and position in the regional development plan of different cities, urban development and industrial production should consider water resources endowments, implement the most stringent regulations on water resources management, and finally achieve the improvement of regional water resources carrying capacity.
基于量—质—域—流的京津冀水资源承载力综合评价
DOI:10.18402/resci.2020.02.14
[本文引用: 1]
京津冀地区人均水资源占有量低,用水压力大,水资源问题突出,因此亟需对该地区进行水资源承载力综合评价研究,以期为水资源综合规划与高效利用、区域可持续发展等提供一定的理论基础与实践经验。为此,首先对京津冀水资源利用情况进行分析,提出了京津冀水资源所面临的问题,以问题为导向;其次对水资源承载系统进行解析,构建基于量-质-域-流内涵的京津冀水资源承载力综合评价指标体系;最后利用AHP、熵权法对评价指标进行主客观组合赋权,借助TOPSIS评价模型对水资源承载力进行综合得分计算。结果表明:①京津冀地区水资源总量匮乏,水资源过度开发利用,地下水持续超采等已经导致该地区水生态功能退化,形成了集中连片的地下水漏斗区等;②通过对研究区水资源承载力评价计算,2006—2016年京津冀水资源承载力综合评价得分总体上呈现波动式增长态势,表明水资源承载力有所增强,但整体分值不高,水资源压力形势依然严峻。基于此,京津冀亟需构建区域、流域水资源联动机制,以京津冀协同发展为契机,针对不同地区的发展基础与城市定位,遵循“以水量城”的城镇化政策和“以水定产”的产业政策,深入贯彻最严格的水资源管理条例,实现整个区域水资源承载力的提升。
Key research issues of soil erosion and conservation in China
DOI:10.5958/2455-7145.2019.00001.8 URL [本文引用: 2]
土壤侵蚀与水土保持科学重点研究领域与问题
Spatial characteristics and effects of soil conservation service in Sichuan province
四川省生态系统土壤保持功能空间特征及其影响因素
Tradeoffs and synergies between ecosystem services in Ordos city
DOI:10.18306/dlkxjz.2017.12.012
[本文引用: 1]
The city of Ordos is in the central part of the ecotone between agriculture and animal husbandry in northern China, and the rapid economic development brings great pressure to the ecological environment. Ecosystem services and their inter-related changes in Ordos have great significance for the sustainable development of ecosystems in this semi-arid area. This study calculated the four key ecosystem services of food supply, carbon storage, water production, and soil conservation in Ordos in 2000 and 2010, and used the relevant analysis to explore the tradeoffs and synergies between the four services at the 30 m × 30 m grid scale and introduced the rose map. The relationship between the ecosystem services of different land-use types was analyzed. The results show that there is a synergistic relationship between water production and soil conservation, a synergistic relationship between food supply and soil conservation, a tradeoff relationship between soil conservation and food supply, and a tradeoff relationship between food supply and carbon storage. The eastern agricultural area of Ordos contains most of the hotspots of multiple ecosystem services. The production of water reduced as soil conservation and carbon storage improved in cultivated land and woodland, while in the grassland the four ecosystem services increased simultaneously.
鄂尔多斯市生态系统服务权衡与协同分析
DOI:10.18306/dlkxjz.2017.12.012
[本文引用: 1]
鄂尔多斯市是中国北方农牧交错带的中心,经济快速发展的同时带来生态环境巨大的压力,该区域生态系统服务及其相互关联的变化对半干旱地区的可持续发展具有重要意义。本文基于2000、2010年鄂尔多斯市的食物供给、碳储存、产水量以及土壤保持4种关键生态系统服务供给核算,采用相关分析探究栅格尺度上4种服务之间的权衡与协同关系,并引入玫瑰图对比不同土地利用类型的生态系统服务关联特征差异。研究结果表明:①2000-2010年鄂尔多斯市生态系统服务整体增强,平均食物供给量由99.5 kg·hm<sup>-2</sup>增至224.2 kg·hm<sup>-2</sup>,碳储存量由8.32 t·hm<sup>-2</sup>增至8.41 t·hm<sup>-2</sup>,平均产水量由153.64 mm增至291.90 mm,土壤保持量平均值由47.79 kg·hm<sup>-2</sup>增至59.04 t·hm<sup>-2</sup>;②产水与土壤保持之间存在协同关系(相关系数分别为0.972和0.771),食物供给与土壤保持之间存在协同关系(相关系数分别为0.505、0.736),食物供给和碳储存之间存在权衡关系(相关系数分别为-0.584、-0.512);③多重生态系统服务供给的热点区主要分布在鄂尔多斯市东部;④产水量和土壤保持、碳储存在耕地和林地中呈现此消彼长的变化方式,而在草地中4种生态系统服务同时增加。
Assessment of ecosystem food production and its spatiotemporal heterogeneity in the Bailong River Watershed, Gansu
甘肃白龙江流域生态系统粮食生产服务价值时空分异
Predicting soil erosion by water:A guide to conservation planning with the Revised Universal Soil Loss Equation (RUSLE)
The spatial distribution characteristics and eco-economic value of soil conservation service of ecosystems in Hainan Island by GIS
海南岛生态系统土壤保持空间分布特征及生态经济价值评估
Soil erosion estimation of Bhandara region of Maharashtra, India, by integrated use of RUSLE, remote sensing, and GIS
DOI:10.1007/s11069-021-04974-5 [本文引用: 1]
Use of CERN for estimating the soil conservation capability of typical forest ecosystems in China
基于中国生态系统研究网络的典型森林生态系统土壤保持功能分析
Slope length and stepness factor dataset of Pan-Third Pole 20 countries (2020, with a resolution of 7.5 arcsecond). Beijing: National Tibetan Plateau/Third Pole Environment Data Center, 2021
泛第三极(20国)坡度坡长因子数据集(2020年, 7.5弧秒分辨率)
The erosion-productivity impact calculator (EPIC) model: A case history
DOI:10.1098/rstb.1990.0184
URL
[本文引用: 1]
\n Beginning in 1981, a mathematical model called the erosion-productivity impact calculator model (epic) was developed to determine the relation between soil erosion and soil productivity throughout the U.S.A. By 1985 the model was ready for use in the RCA (1977 Soil and Water Resources Conservation Act) analysis. Between 15000 and 20000 epic simulations of 100 years each were performed as part of the 1985 RCA analysis. After the RCA analysis, model refinement and development continued and epic has been applied to a number of agricultural management problems. For example, epic is capable of dealing with decisions involving drainage, irrigation, water yield, erosion (wind and water), weather, fertilizer and lime application, pest control, planting dates, tillage, and crop residue management. Example applications include: (i) 1988 drought assessment; (ii) soil loss tolerance tool; (iii) Australian sugarcane model (\n AUSCANE\n ) ; (iv) pine tree growth simulator; (v) global climate change analysis, and (vi) farm level planning.\n
Forest ecosystem services and their valuation in China
DOI:10.11849/zrzyxb.2004.04.010
[本文引用: 1]
Forest ecosystem plays a special role in maintaining the structure,function and ecologi-cal process of natural ecosystems.At present,a series of ecological problems are becoming more and more serious because of forest damage in some regions.The accurate valuation of forest ecosystem services is very important to the reserve and rational development of forest resources in China.Forest ecosystem services are divided into four groups:provisioning services,regulating services,cultural services,and supporting services in this paper.On the basis of the service mechanism analyses,an index system for the assessment of forest ecosystem services has been established,which consists of 13 service indexes such as timber and other products,weather regulation,C fixation,water storage,erosion control,air quality purifying,nutrients cycle,windbreaks,cultural diversity,recreation and ecotourism,O2 release,and provisioning of habitat.Then,10 services of China forest have been assessed and evaluated by taking the year of 2000 as the base year.Including timber and other products provision,C fixation,water storage,erosion control,air quality purifying,nutrients cycle,recreation and ecotourism,O2 release,and provisioning of habitat.As a result,the economic values of these services are 2 325.14×108,1 626.76×108,2 134.7×108,136.46×108,41.85×108,372.37×108,194.31×108,6732.48×108,and 495.94×10⁸ yuan,respectively.The total value is estimated as 14 060.05×10⁸ yuan with indirect values being 11 540.60×10⁸ yuan,4.6 times that of the direct values.The results show that forest ecosystems provide huge indirect values to human being besides the direct value of goods,and that the indirect values are egually important as the direct values.The focuses of forest ecosystem services and their valuation in the future should be the service mechanism and the coupling and the application of different scales data.
中国森林生态系统服务功能及其价值评价
Maps with 1 km resolution reveal increases in above- and belowground forest biomass carbon pools in China over the past 20 years
DOI:10.5194/essd-15-897-2023
URL
[本文引用: 1]
. To quantify the ecological consequences of recent nationwide restoration\nefforts in China, spatially explicit information on forest biomass carbon\nstock changes over the past 20 years is critical. However, long-term biomass tracking at the national scale remains challenging as it requires continuous and high-resolution monitoring. Here, we characterize the changes in the above- and belowground biomass carbon (AGBC and BGBC) of forests in China between 2002 and 2021 at 1 km spatial resolution by integrating multiple types of remote sensing observations with intensive field measurements through regression and machine learning approaches. On average, 8.6 ± 0.6 and 2.2 ± 0.1 PgC were stored in above- and belowground live forests in China. Over the last 20 years, the total forest biomass carbon pool in China has increased at a rate of 114.5 ± 16.3 TgC yr−1 (approximately 1.1 % yr−1). The most pronounced forest biomass carbon stock gains occurred in central to southern China, including the southern Loess Plateau, Qinling mountains, southwestern karsts and southeastern forests. While the combined use of multi-source remote sensing data provides a powerful tool to assess the forest biomass carbon changes, future research is also needed to explore the drivers of the observed woody biomass trends and to evaluate the degree to which biomass gains will translate into biodiverse, healthy ecosystems that are sustainable. Annual forest above- and belowground biomass maps for China are now available at https://doi.org/10.6084/m9.figshare.21931161.v1 (Chen, 2023).\n
Spatial distributions of biomass and carbon density in natural grasslands of Hebei, China
DOI:10.17521/cjpe.2015.0300
[本文引用: 1]
<sec> <p id="C2"><b><i>Aims</i></b> Grassland is an important component of the global terrestrial ecosystem and plays a significant role in the global carbon cycle. Knowledge of the spatial distribution of biomass and carbon density and their constraining environmental factors in different types of grasslands is crucial for revealing the variations of grassland carbon pool and understanding the grassland ecosystem carbon sequestration in China. The objective of this study was to determine the spatial patterns of biomass and carbon density distribution in natural grasslands of Hebei Province, China.</p> </sec> <sec> <p id="C3"><b><i>Methods</i></b> The aboveground biomass, root biomass, litter mass, and their carbon densities were investigated in 390 grassland plots from 78 sites representative of six different types of natural grasslands based on vegetation, soil and climate from 2011 to 2013. The grassland types include temperate steppe, temperate meadow, temperate mountain meadow, low-land saline meadow, warm-temperate tussock and warm-temperate shrub tussock.</p> </sec> <sec> <p id="C4"><b><i>Important findings</i></b> There were significant differences (<i>p </i>< 0.05) in the total biomass among the six grassland types, with the highest value of 2770.2 g·m<sup>-2</sup> in the low-land saline meadow and lowest value of 747.6 g·m<sup>-2</sup> in the temperate steppe. The low-land saline meadow also had the highest value in the aboveground biomass (285.0 g·m<sup>-2</sup>), followed by the warm-temperate shrub tussock (235.1 g·m<sup>-2</sup>) and the temperate mountain meadow (203.1 g·m<sup>-2</sup>); the lowest value in aboveground biomass was found in the temperate steppe (110.6 g·m<sup>-2</sup>). The litter mass was largest in the lowland saline meadow (584.0 g·m<sup>-2</sup>), followed by the temperate mountain meadow (187.9 g·m<sup>-2</sup>) and the warm-temperate shrub tussock (91.0 g·m<sup>-2</sup>). The values of root biomass were 1.9-4.3 times greater than that of aboveground biomass across the six types of grasslands, resulting in average root:shoot ratio of 3.1. The root biomass was largest in the lowland saline meadow (1901.3 g·m<sup>-2</sup>), and smallest in the temperate steppe with only 1/3 of that in the former. In terms of carbon density, lowland saline meadow also displayed the largest values among all the types of grasslands. The values of carbon density in the aboveground vegetation, litter and root were respectively 132.7, 81.2, and 705.9 g C·m<sup>-2</sup>. In all grassland types, the biomass of aboveground vegetation and root, litter mass, and total biomass decreased initially and then increased with elevation (<i>p < </i>0.05). With the increasing accumulative temperatures >10 °C, the root biomass and the total biomass decreased initially and then increased (<i>p < </i>0.01). In this study, the warm-temperate shrub tussock mostly distributes in the rocky mountain area where the soil layer is very thin, leading to the lower biomass relatively to the temperate meadow. Therefore, climate, soil and geographical factors should be comprehensively considered when comparing the biomass among different grassland types in large area.</p> </sec>
河北省天然草地生物量和碳密度空间分布格局
DOI:10.17521/cjpe.2015.0300
[本文引用: 1]
分析不同草地类型生物量与碳密度空间分布特征及其影响因素, 揭示草地植物碳库的变化规律, 对于了解我国草地生态系统碳汇具有重要意义。2011-2013年以河北省天然草地为研究对象, 调查了不同草地类型的地上活体生物量、凋落物生物量和根系生物量以及各组分的碳密度。结果表明: 温性草原、温性草甸、温性山地草甸、低地盐化草甸、暖性草丛和暖性灌草丛6种草地类型的总生物量差异显著, 其中低地盐化草甸总生物量最高, 为2 770.2 g·m <sup>-2</sup>, 而温性草原最低, 为747.6 g·m <sup>-2</sup>, 前者约为后者的3.7倍; 地上活体生物量最大的是低地盐化草甸, 其次是暖性灌草丛和温性山地草甸, 最小的是温性草原, 分别为285.0、235.1、203.1和110.6 g·m <sup>-2</sup>; 凋落物生物量也是低地盐化草甸最大, 其次是温性山地草甸和温性草甸, 分别为584.0、187.9和91.0 g·m <sup>-2</sup>。6种草地类型的根系生物量均大于地上生物量, 是地上生物量的1.9-4.3倍, 不同草地类型根冠比的平均值为3.1; 低地盐化草甸的根系生物量最高, 为1901.3 g·m <sup>-2</sup>, 温性草原的根系生物量最低, 只有低地盐化草甸的1/3。在各类草地生物量碳密度方面, 低地盐化草甸的地上活体碳密度、凋落物碳密度与根系碳密度均为最大, 分别为132.7、81.2和705.9 g C·m <sup>-2</sup>。草地地上生物量、凋落物生物量和根系生物量以及总生物量均随海拔的升高先减少而后增加(p p
Stoichiometry characteristics of typical halophytes in Luanhe Estuary wetland
DOI:10.7525/j.issn.1673-5102.2018.06.020
[本文引用: 1]
Studying the stoichiometry of halophytes will be beneficial to restoration of the vegetation in the coastal wetlands. The research object were four typical halophytes in the luanhekou. The stoichiometric characteristics of C, N and P in different plants and different vegetative organs were analyzed. Results show that:Mean change range of carbon, nitrogen and phosphorus contents (212.40-291.38, 9.68-14.43 and 0.86-1.6 g·kg<sup>-1</sup>) were significant (<i>P</i><0.05),possibly indicating different nutrient utilization strategies. The order of C content of different vegetative organs was leaf > root > stem, indicating low photosynthetic rate and strong defense ability. C:N and C:P of <i>Aeluropus sinensis, Phragmites communis</i> and <i>Tamarix chinensis</i> Lour were slightly lower than the global average of 22.5 and 232. There was a significant positive correlation between N and P (<i>P</i><0.01). N is major restrictive factor for plants in the research area. There was a significant positive correlation between leaf N and leaf P, root N, root C,root P (<i>P</i><0.01); leaf P and root N, root P differed significantly (<i>P</i><0.01). There was a strong coordination between the root and the leaves of the vegetative organs to adapt to the salinization of the estuarine wetland.
滦河口典型盐生植物的生态化学计量特征研究
DOI:10.7525/j.issn.1673-5102.2018.06.020
[本文引用: 1]
滨海不同湿地植物碳氮磷化学计量特征的系统研究,能够为湿地植物组成分析及植被恢复方法制定提供数据支撑。选取滦河口滨海湿地的典型盐生植物獐毛、盐地碱蓬、芦苇和柽柳为研究对象,分析不同植物及不同营养器官中C、N、P的生态化学计量特征。研究结果表明:4种植物的碳、氮、磷含量存在明显的种间差异(P-1</sup>,显示植物对养分利用的策略存在差异性。不同营养器官碳含量均为叶 > 根 > 茎,表明研究区植物净光合强度低,增长速度慢,具有较强的防御能力。獐毛、芦苇、柽柳的C:N值和C:P值均略低于全球平均水平22.5和232,研究区域整体上植物营养元素利用效率较低。4种盐生植物N与P之间显著正相关(PPP<0.01),表明了植物营养器官根系和叶片在适应河口湿地盐碱环境具有较强的协调统一性,是盐生植物进行正常生长活动的有利保障。
Analyzing trade-offs, synergies, and drivers among timber production, carbon sequestration, and water yield in Pinus elliotii forests in southeastern USA
DOI:10.3390/f5061409 URL [本文引用: 2]
Identification of the trade-offs/synergies between rural landscape services in a spatially explicit way for sustainable rural development
Investigating tradeoffs between supply, use and demand of ecosystem services and their effective drivers for sustainable environmental management
Assessing synergies and trade-offs between ecosystem services in forest landscape management
Dynamics arising from the impact of large-scale afforestation on ecosystem services
DOI:10.1002/ldr.v33.16 URL [本文引用: 1]
Research progress on trade-offs and synergies of ecosystem services: An overview
DOI:10.5846/stxb URL [本文引用: 2]
生态系统服务竞争与协同研究进展
Research progress on ecosystem service trade-offs: From cognition to decision-making
DOI:10.11821/dlxb201706002
[本文引用: 1]
As a hot spot in geography, ecology and related disciplines, ecosystem services have been playing a vital role in bridging the human society with the ecosystem. A deep understanding of the relationship among ecosystem services is a critical enabling factor for sustainable management and decision-making in multiple ecosystem services, in turn realizing the dual goals of economic development and ecological protection and thus contributing to the overall wellbeing of human. Through a systematic review of the concept of ecosystem service trade-offs, this article explores their characteristics in terms of spatial scales, temporal scales and reversibility, considering human's wellbeing at different levels as the ultimate goal of ecosystem service trade-offs and ecological compensation as a baseline method of protection in trade-offs. Such ecosystem services trade-offs are expressed by quantitative indexing and integrated modelling. While such trade-offs and synergies among ecosystem services could present significant variations by spatial and temporal scales, scenario simulation and multi-objective analysis are effective ways to support decision-making in ecosystem service trade-offs. Based on these findings, the multi-scale correlation of ecosystem service trade-offs, the flow of ecosystem service based on telecoupling, and the consumption and compensation of ecosystem services are identified to be the main directions for future research on ecosystem service trade-offs.
生态系统服务权衡研究进展: 从认知到决策
DOI:10.11821/dlxb201706002
[本文引用: 1]
作为沟通自然生态系统与人类社会的重要桥梁,生态系统服务一直以来都是地理学、生态学等学科的研究前沿和热点。正确认知生态系统服务之间的关系,是开展多种生态系统服务可持续管理决策的前提,有助于人类福祉的全面提升。本文通过厘定生态系统服务权衡的概念内涵,梳理了生态系统服务权衡的空间、时间和可逆性特征,将多层次人类福祉的满足作为权衡的最终目标,视生态补偿为权衡决策的基本保障途径。生态系统服务权衡关系的识别依托于定量指标法和综合模型法,且权衡关系可能随时空尺度的推移发生改变;情景分析与多目标分析是生态系统服务权衡决策的有效手段。生态系统服务权衡多尺度关联、生态系统服务流与远程耦合、生态系统服务消费与生态补偿,成为当前生态系统服务权衡研究的重点方向。
The dynamic analysis of trade-off and synergy of ecosystem services in the Guanzhong Basin
DOI:10.11821/dlyj201703016
[本文引用: 2]
The Guanzhong Basin is the economic center of Northwest China. In recent years, with the development of the economy, many ecological environment problems have emerged in this region. Therefore, it is important to examine the dynamic changes of trade-off and synergy of ecosystem services in the Guanzhong Basin and explore their influencing factors. In this paper, many models are used to estimate the net primary production (NPP), soil retention and food supply in the basin from 2000 to 2012. And research is conducted on the spatial and temporal change of ecosystem services in different types of land covers by using Rose diagram. Then, we explored the trade-off and synergy among three ecosystem services by correlation diagram made by R software and analyzed its dynamic characteristics in the 13 years. At last, we analyzed the effect of the land cover change on the relationship of trade-off and synergy to explore its driving mechanism. The results indicate that: (1) The annual average NPP per unit area, the annual average value of soil retention per unit area and the annual average value of food supply per unit area were 1720.495 yuan/hm2, 768.889 yuan/hm2 and 167.874 yuan/hm2, respectively. From the perspective of space, the high value regions of NPP and soil retention were distributed over mountains and low value regions were over the central part of the basin. But the food supply presented the opposite pattern. From the perspective of time, three ecosystem services were increased in the 13 years. The annual average NPP per unit area, the annual average value of soil retention per unit area and the annual average value of food supply per unit area increased by 21%, 46.7% and 245.7%, respectively. (2) There were trade-off between NPP and food supply, soil retention and food supply. And there were synergy between NPP and soil retention. (3) On the whole, the trade-off of ecosystem services enhanced and the synergy weakened during the 13 years in the Guanzhong Basin. The degree of synergy between NPP and soil retention decreased. The degree of trade-off between NPP and food supply increased. And the trade-off relationship between soil retention and food supply remained stable during the 13 years. (4) From the perspective of land cover changes, the reduction of cultivated land and forest land is the main driving force of the change of relationship among ecosystem services. At the same time, it is significant to balance conflicts in land resource to use land resource better.
关中盆地生态系统服务的权衡与协同关系动态分析
DOI:10.11821/dlyj201703016
[本文引用: 2]
测算2000-2012年关中盆地的净初级生产力(NPP)价值量、土壤保持价值量和食物供给价值量,通过引入玫瑰图来研究不同土地利用类型中生态系统服务的时空差异,进而探究三种生态系统服务的权衡和协同关系,并分析其在近13年间的动态变化特征,最后研究土地利用变化对生态系统服务权衡和协同关系的影响来探究其驱动机制。结果表明:① 研究区NPP单位面积年均价值量约为1720.495 元/hm<sup>2</sup>,土壤保持单位面积年均价值量约为768.889元/hm<sup>2</sup>,食物供给单位面积年均价值量约为167.874元/hm<sup>2</sup>。从空间角度分析,NPP和土壤保持的高值区均分布在盆地边缘的山地,低值区集中于盆地中部,而食物供给呈相反格局。从时间角度分析,三种生态系统服务均呈现增加的趋势。2000-2012年,NPP单位面积价值量增幅为21%,土壤保持单位面积价值量增幅为46.7%,食物供给单位面积价值量增幅为245.7%。② NPP与土壤保持呈现协同关系,而NPP与食物供给、土壤保持与食物供给呈现权衡关系。③ 13年来关中盆地生态系统服务呈现冲突加强协同减弱的趋势。具体而言,NPP与土壤保持的协同关系表现出明显的下降趋势,NPP与食物供给的权衡关系逐渐增强,而土壤保持与食物供给的权衡关系在13年间基本保持稳定状态。④ 从土地利用变化的角度看,研究区生态系统服务权衡增加协同减少主要归因于耕地和林地的大量减少。同时,权衡土地资源利用中各类冲突对于土地资源的优化使用也有重大的意义。
Bringing ecosystem services into integrated water resources management
DOI:10.1016/j.jenvman.2013.06.047
PMID:23900082
[本文引用: 1]
In this paper we propose an ecosystem service framework to support integrated water resource management and apply it to the Murray-Darling Basin in Australia. Water resources in the Murray-Darling Basin have been over-allocated for irrigation use with the consequent degradation of freshwater ecosystems. In line with integrated water resource management principles, Australian Government reforms are reducing the amount of water diverted for irrigation to improve ecosystem health. However, limited understanding of the broader benefits and trade-offs associated with reducing irrigation diversions has hampered the planning process supporting this reform. Ecosystem services offer an integrative framework to identify the broader benefits associated with integrated water resource management in the Murray-Darling Basin, thereby providing support for the Government to reform decision-making. We conducted a multi-criteria decision analysis for ranking regional potentials to provide ecosystem services at river basin scale. We surveyed the wider public about their understanding of, and priorities for, managing ecosystem services and then integrated the results with spatially explicit indicators of ecosystem service provision. The preliminary results of this work identified the sub-catchments with the greatest potential synergies and trade-offs of ecosystem service provision under the integrated water resources management reform process. With future development, our framework could be used as a decision support tool by those grappling with the challenge of the sustainable allocation of water between irrigation and the environment. Crown Copyright © 2013. Published by Elsevier Ltd. All rights reserved.
The protection characteristics of key ecological functional zones from the perspective of ecosystem service trade-off and synergy
DOI:10.11821/dlxb202205016
[本文引用: 1]
Key ecological functional zones provide continuous ecosystem services and play an indispensable role in ensuring national ecological security and social sustainable development. From the perspective of ecosystem service trade-off and synergy, this paper discusses and analyzes the protection characteristics of key ecological functional areas. The data includes multi-source datasets such as ecosystem types, meteorological data, elevation data and soil data from 2000 to 2019. Methods of the dynamic degree of ecological spatial change, ecosystem service model and partial correlation coefficient were used for evaluation and analysis. This research selects the Qinling-Daba (Qinba) Mountains region with high similarity of natural and geographical conditions as the reference unit, takes ecosystem supply services and regulation services as the core content, and analyzes the trade-off and synergy relationship of ecosystem services based on the quantitative analysis of the characteristics of ecological spatial changes from 2000 to 2019. The results showed that the ecological status of the study area gradually improved, and the ecosystem tended to be stable after the delimitation of key ecological functional zones. The service capacity of key ecological functional zones is gradually increasing, and the average net primary productivity, total soil conservation and total water conservation are higher than those outside the key ecological functional zones by 25.95 gC/m2, 5.81×10⁸ t and 24.95×10⁸ m3, respectively. The synergy between soil conservation services and ecosystem supply services was positively correlated with the improvement of ecological status. Due to the impact of precipitation, the synergistic relationship between water conservation services and ecosystem supply services after 2010 became worse. Overall, the designation of key ecological functional areas in the Qinba Mountains has driven the "quantitative growth" of regional ecological space and the "qualitative improvement" of ecosystem services. However, the "synergy" of the relationship between ecosystem services is not obvious, and even changed to "trade-off", which requires the country to make more targeted ecosystem protection and management decisions in the future, and improve the overall benefits of ecosystem and support the sustainable supply of regional ecosystem services.
生态系统服务权衡与协同视角下的重点生态功能区保护特征
DOI:10.11821/dlxb202205016
[本文引用: 1]
重点生态功能区提供着源源不断的生态系统服务,在保障国家生态安全和社会可持续发展方面,有着不可或缺的基础作用。但是,以生态系统服务权衡与协同关系为视角,进而探讨分析重点生态功能区保护特征的研究案例相对较少。本文以秦巴重点生态功能区为评估分析区域,选择自然地理条件相似度极高的秦巴山区为参照单元,以生态系统供给服务与调节服务为核心内容,在定量分析2000—2019年期间的生态空间变化特征基础上,分析评估生态系统服务权衡与协同关系。结果表明:秦巴山区生态状况逐渐变好,重点生态功能区划定之后,生态系统趋于稳定;重点生态功能区服务能力呈逐渐增强的趋势,平均净初级生产力、土壤保持总量和水源涵养总量比重点生态功能区外分别高出了25.95 gC/m<sup>2</sup>、5.81亿t和24.95亿m<sup>3</sup>;土壤保持服务和生态系统供给服务的协同关系与生态状况改善呈正相关;由于受到降水的影响,2010年之后的水源涵养服务与生态系统供给服务的协同关系变差。总体来看,秦巴重点生态功能区的划定带动了区域生态空间“量的增长”和生态系统服务“质的提升”,但生态系统服务之间关系的“协调性”仍然不足,甚至从“协同”转为“权衡”关系,这要求未来国家需要制定更有针对性的生态系统保护管理决策,提高生态系统总体效益,支撑区域生态系统服务的可持续供给。
Ecosystem service trade-offs and their influencing factors: A case study in the Loess Plateau of China
DOI:10.1016/j.scitotenv.2017.07.079 URL [本文引用: 1]
Exploring the complex trade-offs and synergies among ecosystem services in the Tibet autonomous region
Exploring the relationship and influencing factors of cultivated land multifunction in China from the perspective of trade-off synergy
