

1 引言
蒸散发(ET)是水循环的重要环节,是联系水循环、能量循环的纽带[1-2]。全球约60%~70%的陆地年降水以ET的形式返回到大气中[3],这一比例在干旱区高达90%以上。在多年尺度上,ET占降水的比例直接决定着区域水资源的可利用量。近几十年来,全球气候和下垫面的剧烈变化深刻影响了ET的时空分布格局,改变了区域水资源可利用量,给许多国家和地区的水资源安全带来挑战[4]。在实践层面,ET的合理估算对于水资源管理、干旱监测和评估、作物产量预测等具有重要意义。然而,ET是一个复杂的水循环过程,受气候和下垫面要素的综合影响,具有高度的时空异质性[5]。基于地面的ET观测方法(如涡度相关、波文比和蒸渗仪)受限于站点密度、观测年限和空间代表性等问题,很难直接拓展到大尺度上[6]。大尺度的ET合理估算面临诸多挑战。
自20世纪80年代以来,遥感技术的快速发展极大的拓展了ET方法的应用。相比于其他方法,遥感ET方法可以充分利用遥感反演的地表信息(如反照率、叶面积指数和地表温度),是科学量化ET对环境变化响应的重要工具。目前,遥感ET模型大致分为3类[7]:数据驱动模型、能量平衡模型和Penman-Monteith(PM)类模型。数据驱动模型直接通过数学算法(如机器学习)将站点实测ET与气象、地表要素建立关系,进而进行ET的时空外推[8]。能量平衡模型将消耗于ET的潜热视为能量平衡的残余项,并通过各种经验或物理参数化方案来估算除潜热之外的其他能量平衡项[9],如显热和地表热通量。PM类模型结合了能量平衡原理和水汽传输原理来估计ET,综合考虑了影响ET的辐射项和空气动力学项,被视为一种具有坚实物理基础的方法[10]。
近几十年,中国的气候和下垫面特征发生了显著变化,主要表现为持续的升温和植被的大规模变绿。这些变化通过影响ET过程深刻地改变了水资源的时空分布格局[11]。然而,ET对气候和下垫面变化的响应是一个复杂的陆—气互馈过程。科学量化环境要素变化对ET趋势的贡献对于中国水资源的管理和生态恢复工程科学布局具有重要的意义。以往相关研究多在区域尺度上分析ET对环境要素变化的响应[12-13]。中国幅员辽阔,不同区域ET的变化特征不同,其主导因素也存在区域差异[14],而以往研究对中国陆地ET变化的主导因素及其区域差异仍缺乏足够的理解和定量的揭示。基于此,本文基于遥感ET模型Penman-Monteith-Leuning(PML)模拟了1982—2019年中国陆地ET的时空变化,在14个通量站点和286个流域上系统评估了ET的模拟效果,基于驱动要素去趋势实验评估了5种气象和植被要素(降水、水汽压差、净辐射、风速和叶面积指数)对中国陆地ET趋势的贡献,并解释了ET对这些要素响应存在空间差异的原因。
2 研究方法与数据来源
2.1 PML模型
Leuning等[15]在经典的Penman-Monteith模型基础上,提出了一个冠层导度模型来估算植被蒸腾,这个模型后来被称为PML模型。原始的PML仅包含土壤蒸发(Es)和蒸腾(Et)的估算,具体的表达式如下:
式中:λ指汽化潜热;ε=Δ/γ,其中γ是干湿计常数(kPa °C-1);Δ是温度与饱和水汽压曲线的斜率(kPa °C-1);r是空气密度(kg m-3);Cp是空气比热(MJ kg-1 °C-1);Ac和As是净辐射(Rn)分配到植被冠层和土壤表面的部分(MJ m-2 d-1),根据植被叶面积指数(LAI)来划分;Ga是空气动力学导度(m s-1),可参考文献[16]来估算;Gc是植被冠层导度(m s-1);VPD是水汽压差(kPa);f为土壤蒸发的水分约束(0 ≤ f ≤1)。PML模型中,描述气孔开合状态的冠层导度参数Gc计算公式如下:
式中:kQ为光合有效辐射的消光系数;gsx为植被最大气孔导度(m s-1),取决于气候条件和植被类型;Qh是冠层顶部的光合有效辐射(MJ m-2 d-1);Q50和D50是当气孔导度下降到其最大值(gsx)一半时的光合有效辐射和水汽压差(MJ m-2 d-1)。
PML模型中,描述Es水分约束的变量f通过前30 d的累积降水和土壤平衡蒸发之比来估算[17],具体公式如下:
式中:P为日降水量(mm d-1);Eeq为土壤平衡蒸发(mm d-1);fLP是最后一个有效降水日(Pmin > 0.5 mm)的Es水分约束;Δt是当天与最后一个有效降水日之间的间隔天数;α为控制土壤干燥速率的参数(α = 0.25)。
鉴于截留蒸发(Ei)在森林地区水量平衡中的重要性,文献[18]在原始PML模型中加入了一个单层“水箱”模型来计算Ei,具体公式如下:
2.2 驱动要素去趋势实验
本文基于去趋势法对PML模型的驱动要素进行去趋势处理,再分别将原始和去趋势的驱动要素逐一输入到PML模型中,通过比较原始和去趋势输入状态下ET的相对变化来量化各个要素对ET的贡献。经过去趋势处理的驱动要素年趋势为零,但保留了要素的年际变化和季节性波动[11]。以叶面积指数LAI为例,具体的去趋势操作步骤如下。
步骤一:在栅格尺度上,将逐日的LAI数据累加到年尺度,基于Mann-Kendall非参数趋势检验获得LAI的年趋势。
步骤二:基于下列公式去除LAI年序列趋势:
式中:LAId(t)和LAIo(t)分别为LAI在第t年的去趋势值和原始值;k为原始LAI年序列的趋势;t0为初始年份(1982年)。
步骤三:在栅格尺度上,将LAId(t)和LAIo(t)之比作为比例因子,对t年LAI日时间序列进行调整,生成年序列趋势为零的LAI数据。
步骤四:分别将原始和去趋势的LAI数据输入到PML模型中,其他驱动要素不做处理(原始驱动),得到两种输入状态下ET年趋势的差异(ΔTLAI):
式中:ToLAI为输入原始LAI得到的ET趋势;TdLAI为输入去趋势LAI得到的ET趋势。
基于同样的步骤,可以得到其他驱动要素对ET趋势的影响。需要指出的是本文使用VPD来综合表征气温和相对湿度,因为VPD是影响植被叶片气孔开合程度的重要影响因子。同样以LAI为例,其变化对ET趋势的贡献度(CLAI)计算如下:
式中:ΔTLAI、ΔTP、ΔTRn、ΔTVPD和ΔTWS分别表示LAI、降水、净辐射、VPD和风速引起的ET趋势变化。基于同样的步骤,可以得到其他要素变化对ET趋势的贡献。
2.3 数据来源及处理
PML模型的驱动数据包括气象要素和地表要素(表1)。气象数据来自中国843个国家标准气象站(图1),包括降水、气温、风速、相对湿度和日照时数。基于专业气象插值软件Anusplin[22]将逐日气象观测插值成0.05°×0.05°栅格数据。Aunsplin考虑了海拔高度对气象变量插值的影响,这对于温度、风速等具有明显海拔依赖性的气象变量插值结果非常重要[22]。净辐射是PML模型的重要输入,但气象站并不直接提供净辐射的观测。本文基于常规气象变量和遥感反照率来计算净短波辐射和净长波辐射,二者之和作为净辐射估计值。具体而言,基于气象站观测的日照时数和遥感的反照率来估算净短波辐射,基于Allen等[16]提供的方法估算净长波辐射。此外,本文采用Penman方法[23]来估算水体蒸发,水体反照率设为0.08。地表反照率和LAI数据均来自于GLASS产品。8 d合成的反照率和LAI数据被线性内插为日数据以匹配PML模型的计算步长。
表1 PML模型的驱动数据和评估数据
Tab. 1
| 数据类型 | 变量 | 空间分辨率 | 数据来源 |
|---|---|---|---|
| 气象数据 | 降水、气温、风速、湿度、日照时数 | - | http://data.cma.cn/ |
| 陆表数据 | GLASS反照率 | 0.05° | http://www.glass.umd.edu/Download.html |
| GLASS LAI | 0.05° | http://www.glass.umd.edu/Download.html | |
| MODIS土地利用 | 0.05° | https://modis.gsfc.nasa.gov/data/dataprod/mod12.php | |
| 评估数据 | 潜热通量 | - | http://www.chinaflux.org/ |
| 径流数据 | - | 中国水文年鉴(1982—2000年) |
图1
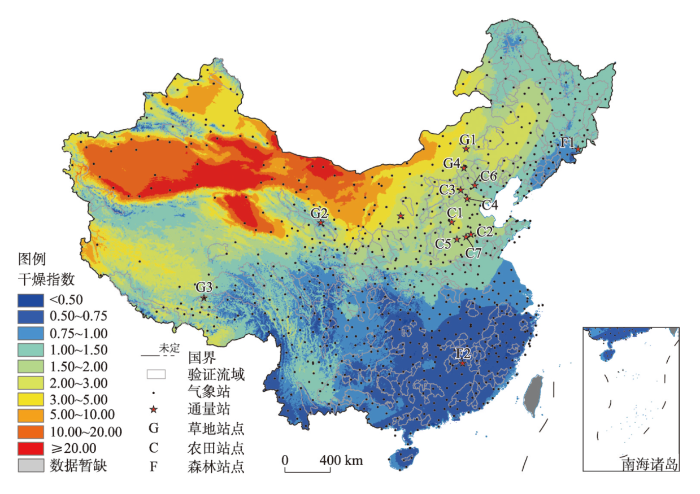
图1
气象站点、通量站点以及测流域位置
注:基于自然资源部标准地图服务网站GS(2016)1569号的标准地图制作,底图边界无修改;干燥指数是多年平均的潜在蒸散发和降水之比。
Fig. 1
Location of meteorological stations, flux towers and test basins in China
本文在14个通量站点和286个小流域评估了PML模型的ET模拟效果(图1)。14个通量站点包括2个森林站(F1长白山和F2千烟洲)、4个草地站(G1内蒙古、G2海北、G3当雄和G4多伦)和7个农田站点(C1栾城、C2禹城、C3怀来、C4大兴、C5馆陶、C6密云和C7位山)。在流域尺度上,本文基于水量平衡估算的年均ET作为参考值来评估PML模型。在多年尺度上,水量平衡法假设陆地水储量变化可忽略,ET近似为降水和径流深的差值。本文用到的286个流域的径流数据来自于第二次全国水资源普查数据,时间跨度为1982—2000年,这些流域涵盖了中国不同的气候区(图1)。表1总结了PML模型的驱动数据和评估数据信息。
2.4 模型评估指标
本文使用百分比相对偏差(Bias)、确定性系数(R2)和Kling-Gupta系数(KGE)[24]来评估PML模型的ET模拟效果。其中,Bias的最优值为0,正值表示模拟值被总体低估,负值表示模拟值被总体高估。KGE作为一个综合指标来衡量实测值和模拟值拟合效果,KGE和R2的最优值均为1。
3 结果分析
3.1 PML模型驱动要素的时空变化
图2显示了PML模型5个驱动要素(降水、净辐射、风速、VPD和LAI)年趋势值的空间分布。全国尺度上,年降水呈不显著(p > 0.05)增加趋势,趋势值为0.61 mm a-1。降水显著(p < 0.05)增加的区域占国土面积的比例为23.3%,主要集中在中国西北地区,而降水显著(p < 0.05)减少的区域仅占国土面积的1.1%(图2a)。净辐射总体呈不显著(p > 0.05)增加的趋势,趋势值为1.68×10⁻³ MJ m-2 a-1(图2b)。VPD总体呈显著(p < 0.05)增加趋势,趋势值为2.26×10⁻³ kPa a-1,VPD显著增加的区域占国土面积的76.8%(图2c)。风速总体呈显著(p < 0.05)减少的趋势,趋势值为-0.02×10⁻³ m s-1 a-1,但2013年后风速明显增加(图2d)。LAI总体呈显著(p < 0.05)增加趋势,趋势值为3.41×10⁻³ m2 m-2 a-1。其中,LAI显著增加的区域占国土面积是41.6%,主要集中在黄土高原、华北平原以及珠江上游等地区(图2e)。
图2
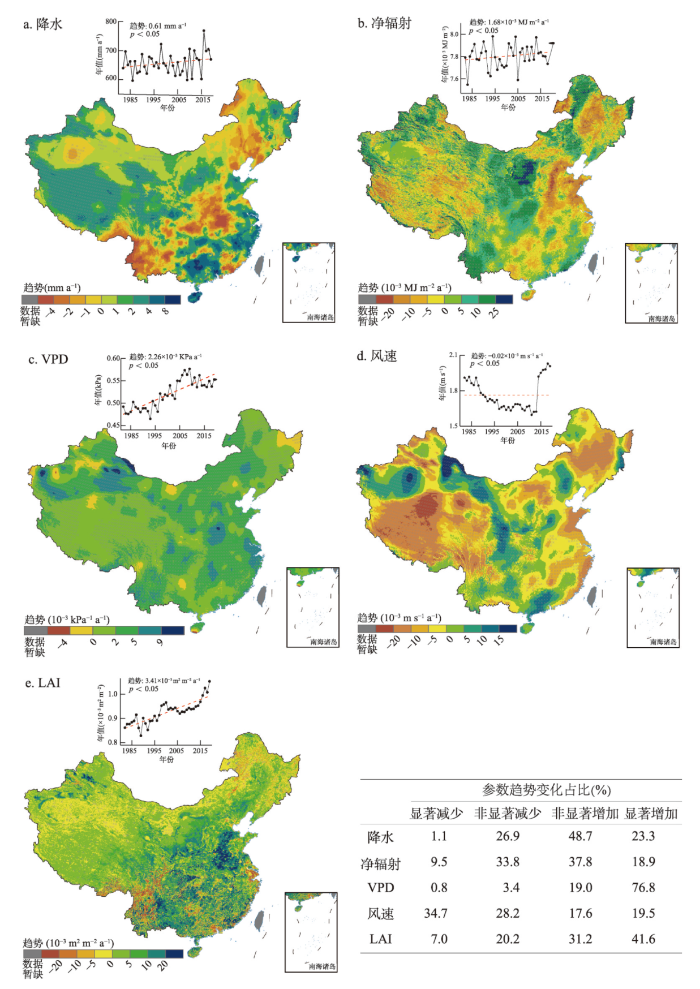
图2
1982—2019年PML模型驱动要素年趋势的空间分布
注:基于自然资源部标准地图服务网站GS(2016)1569号的标准地图制作,底图边界无修改;“×”表示通过显著性检验区域(p < 0.05)
Fig. 2
Spatial pattern of trends in forcing variables of the PML model across China from 1982 to 2019
3.2 蒸散发模拟结果评估
图3展示了在3种生态系统类型(森林、草地和农田)下PML模型ET模拟值和通量站点实测值的比较。由图可知,PML模拟的ET和实测值一致性较好。在森林、草地和农田站点,ET实测值和模拟值的KGE分别为0.84、0.74和0.71。PML在草地站点的Bias最大(Bias = 10.07%),其他两类站点的Bias均在±10%以内。
图3
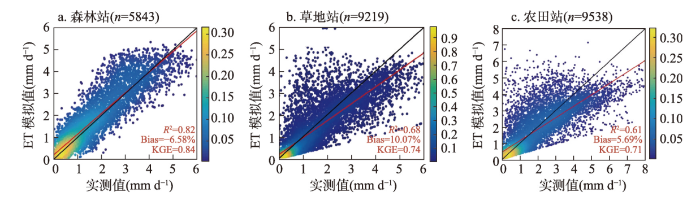
图3
通量站点ET实测值和PML模拟值的比较
注:图中红线为实测值和模拟值的线性拟合线;彩色图例为概率密度估计值。
Fig. 3
Comparison of the observed and simulated evapotranspiration (ET) by the PML model at the flux sites
图4
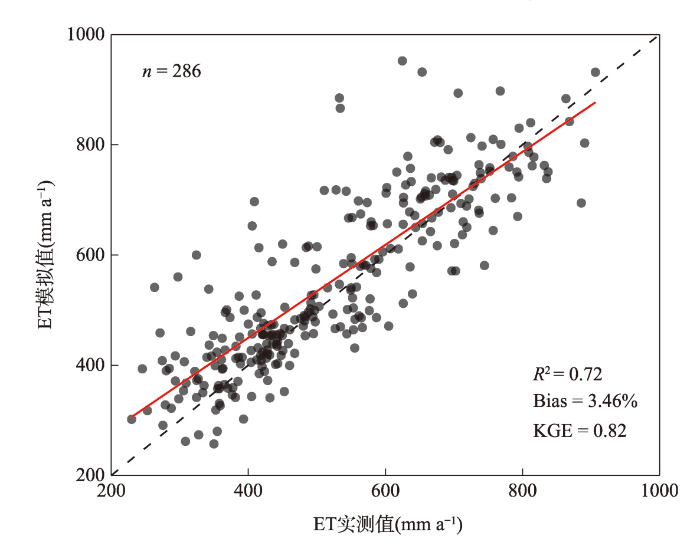
图4
流域尺度上ET实测值和模拟值的散点图
注:图中红色实线为实测值和模拟值的线性拟合线。
Fig. 4
Scatter plots of the observed and simulated ET at the basin scale
3.3 蒸散发的时空变化
PML模型模拟的1982—2019年年均ET自东南向西北呈递减的趋势(图5),最高值出现在华南沿海地区,最低值出现在西北沙漠戈壁地区,多年平均值为427.7 mm a-1。全国尺度上,ET组分以植被蒸腾为主,植被蒸腾和土壤蒸发占ET的比例分别为54.9%和40.5%,截留蒸发和水体蒸发之和占比为4.6%(图5a)。1982—2019年全国平均ET呈显著(p < 0.05)增加的趋势,趋势值为1.25 mm a-1。空间上,ET以增加趋势为主,其中54.3%的区域呈显著(p < 0.05)增加趋势(图5b),主要集中在青藏高原、黄土高原、华北平原、长江下游和西南部分地区。ET呈下降趋势的区域占全国面积的12.9%,其中显著(p < 0.05)下降的区域占比仅为1.7%。
图5
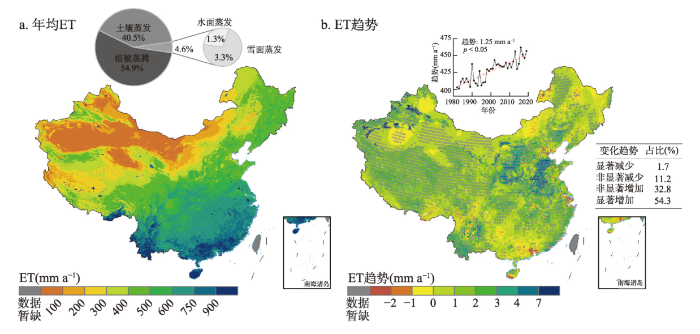
图5
中国多年平均ET的空间分布格局以及年ET的趋势
注:基于自然资源部标准地图服务网站GS(2016)1569号的标准地图制作,地图边界无修改。
Fig. 5
Spatial pattern of mean annual ET estimates and trends in annual ET across China
3.4 蒸散发变化的归因分析
本文基于PML模型和去趋势实验评估了的5个驱动变量(降水、净辐射、风速、VPD和LAI)对ET年均值和趋势的贡献。结果表明,VPD、降水和LAI是中国ET变化的主导因素,三者对ET年均值的贡献分别为9.7 mm a-1、6.5 mm a-1和5.4 mm a-1(图6)。相比之下,风速和净辐射对年均ET的影响有限,二者对ET年均值的贡献分别为1.5 mm a-1和-1.2 mm a-1。空间上,ET变化的主导因素具有明显的区域分异规律(图6f)。西北干旱和半干旱地区,ET变化的主导因素是降水,长江大部和东北北部地区(湿润区)的主导因素是VPD,而黄土高原、华北平原以及东北部分地区的主导因素为LAI。上述3个因素占国土面积的比例分别为38.4%、35.7%和16.9%。相比之下,以净辐射和风速为主导因素的区域分布较少,二者占国土面积的比例分别为5.2%和3.3%。
图6
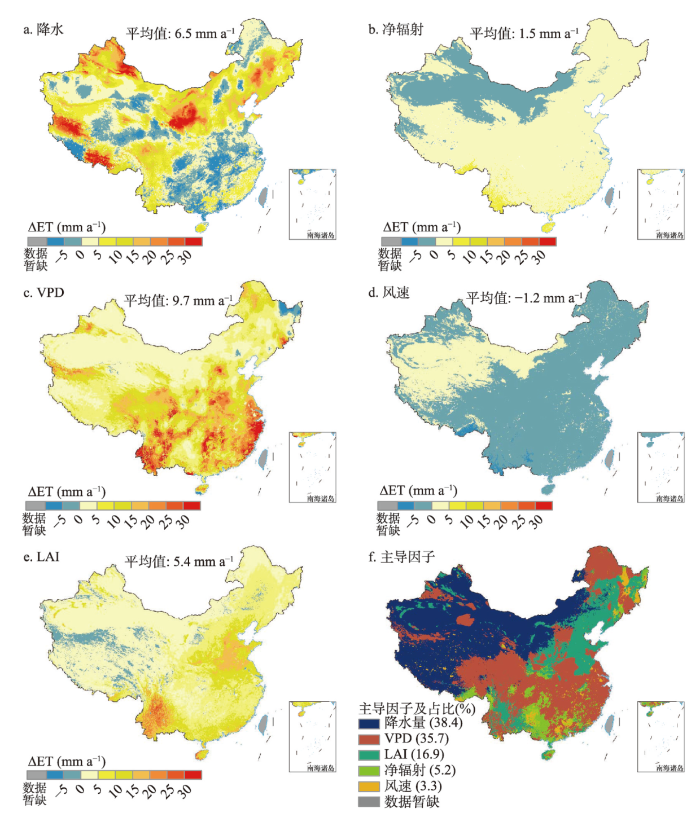
图6
PML模型驱动变量变化对多年平均ET的影响以及主导因素的空间分布
注:基于自然资源部标准地图服务网站GS(2016)1569号的标准地图制作,底图边界无修改。
Fig. 6
Impact of changes in forcing variables of the PML model on mean annual ET estimates and spatial pattern of the dominant factor affecting changes in mean annual ET across China
PML模型的各个驱动因素对全国ET趋势的贡献度计算结果见图7。5个驱动要素对ET趋势的贡献之和为1.23 mm a-1,与PML模型模拟的ET趋势(1.25 mm a-1)接近。5个驱动要素中,VPD对ET趋势的贡献最大,其次为降水和LAI,三者的贡献度分别为44%(0.54 mm a-1)、29%(0.36 mm a-1)和25%(0.31 mm a-1)。净辐射和风速变化对ET趋势的贡献较小,二者的贡献度之和仅为2%(0.02 mm a-1)。
图7

图7
PML模型驱动要素变化对ET趋势的贡献度
注:TPML表示原始驱动输入情况下PML模型模拟的ET趋势;ΣΔT表示5个驱动要素去趋势处理引起的ET趋势变化之和,其他符号的含义见公式(9)。
Fig. 7
The contribution of changes in forcing variables of the PML model to the trend of annual ET in China
4 结论与讨论
4.1 讨论
4.1.1 与前期研究的比较
20世纪80年代以来,中国气候和下垫面要素发生了显著变化,最显著的特征为气温的持续上升和植被的大范围变绿[25]。在气候和下垫面要素的影响下,许多研究表明中国陆地ET呈显著增加的趋势[5,11],这与本文的研究结论一致(表2)。但是,不同研究得到的ET趋势值以及主导因素的归因结果差异很大[26⇓-28],这些差异很大程度上是由于研究时段、ET模型和趋势归因分析方法的差异导致的[28]。在归因分析方法方面,除本文用到的去趋势法外,常用的归因分析方法还包括拓展法和回归法。拓展法的操作步骤与去趋势法类似,差别在于生成年趋势为零的驱动要素的方式。拓展法是将某一驱动要素初始年的数据拓展到其他年份,进而进行归因分析[28]。该方法的不足在于归因分析结果强烈取决于驱动要素初始年数值的大小。回归法是通过构建ET年估算值和驱动要素之间的线性回归关系,进而量化各个驱动要素的贡献[27]。然而,该方法无法反映ET对驱动要素的非线性响应关系。相比而言,去趋势方法有效的弥补了拓展法和回归法的上述不足,因而,该方法在ET趋势的归因分析中具有优势。
表2 本文与前期相关研究的比较
Tab. 2
| ET模型 | 研究时段 | 归因方法 | ET趋势(mm a-1) | 主导因素 | 数据来源 |
|---|---|---|---|---|---|
| MOD16 | 2000—2019 | 回归法 | 5.38* | 降水和风速 | 文献[26] |
| BEPS | 2001—2020 | 拓展法 | 2.32 | LAI和降水 | 文献[27] |
| PE | 1982—2018 | 拓展法 | 1.33* | 降水、气温和LAI | 文献[28] |
| PML | 1982—2019 | 去趋势法 | 1.25* | VPD、降水和LAI | 本文 |
注:*表示趋势通过了p < 0.05或p < 0.01的显著性检验。
4.1.2 趋势归因的解译
本文首次将去趋势方法用于中国ET趋势的归因分析。结果表明,VPD、降水和LAI是中国ET变化的主导因素,三者对中国ET趋势的贡献度达到了98%。ET变化的主导因素具有明显的区域分异,西北偏干旱地区的主导因素是降水,南方湿润区是VPD,而黄土高原、华北平原等半湿润区为LAI。本文的归因分析结果总体与已有研究[28]较为一致(表2)。从ET的限制因素考虑,西北大部分地区属于典型的水分限制区,大气蒸发能力远大于降水,ET对降水变化的敏感性较大,降水增加是ET变化的主导因素。南方湿润区,植被覆盖度高,植被蒸腾是ET的主要贡献项,植被气孔对VPD的响应非常敏感。因此,VPD是湿润区ET变化的主导因素。在黄土高原、华北平原以及东北部分地区,地表植被经历了显著的变绿过程,植被变化是ET趋势的主导因素。植被变绿导致更多的太阳辐射被植被冠层截获,引起植被蒸腾和冠层截留蒸发的增加,土壤蒸发的减少(到达土壤表面的太阳辐射减少),但土壤蒸发的减少量远小于植被蒸腾和冠层截留蒸发的增加量[29]。因此,变绿引起更多的水分消耗于ET。植被变绿引起的ET增加也被认为是中国北方许多河流来水量减少的重要原因,特别是黄土高原和华北地区[11]。但是,从陆—气互馈的角度考虑,变绿引起的ET增加使得地表大气更湿润,导致水汽辐合变强和云量增多,提高了降水再循环速率,部分增加的ET最终会以降水的形式降落到地表[30]。
4.1.3 不确定来源和研究展望
评估结果可能存在以下不确定性来源。第一,本文用到的气象站点在西部地区(如青藏高原和新疆地区)分布较少,这可能影响PML模型气象驱动数据的可靠性。第二,去趋势实验中PML模型的5个驱动要素(降水、净辐射、VPD、风速和LAI)并不是完全独立的,每个变量对ET贡献度的估算中不同程度的包含其他变量的贡献。第三,PML模型中没有考虑大气CO2浓度上升对气孔导度的抑制影响,这可能会对评估结果造成一定的影响。从植物生理学角度考虑,CO2上升会导致植被叶片在较小的气孔开度下吸收同等的CO2,提高植物光合作用的水分利用效率,减少蒸腾水分损失[11]。此外,PML模型没有考虑人类活动对ET的影响,这也可能影响ET的估算精度。例如,在灌溉强度较大的平原地区,PML模型无法反映灌溉对ET的促进作用,造成ET估算值的低估。
本文强调ET趋势主导因素的复杂性和空间差异性,这凸显了在大尺度开展ET趋势归因分析的必要性。未来工作有必要拓展到全球尺度上,进一步考虑灌溉、CO2变化和土壤冻融等对ET过程的影响,揭示ET趋势的空间差异及其驱动机制,夯实研究结论。此外,ET趋势的主导因素识别依赖于选取的归因方法[28],未来研究建议采用多种归因分析方法综合分析,以减少单一方法的不确定。
4.2 结论
本文基于PML模型和去趋势实验定量评估了1982—2019年气象和植被要素对中国陆地ET变化的贡献,主要结论如下:
(1)1982—2019年中国气候和植被特征发生明显变化,最显著的特征是植被大规模变绿和VPD的显著(p < 0.05)增加。
(2)1982—2019年中国陆地ET显著(p < 0.05)增加,趋势值为1.25 mm a-1。VPD、降水和LAI是主导ET趋势的3个主要因素,三者对ET趋势的贡献分别为44%、29%和25%。
(3)ET变化的空间主导要素具有明显的区域分异规律。西北干旱和半干旱地区ET变化主要受降水主导,湿润区(长江大部以及东北北部)大多受VPD主导,而黄土高原、华北平原和东北部分区域受LAI主导。
参考文献
Recent decline in the global land evapotranspiration trend due to limited moisture supply
DOI:10.1038/nature09396 [本文引用: 1]
The future of evapotranspiration: Global requirements for ecosystem functioning, carbon and climate feedbacks, agricultural management, and water resources
DOI:10.1002/wrcr.v53.4 URL [本文引用: 1]
Global hydrological cycles and world water resources
DOI:10.1126/science.1128845
PMID:16931749
[本文引用: 1]

Water is a naturally circulating resource that is constantly recharged. Therefore, even though the stocks of water in natural and artificial reservoirs are helpful to increase the available water resources for human society, the flow of water should be the main focus in water resources assessments. The climate system puts an upper limit on the circulation rate of available renewable freshwater resources (RFWR). Although current global withdrawals are well below the upper limit, more than two billion people live in highly water-stressed areas because of the uneven distribution of RFWR in time and space. Climate change is expected to accelerate water cycles and thereby increase the available RFWR. This would slow down the increase of people living under water stress; however, changes in seasonal patterns and increasing probability of extreme events may offset this effect. Reducing current vulnerability will be the first step to prepare for such anticipated changes.
Temporal-spatial dynamic change characteristics of evapotranspiration in arid region of Northwest China
中国西北干旱区蒸散发时空动态特征
Impacts of climate change on terrestrial water cycle in China
气候变化背景下中国陆地水循环时空演变
Comparison of remote sensing evapotranspiration models: Consistency, merits, and pitfalls
A review of remote sensing based actual evapotranspiration estimation
DOI:10.1002/wat2.2016.3.issue-6 URL [本文引用: 1]
Modeling the evapotranspiration and its long-term trend over Northwest China using different machine learning models
基于多种机器学习模型的西北地区蒸散发模拟与趋势分析
Estimating evapotranspiration using earth observation data: A comparison between hydrological and energy balance modelling approaches
Using long-term water balances to parameterize surface conductance and calculate evaporation at 0.05° spatial resolution
Assessing the impacts of vegetation greenness change on evapotranspiration and water yield in China
Loess Plateau evapotranspiration intensified by land surface radiative forcing associated with ecological restoration
Spatial-temporal characteristics of evapotranspiration and its relationship with climate factors in the source region of the Yellow River from 2000 to 2014
DOI:10.11821/dlxb201811006
[本文引用: 1]
Located at the eastern margin of the Tibetan Plateau, the source region of the Yellow River is an important ecological security shelter for economic development in Southwest China, with its unique natural habitats and abundant natural resources. Based on the data of 18 meteorological stations within and around the source region, map of China vegetation types (1:1000,000) and DEM data, and using the methods of trend analysis, relative inter-annual variation and correlation analysis, we selected MODIS evapotranspiration (ET) as the main data source to research the spatio-temporal characteristics of ET and its variation under different land use types as well as its relationship with climate factors in the study area from 2000 to 2014. The results indicate that: (1) the regional differentiation of mean ET over years is obvious, the northern ET is significantly weaker than that of the central and southeastern parts, and the strongest ET is observed in the southeastern part. The multi-year mean value of ET is 538.61 mm/a, and the anomaly relative variation is obvious. In addition, the trend of inter-annual variation of ET decreases firstly and then increases, and the trend variation rate is 0.44 mm/a. (2) During the study period, the ET shows a periodic unimodal trend and peaks in July. Moreover, seasonal differences of ET are apparent in the source region of the Yellow River, and the highest value of ET reaches 188.14 mm/a in summer, followed by spring and autumn, yet the lowest is only 97.15 mm/a in winter. (3) From 2000 to 2014, the value of ET in different types of land use has a similar regular pattern, namely: wetland > forest > grassland > other types > bare land. On the whole, the value of ET in each type of land use increases gradually. (4) According to the correlation analysis results, there are positive correlations between ET and air temperature, as well as between ET and precipitation, while ET has a negative correlation with relative humidity. The effect of precipitation on ET is stronger than that of air temperature. Furthermore, the result of ET driven by different factors demonstrates that the climate-driven region of ET is predominantly precipitation-driven in the source region of the Yellow River.
2000—2014年黄河源区ET时空特征及其与气候因子关系
DOI:10.11821/dlxb201811006
[本文引用: 1]
黄河源区地处青藏高原东缘,具有独特的自然生境和丰富的自然资源,是中国西南区域经济发展的重要生态安全屏障。以MODIS ET产品作为研究黄河源区地表蒸散发(ET)的数据源,结合黄河源区内部及周边18个气象站数据、全国1∶100万植被类型图和黄河源区DEM数据,利用趋势分析、相对年际变化和相关分析法,研究2000-2014年黄河源区ET时空变化特征及不同土地利用类型下ET的变化规律,重点探讨了ET与气候因子的关系。结果表明:① 黄河源区多年ET区域分异规律明显,北部ET显著弱于中部和东南部,最强ET位于黄河源区的东南部,多年平均ET值为538.61 mm/a,距平相对变化显著,ET年际变化呈先减小后增加的趋势,平均趋势变化率为0.44 mm/a;② 年内ET呈周期性单峰变化趋势,7月达到峰值;2000-2014年黄河源区多年四季ET季节性差异明显,夏季ET最强达到188.14 mm/a,春秋季次之,冬季ET最弱仅97.15 mm/a;③ 研究时段内不同土地利用类型的ET大小表现为沼泽地>林地>草地>其他>裸地,整体上各土地利用类型的ET呈逐渐增加趋势;④ 相关分析结果表明,ET与同期气温、降水呈正相关关系,与相对湿度呈负相关关系,其中降水对ET的影响强于气温;驱动分区结果显示黄河源区ET受气候因子驱动的地区主要表现为降水驱动。
Co-evolution of climate-vegetation-hydrology and its mechanisms in the source region of Yellow River
DOI:10.11821/dlxb202207011
[本文引用: 1]
Vegetation recovery under global change and its consequent evolution of eco-hydrological processes have modulated the water resources conservative capacity in the source region of the Yellow River (YRSR). Based on climatological data, remotely sensed vegetation index and geographical information, the integrated simulations of water and carbon cycles in the YRSR are presented, with the vegetation interface processes (VIP) distributed eco-hydrological dynamic model. Then the co-evolving mechanisms of hydrological and vegetation dynamics are investigated. Results show that warming and wetting climate in the YRSR has improved the vegetation growing condition and extended the growing period for more than 10 days in recent decades. Averaged NDVI from 2010 to 2020 increased by 4.5% relative to that from 2000 to 2009. Vegetation gross primary productivity (GPP) shows a significant uptrend with a rate of 4.57 gC m-2 a-1, 77% of which is contributed by climate change and elevated atmosphere CO2 fertilization, and the rest 23% is by vegetation greening. Evapotranspiration (ET) is increasing at a rate of 2.54 mm a-1 and vegetation water use efficiency (WUE, expressed as GPP/ET) is also improving at a relative rate of 5.1% a-1. Generally, annual ET, GPP and WUE and their trends are decreasing along the elevation below 4200 m. At basin scale, there are significant positive correlations between the vegetation greenness and the runoff coefficient with precipitation in the current and previous years, demonstrating a legacy effect of precipitation for vegetation recovery on water conservation capacity. The increased ET might be a benefit to the water recycle between land surface and atmosphere, which will alleviate the reduced potential of water yield owing to ecological restoration and establish trades-off and synergies among precipitation, vegetation and water yield. Conclusively, exploring the mechanisms of hydrological responses to climate change and vegetation recovery and its feedback will provide scientific support to the assessment of ecological engineering programs in the source regions.
黄河源区气候—植被—水文协同演变及成因辨析
DOI:10.11821/dlxb202207011
[本文引用: 1]
全球变化下黄河源区水文过程的演变影响流域生态系统的水源涵养功能,流域植被改变也影响水循环。本文基于气候、植被信息和VIP分布式生态水文模型,开展黄河源区水碳循环要素变化的集成模拟,分析了气候—植被—水文要素的协同演变机制。结果表明,2000年以来黄河源区气候呈暖湿化趋势;植被绿度明显提高,2010—2019年比2000—2009年平均增加了4.5%;生长季延长了至少10 d;植被生产力(GPP)显著上升,倾向率为4.57 gC m<sup>-2</sup> a<sup>-1</sup>;植被恢复措施对GPP变化的贡献约为23%,气候变化和大气CO<sub>2</sub>升高的施肥效应的贡献为77%。源区植被蒸散量(ET)呈增加趋势,倾向率为2.54 mm a<sup>-1</sup>,水分利用效率(WUE)亦提高,平均相对上升率为5.1% a<sup>-1</sup>。GPP、ET和WUE年总量及其变化率在海拔4200 m以下随高度上升而减小,之后变化趋缓。源区植被绿度和径流系数与当年和前一年降水呈显著正相关,反映降水蓄存于植物根层土壤的遗留效应。蒸散增强在一定程度上有利于源区地表—大气之间的水分再循环,帮助缓解生态恢复引起的产水能力下降,促进降水—植被—径流之间的良性互馈关系的形成。揭示水文对气候变化和植被恢复的响应和互馈机制,可为生态恢复措施对源区水源涵养功能的影响及效应的定量评估提供科学依据。
A simple surface conductance model to estimate regional evaporation using MODIS leaf area index and the Penman-Monteith equation
Crop evapotranspiration: Guidelines for computing crop water requirements
Improving evapotranspiration estimates in Mediterranean drylands: The role of soil evaporation
Incorporating vegetation dynamics noticeably improved performance of hydrological model under vegetation greening
DOI:10.1016/j.scitotenv.2018.06.233 URL [本文引用: 1]
On the assessment of surface heat flux and evaporation using large-scale parameters
DOI:10.1175/1520-0493(1972)100<0081:OTAOSH>2.3.CO;2 URL [本文引用: 1]
Surface soil moisture parameterization of the VIC-2L model: Evaluation and modification
DOI:10.1016/0921-8181(95)00046-1 URL [本文引用: 1]
Global variation of transpiration and soil evaporation and the role of their major climate drivers
DOI:10.1002/jgrd.v122.13 URL [本文引用: 2]
Anusplin version 4.2 user guide
Decomposition of the mean squared error and NSE performance criteria: Implications for improving hydrological modelling
DOI:10.1016/j.jhydrol.2009.08.003 URL [本文引用: 1]
Greening of the Earth and its drivers
DOI:10.1038/NCLIMATE3004
[本文引用: 1]
Global environmental change is rapidly altering the dynamics of terrestrial vegetation, with consequences for the functioning of the Earth system and provision of ecosystem services(1,2). Yet how global vegetation is responding to the changing environment is not well established. Here we use three long-term satellite leaf area index (LAI) records and ten global ecosystem models to investigate four key drivers of LAI trends during 1982-2009. We show a persistent and widespread increase of growing season integrated LAI (greening) over 25% to 50% of the global vegetated area, whereas less than 4% of the globe shows decreasing LAI (browning). Factorial simulations with multiple global ecosystem models suggest that CO2 fertilization effects explain 70% of the observed greening trend, followed by nitrogen deposition (9%), climate change (8%) and land cover change (LCC) (4%). CO2 fertilization effects explain most of the greening trends in the tropics, whereas climate change resulted in greening of the high latitudes and the Tibetan Plateau. LCC contributed most to the regional greening observed in southeast China and the eastern United States. The regional effects of unexplained factors suggest that the next generation of ecosystem models will need to explore the impacts of forest demography, differences in regional management intensities for cropland and pastures, and other emerging productivity constraints such as phosphorus availability.
Spatial-temporal variations of terrestrial evapotranspiration across China from 2000 to 2019
Causes for the increases in both evapotranspiration and water yield over vegetated mainland China during the last two decades
Estimating spatiotemporal dynamics of evapotranspiration and assessing the cause for its increase in China
Impacts of vegetation changes on global evapotranspiration in the period 2003-2017
DOI:10.11821/dlxb202103007
[本文引用: 1]
Evapotranspiration is a key variable and key process in global water cycle, and it is crucial for understanding how anthropogenic and climate changes have impacts on terrestrial water cycle. In the last decade, global vegetation changes are dramatic, reflected by land use and land cover changes and increase in leaf area index. It remains unclear how these changes influence terrestrial evapotranspiration processes. This study uses a coupled evapotranspiration and gross primary product model (PML-V2) that is run at 500 m and 8-day resolutions across the globe to investigate the impacts of vegetation changes on spatial pattern and dynamics of evapotranspiration in the period of 2003-2017. We found that evapotranspiration across the globe has increased noticeably because of vegetation changes, which is characterized by clear regional and non-regional patterns. Transpiration has strongly increased in the central and northern parts of North America, Europe, eastern China, southern Africa, and eastern and northern Australia. Under different land cover types, shrubs and cropland have been influenced strongly, and their impact is stronger in the post-2012 period than that in the pre-2012 period. The recent total increase from these two land cover types amounts to about 0.41 ×10³ km3 a-1, which is about 8 times of natural annual runoff from the Yellow River Basin. The results from this study can help improve the understanding of how vegetation changes caused by recent land use and land cover changes influence terrestrial water cycle and the potential local and regional climate change.
2003—2017年植被变化对全球陆面蒸散发的影响
DOI:10.11821/dlxb202103007
[本文引用: 1]
蒸散发是陆面水循环的关键环节和过程,是研究水循环对人类活动和气候变化响应的关键要素。过去十几年,全球下垫面的植被变化剧烈,但如何影响全球陆面蒸散发仍未得到清晰的揭示。本文采用500 m分辨率MODIS数据驱动PML-V2模型,定量解析了2003—2017年植被变化对全球陆面蒸散发的影响。结果显示:在全球尺度上,植被变绿使得全球蒸散发呈现显著的增加趋势,使陆地水循环加快;区域尺度上,植被变化对蒸散发的影响则存在明显的地带性和非地带性特征,如在北美洲中北部、欧洲、中国东部、非洲南部和澳大利亚东北部等地区,蒸散发总量的增加主要是由植被蒸腾增加而引起的。分析不同植被功能类型区的贡献显示,下垫面变化对灌木和耕地影响尤为明显,并在2012年以后呈现增强趋势;这2个植被类型区的全球年总蒸散发累积增加量为0.41×10<sup>3</sup> km<sup>3</sup> a<sup>-1</sup>,约为黄河流域多年平均径流量的8倍。该研究结果有助于进一步加强关于下垫面变化对陆地水循环的影响及其可能带来的局部气候变化的认识。
Feedbacks between vegetation restorage and local precipitation over the Loess Plateau in China
DOI:10.1360/SSTe-2020-0273 URL [本文引用: 1]
植被恢复对黄土高原局地降水的反馈效应研究
