1982—2019年中国陆地蒸散发变化的归因分析
Attribution analysis of changes in terrestrial evapotranspiration in China during 1982-2019
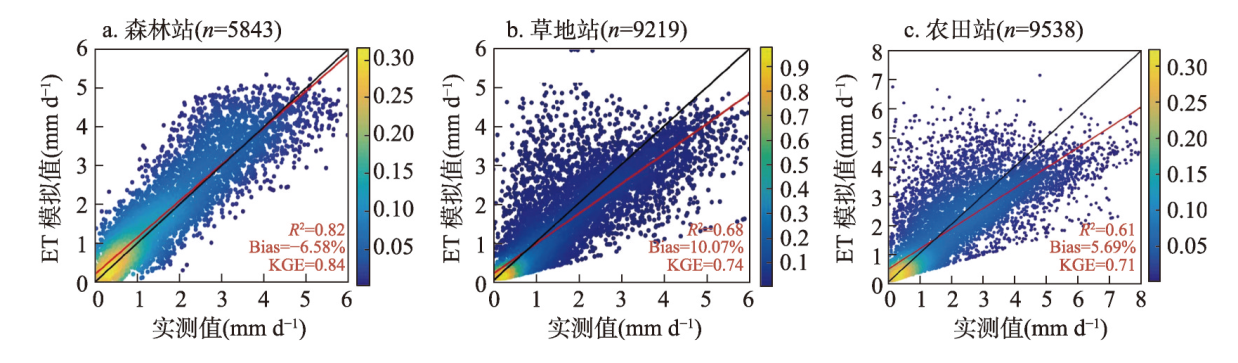
注:图中红线为实测值和模拟值的线性拟合线;彩色图例为概率密度估计值。
1982—2019年中国陆地蒸散发变化的归因分析 |
| 白鹏, 蔡常鑫 |
|
Attribution analysis of changes in terrestrial evapotranspiration in China during 1982-2019 |
| BAI Peng, CAI Changxin |
| 图3 通量站点ET实测值和PML模拟值的比较 注:图中红线为实测值和模拟值的线性拟合线;彩色图例为概率密度估计值。 |
| Fig. 3 Comparison of the observed and simulated evapotranspiration (ET) by the PML model at the flux sites |
|
|