

伴随农民家庭收入结构和增收机制的变化,加之受国内大宗粮食作物生产成本趋高、利润率走低影响,中国小麦、稻谷等粮食作物生产动力不足[1⇓-3];同时,受国际大宗农产品价格偏低、国内食物消费结构变化等影响,市场对农产品品种及质量安全的要求发生重大变化[4-5]。供需环境的变化以及“新常态”下中国经济发展动力的转变使农作物生产面临转型升级的任务,2021年中央一号文件强调要优化农业生产结构和区域布局,提升农业质量效益和竞争力。广西壮族自治区(下称“广西”)具有良好的水热资源优势,糖料、水果、蔬菜等农作物生产在全国具有举足轻重的地位,2019年农业增加值在全区国民经济的占比排全国第二[6]。作为欠发达地区,广西城镇化水平低,城乡间、区域间发展差异较大,农业发展肩负着巩固拓展脱贫攻坚成果、改善城乡二元结构的重任,对促进全区社会经济发展乃至保障全国重要农产品供给具有重要意义。然而由于受地貌类型复杂多样、经济基础薄弱、生产要素配置不够合理等因素制约,当前农作物生产效率仍有待提升,亟需基于对主要农作物生产格局演变特征与机制的系统认知优化生产结构和区域布局,推动农作物生产从规模扩张向综合效益提升转型。
农作物生产结构与布局研究是农业地理学的传统研究内容,20世纪50年代以来,邓静中、周立三、吴传钧等老一辈地理学家基于大规模农业资源调查开展了全国和典型地区农业生产布局及农业区划研究[7⇓⇓⇓-11],宏观上为各级政府农业生产活动的组织提供了重要决策建议。近年来国内大量学者基于地理学、经济学、生态学等视角开展了全国和典型地区种植业地理集聚[12⇓-14]以及农作物生产结构时空演变特征[15⇓⇓-18]、影响机制[19⇓-21]、安全评价[22-23]等研究,重点关注粮食[24⇓⇓⇓-28]、糖料[29]、玉米[30]、马铃薯[31]、甜瓜[32]等单一农作物的生产格局及其区域优势布局,部分学者开展了种植业生产潜力时空演变[33]、种植结构调整的水土资源利用效应[34]研究,并对农作物播种面积[35]、空间竞争[36]进行了模拟。当前已有以广西为案例区从粮食[37]、甘蔗[38]等单一作物视角开展的格局演变及影响因素研究,未能形成对不同类型农作物竞争态势及其结构变化趋势的整体认知,而以省级或地级市为基本单元开展的涉及广西种植结构和生产比较优势的研究[15,19 -20,39],难以细致揭示区域内部农作物生产的空间异质性及其演变机制。为此,本文以县域为基本研究单元,选取粮食、糖料、水果和蔬菜4类农作物,运用区位基尼系数、重心移动模型、比较优势指数等方法揭示1995—2019年广西主要农作物生产格局的演变特征及其形成机制,提出相关优化建议,以期为区域农作物生产要素配置提供决策参考。
1 区域概况与研究方法
1.1 研究区概况
广西位于20°54′N~26°24′N、104°26′E~112°04′E(图1),地处云贵高原向东南沿海丘陵的过渡地带,地势由西北向东南倾斜,地貌以丘陵山地为主,喀斯特地貌广布[40];广西属亚热带季风气候,多年平均气温17~23 ℃,无霜期长达284~365 d[41];全区年均日照时数1363~2136 h,总体呈由北向南递增变化;全区年均降水量1038~2520 mm,呈由桂东南向桂西北递减态势。良好的水热资源条件适宜多种农作物栽培和生长,2019年种植业在农林牧渔业总产值中的比重占56.42%,高于全国3.13个百分点[6]。食糖产量连续27年居全国第一位[6],2015年蔗糖业发展上升为国家战略[42];蔬菜产量居全国第八位[6],是全国重要的南菜北运基地以及秋冬菜基地;水果产量居全国第三位[6],柑橘、芒果、柿子、火龙果、百香果等规模均居全国第一位[43];截止到2020年,全区拥有的中国特色农产品优势区数量位居全国前列[44]。
图1

图1
广西自然地理要素空间特征
Fig. 1
Spatial characteristics of physical geographical elements in Guangxi
1.2 数据来源
结合广西农作物类型特点,本文选取粮食、糖料、蔬菜和水果4类主要作物为研究对象,以2019年行政区划为基准,对研究期间行政区划发生变更的县域单元及其统计数据加以修正,并将同一地级市下的市辖区合并作为一个研究单元,得到84个基本研究单元。文中涉及的社会经济数据来源于相应年份的《中国统计年鉴》《广西统计年鉴》《广西农村统计资料》以及各地级市的统计年鉴、统计公报,部分缺失数据由中国县域农业农村经济数据库提供或由相近年份、相邻研究单元数据替代。高程和降水量数据来源于中国科学院资源环境科学与数据中心(
1.3 研究方法
1.3.1 区位基尼系数
借助区位基尼系数测度主要农作物生产的集聚程度[45],公式如下:
式中:Gj为农作物j的区位基尼系数;n是将各县域农作物产量由低到高排序,按县域数量均等分为n组,本文将84个县域分为12组,即n = 12;Wij是第i组农作物j的产量占全部县域农作物j总产量的比重。Gj的取值范围为[0, 1],其数值越大,表明农作物生产的集聚程度越高。
1.3.2 重心移动模型
采用重心移动模型测算不同年份广西主要农作物生产的重心坐标及其移动距离,计算公式为[46]:
式中:Mij表示i县域第j年某类作物的产量;(Xi, Yi)表示i县域的几何中心坐标;Xj和Yj分别表示第j年区域某作物产量重心的经、纬度坐标;D为j1年至j2年的重心移动距离;C为常数,取值111.111 km;(Xj1, Yj1)和(Xj2, Yj2)分别指j1年和j2年某作物产量的重心坐标。
1.3.3 比较优势指数
(1)规模比较优势指数(Scale Advantage Index, SAI),用于反映一个地区某种农作物生产规模的比较优势,计算公式为:
式中:SAIij为i地区j种农作物的规模比较优势指数;Sij为i地区j种农作物的种植面积;Si为i地区农作物总种植面积;Sj为高一级区域j种农作物的种植面积;S为高一级区域农作物总种植面积。若SAIij >1,表明i地区生产j种农作物具有规模比较优势,其值越大,优势越强;若SAIij<1,则具有规模比较劣势;若SAIij = 1,则与区域平均规模水平持平。
(2)效率比较优势指数(Efficiency Advantage Index, EAI),用于衡量一个地区某种农作物生产效率的比较优势,计算公式为:
式中:EAIij为i地区j种农作物的效率比较优势指数;APij为i地区j种农作物的单位面积产量;APj为高一级区域j种农作物的单位面积产量。若EAIij >1,表明i地区生产j种农作物具有效率比较优势,其值越大,优势越强;若EAIij<1,则具有效率比较劣势;若EAI ij = 1,则与区域平均效率水平持平。
(3)综合比较优势指数(Aggregated Advantage Index, AAI),用于测度一个地区某种农作物生产的综合比较优势,计算公式为:
式中:
1.3.4 农作物生产分区
依据各县域规模比较优势指数、效率比较优势指数和综合比较优势指数将主要农作物生产划分为如下6种区域类型(表1)。
表1 主要农作物生产分区标准
Tab. 1
| 级别 | 类型 | 类型名称 | 判断指标 | 基本特征 |
|---|---|---|---|---|
| 优势区 | Ⅰ类 | 均衡优势区 | SAI>1, EAI>1, AAI>1 | 同时具有规模比较优势、效率比较优势和综合比较优势 |
| Ⅱ类 | 规模主导优势区 | SAI>1, EAI<1, AAI>1 | 受规模比较优势主导而具有综合比较优势,无效率比较优势 | |
| Ⅲ类 | 效率主导优势区 | SAI<1, EAI>1, AAI>1 | 受效率比较优势主导而具有综合比较优势,无规模比较优势 | |
| 劣势区 | Ⅳ类 | 低效率劣势区 | SAI>1, EAI<1, AAI<1 | 具有规模比较优势,无效率比较优势和综合比较优势 |
| Ⅴ类 | 低规模劣势区 | SAI<1, EAI>1, AAI<1 | 具有效率比较优势,无规模比较优势和综合比较优势 | |
| Ⅵ类 | 绝对劣势区 | SAI<1, EAI<1, AAI<1 | 同时不具有规模比较优势、效率比较优势和综合比较优势 |
2 农作物生产格局演变特征及分区
2.1 农作物生产格局变化特征
(1)粮食作物“退”、糖果菜作物“进”构成全区主要农作物竞争的基本态势
如图2所示,1995—2019年全区粮食产量年均减少0.49%,粮食种植面积占农作物总种植面积的比重由58.63%降至36.92%;糖料生产经历1995—2008年的波动中快速增长以及2009—2019年的波动中有所回落两个阶段,产量年均增长8.05%,种植面积占比由7.27%上升至11.97%;水果生产呈持续快速增长态势,产量年均增长率高达34.47%,种植面积占比由8.03%上升至19.49%;蔬菜生产规模快速增长,产量年均增长7.47%,种植面积占比由8.90%上升至19.96%。粮食、糖料、水果、蔬菜产量的变异系数分别为0.05、0.33、0.58、0.31,水果产量变化程度最大;4类农作物种植面积占比的变异系数分别为0.12、0.26、0.20、0.22,糖料种植面积波动幅度最大。
图2
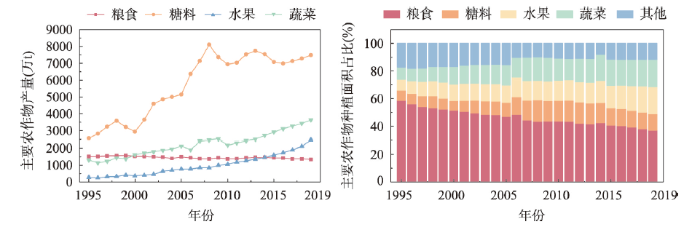
图2
1995—2019年广西主要农作物产量及种植面积占比变化
Fig. 2
Proportion changes of the yield and planting area of major crops in Guangxi from 1995 to 2019
(2)糖粮果菜生产重心发生不同程度迁移,其中水果移动幅度最大
依托ArcGIS 10.8平台测算主要时间节点的农作物产量重心及各时段移动距离(图3、表2)。结果表明,历年粮果菜生产重心均位于桂中偏东南方向,糖料生产重心位于全区偏西南方向。其中,粮食生产重心始终位于来宾市辖区内,总体向西北方向推移但迁移幅度相对较小,2010年以来移动速度略有加快,表明桂西北地区粮食生产贡献率有所提升;糖料生产呈“西进南移”态势,生产重心由宾阳县迁移至南宁市辖区,表明糖料生产高密度空间持续向桂西南地区集中;水果生产重心持续大幅度向北部迁移,移动轨迹呈倾斜的“Z”字型,尤以2000—2005年间迁移速度为快;蔬菜生产重心总体呈现向西南迁移趋势,其中2000—2010年间快速移动,2010年后趋于稳定。
图3
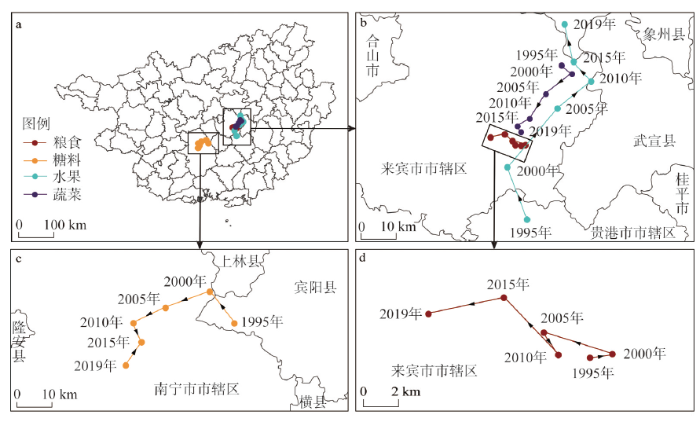
图3
1995—2019年广西主要农作物产量重心移动轨迹
Fig. 3
Trajectory of gravity center of major crops yield in Guangxi from 1995 to 2019
表2 1995—2019年广西主要农作物产量重心移动距离
Tab. 2
| 时段 | 粮食生产重心移动距离(km) | 糖料生产重心移动距离(km) | 水果生产重心移动距离(km) | 蔬菜生产重心移动距离(km) |
|---|---|---|---|---|
| 1995—2000年 | 1.36 | 11.37 | 17.45 | 4.13 |
| 2000—2005年 | 4.28 | 15.40 | 24.14 | 10.32 |
| 2005—2010年 | 1.59 | 10.51 | 13.49 | 9.22 |
| 2010—2015年 | 4.72 | 7.70 | 8.09 | 4.45 |
| 2015—2019年 | 4.56 | 8.65 | 11.97 | 2.13 |
| 1995—2019年 | 9.94 | 33.97 | 61.81 | 24.24 |
(3)粮食蔬菜生产空间分布相对分散,糖料生产趋向区域集聚,水果生产由相对集中走向分散
计算主要时间节点全区4类农作物产量的区位基尼系数(图4),并以1995—2019年县域主要农作物产量均值的0.5、1.0、1.5倍为临界值划分低产区、较低产区、中产区和高产区,分析其空间演变特征(图5)。结果表明:① 粮食生产空间分布相对稳定,地理集聚程度略有提高。高产区除在桂北部分县域零散分布外,集中分布于桂南和桂东南地区,南宁市辖区、桂平市、贵港市辖区、博白县、钦州市辖区、平南县、灵山县、全州县为稳定的产粮大县;低产区主要分布于桂西北、桂西南地区。② 糖料生产地理集聚趋势明显。1995—2019年区位基尼系数总体上升,产量位居前十县域的生产量占全区糖料总产量的比例由49.84%上升至62.76%。高产区在桂中、桂南和桂西南地区连片分布,南宁、崇左、贵港、来宾等市辖区及扶绥县、柳城县为稳定的糖料集中产区,随着高值区向外围县域扩散,逐步形成“两头大、中间小”的极化分布格局,即高产区、低产区广泛连片分布,中产区、较低产区相对较少。③ 水果生产空间扩散明显,地理集中性由强转弱。2005年后区位基尼系数持续下降,位居前十县域的生产量占全区水果总产量的比例由52.54%下降至44.32%。高产区由桂南地区集聚分布扩展至桂南、桂东、桂中、桂北地区连片分布,形成“大分散、小集聚”的空间格局;低产区集中分布于桂西部分地区。④ 蔬菜生产空间扩散明显且分散性趋势渐强。高产区由在各市辖区及周边县域零散分布逐渐向四周广泛拓展,其中桂南和桂东地区分布范围最广;低产区集中于桂西北、桂西南部分地区。
图4
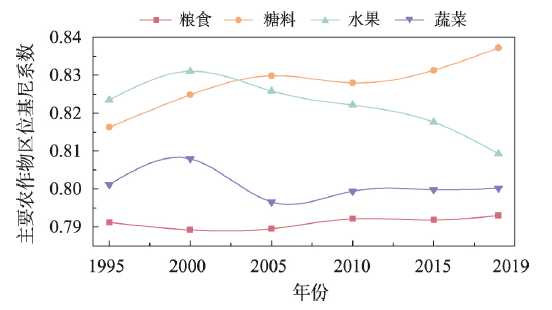
图4
1995—2019年广西主要农作物产量区位基尼系数
Fig. 4
Changes of Gini coefficients of major crops yield in Guangxi from 1995 to 2019
图5
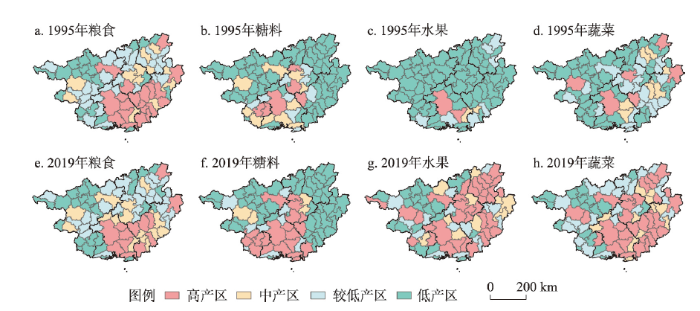
图5
1995年和2019年广西主要农作物产量分布格局
Fig. 5
Spatial pattern of major crops yield of Guangxi in 1995 and 2019
(4)粮食生产劣势地位明显,糖料具有绝对规模比较优势且效率优势呈波动变化,水果、蔬菜规模比较优势突出但效率有待提升
计算1995—2019年全区4类农作物生产在全国范围内的比较优势指数,结果表明(图6):粮食SAI、EAI始终低于1且持续走低;糖料生产具有绝对规模比较优势,2006年后SAI稳定在13~14之间,EAI位于1.05~1.29且呈下降趋势;水果生产规模比较优势显著,SAI由1.39逐年上升至2.44,2000年以来生产效率逐步提升,2019年EAI接近1;蔬菜生产规模比较优势明显且相对稳定,SAI在1.28~1.76之间,但EAI低于1。就综合比较优势而言,粮食生产处于劣势地位,AAI始终低于1;糖料生产在全国具有较强竞争力,AAI在2.86~4.01之间;水果成为极具优势潜力的农作物,AAI在1.09~1.54区间变动;蔬菜比较优势有待提升,AAI在0.88~1.14之间。25年间主要农作物的AAI与SAI变化趋势保持高度一致,表明全区主要农作物生产综合比较优势受规模比较优势主导。
图6
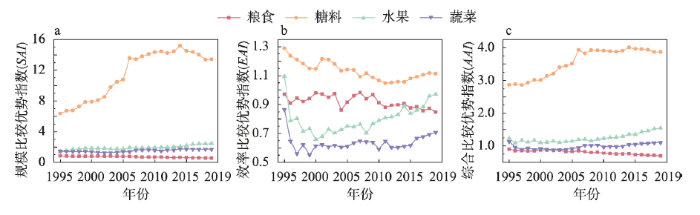
图6
1995—2019年广西主要农作物生产比较优势变化
Fig. 6
Changes of comparative advantages of major crops production in Guangxi from 1995 to 2019
2.2 农作物生产分区
图7
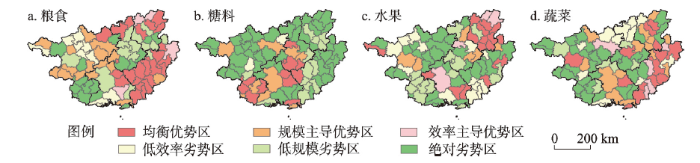
图7
2019年广西主要农作物生产类型划分
Fig. 7
Regional types of major crops production in Guangxi in 2019
(1)粮食。粮食生产优势区涉及44个县域,集中分布于桂东南、桂东北和桂西部分地区。其中,均衡优势区包括陆川县等24个县域,综合优势指数排名前十位的县域中有8个集中分布在桂东南地区;规模主导优势区包括16个县域,主要分布于桂西地区;效率主导优势区包括灵山县等4个县域。粮食生产劣势区在桂西南和桂中地区分布范围最广,其中低效率劣势区主要分布于河池市等地的10个县域,低规模劣势区包括14个县域,绝对劣势区涉及16个县域。
(2)糖料。糖料生产优势区共涉及21个县域,连片分布于桂中、桂南和桂西南地区。其中,均衡优势区包括12个县域,主要分布于崇左市以及来宾市、南宁市和贵港市的交界地带,综合优势指数排名前四位的宁明县、龙州县、大新县、扶绥县均位于崇左市;规模主导优势区涉及9个县域,与均衡优势区连片分布。全区75%的县域为糖料生产劣势区,低效率劣势区包括2个县域,低规模劣势区包括13个县域,绝对劣势区涉及48个县域。
(3)水果。水果生产优势区涉及26个县域,主要分布于桂北地区以及桂东、桂南、桂西部分地区。其中,水果生产均衡优势区包括恭城瑶族自治县等16个县域,综合优势指数排名前三位的恭城瑶族自治县、平乐县和阳朔县均位于桂林市;规模主导优势区包括金秀瑶族自治县等6个县域;效率主导优势区包括南宁市辖区等4个县域。全区69.05%的县域为水果生产劣势区,其中低效率劣势区涉及13个县域,低规模劣势区集中分布于桂西南和桂中的15个县域,绝对劣势区涉及30个县域。
(4)蔬菜。蔬菜生产优势区涉及33个县域,呈现在桂南、桂东、桂北地区集中分布以及在桂西地区零散分布的格局。其中,均衡优势区共计14个县域,在桂北和桂东地区形成了一条南北向的蔬菜生产优势带;规模主导优势区涉及东兴市等14个县域;平南县等5个县域为效率主导优势区。全区60.71%的县域为蔬菜生产劣势区,其中低效率劣势区涉及12个县域,集聚分布于桂西北、桂中北部地区,低规模劣势区零散分布于6个县域,绝对劣势区涉及33个县域。
3 农作物生产格局演变机制
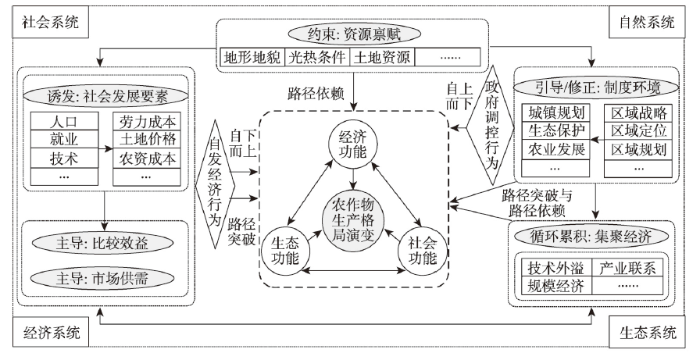
农作物生产是在一定自然资源禀赋支撑下通过投入生产要素促进生物有机体发育以获取植物性产品的过程,是由水、土、气、资本、市场、劳动力、科技、政策等多种要素相互作用形成的具有一定功能的自然—社会—经济—生态复合系统。自然再生产和经济再生产 [49]的有机交织,使农作物生产呈现出提供国民经济建设基础产品、增加生产主体收入的经济功能,承载就业和社会保障、满足基本生活资料需求、维护社会稳定、传承农耕文化的社会功能,以及水源涵养、水土保持、气候调节、有害物质降解的生态功能。在经济、社会、生态功能引领下,系统内部各要素相互作用及其不断与外界进行物质和能量交换,推动区域农作物生产规模、结构和空间分布的动态变化(图8)。
图8
(2)市场供需和比较效益的主导作用。1995—2019年中国食物消费结构发生重大变化,人均年粮食需求量在粮果菜总需求量中的比重由57.18%下降到36.31%,人均年水果、蔬菜需求量分别由31.57 kg、148.43 kg上升到102.02 kg、380.92 kg[51];同期平均每亩(1亩 ≈ 666.7 m2)稻谷的物质与服务费用、人工成本分别由215.47元、138.70元上涨至526.48元、474.20元,而利润率则由79.48%下降至1.65% [52]。市场需求和比较效益主导下生产经营主体基于经济理性调配生产要素向边际生产效率较高的部门流动[50],引起不同类型农作物生产规模的消涨及空间的收缩与扩张,研究期间全区72.62%的县域粮食产量出现减少,水果和蔬菜产量增加的县域分别占97.62%和95.24%。同时,区域农作物生产受国内外市场供给影响,近年来国际糖价低迷、食糖进口量激增背景下,广西糖料作物生产规模产生波动变化。
(3)乡村社会发展要素变化的诱发作用。劳动力、土地、技术是影响农作物生产的重要要素,城镇化进程中传统乡村社会发展要素的变化以及新因素的注入诱发农作物生产要素的相对价格发生变化,引起农作物生产结构的调整和生产区位的迁移。如上所述,比较效益主导下广西粮经生产结构发生趋势性变化,而其背后蕴含着乡村劳动力流失、就业结构变化、技术进步及其引起的劳动力成本、农资成本上涨等综合影响。同时,农业机械化推广带来的劳动替代效应、土地权属关系转换下生产规模的变化以及不同区位劳动力价格和土地利用价值的异质性,导致农作物生产成本—收益的区域差异,进而引起农作物生产区位的空间变化,以上要素投入与产出的复杂传导关系使得全区糖料生产呈“西进南移”态势,生产高密度空间持续向地形条件、土地和劳动力价格具有优势的桂西南地区集中。
(4)制度环境的引导/修正作用。政府基于维护社会经济稳健运行和资源持续利用的公共职能制定的区域发展战略、发展定位以及在此指导下实施的城镇规划、生态保护政策等对农作物生产格局演变产生引导作用。同时,农产品具有公共产品的特殊属性,各级政府基于社会发展需求和市场供需变化等综合实施的农业发展政策,对资源禀赋约束和经济理性主导下的农作物生产格局产生引导/修正作用。如广西果菜作物的规模扩张与近年来鼓励发展反季节蔬菜、绿色无公害蔬菜、亚热带水果的种植结构调整政策密切相关,在保障国家粮食安全战略指导下实施的系列约束性政策和激励性政策一定程度上确保了区域粮食生产格局的稳定性,而产业结构调整背景下国家蔗糖产业的优化布局和扶持政策对广西糖料作物的快速发展发挥了重要引导作用。
综上,区域农作物生产格局演变是资源禀赋约束下自发经济行为、政府调控行为以及集聚经济发展综合作用的结果,其中市场供需和比较效益主导下重新配置生产要素的自发经济行为构成农作物生产格局变化的根本动力,其背后折射着人口、就业、技术等乡村社会发展要素变化及其引起的劳动比较效益、土地利用效益和生产要素投入—产出变化的复杂传导关系。农作物生产格局演变既遵循和依赖于资源禀赋约束下区域原有的种植惯例,又在新因素、新力量的注入中不断打破原有发展路径,发生结构变化和空间区位迁移。全球化背景下全球、国家、地方不同尺度多种因素的加入,自上而下与自下而上多种力量的干预,更加剧了区域农作物生产格局演变机制的复杂性。
4 农作物生产格局优化建议
当前广西主要农作物综合比较优势受规模优势主导,总体上效率比较优势不突出,亟需通过优化生产要素配置推进农作物生产转型升级。作为地形条件复杂、生态环境脆弱、社会经济相对落后的特殊类型地区,广西农作物生产格局优化应统筹经济功能、社会功能和生态功能,既要兼顾水土光热资源禀赋的适宜性,又要协调不同区域、不同群体、不同层面的利益需求。基于对广西农作物生产格局演变特征及其形成机制的认知,提出如下建议:
(1)合理安排粮经结构比例,优化粮食作物生产布局。从全国层面看,广西粮食生产处于劣势地位,果菜生产规模比较优势突出,粮“退”、糖果菜“进”构成全区主要农作物竞争的基本态势。作为国家划定的11个粮食产销平衡区之一,广西农作物生产需协调履行粮食安全政治责任、满足地方经济发展诉求及提高农民收入的关系,基于对全区粮食供需的科学测算,构建适应于国情、区情和农情的粮经结构比例,在确保口粮绝对安全的前提下,大力发展特色种植业。同时,针对当前乡村社会经济系统变化诱发粮食作物比较效益下降以及生产动力不足的现实,亟需发挥技术替代效应和规模效益优势优化粮食作物生产布局。一方面基于资源禀赋和发展基础通过高标准农田营建、中低产田改良、农田水利配套、农业机械化推广、土地流转等进一步提升桂东南、桂北等粮食优势主产区的生产效能,重点开展优质品种攻关等关键技术集成应用和优质稻生产基地建设,推动粮食生产从高产向优质转变;另一方面,基于资源环境承载力适当调减桂西等部分生态脆弱区的粮食生产规模,以新的食品安全观为指导鼓励当地利用气候、地形等资源禀赋发展特色种植业。
(2)加强产业集聚,促进糖料作物提质增效。广西是国家糖料蔗生产主产区,糖料作物生产在全国具有绝对规模比较优势,研究期间生产重心向西南方面移动,生产地域集中性不断增强。然而,受糖料蔗品种研发滞后、全程机械化推进慢、基础设施薄弱等因素制约[42],糖料蔗种植成本较高,单产与巴西、澳大利亚等国家相比存在较大差距[54],对稳定种植规模和提升产量造成不利影响。服务于保障食糖供给安全的国家战略,糖料作物的持续发展一方面需加强土地工程、生物工程、遥感与信息等关键技术支撑,通过实施蔗地整治、土壤改良、良种繁育、病虫害生物防治、水肥一体化等工程技术,提升“双高”基地的规模化水平、良种覆盖率和综合机械化率,以降本增效、稳定糖料蔗生产能力;另一方面需发挥集聚经济的上下游联系、知识溢出和衍生效应,推进蔗糖新产品研发、生产和精深加工、产业链延伸、高附加值产品转化以及物流、信息化配套等在优势主产区集聚发展,以培育糖料作物生产的新动能[55]。
(3)以调整品种和品质结构为重点,提升果菜作物生产效益。广西拥有四季均可生产时令果菜的气候优势,近年来全区果菜作物生产空间扩张明显,然而水果生产面临部分传统品种结构性过剩与季节性过剩问题,蔬菜生产空间布局分散、效率优势有待提升。应对逐渐加剧的竞争态势,水果生产需基于对周边国家和地区生产特点的分析,在稳定传统优势品种基础上,适当调减香蕉、柑桔等大宗水果生产规模,并利用各地生态小气候开发时令优稀水果,形成区域互补的品种结构和早中晚搭配的熟期结构。针对蔬菜生产效率比较优势不足的问题,亟需依据资源禀赋和种植传统明确不同区域生产定位,形成由城市郊区蔬菜、名优蔬菜、秋冬蔬菜、夏季桂西北高山蔬菜等构成的合理的区际分工和周年相对均衡的应市格局。同时,应对消费市场对品质不断提升的需求,应基于生产过程监管、生态种植技术推广、生产标准体系和质量追溯体系建设等推动果菜作物生产向绿色、安全、优质转变。此外,果菜市场需求不稳定、价格波动大以及不耐储藏的特点决定了大规模扩张可能带来产业发展的风险,应突出重视农产品初加工和精深加工及保鲜、储藏等后向性产业配套建设。
5 结论与讨论
5.1 结论
(1)粮“退”、糖果菜“进”构成广西主要农作物竞争的基本态势;主要农作物生产重心发生不同程度迁移;粮食蔬菜生产空间分布较为分散,糖料生产区域性强且集聚趋势明显,水果生产由相对集中走向分散;全区主要农作物综合比较优势受规模比较优势主导,粮食生产劣势地位逐渐强化,糖料具有绝对规模比较优势和综合比较优势,水果、蔬菜规模比较优势突出但效率有待提升;粮食生产优势区集中分布于桂东南、桂东北和桂西部分地区,糖料生产优势区连片分布于桂中、桂南和桂西南地区,水果生产优势区主要分布于桂北地区以及桂东、桂南、桂西部分地区,蔬菜生产优势区呈现在桂南、桂东、桂北地区集中分布以及桂西地区零散分布的格局。
(2)农作物生产系统是由多种要素相互作用形成的具有经济功能、社会功能和生态功能的复合系统。资源禀赋的约束、市场供需和比较效益的主导、乡村社会发展要素变化的诱发、制度环境的引导/修正、集聚经济的循环累积等多种力量综合作用,推动区域农作物生产的规模、结构和空间分布发生动态变化。
(3)特殊的区情决定了广西农作物生产应统筹经济、社会和生态功能,通过合理安排粮经结构比例、优化粮食作物生产布局、加强糖料作物集聚发展、调整果菜作物品种结构和品质结构等,推进农作物生产从规模扩张向综合效益提升转型。
5.2 讨论
基于不同空间尺度探究地理事物的过程格局是地理学的研究特色,本文选取农业地理学的传统研究主题,以县域为基本单元开展广西主要农作物生产格局演变及形成机制的实证研究。本文的价值在于丰富了广西案例区研究,弥补了已有从单一作物视角开展相关研究未能揭示不同类型农作物竞争态势的缺陷,以及以省域或地级市为基本单元未能细致刻画案例区农作物生产空间异质性的不足。基于对农作物生产系统内涵及其演变机制的理论思考而提出的相关建议,可为广西农作物生产要素的宏观优化配置提供决策参考。已有以广西为研究区得出的结论,如农作物种植粮经比下降[39]、糖料生产具有绝对规模优势和综合优势[56]、水果生产相对集中于桂林、南宁和钦州市[57]等,与本研究结论基本一致。由于计算指标的差异,本研究对蔬菜生产综合比较优势指数的判断低于于丽艳等[58]的研究结果。由于数据获取所限,本文以粮食、糖料、水果、蔬菜4类农作物大类为研究对象,然而现实中不同小类作物(如柑橘、龙眼等)的产量、种植面积均具有一定特殊性,以上可能导致本研究在类型精度方面略有欠缺。农作物生产结构调整和布局优化是一个宏大的命题,切实可行的优化路径提出需以对生产要素配置状况、配置模式等的深入研究为依据,未来将选取典型农作物类型,聚焦优势区域,围绕生产布局与区域资源环境的匹配性、不同经营模式对农民增收的效应、特色种植业的扩散过程机理与转型模式等主题开展实证研究,从而为指导广西农作物生产优化布局提供更扎实的科学依据。
参考文献
The changes of grain output center of gravity and its driving forces in China since 1990
Grain security is a considerable challenge to the world in the 21 century, especially to China. The pattern of grain-output has changed greatly since the reform of the grain market, the accelerating urbanization and fast industrialization. In this paper, the model for the center of gravity of grain-output was built, and the change of grain-output pattern was analyzed from 1990 to 2005 with the model. The results showed that: 1) from 1990 to 1998, the grain-output center-of-gravity moved towards northeast at the speed of 7.6 km/year. In total, it moved 60.8km northward and 6.4km eastward; 2) In the period of 1998 to 2003, the grain-output center-of-gravity moved towards southwest at a speed of 16 km/year. Therefore, it moved 63.8km southward and 48.1km westward in all; 3) In the last period of 2003 to 2005, the grain-output center-of-gravity moved back to northeast at the speed odf 41.2 km/year. In other words, it moved 82.3 km northward and 46.8km eastward in all; 4) During the entire period of 1990 to 2005, the grain-output center-of-gravity moved remarkably from the south and east to the north and west of China, and the moving speed of grain-output center-of-gravity was increasing. Therefore, it can be summarized that the regional grain growth was unbalance, and the spatial patterns of the advantageous regions of grain-output were unstable. The driving mechanism for the changes of grain-output center-of-gravity was discussed from different aspects, including resources, economy, technology, and relative policies. Firstly, the movement of grain-output center-of-gravity was based on the spatial pattern of farmland and its changing tendency. Secondly, the key factor for the changes of grain output center-of-gravity is the development and utilization of groundwater in north China, while the direct cause for it is the adjustment of food consumption structure. Thirdly, the technology advancement, the imbalanced development of rural economy, and regional policies to support grain production are the driving forces for the movement of grain-output center-of-gravity since 1990. In the end, the effects of such change or movement were discussed. The changes of grain-output center-of-gravity have aggravated droughts in north China, reduced the agricultural land-use productivity, worsened the imbalance of regional economy, and altered the commercial flows of grain products.
1990年至2005年中国粮食产量重心演进格局及其驱动机制
通过构建粮食产量重心模型,定量分析了1990年~2005年中国粮食生产时空格局演进过程。结果表明:中国粮食产量重心呈现出“北上西进”的态势,粮食产量重心移动的速率不断增大,粮食产量增长的空间波动性逐渐增强,产量优势区的空间格局尚不稳定。从资源、经济、技术、政策等方面深入剖析了粮食产量重心移动的驱动机制。耕地资源的空间格局及其变动趋势是驱动粮食产量重心移动的客观基础,北方地下水资源开发利用是粮食产量重心移动的关键因素,食物消费结构变化是粮食产量重心移动的直接因素,科技进步、农村经济发展不平衡以及区域化的粮食支持政策是粮食产量重心移动的重要驱动力量。最后探讨了粮食产量重心移动的区域环境、经济及社会效应。
Understanding issues regarding food security and rising labor costs
正确认识粮食安全和农业劳动力成本问题
China's food security situation and strategy under the background of opening-up
DOI:10.31497/zrzyxb.20210620 URL [本文引用: 1]
对外开放背景下中国粮食安全形势研判与战略选择
Evolution of food consumption structure and agricultural development strategy in China
中国食品消费结构的演进与农业发展战略
Dietary structure upgrade of China's residents, international trade and food security
DOI:10.31497/zrzyxb.20210609 URL [本文引用: 1]
中国居民膳食结构升级、国际贸易与粮食安全
Preliminary discussion on regionalization of national agricultural present situation
全国农业现状区划的初步探讨
DOI:10.11821/xb196304001
[本文引用: 1]

过去一个时期,在农业布局和农业区划的研究工作中,常常过多地强调对远景方案或建议的拟定,相对地忽视了对农业现状和发展条件的研究,从而工作成果总不免带有一些主观臆断成分,科学根据不足,实践意义和科学意义都很有限。
Recent study on agricultural geography and land use in China
DOI:10.11821/xb199002003
[本文引用: 1]
For the past 10 years, besides having made public quite many works dealing with regional agricultural geography and going on with agricultural resources survey and agricultwral region-alization, much has been done in an even more extensive scope including researches on land re-sources and land utilization and crop distribution. Among furthermore studies are the strategy of agricultural development and other relevant topics. 1. Compilation of the regional geographical series, a total of 22 monographs including the general volume and the separate volwme were published one after another. This series of works reflects systematically what has been achieved in the studies of agro-geography in this country. 2. Agricultural regionalization is one of research topics in the geographical sciences, more personnel have been sent successively into the giant task from nearly all of the geographical in-stitutions and the geographical departments in to the universities across the country and more pro-fessional papers and reports. More related professional papers pertinent to theories and methods in regionalization have come out in the geographical periodicals under the sponsorship of va-rious institutions. 3. Studies on the strategy of agricultural development. Quite a number of papers on agri-cultural development strategy have come out in the geographical journals. 4. Studies on the allocation of agricultural production. Geographers have played outstand-ing role for the government department in formulating long range planning and regulating argricultural production infrastructure. 5. Studies on land utilization. Summarized into the following three aspects: the drawing of 1:1 000 000 land utilization map; studies 0n the development, utilization and protection of land resources; studies on land resources and utilization in mountainous area.
中国农业地理和土地利用的近期研究
DOI:10.11821/xb199002003
[本文引用: 1]
近十余年来,中国农业地理与土地利用的研究主要在以下方面:农业地理丛书的编写,完成了中国农业地理总论和21部分省(自治区、直辖市)的农业区域地理著作;承担全国综合农业区划、自然区划、农业各部门与农业技术条件区划,进行了农业区划理论与方法的研究;对农业发展战略与我国人口、资源与环境的国情研究;为促进农业生产稳定发展,以因地制宜为原则进行农业各部门生产布局研究;1/100万土地利用图与土地资源开发、利用和保护的研究。上述研究是持续而广泛的,在理论上和实践上都取得了很大进展。
Geographical agglomeration and specialized pattern of planting in China based on the different classifications
DOI:10.11820/dlkxjz.2012.08.010
[本文引用: 1]
There has been less current literature on the pattern of Chinese agricultural geographic concentration and specialization. This paper discusses the geographic concentration pattern of China's planting in 2008. Through calculating the average Gini coefficient (0.46,0.66 and 0.68, respectively), the average Moran’s I index (0.11,0.18 and 0.20, respectively ) and the Location quotient (LQ ) in the three scale classifications at the provincial level, it is found that the planting in China presents certain geographic concentration and exposes different agglomeration degree at different levels of industrial classification. And the finer division of planting industry, the more obvious the trend of spatial concentration and specialization of production. At the macro-planting level, the distribution of crop production is relatively dispersed, while at the micro-planting level, the distribution of crop production shows the trend of more agglomeration and specialization. The regional specialized production pattern in Chinese planting has emerged. The regional specialized degree of the staple crops is low, and that of the commercial crops is relatively high. Although the specific pattern of spatial concentration is determined by the matching between the natural conditions and production conditions of various crops, the government decision-making, institutional changes and other social factors plays an important role in regional specialized production functioning as the optimization and adjustment to the natural gathering. So, by calculating the spatial autocorrelation and the Gini coefficient, specialized index in various types of crops grown in contiguous spatial patterns, the potential location of the agricultural regional specialization and large-scale production can be identified, which can help the government make specific agricultural policies in different regions.
2008年中国种植业地理集聚与专业化格局
Agglomeration and geographic pattern of agricultural industry in northeast China
东北地区农业产业地理集聚格局研究
Spatiotemporal evolution of rice production geographical agglomeration in Chongqing based on spatial statistics
基于空间统计的重庆市水稻生产地理集聚时空演变
Spatio-temporal changes in Chinese crop patterns over the past three decades
DOI:10.11821/dlxb201605012
[本文引用: 2]
The study aims to investigate the spatio-temporal changes in crop patterns in China since 1980. In doing so, the analysis methods of time-series trend and spatial cluster were used to cover the major eleven crops at county scale. The results indicate that (1) There are 16 kinds of crop combinations ranking in the China's top 10 during the past 30 years. Yet since 2002, the simplified cropping structure has been gradually replaced by the multiple cropping structure, which suggests an increase in the diversity index of crop patterns. In 1980, about 82.7% of China's counties have a similar crop pattern which is composed of rice, wheat, corn and their combinations, however, this pattern largely changed after 2002 due to the increase in the planting area of fruit and vegetables. (2) In the same period, rice planting area of 47% of the counties, wheat planting area of 61% of the counties of and corn area of 29.6% of the counties experience a significant decrease, while other crops show an increasing trend. As a result, rice-dominated cereal crops in China are slightly adjusted to the coexistence of rice, wheat and maize crops. In particular, maize area proportion shows a significant change, which forms a so-called "corn decreased belt” spanning from northeast to southwest of China. Urbanization had an important impact on crop patterns as fruit and vegetable planting areas rapidly grow so as to meet the increasing demands in urbanized areas. (3) Crop patterns also show an obvious spatial cluster effect in China's 1300 counties. The proportion of high cluster accounts for 2.86%, 5.64%, 6.11%, 4.53%, 1.62%, 7.77%, 8.24%, 12%, 10%, 1.41% and 9.35% of China's counties for rice, wheat, maize, soybean, fibers, cotton, vegetables, potatoes, fruits, sugars and oils, respectively. These crops are distributed in Northeast China, Xinjiang, Northern Shaanxi Plateau, Yunnan-Guizhou Plateau and the metropolis areas. This finding of this study can support the decision making in agricultural restructuring and adaptation to climate change.
近30年中国农作物种植结构时空变化分析
DOI:10.11821/dlxb201605012
[本文引用: 2]
综合运用时序变化趋势、空间集聚分析等方法,从种植结构类型和种植比例变化趋势分析了1980年以来中国县域种植结构的时空特征。结果表明:① 近30年来中国前10位的种植结构类型有16种,2002年后多元种植结构逐步替代单一型种植结构。粮食作物占优的单一种植结构类型呈逐年递减趋势,其中1980年全国82.7%的县级农业种植结构是水稻、小麦、玉米及其组合种植类型,2002年后的果蔬类型增加改变了种植结构格局。② 全国种植县中有47%的水稻、61%的小麦和29.6%的玉米的种植比例显著减少,其他作物呈现增加趋势。粮食作物由以水稻为主的格局调整为水稻、小麦和玉米共存格局,其中玉米种植面积比例在空间上变化最为显著,在中国形成北东—西南向的“玉米减少带”。种植结构调整热点的城市地区,城市化对种植结构变化影响显著,水果和蔬菜类种植比例在城市化地区快速增加。③ 种植结构变化趋势在1300个县形成空间集聚效应,水稻的高高聚集占全国县数的2.86%、小麦占5.64%、玉米占6.11%、大豆为4.53%、麻类为1.62%、棉花占7.77%、蔬菜占8.24%、薯类占12%、水果占10%、糖料占1.41%、油料占9.35%,主要分布于中国东北、新疆和沿海的城市化地区。
The regional differences and transformation and upgrading of production structure of crop farming in Yangtze River Basin
长江流域种植业生产结构的区域差异及转型升级
Changes of crop farming and policy implications in Chongqing Municipality from 1978 to 2011
Based on Chongqing Municipality,a grain production and marketing balance area in China,we used statistical data and semi-structured interviews to study changes,reasons of crop farming and policy implications over the last 30 years (1978-2011). The results indicate that during the last 30 years changes in crop farming were a kind of competitive situation with contraction of grain and expansion of vegetables and fruits;regional planting patterns changed from ‘dominated by grain’ to ‘give consideration to both grain and vegetables,fruits’;and crop farming realized efficiency. Changes in crop farming in Chongqing Municipality were a result of the combined action of various factors. For the whole process,the starting point of changes was from the liberation of farmer autonomy,the change condition was environmental change induced by all kinds of factors,and the basis of change was from different characteristics of crops. To ease the competitive situation,safeguard the self-sufficiency rate of grain,and improve the yield and quality of vegetables and fruits,methods include defining the redline of the grain sown area,shifting the planting patterns of grain,speeding up mechanization and installation,and the specialization of vegetables and fruits. To improve cultivated land use efficiency,based on Chongqing’s experience we suggest agricultural policies in grain production and marketing balance areas that transform the direction of agricultural policy from ‘One Focus’ (focusing on the grain production)to ‘Two Combinations’. One combination is the transfer of agricultural labor force and the capitalized agriculture of labor-saving,and the other is to maintain grain output stabilization and develop agricultural resource advantages and diversification.
1978—2011年重庆市种植业变化及其政策启示
在粮食连年增收的同时,粮食产销平衡区却成为中国粮食安全战略的软肋。本文以粮食产销平衡区重庆市为研究区,利用统计数据和半结构访谈信息,构建种植业变化影响因素灰色关联多维分析模型,研究了1978-2011年重庆市种植业的变化及其政策启示。结果表明,①1978-2011年重庆市种植业变化呈现粮食作物收缩、菜瓜果作物扩张的竞争态势,区域种植模式从“以粮为主”转变为“粮菜兼顾”,实现了转型增效;②重庆市种植业变化特征是各类因素综合作用的结果,是以农户经营自主权放开为起点、各类因素诱致的环境变化为条件、作物的不同特性为依据发展演化而致的;③划定粮食生产红线、转变粮食作物种植模式、加快菜瓜果作物生产机械化、设施化、专业化步伐,是重庆市缓解粮食作物与菜瓜果作物竞争态势,保障粮食自给率稳定和菜瓜果产量、品质持续提升的有效途径和办法。基于重庆的经验,研究认为,粮食产销平衡区的农业政策方向有必要从“一个专注”(专注于粮食生产)向“两个结合”过渡,将合理引导农业劳动力转移与推广节约劳动的资本化农业相结合、稳定粮食生产与促进农业资源优势发挥和多元化发展相结合作为着力点,推动耕地资源集约高效利用。
Spatial evolution and specialization division of county crops production in Henan province
河南省县域农作物生产空间格局演变及专业化分区研究
Analysis of the evolution path and mechanism of China's agricultural agglomeration and geographic pattern
DOI:10.11821/yj2012050012
[本文引用: 4]
There have been few studies on the pattern of China's agricultural geographic concentration and mechanism of its evolution.Based on the calculation of barycenter coordinates,Gini coefficient,as well as spatial autocorrelation and specialization index of 12 crops in 1981-2008 in China,this paper analyses the spatial pattern and mechanism of agricultural agglomeration.It presents the following results.(1) Spatial concentration of China's planting gradually increased.At the same time regional specialization and regional diversification progressively strengthened.(2) China's planting transferred from the eastern provinces to the central and western provinces,for example,although the Sanjiang and Songnen plains were still important clustering areas,the significance of the former land of fish and rice gradually decreased.(3) Although the endowment of natural resources made the initial agricultural geographical pattern,the path creations caused by an accidental event or social variation revealed two important facts: opened the windows of local opportunity for the social agglomeration,and corrected and optimized the existing patterns of the natural agglomeration continuously.With the emergence of new enterprises or departments,the division of labor and their cooperation network arose,and the agricultural industrial clusters formed.If several paths were created simultaneously from different crops in different places,an organic and sustainable agricultural production system would form in the whole area.So,the evolution of agricultural geographic pattern experienced a process from the natural agglomeration to the social agglomeration with a perfect agricultural production system.In this process,the natural agglomeration plays a less important role than the social agglomeration.Technology and institution innovations would speed up the agricultural geographic concentration and spatial reconstruction.
中国农业地理集聚格局演化及其机制
Geographical agglomeration of plantations in China: Spatial and temporal characteristics, changing trends and influencing factors
中国种植业地理集聚: 时空特征、变化趋势及影响因素
Geographical agglomeration of crops and its evolutionary mechanism in Henan province during 1989-2009
DOI:10.11820/dlkxjz.2013.08.007
[本文引用: 1]
Taking 17 types of crops in Henan Province as an example, this paper analyses the geographical agglomeration and specialized level of crops from 1989 to 2009. Based on evolutionary economic geography, an analytic framework of "Stability-Variation-Selection-Adaption" was established to explain the crops' spatial agglomeration and its evolutionary mechanism. The results indicate that agglomeration of crops is low and in slow growth, especially for the general crops; rice has the highest level of clustering, which has a great impact on the whole agglomeration level of crops. Levels of agglomeration and specialization of the economic crops are higher than the food crops, and their distribution patterns are relatively stable, still concentrated in the initially favorable areas. Specialized level of vegetable crops is low, and their spatial distributions are dependent on the urbanization level of each city. Fruit crops constantly concentrate in the western mountainous area of Henan Province, especially Sanmenxia City, and some fruit crops, such as grapes and peaches, appear to be in a decentralized trend. The municipal differentiation degree of crops is low, and the pattern of division and specialization has just emerged.
1989—2009年河南省农作物地理集聚及其演化机制
DOI:10.11820/dlkxjz.2013.08.007
[本文引用: 1]
以河南省17 种农作物为对象,采用1989-2009 年的地市级数据,对农作物的集聚特点、专业化格局及其演化机制进行分析。研究结果表明:河南省农作物的集聚水平低且整体增长缓慢,尤其是遍在农作物;部分农作物有分散化的趋向,而水稻的集聚程度一直很高,较大程度上影响了河南省农作物整体的集聚水平;经济作物的集聚与区域专业化程度均高于粮食作物,且分布格局变化不大,仍集聚于研究时段初始时的优势区域;蔬菜类作物专业化程度较低,其空间分布与城市化水平高度相关,不断向郑汴地区集聚;水果类作物不断向豫西山地尤其是三门峡市集中,而部分水果类作物如葡萄、桃等则出现分散化的趋势。总体来说,各市域间农作物结构相似度高,分工与专业化生产初现雏形。在此基础上,构建了基于演化经济地理学的“稳定—变化—选择—适应”过程分析框架,对河南省农作物集聚与专业化格局的形成演化机制进行阐释。
Spatio-temporal pattern variation and safety evaluation of crops in Hebei province
DOI:10.13249/j.cnki.sgs.2018.08.014
[本文引用: 1]
It is of great significance to clarify the characteristics of temporal and spatial patterns of grain crops in china.Based on the agricultural data of Hebei province in the past 15 years (2001-2015), this paper uses the segment linear trend and the production index-output fluctuation coefficient to analyze the temporal and spatial characteristics of the main grain crops in Hebei Province, and food security in hebei province is evaluated.The results show that the trend of the main grain crop in Hebei Province has experienced two periods from fluctuation to steady growth in the past 15 years, and the trend of change is significant. From the point of view of the change of spatial pattern, the law of the gradual decline from south to north shows that the distribution of different crops is different; From the point of view of food security, the grain fluctuation coefficient of more than 70% in Hebei Province exceeded the national average level, the grain fluctuation coefficient was bigger and the food security risk was higher. However, from the perspective of per capital grain production, the safety level is relatively optimistic, food security situation is becoming stable. This study can provide the basis for the optimization of grain and material production in Hebei Province, the structural adjustment and the coordinated development of social economy.
河北省主要农作物生产时空格局变化特征及安全评价
DOI:10.13249/j.cnki.sgs.2018.08.014
[本文引用: 1]
阐述主要粮食作物的时空格局变化特征,对中国粮食安全决策意义重大。基于河北省县市近15 a (2001~2015年)的农业数据资料,采用分段线性趋势以及生产指标-产量波动系数来分析河北省主要粮食作物的时空变化特征,并对河北省粮食作物进行安全评价。结果表明:从产量与播种面积来看,近15 a河北省主要粮食作物变化趋势经历了由波动减少到稳步增长2个阶段,且变化趋势显著;从空间格局变化来看,大致呈由南向北逐渐递减的规律分布,其中不同农作物分布规律各有差异;从粮食安全方面来看,河北省70%以上年份粮食波动系数均超过中国粮食安全平均水平,粮食波动系数较高,粮食安全风险较大;但从人均粮食产量来看,安全程度相对比较乐观,粮食安全状况渐趋于平稳。研究可为河北省粮食生产时空布局的优化、结构调整与社会经济协调发展提供依据。
Current situation of cultivated land utilization and food security in Guangxi Zhuang Autonomous Region
广西壮族自治区耕地利用现状与粮食安全问题研究
Spatial-temporal pattern changes and optimal strategy of grain production in China since 1990s
中国粮食生产时空格局动态及其优化策略探析
Spatial and temporal variation of grain production and its influencing factors at the county level in China
中国县域粮食产量时空演变及影响因素变化
Spatio-temporal pattern and its driving factors of grain production in Heilongjiang province
黑龙江省粮食生产的时空格局及动因分析
An analysis of structure change and comparative advantage of grain production in northeast China
东北地区粮食生产的结构变动及比较优势分析
Comparative advantage of grain production in central China and the base construction
DOI:10.13249/j.cnki.sgs.2015.03.293
[本文引用: 1]
Central China, which consists of Shanxi, Henan, Anhui, Jiangxi, Hubei and Hunan provinces, is an important base for main food supply in China. After analyzing scale advantage, efficiency advantage, comprehensive comparative advantage and concentration ratio of grain production in Central China, this article further discusses countermeasures for the construction of grain production base in this region. First, it is found that, since 1978, rice and wheat in Central China have a stable comprative advantage while the corn and soybean do not. The comparative advantage index of rice production is above 1.10 per year and wheat production shows a steady rise, going from 1.00 in 1978 to 1.16 in 2012. The comparative advantage index of corn production is below 0.80 and soybean production presents a downward trend, going from 0.90 in 1978 to 0.80 in 2012. Second, seen from the horizontal perspective, the structure of comparative advantage of the four grain crops changes slightly. In 1978, the sequence of scale advantage is rice, soybean, wheat and corn, the sequence of efficiency advantage wheat, rice, corn and soybean, and the sequence of comparative advantage rice, wheat, soybean and corn. In 2012, the sequence of scale advantage is rice, wheat, soybean and corn, the sequence of efficiency advantage wheat, rice, soybean and corn, and the sequence of comparative advantage wheat, rice, soybean and corn. Third, the concentration ratios of grain production in eastern, western and northeast regions of China fluctuate whereas the concentration ratios of grain production in the central region keeps rising steadily. The concentration ratio of grain, rice, wheat and corn rose from 28.65%, 38.13%, 28.83% and 16.16% in 1978 to 30.08%, 39.87%, 42.40% and 17.16% in 2012 respectively. The statistics in 2012 shows that the concentration ratio of grain, rice, wheat ranked first among the four regions. Fourth, the analysis shows that grain production in the central region plays an increasing role in China. Therefore, from the perspective of grain safety in China, importance should be attached to grain production in Central China so as to remain firm in the status of the central region as a base for main food supply. And various measures should be taken to promote the stability and growth of grain production in Central China.
中部地区粮食生产比较优势分析与基地建设
DOI:10.13249/j.cnki.sgs.2015.03.293
[本文引用: 1]
中部地区是中国重要的粮食主产基地,在分析中部地区粮食生产规模优势、效率优势、综合比较优势和集中度的基础上,进一步探讨了中部地区粮食生产基地建设对策。结论如下:① 1978 年以来,中部地区水稻和小麦具有稳定的比较优势,而玉米和大豆没有比较优势。其中水稻生产的综合优势指数均在1.10 以上;小麦综合优势表现为稳中有升,从1978 年为1.00 上升到2012 年为1.16;玉米的综合优势指数小于0.80;大豆的综合优势呈现下降趋势,从1978 年为0.90 下降到2012 年为0.80。② 整体从横向来看,水稻、小麦、玉米、大豆四大粮食作物的比较优势结构发生了变化。1978 年规模优势大小顺序为:水稻 > 大豆 > 小麦 > 玉米;效率优势为:小麦 > 水稻 > 玉米 > 大豆;综合优势为:水稻 > 小麦 > 大豆 > 玉米。2012 年规模优势为:水稻 > 小麦 > 大豆 > 玉米;效率优势为:小麦 > 水稻 > 大豆 > 玉米;综合优势为:小麦 > 水稻 > 大豆 > 玉米。③ 中国四大区域中的东部地区、西部地区和东北地区粮食生产的集中度均有波动,唯有中部地区的粮食集中度保持稳定上升,其粮食、水稻、小麦、玉米的集中度由1978 年的28.65%、38.13%、28.83%、16.16%分别上升到2012 年的30.08%、39.87%、42.40%、17.16%,2012 年中部地区粮食、水稻、小麦的集中度位于四大区域之首。④分析表明,中部地区粮食生产在全国的地位越来越重要,应采取各项措施促进中部地区粮食生产的稳定与增长。
Regional comparative advantage of sugar crop production in China: Based on data of sugar crop production from 1995 to 2009
中国糖料作物生产的地区比较优势分析: 基于1995—2009年糖料作物生产数据
Study on the change of corn distribution and its regional comparative advantage in Liaoning province
辽宁省玉米布局变化及其区域比较优势研究
Analysis on the changes and reasons of potato production pattern in China
我国马铃薯生产格局变化特征及原因分析
Study on the regional advantage layout of Chinese muskmelon industry
中国甜瓜产业区域优势布局研究
Spatial-temporal characteristics of maize production potential change under the background of climate change in Northeast China over the past 50 years
DOI:10.11821/dlyj201605005
[本文引用: 1]
Using GAEZ (Global Agro-Ecological Zones) model, the agro-climatic constraints, soil, topography and other factors were used to estimate maize production potential in Northeast China during 1961-2010, and the spatial and temporal patterns of maize production potential caused by climate change in this region in the past 50 years were analyzed. Results are shown as follows: (1) The average maize production potential had a larger fluctuation in Northeast China during 1961-2010. The maize production potential increased by 80.00 kg/hm2 per decade in Northeast China in the past 50 years; (2) Frequent changes of the maize production potential took place at the turn of the 20th century due to the changes in climate; (3) Heilongjiang province saw the highest total production potential of maize, namely, the increasing range of maize production potential was the highest, followed by Jilin province, and Liaoning province was the lowest in the past 50 years; (4) The production potential of maize fluctuated dramatically in Heilongjiang in the years of 1961-2010, while Jilin and Liaoning were in a relatively stable state; (5) In the past 50 years, maize suitable planting areas slightly increased in Northeast China, which was mostly found in the northwestern Heilongjiang. Meanwhile, the area with higher production potential increased significantly and showed the trend of northward movement. This study provides a theoretical basis for efficient utilization of climate and land resources and the optimization of maize production distribution.
近50年气候驱动下东北地区玉米生产潜力时空演变分析
DOI:10.11821/dlyj201605005
[本文引用: 1]
利用GAEZ模型,综合考虑气象、土壤、地形等因素,估算1961-2010年东北玉米生产潜力,分析50年来气候变化导致的东北玉米生产潜力时空格局演变特征。研究发现:① 1961-2010年,东北玉米平均生产潜力波动较大,整体上以每10年80 kg/hm<sup>2</sup>的线性倾向率增加;② 由于气候变化,20世纪末、21世纪初玉米生产潜力变化较为频繁;③ 玉米生产潜力总值黑龙江省始终处于最高,近50年间增长幅度黑龙江省>吉林省>辽宁省;④ 近50年来,黑龙江省玉米生产潜力的波动较为剧烈,吉林省和辽宁省相对稳定;⑤ 近50年东北玉米适宜种植区有所增加,主要集中在黑龙江省西北地区,高生产潜力区域增加明显,呈现北移趋势。研究可为东北地区高效利用气候和土地资源,优化玉米生产布局提供依据。
The adjustment of China's grain cropping structure and its effect on the consumption of water and land resources
DOI:10.31497/zrzyxb.20190102 URL [本文引用: 1]
中国粮食作物种植结构调整及其水土资源利用效应
Global-scale modeling of future changes in sown areas for major crops based on a logit model
DOI:10.11821/xb200706004
[本文引用: 1]
Potential dynamics of agricultural crop sown area has attracted a wide range of attention from numerous researchers due to its ecological and socio-economic implications. This paper describes a method to develop and implement an integrated model to dynamically simulate future changes in sown areas of the world's major crops (rice, maize, wheat and soybean) at a global scale. The general hypothesis of this study is that crop sown area change is directly linked with farmer decisions on crop choice, and what kind of crop to be cultivated is highly dependent on the random utility of available crops. The modeling approach is based on a crop choice model, which is a Multinomial Logit Model and used to model farmer crop choice decisions among a variety of available alternatives by using an optimization approach. The assessment of model performance by comparing model estimates with FAO statistical data (2001-2003) and MODIS land cover product (2001) indicates its reliability and dignity for addressing the complicated dynamic change of agricultural land use change at present and capability for long-term scenario investigation and applications for the future. From model simulation for crop sown area change during 2005-2035 in different regions in the world, global potential cropping patterns of major crops can be interpreted. Moreover, the results present that the change rates and trajectories of crops in different regions show a great variation over time and space. This study is an attempt of detecting future sown area change at a global level by using a simplified approach along with some assumptions. Although some uncertainty remains in the model, the outcomes can help to understand and explain the causes, locations, consequences and trajectories of land-use change, and provide a great support service for land-use planning and policy-making activities.
基于Logit模型的世界主要作物播种面积变化模拟
Simulation on crops spatial competition based on FCS and EPIC models under future scenarios
基于FCS及EPIC模型的未来情境下作物空间竞争模拟
Spatial-temporal differences and convergence analysis of grain total factor productivity in Guangxi
广西粮食全要素生产率时空差异及收敛性分析
Spatial pattern characteristics and influencing factors of comparative advantage of sugarcane production scale in Guangxi
广西甘蔗生产规模比较优势空间格局特征及影响因素分析
Spatio-temporal patterns and driving factors of crop planting structure in Guangxi
广西农作物种植结构时空格局及其驱动因子分析
Guangxi: The total fruit production ranks first in China
广西: 水果生产总量雄踞全国榜首
An convenient method to calculate Gini coefficient
一种简便易用的基尼系数计算方法
The evolutionary trend and the coupling relation of gravity center moving of county level population distribution, economical development and grain production during 1990-2013 in Henan province
DOI:10.13249/j.cnki.sgs.2018.06.011
[本文引用: 1]
The dynamic moving and spatial coupling of gravity center of county-level population distribution, economic development,and grain production in Henan Province has been researched in this article, and discussed the relationship between social development and above three factors based on the social theory, gravity center calculation and spatial coupling analysis model. The result showed that the spatial gravity centers of county-level economical development, population distribution and grain production have been moving in the north of geometric center of Henan Province. The consistency level changed sharply, and the spatial inconsistency pattern was very significant during the past 23 years. Before 2000, the spatial coupling level between county-level population distribution and grain production was high, and after 2000, the spatial coupling level changed among the gravity center of county-level economic development, population distribution and grain production. The gravity center of grain production and economic development moved oppositely in the southeast-northwest direction, and the influence of grain production to the gravity move of economic development has been decreasing, while the coupling level between the gravity centers of population distribution and economical development has been increasing during the same time. The social development in the eastern Henan shows a low-level spatial equilibrium with the coexistence of inversion phenomenon between grain production and government receipts and grain production and people’s livelihood. The social development level in rural counties obviously lags behind that in urban areas. The spatial pattern of social inequality at county level in Henan driven by the factors, such as regional economic development, social policies, spatial strategy, and path dependence, is tabbed the constitutive characteristic in the period of comprehensive socioeconomic transformation in China. Consequently, two steps on how to improve the county-level population distribution, economic development and grain production are proposed. On the one hand, based on the cognitive of China breadbasket, the farmland protection, technical support, policy tilt to grain yield should be forcefully developed to ensure the grain production scale in Henan and regional grain safe. On the another hand, some reasonable policies must be proposed to encourage the deep process of agricultural products and foster the development of township enterprise, to accept more surplus labor in rural society.
1990—2013年河南省县域人口、经济和粮食生产重心的迁移轨迹与耦合特征: 兼议与社会剥夺的关系
DOI:10.13249/j.cnki.sgs.2018.06.011
[本文引用: 1]
基于社会剥夺理论,利用重心计算及空间耦合分析模型,研究了1990~2013年河南省县域人口重心、经济重心、粮食生产重心动态迁移及其空间耦合,并探讨其与社会发展水平之间的关系。结果表明:23 a来河南省经济、人口及粮食生产重心均在省域几何重心北部变动,空间错位格局日趋显著,变动一致性波动剧烈;2000年前人口重心与粮食重心耦合度较高,2000年后粮食重心与经济重心明显呈东南-西北路径背向偏离,粮食生产对经济重心迁移的影响持续下降,而人口重心与经济重心耦合度逐步提升;传统农区社会发展严重滞后于经济增长水平,粮食主产县区的“粮食与民生倒挂”特征显著。
Evaluation on comparative advantage of grain production in Sichuan province and its main influencing factors
四川省粮食生产比较优势测评及主要影响因素分析
The regional comparative advantages of potato production in China and its influencing factors
中国马铃薯生产区域比较优势及其影响因素分析
Development of specialized villages in various environments of less developed China
DOI:10.11821/xb201206006
[本文引用: 2]
Theoretical framework on formation of specialized villages was proposed by using rational small household, division of labour and specialization and distance decay and neighbourhood affect theories. These theories from economics and geography determined the formation of specialized villages, but the types of the specialization are related to resources endeavor and environmental conditions of the villages. The paper illustrates the change of the economic structure of villages by applying mathematical models, stating that various geographical conditions surrounding a village leads to different marginal production efficiency, therefore forming specified production structure. If a village's environment proves suitable for certain production or service, then a relevant type of specialized village may emerge. Based on theoretical analysis, we use the census data of specialized villages in Henan Province in 2010, applying dummy variables representing 16 types of specialized villages, and selecting environmental variables such as landform, location, arable land area and labour force from a spatial database from government authorities. The regression results from the OLS models indicate a significant impact of village environmental conditions on village specialization: (1) more labour force leads to lower specialization; (2) abundant arable land benefits specialization; (3) the closer location to its county site results in higher probability of specialization on agricultural processing industry; (4) existence of a wholesale market may increase specialization on relevant villages, especially for agricultural processing and animal husbandry industries; (5) the villages located in hilly terrain show less probability on specialization than others, mainly caused by difficulties in transportation and shortage in arable land; while mountainous environment provides resources for the development of specialization. Results from qualitative models indicate diverse environmental impact in different types of specialized villages. Positive impacts of land availability are observed in tea plantation, tree nursery and fruit farm. Labour force assists the formation of labour intensive production such as floristry. Accessibility benefits specialization in fruit, vegetable production and floristry. Results of this study can be applied to policy making for guidance of specialization under various environmental conditions.
欠发达区地理环境对专业村发展的影响研究
DOI:10.11821/xb201206006
[本文引用: 2]
基于经济学和地理学中的“理性小农”、“劳动分工与专业化”和“距离衰减与邻里效应”理论,并考虑资源环境条件,建立了解释专业村形成机理和形成类型的理论框架。用数理方法推理了村产业结构的发展变化和专业村的形成。在理论分析的基础上,运用2010 年河南省的专业村数据,选择地形、区位、土地和劳动力等环境变量和16 类专业村的虚拟变量,使用最小二乘法进行回归,结果表明村环境资源条件对专业化率有显著影响:① 村劳动力资源越多,专业化率越低;② 村土地越多越利于专业化生产;③ 村离县级市距离越近,越有利于形成农产品加工专业村;④ 具有批发市场可以提高所有专业村的专业化率,对养殖业和加工业专业村更是如此;⑤如果其他环境相同,丘陵地区的专业化率比其他地区低;这主要与丘陵地区交通条件不畅、人均耕地较少等有关。采用定性模型分析表明:环境影响在不同类别的专业村有所不同。土地丰裕程度对茶叶、林业和水果种植等类专业村形成有正面影响,劳动力资源对花卉等专业村的形成产生影响;地域通达性对水果、蔬菜和花卉等时鲜产品专业村的形成产生正面影响。该研究结果的实践引申,在不同环境条件的地区,可以制定相应的适宜专业化发展的引导政策。
Regional comparative advantage analysis of sugar crop production in China: Based on sugar crop production data from 1995 to 2009
中国糖料作物生产的地区比较优势分析: 基于1995—2009年糖料作物生产数据
Analysis on the competitiveness of Guangxi sugarcane and cane-sugar industry
广西蔗糖产业发展竞争力分析
Study on the integrated development path of tropical fruit industry and ecotourism in Guangxi
广西热带水果产业与生态旅游业融合发展路径研究
Analysis of the temporal and spatial changes and comparative advantages of vegetable production in China
DOI:10.6048/j.issn.1001-4330.2019.10.021
[本文引用: 1]
<b>【Objective】</b> To investigate the consistency of regional changes in China's vegetable production and its comparative advantages, and promote the distribution of vegetable production in the country from the perspective of adjusting comparative advantage. <b>【Method】</b> Based on the Chinese vegetable production data from 1990 to 2016, this paper systematically sorted out the regional changes of Chinese vegetable production, and used the comprehensive comparative advantage analysis method and the resource endowment coefficient analysis method to measure the regional comparative advantages. Furthermore, the panel regression was employed to analyze the impact of comparative advantages on the layout of vegetable production. <b>【Results】</b> The vegetable output of the top 10 provinces in China accounted for 70% of the total vegetable output in the country. The 10 provinces in the eastern region accounted for more than 40% of the total vegetable output in the country. The overall comprehensive comparative advantage index and resource endowment coefficient in the eastern region was greater than 1, the central region was less than or equal to 1, the northeast region was less than 1; the western region was equal to 1. For every 1% change in the comprehensive comparative advantage of each region, the sown area of vegetables in the whole country will change 0.8% in the same direction. <b>【Conclusion】</b> China's vegetable production concentration is high. The eastern region is China's main vegetable producing area, with comparative advantages in vegetable production, but its status is declining. The status of vegetable production in the Northeast has declined significantly in China, and its comparative advantage has also dropped significantly. Vegetable production in the western region has increased significantly in the country, and its comparative advantage has risen simultaneously. Comparative advantage is an important factor influencing the layout of Chinese vegetable production.
中国蔬菜生产的时空变迁与比较优势分析
DOI:10.6048/j.issn.1001-4330.2019.10.021
[本文引用: 1]
【目的】分析中国蔬菜生产的区域变迁与其比较优势的一致性,从调整比较优势角度促进全国蔬菜生产合理布局。【方法】基于2000年到2016年中国蔬菜生产数据,系统分析中国蔬菜生产的区域变迁,利用综合比较优势分析法和资源禀赋系数分析法,测度中国蔬菜生产的区域比较优势,利用面板回归,分析比较优势对蔬菜生产布局的影响。【结果】中国蔬菜产量前10位的省份蔬菜产量占全国蔬菜总产量的70%,东部地区10个省市蔬菜产量占全国蔬菜总产量的40%以上。东部地区整体综合比较优势指数和资源禀赋系数大于1,中部地区小于或等于1,东北地区小于1;西部地区基本等于1。各地区综合比较优势每变化1%,会引起其蔬菜播种面积占全国比重同方向变化0.8%。【结论】中国蔬菜生产集中度较高;东部地区是中国蔬菜主产区,在蔬菜生产方面具有比较优势,但其主产区地位在不断下降;东北地区蔬菜生产在中国的地位明显下降,其比较优势也呈现同步明显下降;西部地区蔬菜生产在全国地位明显上升,其比较优势同步上升。比较优势是中国蔬菜生产布局的重要影响因素。
