

1 引言
生态系统服务是生态系统综合评估的热点和核心内容,理论框架和研究体系日渐成熟,但是现有研究多针对单一的服务类型或多种服务进行单独分析[1⇓⇓⇓⇓-6]。随着对生态系统服务权衡与协同认识的加深,逐渐从单独分析发展到协同关联分析,如针对生态系统管控和保护修复等方面,通过分析不同生态系统服务之间权衡与协同的关系,识别权衡与协同区域,为生态建设、保护和修复,以及自然保护区划定和功能区定位等提供对策建议[7⇓⇓-10];针对城市群规划建设和土地结构优化等方面,通过情景模拟或耦合生态系统服务与土地利用变化,寻求生态效益最大化,提出土地利用结构优化和国土空间规划的可行性措施和建议[11⇓⇓⇓-15];针对农田、云杉林和非原生人工林等单一生态系统,关联分析不同服务之间的关系,以有效实施单一生态系统的资源管理和保护[16⇓⇓-19]。
近年来,中国更加注重国土空间优化布局和国家生态安全格局构建,日渐形成了以自然保护区为核心,重点生态功能区、生物多样性保护优先区为重要补充的自然保护地体系[20],2010年国务院发布了《全国主体功能区规划》。作为限制开发区的重点生态功能区,实现生态保护与社会经济发展的协同是主要目标之一。按照《全国主体功能区规划》要求,国家重点生态功能区范围内各类开发活动要进行严格管控,使人类活动占用的空间控制并逐步缩小,以腾出更多的空间用于维系生态系统的良性循环。同时,加强国家重点生态功能区环境保护和管理,也是增强生态系统服务,构建国家生态安全屏障的重要支撑。围绕着“限制开发区”的功能定位,不同学者从不同角度开展了相关研究,从生态状况时空变化规律角度,侯鹏等[21⇓⇓-24]总结为基于生物群落和生态系统保护成效评估两大类,并从生态系统结构优化、质量改善、服务提升情况和动物群落栖息地适宜性与有效性等方面开展生态保护成效评估。从生态补偿角度,评估重点生态功能区实施保护类社会经济政策带来的生态质量改善情况[25⇓-27]。从生态保护和建设工程角度,评估重要保护区域实施生态工程后对区域生态的保护成效[28⇓-30]。但是,这些现有评估研究对重点生态功能区生态系统供给和调节服务权衡与协同关系的耦合研究相对较少。面对区域生态系统服务的多元化特点,本文以秦巴重点生态功能区为对象,选择自然地理条件相似度极高的秦巴山区为参照单元,从生态空间和生态系统服务角度识别和分析区域生态系统时空演变特点,并在生态系统服务权衡与协同变化的视角下审视生态保护特征,对探讨重点生态功能区政策效果和服务生态保护管理决策具有重要意义。
2 研究区概况、数据来源与方法
2.1 研究区概况
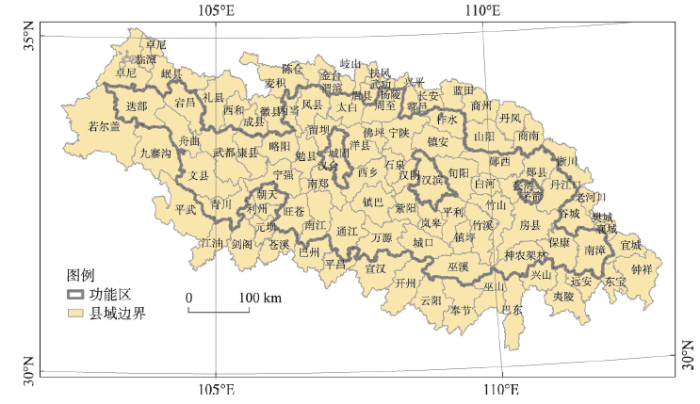
秦巴山区是中国南北地理分区的重要界线,横跨甘肃、四川、陕西、重庆、湖北、河南5个省市;也是南北气候交汇区和分界线,横跨暖温带和亚热带两种气候带,由于地理位置和气候条件的特殊性,秦巴山区拥有丰富多样的自然植被类型和生物资源,是中部重要的生态安全屏障[31]。秦巴重点生态功能区是中国第一批划定的重点生态功能区,占据着秦岭和大巴山的主体区域,其南北两侧为平原或盆地,丰富的生态资源使秦巴山成为中部区域的“生态高地”,为区域提供了重要的生态系统服务。鉴于秦巴山区范围内的水热气候条件、自然地理条件和生态环境条件等极为相似,是一个相对独立而完整的自然地理单元,本文以秦巴重点生态功能区为评估对象,选择其周边秦巴山自然地理单元为参照单元,两者面积均约14万km2。
2.2 数据资料收集与处理
研究数据包括生态系统类型、气象数据、高程数据和土壤数据等多源数据集。生态系统类型参考刘纪远等[32-33]的分类体系和方法,基于Landsat TM/ETM等遥感影像数据,经人机交互解译获取,空间分辨率为30 m。根据解译结果将国土空间识别为3类,即生态空间、农业空间和城镇空间,其中生态空间包括森林、草地、湿地和荒漠等自然生态系统;农业空间包括水田和旱地等人工农田生态系统;城镇空间包括城镇建设用地、农村居民点和工矿用地等类型。生态系统净初级生产力(Net Primary Productivity, NPP)能够反映自然条件下生态系统的生产能力[12,34],本文采用全球陆地卫星(Global Land Surface Satellite, GLASS)NPP数据产品[35-36],空间分辨率为500 m。此外,气象数据来源于中国气象科学数据共享服务网;高程数据来源于地理空间数据云;土壤数据来源于中国科学院1∶100万土壤类型。最后对数据进行拼接融合、重采样和统一坐标等预处理。
2.3 研究方法
2.3.1 生态空间变化动态度
式中:K为研究区内某一国土空间类型在研究时段内的动态变化度;Ecoa和Ecob分别为某一国土空间类型在研究初期和研究末期的面积;T为研究时段长。
2.3.2 生态系统服务模型
本文结合《全国生态功能区划(修编版)》主体服务,选取水源涵养和土壤保持两个主导服务作为调节服务的评估分析指标。陆地生态系统水源涵养量的方法主要有降水贮存量法(蓄水估算法)、径流系数法和水量平衡法3类,降水贮存量法主要是考虑植被对降水的截留作用;径流系数法依赖于径流系数测定的准确性;水量平衡法主要考虑了降雨量和蒸散发量[39-40]。秦巴重点生态功能区植被覆盖度高,植被对降雨截留的作用较大,本文采用降水贮存量法[41]计算获取研究区水源涵养量。通用土壤流失方程(USLE)由Wischmeier在20世纪60年代提出,由于其参数因子的解释具有物理意义,被国内外学者广泛应用[42-43]。本文采用修正土壤流失方程(RUSLE)[41,44]计算获取研究区土壤保持量。
2.3.3 生态系统服务权衡与协同关系
一阶偏相关系数计算公式如下:
t检验公式如下:
式中:r为变量x和变量y的相关系数;rij·h为在控制变量h后,变量i与j的一阶偏相关系数;rij、rjh和rih分别为两个变量的相关系数;n为样本观测数;k为可控制变量数;当t > t0.05(n-k-2)时,拒绝原假设,相关性结果显著,当t > t0.01(n-k-2)时,拒绝原假设,相关性结果极显著,t0.05(n-k-2)和t0.01(n-k-2)查阅t检验表确定临界值。
图1
3 结果分析
3.1 生态空间的时空变化特征分析
2019年秦巴山区共有生态空间20.58万km²,占秦巴山区总面积的73.2%。从秦巴重点生态功能区内外对比来看,重点生态功能区内的生态空间为11.06万km²,面积占比为77.94%,重点生态功能区外的生态空间为9.52万km²,面积占比为68.38%,重点生态功能区内的生态空间面积占比高出了9.57个百分点。从空间分布来看(图2),重点生态功能区内生态空间分布广泛、连片,但重点生态功能区外主要集中分布在西部和东北部及东南部等部分区域,城镇空间和农业空间在秦巴山区的北部、东部和南部较为集中。20世纪80年代(以下简称1980s)至2019年的近40年间,重点生态功能区内生态空间总体呈增加趋势,面积占比一直保持在78%左右,比重点生态功能区外的比例高出约10个百分点。从不同时段来看,2010年之前,重点生态功能区的生态空间一直呈波动变化;2010年之后,生态空间面积逐渐增加且趋于稳定(图3)。
图2
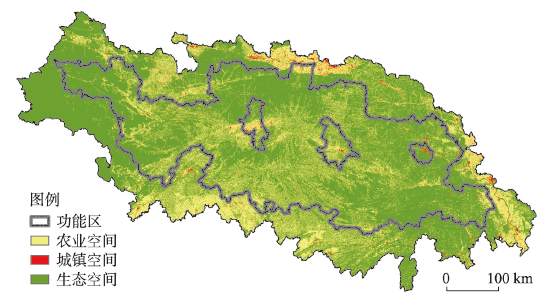
图2
2019年秦巴山区国土空间构成及分布状况
Fig. 2
Spatial distribution of the three types of land space in the Qinba Mountains region in 2019
图3
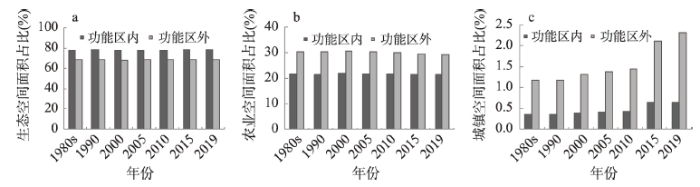
图3
1980s—2019年秦巴山区农业空间、城镇空间和生态空间占比及其变化特征
Fig. 3
The proportion of agricultural space, urban space and ecological space inside and outside the key ecological function zones of the Qinba Mountains region from the 1980s to 2019
从国土空间整体变化来看,2005年为明显分界点。2005年之前生态空间和其他空间面积比例呈波动变化趋势,2005年之后变化逐渐放缓,如图4所示。从重点生态功能区内外差异对比来看,2010年成为了内部和外部变化模式的分界点:其中,2010年之前,重点生态功能区内外变化特征较为一致、均呈波动变化;但在2010年之后,重点生态功能区内的生态空间面积占比稳定上升,非生态空间面积占比稳定降低,而重点生态功能区外的生态空间和非生态空间面积占比变化则相反,表现为生态空间受到挤占并持续缩减。因此,秦巴重点生态功能区在2010年划定之后,对于维持并提升内部生态空间面积、抑制人类活动干扰、促进生态空间保护修复等方面,体现出明显的政策效应。
图4
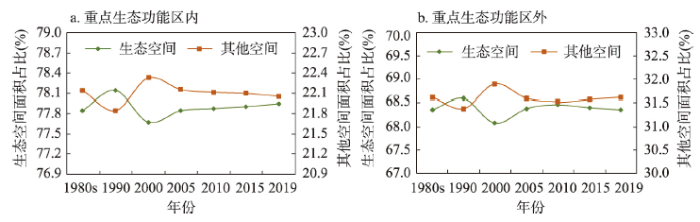
图4
1980s—2019年秦巴山区重点生态功能区内、外国土空间面积占比变化
Fig. 4
Changes in the proportion of land spatial area within and outside key ecological function zones of the Qinba Mountains region from the 1980s to 2019
从每类国土空间的动态度来看,重点生态功能区的划定推动着整个秦巴山区国土空间动态度的显著减小。如表1所示,对于生态空间,重点生态功能区的动态度有所下降且均为正向变化,表明生态空间趋于稳定并持续扩大,明显好于重点生态功能区之外的区域。总体来看,重点生态功能区受人为干扰逐渐降低,生态空间趋于稳定;而重点生态功能区之外,2010年之后生态空间动态度由正转负,生态空间持续受到挤占,面积逐渐减小。因此,秦巴重点生态功能区在2010年划定之后,对于扩大生态空间,以及维护生态空间内部的稳定性和抑制不同生态系统类型之间变化具有明显作用,重点生态功能区生态空间有了“量的增长”。
表1 1980s—2010年和2010—2019年秦巴山区三大类空间的动态度特征
Tab. 1
| 年份 | 农业空间 | 城镇空间 | 生态空间 | |||||
|---|---|---|---|---|---|---|---|---|
| 功能区内 | 功能区外 | 功能区内 | 功能区外 | 功能区内 | 功能区外 | |||
| 1980s—2010 | -0.013 | -0.040 | 0.566 | 0.754 | 0.002 | 0.006 | ||
| 2010—2019 | -0.007 | -0.014 | 0.296 | 0.332 | 0.001 | -0.001 | ||
3.2 生态系统服务时空变化特征与成效分析
3.2.1 生态系统供给服务
本文通过定量测算2000—2019年秦巴山区植被NPP的多年均值及年际线性变化趋势,分析了重点生态功能区内外生态系统供给服务的时空差异特征。从多年均值的空间分布来看,重点生态功能区内外的NPP分别为214.95 gC/m2和189.01 gC/m2,重点生态功能区内的生态系统供给服务能力更高,且空间异质性较小,在重点生态功能区外部,生态系统供给服务空间差异相对较大,仅西南部等植被本底较好的局部区域较高,如图5a所示。从时间变化趋势及空间特征来看,重点生态功能区的NPP年际线性变化趋势总体呈现增加趋势、平均增速为1.07,表明重点生态功能区内部的生态系统供给服务总体增强,如图5b所示。在重点生态功能区外部,NPP的年际线性变化趋势空间差异较为明显,西部和北部的部分区域呈现显著下降趋势、下降速率大于0.5,表明生态系统的供给服务变差趋势明显。
图5
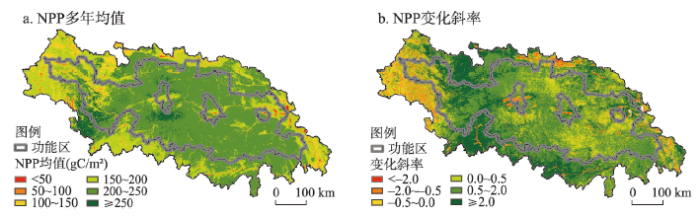
图5
2000—2019年秦巴山区NPP多年均值和变化斜率空间分布
Fig. 5
Spatial distribution of annual mean NPP and change slope in Qinba Mountains region from 2000 to 2019
3.2.2 生态系统调节服务
通过定量测算2000—2019年秦巴山区土壤保持量和水源涵养量多年均值及年际线性变化趋势,分析了重点生态功能区内外生态系统调节服务的时空差异特征。从多年均值的空间分布来看,重点生态功能区内外土壤保持总量分别为18.57亿t和12.76亿t,单位面积土壤保持量分别为130.9 t/hm²和91.6 t/hm²;水源涵养总量分别为178.29亿m3和153.34亿m3,单位面积水源涵养量分别为12.74万m³/km²和12.13万m³/km²,表明重点生态功能区内的生态系统调节服务能力高于外部,且重点生态功能区内部的生态系统调节服务空间异质性较小(图6a、6c)。
图6
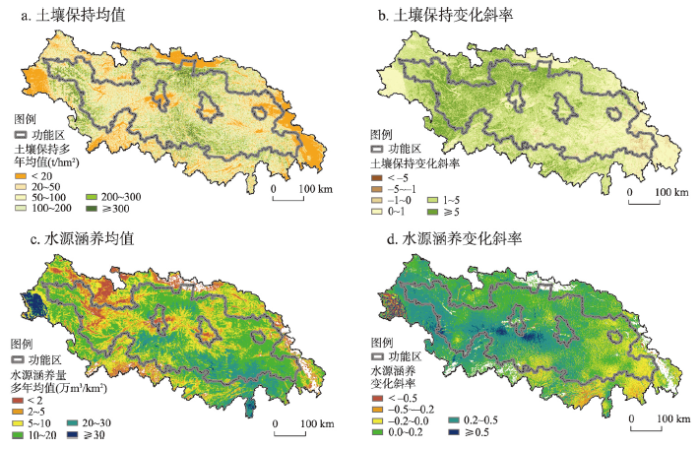
图6
2000—2019年秦巴山区生态系统调节服务多年均值和变化斜率空间分布
Fig. 6
Spatial distribution of annual mean and change slope of ecosystem regulation services in Qinba Mountains region from 2000 to 2019
从时间变化趋势及空间特征来看,与供给服务在空间上的变化趋势基本一致,重点生态功能区的生态系统调节服务年际线性变化总体呈增加趋势,土壤保持量的平均增速为2.69,水源涵养量的平均增速为0.16,表明重点生态功能区内部的生态系统调节服务总体增强(图6b、6d)。在重点生态功能区外部,生态系统调节服务的年际线性变化趋势空间差异较为明显,生态系统调节服务提升幅度低于内部,土壤保持量平均增速为2.35,水源涵养平均增速为0.11,其中,东部和西部的部分区域呈现下降趋势。表明功能区的划定对生态系统调节服务能力的提升具有正向作用,且对功能区内的提升作用大于功能区外。
可以看出,生态空间与生态系统调节和供给服务能力息息相关,功能区内生态空间占比较大且逐渐增加,生态系统调节服务和供给服务能力相对较高且呈提升趋势;而功能区外生态空间占比相对较小且逐渐减少,生态系统调节和供给服务能力相对较低且多个区域呈变差趋势,说明秦巴重点生态功能区的划定在提高生态空间面积占比的同时,也提升了区域内的生态系统服务能力,重点生态功能区生态系统服务有了“质的提升”。
3.3 生态系统服务权衡与协同特征
通过测算重点生态功能区内外生态系统调节服务和供给服务的偏相关系数,根据t检验转换为不同等级的权衡和协同关系,分区县统计分析了生态系统调节服务与供给服务的权衡与协同关系。为探究功能区的划定对不同生态系统服务协同关系的影响,将时间划分为功能区划定前(2000—2010年)和划定后(2010—2019年)两个时间段进行分析。
从功能区内协同关系来看(图7),功能区划定前(2000—2010年)土壤保持服务和供给服务主要表现为协同关系,各区县呈协同关系的面积占比均值线为73.09%,总体高于权衡关系;功能区划定后(2010—2019年)土壤保持服务和供给服务呈协同关系的占比均值线上移,变为79.19%,增加了6.1%,且呈显著协同和极显著协同关系的面积占比明显增加,其中佛坪县、洋县等区县增加最明显。从功能区外来看(图8),2000—2010年土壤保持服务和供给服务呈协同关系的面积占比均值线为65.86%,功能区划定后(2010—2019年)均值线上移,变为75.22%,增加了9.36%,且呈显著协同和极显著协同关系的面积占比有所增加,但总体低于功能区内。通过分析发现,功能区内土壤保持服务和供给服务的协同关系大于功能区外,但在功能区划定后,功能区外二者的协同关系提升幅度大于功能区内,表明功能区的划定对功能区内生态系统服务的协同提升关系成效不明显,仍需进一步优化生态保护政策,平衡促进二者的协同提升。
图7
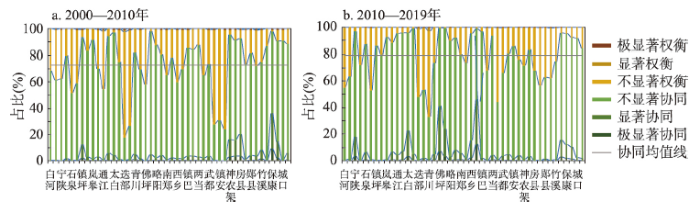
图7
2000—2010年和2010—2019年秦巴山区重点生态功能区内土壤保持和供给服务的权衡与协同关系
Fig. 7
Trade off and synergy between soil conservation and supply service in 2000-2010 and 2010-2019 inside the key ecological function zones of the Qinba Mountains region
图8
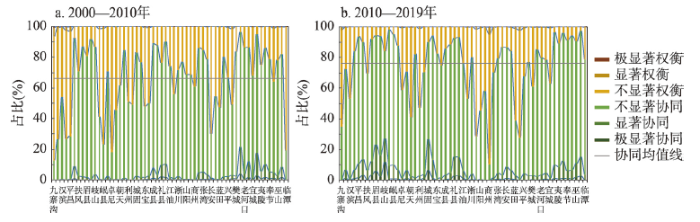
图8
2000—2010年和2010—2019年秦巴山区重点生态功能区外土壤保持和供给服务的权衡与协同关系
Fig. 8
Trade off and synergy between soil conservation and supply service in 2000-2010 and 2010-2019 outside the key ecological function zones of the Qinba mountains region
从重点生态功能区内水源涵养服务和供给服务协同关系来看(图9),功能区划定前(2000—2010年)水源涵养服务和供给服务主要呈协同关系,各区县为协同关系的区域面积占比均值线为56.29%。功能区划定后(2010—2019年)水源涵养服务和供给服务呈协同关系的区域缩减,协同关系面积占比均值线下移至23.92%,下降了32.37%。从功能区外来看(图10),在功能区划定前(2000—2010年)水源涵养服务和供给服务主要呈协同关系,各区县协同关系的面积占比均值线为66.08%;功能区划定后(2010—2019年),水源涵养服务和供给服务的协同关系面积占比均值线下移至38.54%,下降了27.54%。通过分析发现,功能区内外水源涵养服务和供给服务在功能区划定前均主要表现为协同关系,而在功能区划定后,转为相互权衡的关系。且从协同关系面积占比均值线可知,功能区外二者的协同关系总体高于功能区内,但功能区外显著权衡和极显著权衡关系的区域面积增加更多。
图9
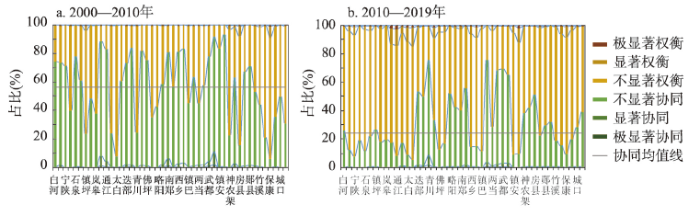
图9
2000—2010年和2010—2019年秦巴山区重点生态功能区内水源涵养和供给服务的权衡与协同关系
Fig. 9
Trade off and synergy between water conservation and supply service in the key ecological function zones of the Qinba mountains region in 2000-2010 and 2010-2019
图10
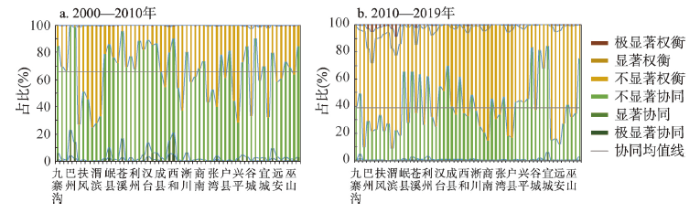
图10
2000—2010年和2010—2019年秦巴山区重点生态功能区外水源涵养和供给服务的权衡与协同关系
Fig. 10
Trade off and synergy between water conservation and supply service outside the key ecological function zonesof the Qinba mountains region in 2000-2010 and 2010-2019
为进一步分析生态系统调节服务和供给服务之间的关系,探究水源涵养与生态系统供给服务表现为权衡关系的驱动因素,从长时间序列上对比生态系统供给服务、土壤保持和水源涵养服务的变化趋势,并将降雨量加入对比分析,结果如图11所示。
图11
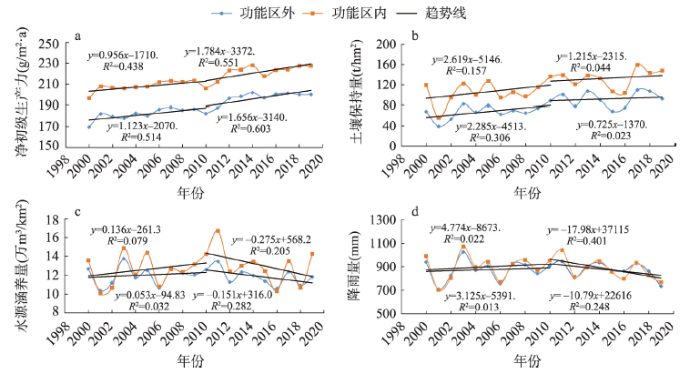
图11
2000—2019年NPP、土壤保持服务、水源涵养服务和降雨量变化
Fig. 11
Changes of NPP, soil conservation services, water conservation services and rainfall from 2000 to 2019
从时间变化趋势来看,2000—2019年生态系统供给服务能力总体呈增加趋势,2010年之后增长趋势进一步增大。土壤保持量和生态系统供给能力的变化趋势基本一致;水源涵养量在功能区划定前与生态系统供给能力的变化趋势基本一致,但功能区划定后,受降雨影响,二者变化趋势相反。从趋势线斜率来看,2010年之后NPP和土壤保持量斜率更加接近,表明功能区划定后二者变化趋势一致性进一步增大,协同关系更加显著。在2010年之前,水源涵养量和NPP均呈增加趋势,二者协同变化趋势略小于土壤保持量与NPP;2010年之后水源涵养服务总体呈下降趋势,基本与降雨量变化一致,与NPP变化趋势相反,表明水源涵养服务受降雨的影响较大,功能区划定后与供给能力更多表现为权衡关系。
通过分析发现,土壤保持服务与供给服务主要呈协同关系,并且与生态空间变化趋势吻合。功能区划定后,生态空间逐渐增大,土壤保持服务与供给服务能力持续提升,二者表现为协同关系的区域有所增加。由于水源涵养服务受降雨影响较大,在直观反映区域生态状况波动差异方面表现较弱,在功能区划定前,与供给服务主要呈协同关系,功能区划定后,与供给服务由协同关系转为权衡关系。可以看出,重点生态功能区的生态系统服务关系体现出一定的“逐步协调”特点,但并不明显,特别是水源涵养服务与供给服务,甚至从“协同”转为“权衡”关系。
4 结论与讨论
4.1 结论
本文通过对秦巴山重点生态功能区的生态空间、供给服务、调节服务的综合评估,表明重点生态功能区带动了区域生态空间“量的增长”和生态系统服务“质的提升”,但在生态系统服务之间关系的“协调性”仍然不足,甚至部分区域生态功能从“协同”转为“权衡”关系。
(1)功能区划定后,对于维持并提升内部生态空间面积、抑制人类活动干扰、促进生态空间保护修复等方面,体现出较为明显的政策效应,生态空间动态度减小了1倍,面积占比逐步提升,体现生态空间“量的增长”。
(2)功能区的划定在提高生态空间面积占比的同时,也提升了区域内的生态系统服务能力。区域内NPP、土壤保持量和水源涵养量的年际增长趋势分别为1.07、2.69和0.16,体现生态系统服务“质的提升”。
(3)重点生态功能区不同生态系统服务之间“协调性”不足,功能区划定后,土壤保持服务与生态系统供给服务协同关系有所提升,但提升幅度低于功能区外,甚至出现了水源涵养服务与生态系统供给服务由“协同”关系转为“权衡”关系。
4.2 讨论
面对区域生态系统服务的多元化特点,更多学者耦合各类生态系统服务分析相互之间的权衡与协同关系[45];针对重点生态功能区,主要从生态参数或生态系统服务的单要素或多要素变化角度开展功能区分析与成效评估[9,23 -24]。相关研究表明,国家重点生态功能区提供了重要的生态系统服务,功能区划定后人类干扰程度明显低于外部[23],生态系统服务有所提升,各生态系统服务整体呈协同关系[9,24]。本文在生态要素分析基础上,综合考虑了自然地理单元的整体性特征,将具有相似地理特征的功能区内外情况作为对比,从“结构—服务—关系”级联关系入手,对生态空间、供给服务、调节服务开展时空变化特征分析,并耦合了多要素之间的权衡与协同关系的分析。研究结果体现出了重点生态功能区对区域生态保护的促进作用,但是也发现在重点生态功能区内,生态系统服务之间的“协调性”明显不足,甚至出现从“系统”转为“权衡”的变化特征,这对国家通过生态系统保护与管理实现生态系统总体效益最大化带来挑战。也要求未来国家需要制定更有针对性的生态系统保护管理决策,提高生态系统总体效益,支撑区域生态系统服务的可持续供给。
生态系统服务权衡与协同关系研究多聚焦在相互之间的定量化分析,并在宏观层面上分析驱动因素,但生态系统变化是一个长期、复杂的动态过程,生态系统服务相互增益的协同关系需要在针对性更强的精准评估框架下才能实现科学量化。目前,尚缺少对其内在驱动因素的定量化分析。在未来的研究中,应聚焦生态系统服务涵义之间的区别与联系,在气候变化和生态系统地带性规律框架下,以区域生态系统服务协同提升为导向,分区域分类型开展主导生态系统服务之间的时空动态关联特征,定量识别影响生态系统服务协同关系的关键驱动因素,为有针对性的生态保护与修复政策制定以及区域可持续发展提供支撑。
参考文献
Progress of integrated ecosystem assessment: Concept, framework and challenges
DOI:10.11821/dlyj201510001
[本文引用: 1]

All biological and abiotic have dual attributes in the natural ecosystems. They are the integral part of ecosystem, and basic resources for the sustainable development of the human society. Objective and accurate assessment of ecosystem, not just a scientific question of ecosystem ecology, is also a management issue of the sustainable development of the human society. To objectively find and understand change features of ecosystem by comprehensive assessment is a popular and difficult topic in ecological research field, and is one of the key propositions of sustainable development of human society. Integrated ecosystem assessment is to better serve the integrated ecosystem management and enhance the ecological system of human society support ability. In this processing and behavior, the ecosystem and its service ability for human society are analyzed, and their statuses and changes are found and understood. There are many core contents in the integrated ecosystem assessment, such as the ecosystem management, ecosystem services, ecological assets. Facing the multiple, comprehensive and open ecosystem, some countries and international organizations have carried out many explorations and practices of integrated ecosystem assessment, and put forward various evaluation frameworks. There are still many problems and challenges. This paper examines the progress of ecosystem assessment, including the concept, framework model and main content, development trends and challenges. Based on the complex “social-economic-natural” ecosystems, interactive process of society and ecosystem, concept and content of ecosystem management, ecosystem services, ecological assets and their relationship are discussed. According to the practices and cases of integrated ecological system assessment, which include lots of assessment in global, regional, and national scales, four integrated assessment framework models are summed up. They are "ecological pressure-policy responses","ecological services-human well-being", "natural benefits-ecology management", "comprehensive status-change trends". However, as ecosystems are diverse, integrated, complex, and open, lots of scientific questions should be paid more attention in the future, including integrated assessment framework and its relevant theoretical basis, indicators and methods of ecosystem assessment, observation technology integration and data assimilation methods, temporal and spatial scales.
生态系统综合评估研究进展:内涵、框架与挑战
DOI:10.11821/dlyj201510001
[本文引用: 1]
自然生态系统中的所有生物和非生物都具有双重属性,既是生态系统不可或缺的组成部分,也是人类社会可持续发展的基础资源。客观准确地评估生态系统状况,不仅是生态系统生态学所面临的一个科学问题,更是人类可持续发展所面临的一个生态系统综合管理问题。如何客观全面地评估生态系统现状、变化和趋势,是生态学领域研究的热点和难点之一,成为关系着人类社会可持续发展的关键性命题之一。根据当前国内外研究主要成果,从生态系统综合评估的概念和内涵、框架模式和主要内容、发展趋势和挑战等三个方面,梳理和分析了生态系统综合评估的研究进展。基于“社会—经济—自然”复合生态系统角度和社会与生态系统的互动过程,综述了生态系统管理、生态系统服务、生态资产等概念和内涵,讨论和梳理了三者之间的关系。对相关国际组织和政府实施的全球、区域、国家等不同尺度的生态系统综合评估,分析归纳为“生态压力—政策响应”、“生态系统服务—人类福祉”、“服务价值—自然益惠”、“综合状况—变化趋势”等四种评估框架模式。但是,面对多元、综合、复杂、开放的生态系统,基于生态系统与人类社会交互关系的评估框架及相关理论研究、生态系统综合评估指标和方法体系构建、观测技术方法集成和数据同化、时空尺度选择和确定的协同等科学问题,将会成为今后生态系统综合评估发展趋势和挑战。
The value of the world's ecosystem services and natural capital
DOI:10.1038/387253a0 URL [本文引用: 1]
A primary study on Chinese terrestrial ecosystem services and their ecological-economic values
中国陆地生态系统服务功能及其生态经济价值的初步研究
Ecosystem service functions of the five reservoirs in Dabie mountain, west Anhui province
皖西大别山五大水库生态系统服务功能价值评估
DOI:10.13249/j.cnki.sgs.2014.010.1270
[本文引用: 1]
根据皖西大别山5大水库水资源特征,将其水生态系统服务划分为直接使用价值和间接使用价值2大类8个小类,以2010 年为评价基准年份,运用市场价值法、费用支出法、替代工程法等环境经济价值评估方法,对大别山5大水库生态系统服务功能价值定量评价。研究结果表明,2010年5大水库生态系统服务功能的总价值为60.59 亿元,占当年六安市国内生产总值的8.95%,其中直接使用价值为19.62 亿元,占总价值的32.41%;间接使用价值为40.97 亿元,占总价值的67.59%。调蓄洪水和水资源蓄积的功能价值构成比例高,分别为34.32%和32.51%,水库在防御洪涝灾害和涵养水源方面具有重要的作用。
Measurement of ecosystem service value based on remote sensing: A case study in Inner Mongolia, China
内蒙古生态系统服务价值遥感测量
Ecosystem service values for 4 periods and ecological function zoning of coastal wetlands on north shore of Jiaozhou Bay
胶州湾北岸滨海地区4个时期生态系统服务价值和生态功能区划分研究
Optimal protected area selection: Based on multiple attribute decision making method and ecosystem service research: Illustrated by Guanzhong-Tianshui economic region section of the Weihe River basin
基于OWA多属性决策的生态系统服务最优保护区选择研究: 以渭河流域(关天段)为例
Tradeoffs and synergies of ecosystem services in key ecological function zones in northern China
北方重点生态功能区生态系统服务权衡与协同
Relationships and trade-offs between, and management of biodiversity and ecosystem services
生物多样性与生态系统服务: 关系、权衡与管理
Spatio-temporal dynamics and scenarios simulation of trade-offs between ecosystem services in Min Delta urban agglomeration
闽三角城市群生态系统服务权衡的时空动态与情景模拟
Spatial and temporal evolution of ecosystem services and its trade-offs and synergies in Guangdong-Hong Kong-Macao Greater Bay Area
粤港澳大湾区生态系统服务时空演化及其权衡与协同特征
Multi-objective linear programming-based trade-off and optimization of the ecosystem services in Jiajiyu small watershed in the Loess Plateau, China
基于多目标线性规划的甲积峪小流域生态系统服务权衡优化
Optimization of land use structure based on ecological service value in Manas River Basin
基于生态服务价值的玛纳斯河流域土地利用结构优化
Modeling multiple ecosystem services, biodiversity conservation, commodity production, and tradeoffs at landscape scales
DOI:10.1890/080023 URL [本文引用: 1]
Ecosystem services tradeoffs arising from non-native tree plantation expansion in southern Chile
Analysis on trade-offs and synergies of multiple functions of picea schrenkiana forests in central Tianshan mountains
天山中部雪岭云杉林多功能权衡与协同关系
Simulating the effects of different management modes on the ecosystem services of agroecosystems: A case study of the Taihu Lake basin, China
不同管理模式对农田生态系统服务的影响模拟研究: 以太湖流域为例
Spatial trade-offs and synergies of ecosystem services for grazing-prohibited grassland in agro-pasture ecotone
农牧交错带禁牧草地生态系统服务空间权衡与协同关系
Discussion about natural reserve and construction of national ecological security pattern
DOI:10.11821/dlyj201703002
[本文引用: 1]
Scientific evaluation of the relationship between nature protection zones and national ecological security is the important foundation to guide the development of nature protection zones and the construction of national ecological security pattern. In the case of the national key ecological function zones, biodiversity conservation priority zones and national reserves, spatio-temporal distribution of natural protection zones and its important role in safeguarding national ecological security were analyzed quantitatively. This article also identified the lack of national ecological security pattern based on ecological system service assessment, put forward the ecological protection management and control suggestions for the demand of national ecological security construction and security. Results show that: (1) The total area of natural protection zones was 4.88 million square kilometers, accounting for 51.38% of the national land area. Grassland, forest and desert were the main ecosystems and had an area of 3.71 million square kilometers, accounting for 76.0% of the national protection zones area. Between 2000 and 2010, ecological system was basically stable in the national protection zones. There was only a small amount of transformation between different ecosystems. The characteristics of ecosystem transformation in different natural protection zones were slightly different. This had played an important role in protecting the stability of the ecological space and ecological security pattern. (2) Comprehensive consideration of ecosystem services importance in water conservation, soil conservation and biodiversity maintenance showed that the area of extremely important and important ecosystem services zones of natural protection zones was 3.21 million square kilometers, accounting for 66.02% of the national land area. Forest, grassland and shrub were the subject of the ecosystem services. Overall, during the 2000-2010 period, water conservation and soil conservation had improved. There was no obvious change of biodiversity maintenance. (3) The area of extremely important ecosystem services zones was 3.26 million square kilometers, accounting for 34.4% of the national land area. The 31.7% area of extremely important ecosystem services zones was not in the natural protection zones. Complementing and improving the existing natural protection zones were needed to construct the national ecological security pattern based on scientific demonstration. (4) It is urgent to establish a strict protection system for national ecological security construction and safeguard demand based on national governance model. Also, we should raise the cognitive level of natural law to enhance the comprehensive management of ecological system, upgrade the classification and zoning management to upgrade natural protection zones, improve the ecological compensation mechanism for establishing cooperative protection system, and strengthen the comprehensive supervision of ecological protection to minimize ecological damage.
论自然保护地与国家生态安全格局构建
DOI:10.11821/dlyj201703002
[本文引用: 1]
科学评估自然保护地与国家生态安全格局的关系是合理开展自然保护地建设和国家生态安全格局构建的重要基础。以中国国家重点生态功能区、生物多样性保护优先区和国家级自然保护区等自然保护地为研究对象,定量分析自然保护地的时空分布特征及其对保障国家生态安全的重要作用,基于生态系统服务重要性评估辨识国家生态安全格局构建的空间缺失,面向国家生态安全构建和保障需求提出生态保护管控对策建议。结果表明:① 自然保护地总面积为488.42万km<sup>2</sup>,占陆地国土面积的51.38%。生态系统类型以草地、森林、荒漠等自然生态系统为主,三种生态系统的总面积为371.24万km<sup>2</sup>,占自然保护地总面积的76.0%。2000-2010年,自然保护地的生态系统构成整体稳定,对保护生态空间稳定性和生态安全格局稳定发挥了重要作用。不同类型生态系统之间有少量转化,不同自然保护地内生态系统转换特征略有差异。② 综合水源涵养、土壤保持、生物多样性保护等生态系统服务重要性评估,自然保护地的生态系统服务极重要区和重要区总面积为321.4万km<sup>2</sup>,占区域国土总面积的66.02%。森林、草地和灌丛生态系统是水源涵养、土壤保持、维护生物多样性等生态系统服务主体。2000-2010年,水源涵养、土壤保持功能有所改善,但生物多样性维护功能无明显变化。③ 生态系统服务极重要区的31.7%没有在自然保护地内,是今后国家生态安全格局构建和自然保护地建设需要重点关注的区域。面向国家生态安全构建和保障需求,迫切需要基于国家治理模式、建立最严格保护制度,提高自然规律认知水平、强化生态系统综合管理,完善分类分区管理、强化自然保护地管控,完善生态补偿机制、建立协同保护制度,加强生态保护综合监管、严格生态损害责任追究。
Progress and some scientific issues on effectiveness assessment of terrestrial ecosystem conservation and restoration
陆地生态系统保护修复成效评估研究进展及主要科学问题
China's ecological protection redlines: Evaluation framework and method of protection effect
DOI:10.11821/dlyj201810004
[本文引用: 1]
Ecological protection redline is one of innovation regional ecological management systems, and a major strategy of construction of ecological civilization of China. This management system is established on the basis of a series of practice and development of regional ecological protection management, such as national reserves, key ecosystem service zones and forest parks. How to scientifically evaluate the effectiveness of ecological protection redline, to serve the comprehensive management of ecological protection redline and protect regional ecological security, has become one of the popular issues. According to the protective objectives and management policies issued, purpose of redline management is to protect regional ecological security and improve ecosystem service ability. The core of this task is to stabilize and gradually improve the regional ecosystem, such as natural ecological space and ecosystem services. Then, an evaluation framework, including indexes and methods, is put forward. In the framework, ecosystem structure and ecosystem services are taken as the main content of ecological protection effect assessment. By multi-dimensional space-time scale expansion, comprehensive evaluation is done by analysis of ecological changes before and after the implementation of ecological protection redline measures, by inside and outside of the red-line protection zone. Moreover, comprehensive ecological protection effect is reflected by the regional ecological security contribution and regional ecosystem self-regulation ability. That is to say, the higher the contribution and self-regulation ability, the better the protection effects are. Furthermore, the management policies, measures and other indirect drivers that may cause ecological changes can be linked and analyzed to evaluate the implementation effectiveness of redline. This paper, taking Hainan and Guangdong provinces as the study region, applies the framework and methods. In Hainan, the contribution rate of ecological protection redline to natural ecological security space is 44.8%, and that of water conservation and soil conservation services is respectively 46.1% and 69.8%. In Guangdong, the contribution rate for increasing natural ecological space reaches 95%, that for improving the quality of ecosystem growth is up to 75%, and that for enhancing water and soil conservation services is 82.4% and 54.6%, respectively.
生态保护红线成效评估框架与指标方法
DOI:10.11821/dlyj201810004
[本文引用: 1]
生态保护红线是在自然保护区、重点生态功能区、风景名胜区、森林公园等诸多区域生态管理制度不断实践基础上,面对中国国土开发和生态保护的复杂关系,继承和创新提出的一种新型区域生态管控制度,已经成为推动国家生态文明建设的重大战略。如何科学评估生态保护红线保护成效,服务于生态保护红线综合管理和保障区域生态安全,成为普遍关注的热点问题之一。针对已有的区域生态保护成效评估案例的不足,基于划定生态保护红线是为保障国家和区域生态安全的基本认知,围绕着生态保护红线“生态功能不降低、面积不减少、性质不改变”的管控目标,以生态保护红线对区域生态系统保护作用为主要出发点,提出生态保护成效评估框架和指标方法。生态保护成效评估以生态系统类型构成和生态系统服务功能为内容主线,通过多维度时空尺度拓展,耦合分析生态保护红线内外、实施前后的生态状况变化,综合评估生态保护红线对保障区域生态安全的贡献和改善区域生态状况的作用。进而,可以关联分析可能引起生态保护红线生态状况变化的管控政策、制度和其他间接驱动因素,评估政策实施成效评估。实证上选择海南省生态保护红线和广东省严格控制区为案例进行了讨论。
Evaluation on ecosystem changes and protection of the national key ecological function zones in mountainous areas of central Hainan Island
DOI:10.11821/dlxb201803004
[本文引用: 3]
Ecosystem services have become one of the major aspects of ecosystem management and evaluation. As a key area of ecosystem services, evaluation of ecosystem changes and implementation effect is important for national key ecological function zones. Such evaluation can help to maintain national ecological security, drive the implementation of the main function zone strategy and advance the construction of an ecological civilization. This article explores the ecological zone of a tropical rainforest region in the central mountain area of Hainan Island, China. Multi-source satellite data and ground observation statistics are analyzed with geo-statistics method and ecological assessment model. The core analysis of this paper includes ecosystem pattern, quality and service. By means of spatial and temporal scale expansion and multi-dimensional space-time correlation analysis, we examine the trend and stability characteristics of ecosystem change, and evaluate the implementation effect. The results showed that, first, the forest area ratio was 84.5% in 2013, which was significantly higher than the average level in Hainan Island. During 1990-2013, settlement gradually increased in ecological zone. After the implementation of the function zone in 2010, human activity intensity was still increasing, with the area ratio rising from 0.5% to 0.8%. The main land use change was urban construction and land reclamation. Second, water conservation in the ecological function zone was better than that outside the zone. During 1990-2013, water conservation increased slightly, and had obvious fluctuation in different periods. Water conservation change decreased first and then increased during both the periods 1990-2000 and 2000-2013. Water conservation quantity was 0.5178 million cubic metres per square kilometer, which was higher than the average outside the zone. Third, soil conservation in the ecological function zone was also better than that outside the zone. Soil conservation showed dramatic fluctuations and relatively poor stability during 1990-2013. Soil conservation quantity was 19500 tons per square kilometer in the ecological function zone. Fourth, the human disturbance index in the ecological function zone was significantly less than that outside the zone and had lower biodiversity threat level. This would be beneficial to biodiversity conservation. In the ecological function zone, average human disturbance index was 0.3664 and 0.1152 lower than that outside the zone. During 1990-2013, human disturbance index variation range outside the zone was 0.0152, about 5.31 times that of the inner zone. Especially in 2010-2013, the increased range of human disturbance index in the ecological function zone was significantly less than that outside value the zone.
国家重点生态功能区生态状况变化与保护成效评估: 以海南岛中部山区国家重点生态功能区为例
DOI:10.11821/dlxb201803004
[本文引用: 3]
自2000年提出生态功能保护区的概念以来,历时17年不断探索和发展完善,中国已经形成了一批国家重点生态功能区和相关配套政策,成为生态保护红线划定的重要依据和主体功能区战略实施的主要组成,对保障国家生态安全和优化国土空间格局具有十分重要的意义。海南岛中部山区在2001年成为国家生态功能保护区试点,2010年被确定为国家重点生态功能区,是较早实施生态功能保护的重点管控区域之一。本文以海南岛中部山区热带雨林重点生态功能区为研究区域,综合利用多源卫星遥感数据和地面观测统计数据,集成地统计学和生态评估模型模拟方法,以生态系统格局、植被长势、服务功能为主要评估内容,通过时空尺度拓展和多维时空对比分析,探讨了该重点生态功能区生态系统变化和保护成效。结果发现:① 2013年功能区森林面积占比为84.5%,显著高于海南岛平均水平。1990-2013年功能区内建设用地逐渐增加。2010年功能区实施后,人类活动强度仍然呈现持续增加态势,面积比例从0.5%增加到0.8%,主要表现为城镇建设和耕地开垦。② 功能区水源涵养服务功能明显优于功能区外部,1990-2013年水源涵养服务功能总体上略有增加,但是不同时间段的波动变化明显,特别是1990-2000年和2000-2013年两个时间段内均表现为先减少后增加的变化特征。功能区单位面积的水源涵养量为51.78万m<sup>2</sup>/km<sup>2</sup>,明显高于功能区外部。③ 功能区土壤保持服务功能明显要优于功能区外部,1990-2013年表现出剧烈波动、稳定性较差。功能区单位面积的土壤保持量为1.95万t/km<sup>2</sup>,明显高于功能区外部。④ 功能区人类扰动指数明显小于功能区外部,生物多样性威胁程度明显偏小,有利于生物多样性的保护。功能区平均人类扰动指数为0.3664,比功能区外部低0.1152。1990-2013年功能区外部人类扰动指数变化幅度为0.0152,约为功能区内部变化幅度的5.31倍。特别是2010-2013年,功能区内部人类扰动指数增加幅度要明显小于功能区外部。
Evaluation of protection effect of coordinated management of different kinds of nature reserves
DOI:10.31497/zrzyxb.20200403 URL [本文引用: 3]
生态保护地协同管控成效评估
Evaluation of green poverty reduction in national key ecological functional areas
绿色发展视角下国家重点生态功能区绿色减贫效果评价
Study on spatial spillover effect of eco-environmental quality in counties of national key ecological function areas
国家重点生态功能区县域生态环境质量空间溢出效应研究
Dynamic incentive effect analysis of transfer payment in national key ecological function zone
国家重点生态功能区转移支付动态激励效应分析
Effects of ecological protection and construction project on windbreak and sand fixation service function in Beijing-Tianjin area
京津风沙源区生态保护与建设工程对防风固沙服务功能的影响
Assessment on the effects of the first-stage ecological conservation and restoration project in Sanjiangyuan region
DOI:10.11821/dlxb201601001
[本文引用: 1]
In this paper, we developed a series of assessment indexes based on the evaluation of ecological effects, which consists of the ecosystem structure, qualities, services, and main impacting factors for these changes. Comprehensive monitoring and assessment methods that focused on the planning objectives of ecological conservation and restoration project were developed based on field observation, remote sensing monitoring and quantitative simulation of ecological processes. Then we assessed the ecological effects of the first-stage of ecological conservation and restoration project in Sanjiangyuan region by adopting the trend analysis of dynamics in ecosystem structure and services. The results showed that since the beginning of the project eight years ago, the macro-situation of ecosystem in this region has been getting better but not reached the best situation in the 1970s. The continued degradation trends of grassland have been initially contained, but it is difficult to achieve the expected objective of "the vegetation coverage of grassland increasing by an average of 20%-40%". The wetland and water-body ecosystems have been restored. The water conservation service of ecosystem and water supply capacity of watershed were increased, and the volume of?ecosystem water conservation reached the objective of increasing by 1.32 billion m3. The ecological restoration in the project regions tended to be better than that outside the project regions. In addition to climate change, implementation of the ecological conservation and restoration project had obvious and positive effects on vegetation restoration. However, the degradation situations of grassland were not fundamentally reversed, and the implementation of the project has not been curbing the increasing trend of soil erosion. Therefore, the local and preliminary characteristics of the first-stage of the project highlighted the long-term and arduous ecosystem conservation and protection in the Sanjiangyuan region.
三江源生态保护和建设一期工程生态成效评估
DOI:10.11821/dlxb201601001
[本文引用: 1]
基于生态系统结构--服务动态过程趋势分析,针对生态保护与建设工程预期目标,构建了由生态系统结构,质量,服务及其变化因素构成的生态成效评估指标体系,研究发展野外观测,遥感监测和生态过程定量模拟一体化的监测评估技术体系,评估了三江源生态保护和建设一期工程的生态成效.结果表明:工程实施8年以来,三江源区宏观生态状况趋好但尚未达到1970s比较好的生态状况,草地持续退化趋势得到初步遏制但难以达到预期"草地植被盖度提高平均20%~40%"的目标,水体与湿地生态系统整体有所恢复,生态系统水源涵养和流域水供给能力提高,区域水源涵养量达到了增加13.20亿m<sup>3</sup>目标;重点工程区内生态恢复程度好于非工程区,除了气候影响以外,工程的实施对促进植被恢复具有明显而积极的作用;然而,草地退化局面没有获得根本性扭转,工程实施尚未遏制土壤水蚀增加趋势,一期工程局部性和初步性特点突显出三江源区生态保护任务的长期性和艰巨性.
Integrated assessment on the effectiveness of ecological conservation in Sanjiangyuan National Nature Reserve
DOI:10.11821/dlyj201309007
[本文引用: 1]
Sanjiangyuan, located in Qinghai Province, is known as the water tower of China. This paper assessed the ecological effectiveness of those projects in Sanjiangyuan, through comparisons of ecological macrostructure, soil erosion and conservation, and grassland production before and after the projects. The natural and human driving factors for effectiveness were also analyzed. The results showed that land cover change index increased obviously, which represented the ecosystem restoration in Sanjiangyuan National Nature Reserves. The increased grassland net primary production and expanded water area were helpful to supply enough food and water to wildlife. Moreover, the declining trends of forest area were restrained in forest related nature reserves. In wetland related nature reserves, wetland area was increased. In grassland related reserves, decreasing trends of grassland and enlarging desertification were also restrained, and wetland expansion and increasing vegetation cover were obvious. In glacier related reserves, retreating glacier and thawing permafrost results to increasing water were useful to vegetation growth; however, it is uncertain in the long term.
2005-2009年三江源自然保护区生态保护和建设工程生态成效综合评估
DOI:10.11821/dlyj201309007
[本文引用: 1]
本文评价了三江源自然保护区生态系统宏观结构及涵养水源、保持水土、保护生物多样等主要生态服务功能,分析了自然保护区生态保护与建设工程的生态成效及其原因。结果显示,工程实施后,各自然保护区的土地覆被转类指数明显增加,生态系统宏观状况好转;保护区内草地生产力皆呈增加趋势,水域面积增加,食物供给能力提高,栖息地生境好转。森林类保护区的森林面积减少趋势得到遏制;湿地类保护区的湿地面积多呈增加趋势;草地类保护区的草地减少趋势缓解,荒漠化明显遏制,草地植被覆盖度有所增加;冰川类保护区多条冰川出现明显退缩导致冰川融水增多,有利于雪线以下草地净初级生产力的增加。
Spatial-temporal changes of NDVI and the response to the regional climate in the Qinling-Daba mountains for 25 years
[D].
近25a来秦巴山区植被NDVI时空变化及其对区域气候的响应
[D].
Spatiotemporal characteristics, patterns and causes of land use changes in China since the late 1980s
20世纪80年代末以来中国土地利用变化的基本特征与空间格局
2010-2015年中国土地利用变化的时空格局与新特征
DOI:10.11821/dlxb201805001
[本文引用: 1]
土地利用/覆被变化是人类活动对地球表层及全球变化影响研究的重要内容。本文基于Landsat 8 OLI、GF-2等遥感图像和人机交互解译方法,获取的土地利用数据实现了中国2010-2015年土地利用变化遥感动态监测。应用土地利用动态度、年变化率等指标,从全国和分区角度揭示了2010-2015年中国土地利用变化的时空特征。结果表明:2010-2015年中国建设用地面积共增加24.6×10<sup>3</sup> km<sup>2</sup>,耕地面积共减少4.9×10<sup>3</sup> km<sup>2</sup>,林草用地面积共减少16.4×10<sup>3</sup> km<sup>2</sup>。2010-2015年与2000-2010年相比,中国土地利用变化的区域空间格局基本一致,但分区变化呈现新的特征。东部建设用地持续扩张和耕地面积减少,变化速率有所下降;中部建设用地扩张和耕地面积减少速度增加;西部建设用地扩张明显加速,耕地面积增速进一步加快,林草面积减少速率增加;东北地区建设用地扩展持续缓慢,耕地面积稳中有升,水旱田转换突出,林草面积略有下降。从“十二五”期间国家实施的主体功能区布局来看,东部地区的土地利用变化特征与优化和重点开发区的国土空间格局管控要求基本吻合;中部和西部地区则面临对重点生态功能区和农产品主产区相关土地利用类型实现有效保护的严峻挑战,必须进一步加大对国土空间开发格局的有效管控。
Measurement method of reasonable consumption for ecosystem productivity supply service: A case study of Inner Mongolia grassland transect
生态系统生产力供给服务合理消耗度量方法: 以内蒙古草地样带为例
Estimation of global vegetation productivity from global land surface satellite data
Estimating vegetation primary production in the Heihe River Basin of China with multi-source and multi-scale data
Remote sensing-based analysis of the spatiotemporal characteristics of built-up area across China based on the plan for major function-oriented zones
基于主体功能区规划的中国城乡建设用地扩张时空特征遥感分析
Characteristic analysis of ecological status in the Yangtze River economic belt based on the plan for major function-oriented zones
基于主体功能区规划的长江经济带生态状况变化
Review of forest water conservation
森林涵养水源研究综述
Theory and method to accounting value of forest water conservative
DOI:10.5958/2455-7145.2018.00005.X URL [本文引用: 1]
森林涵养水源的价值核算研究
Spatial and temporal variations and the importance of hierarchy of ecosystem functions in the Three-River-Source National Park
三江源国家公园生态功能时空分异特征及其重要性辨识
A soil erodibility nomograph for farmland and construction sites
Study of applying USLE and geographical information system IDRISI to predict soil erosion in small watershed
应用USLE模型与地理信息系统IDRISI预测小流域土壤侵蚀量的研究
The function and economic value of soil conservation of ecosystems in Qinghai-Tibet Plateau
青藏高原生态系统土壤保持功能及其价值
