

1 引言
黄河流域以其占全国2.2%的径流量,承担着占全国15%的耕地和12%人口的供水任务[1-2],同时还承担着向流域外部分地区远距离调水的任务。黄河流域人均河川径流量473 m3,不足全国平均水平的1/4,在气候变暖和人类活动的双驱动影响作用下,黄河流域水资源的供需矛盾日益突出,已成为中国水资源极其短缺的地区之一[3-4],并在未来仍将继续面临水资源严重短缺的严峻挑战[5-6]。2019年9月18日黄河流域生态保护和高质量发展座谈会上,习近平总书记把黄河流域生态保护和高质量发展上升为重大国家战略[7]。地表水是陆地生命的重要水源,是维持生态系统稳定和保持经济社会可持续发展的关键环境因子,因此对黄河流域地表水面积(Surface Water Area, SWA)动态变化进行监测具有非常重要的意义。
由于光学遥感数据容易获取、处理简易,且水体提取精度较高,已成为大区域范围地表水自动化动态监测的主要数据源。单波段地表反射率阈值法最早用于地表水体自动提取[8-9],该方法虽简单易行,但难以提取小面积地表水体,且阴影和水体的混分现象严重[10]。Mcfeeters[11]提出了归一化差分水体指数(NDWI),并在全球范围内得到应用。随后徐涵秋[12]基于该指数提出了改进的归一化差异水体指数(MNDWI),显著提高了建筑物背景下的水体提取精度,且成为目前应用最为广泛的水体指数。虽阈值法运算效率高,但水体和非水体的最优阈值却难以精确确定,因而支持向量机(SVM)、最大似然(ML)、随机森林(RF)[13-14]等监督分类算法也被用于水体分类,但这类算法计算过程耗时,且提取精度受训练样本和算法参数的影响较大。Zou等[15]基于MNDWI、归一化植被指数(NDVI)和增强植被指数(EVI),构建了自动提取水体的混合指数规则集,该规则集不需要对MNDWI设定阈值,且比已有水体指数对湿地水体的提取效果更优[16],并在全球和洲际尺度得到广泛应用[17]。随着近年来Google Earth Engine(GEE)地理计算云平台技术的快速发展,基于长时序海量中分辨率遥感数据(如:Landsat、Sentinel等)的全球或洲际大范围区域地表覆盖制图能力获得跨越式提高[18-19],尤其是地表水体动态变化制图[20]。Pekel等[20]利用GEE云平台技术,生产了第一个30 m分辨率全球地表水连续动态变化遥感产品。Mueller等[21]、Zhou等[22]和Wang等[23]利用GEE云平台技术分别定量分析了澳大利亚、内蒙古高原和中国区域的SWA动态变化及其影响因素。
目前在黄河流域开展的SWA动态变化遥感监测研究主要集中在河套灌区[24]、红碱淖[25]、黄河源区[26]等局部地区。针对整个黄河流域范围内SWA动态变化的研究较少,高吉喜等[27]利用GEE云平台分析了整个黄河流域2000—2018年SWA时空变化特征,但目前黄河流域SWA动态变化的影响机制及其空间分异规律仍不明晰。为此,本文基于GEE云平台技术,利用混合指数规则集方法,生产1986—2019年的黄河流域30米分辨率地表水体频率时序数据集,揭示整个黄河流域、主河道区、子流域、不同区间和主要湖泊水库的SWA的时空变化特征,定量计算降雨、温度、植被和其他因素对SWA变化趋势的影响作用。以期为黄河流域地表水资源管理与优化配置,维持生态系统和经济社会用水可持续发展提供理论基础与技术支撑。
2 研究区概况与数据
2.1 研究区概况
图1
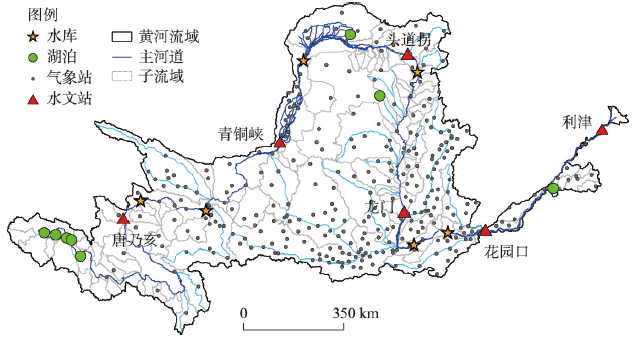
图1
黄河流域河湖水库与气象水文观测站点分布
Fig. 1
Spatial distribution of natural lakes, reservoirs and meteorological and gauging stations in the Yellow Rriver Basin
2.2 数据
本文利用1986—2018年的Landsat 5 TM、Landsat 7 ETM+和Landsat 8 OLI数据,植被叶面积指数(LAI)选用GLASS产品(
表1 数据详细参数介绍
Tab. 1
| 数据 | 时间范围 | 空间分辨率 | 时间分辨率 |
|---|---|---|---|
| Landsat 5 TM | 1986—2012 | 30 m | 15 d |
| Landsat 7 ETM+ | 1999—2002 | 30 m | 15 d |
| Landsat 8 OLI | 2013—2019 | 30 m | 15 d |
| ASTER DEM | - | 30 m | - |
| GLASS | 2000—2019 | 1 km | 8 d |
| GranD(v1.3) | 1986—2019 | - | 1 a |
| China lake dataset | 1986—2019 | - | 1 a |
| 降雨量、温度 | 1986—2019 | 295个站点 | 1 d |
本文基于GEE平台,利用Landsat大气辐射校正算法(Landsat Ecosystem Disturbance Adaptive Processing System, LEDAPS)[29]生产了1986—2019年覆盖整个黄河流域(65景)的所有可用Landsat系列卫星数据的地表反射率,并利用F-mask算法[30-31]提取云、云阴影和雪覆盖等无效观测像元。1986—2019年Landsat像元尺度的有效观测次数在黄河流域的空间分布见图2,北部区域有效观测次数大于云覆盖较多的南方区域,观测次数高值出现在卫星观测重叠区域,低值主要分布在黄河源区。Landsat不同有效观测次数在黄河流域面积占比的年际变化如图3。利用AUSPLINE气象专业插值软件[32]将降雨和温度站点数据进行空间插值。
图2
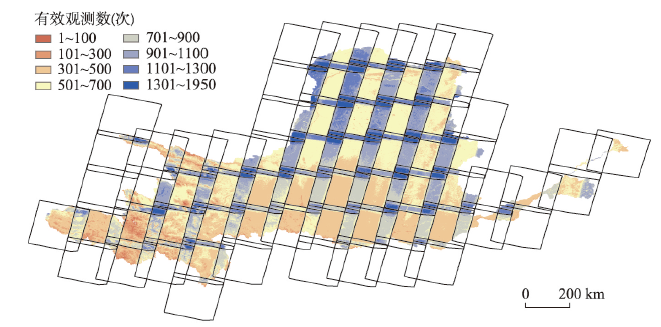
图2
1986—2019年Landsat有效观测次数在黄河流域的空间分布
Fig. 2
Spatial distribution of the frenquecy of clear Landsat observations over the Yellow River Basin from 1986 to 2019
图3
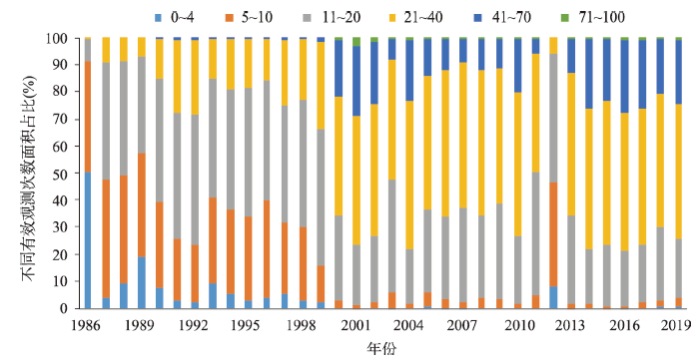
图3
Landsat不同有效观测次数在黄河流域的面积占比的年际变化
Fig. 3
Interannual variation of the area ratio of different levels of clear Landsat observations over the Yellow River Basin
3 方法
3.1 地表水体自动提取及验证方法
本文采用混合指标规律集[16]提取地表水体,该方法基于水体区域的水体信号大于植被信号的原理,利用MNDWI>NDVI或者MNDWI>EVI,且EVI<0.1这一规则提取水体范围。不同指数计算公式如下:
式中:
式中:N为一年内所有有效观测次数;W为识别为水体的次数。
基于Google Earth高分辨率影像,在黄河流域范围选取了995个水体样本,类型包括河道、湖泊、水库、淤地坝等。由于Google Earth中的高分辨率影像均为2019—2020年获取影像,则本文利用Google Earth水体样本对2019年Landsat时序数据所提取的地表水体结果进行验证,且对基于不同WIF阈值(0.05、0.10、0.15、0.25、0.35、0.50、0.75)提取的水体结果分别开展精度验证。
3.3 SWA趋势斜率分析方法
永久性或季节性水体的SWA时间序列年际变化率Slope计算公式如下:
式中:Xi为第i年的SWA值;n为总年数;当slope > 0时,SWA呈增加趋势,当slope < 0时,SWA呈减小趋势;当通过α < 0.05显著性水平的F检验时,SWA呈显著变化趋势。
由于整个流域SWA是由不同子区域的SWA相加求和得到,因此子区域SWA年际变化对整个流域SWA年际变化率的贡献率可用公式(6)计算得到。
式中:
3.4 SWA年际变化趋势定量归因方法
式中:de_SWA、de_Pre、de_Temp、de_LAI、de_Pre_SWA为去趋势后的SWA、Pre、Temp、LAI和Pre_SWA时间序列;βpre、βtemp、βLAI、βPre_SWA分别表示SWA对Pre、Temp、LAI、Pre_SWA的敏感性系数。
本文将SWA净变化斜率认为是由Pre、Temp、LAI、Pre_SWA和其他要素所引起的SWA变化斜率之和,采用微分形式表达即为:
式中:
依据全微分的基本思想,对公式(8)中影响因素对SWA趋势的影响量进行偏微分分解可得:
式中:
各影响要素对SWA变化的相对影响率采用式(9)计算:
式中:
4 结果与讨论
4.1 黄河流域地表水体提取结果与精度验证
图4
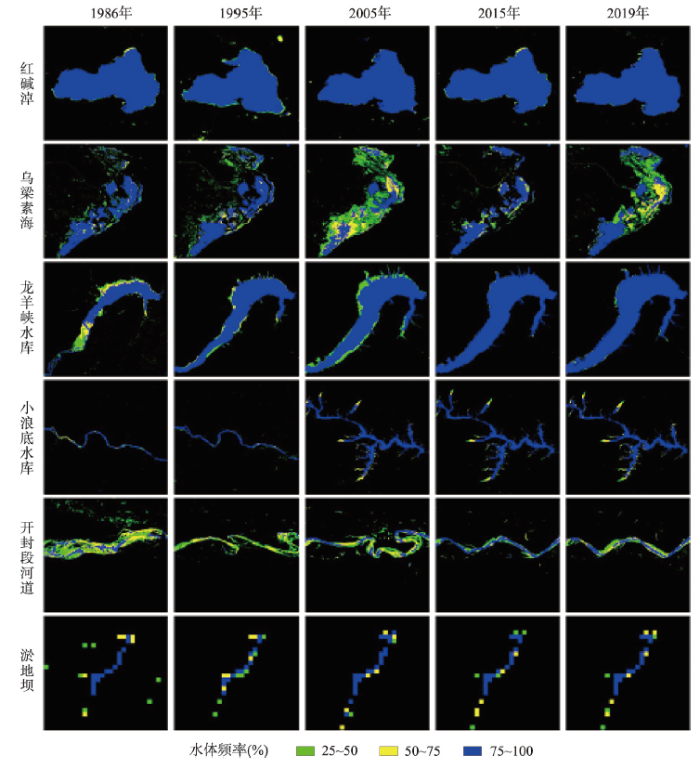
图4
1986—2019年黄河流域不同典型水体类型的水体频率
Fig. 4
WIF variation of different typical water body types in the Yellow River Basin during 1986-2019
利用Google Earth样本,对基于不同WIF阈值提取的地表水体进行精度验证,结果表明以0.05、0.10、0.15、0.25、0.35、0.50、0.75为WIF阈值的识别精度分别为97.33%,97.23%、97.17%、97.08%、97.00%、96.86%和96.38%(图5),总体识别精度的平均值高达97.00%,因而本文所用地表水体提取算法具有较高的可信度。
图5
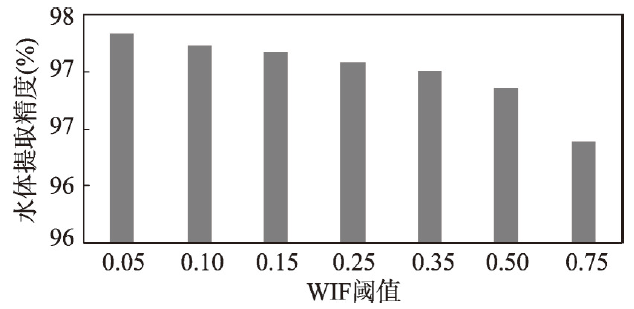
图5
基于不同WIF阈值提取的水体验证精度
Fig. 5
Validation accuracy of water body extracted using different WIF thresholds
4.2 黄河流域SWA动态变化规律
4.2.1 黄河流域总体SWA动态变化
图6
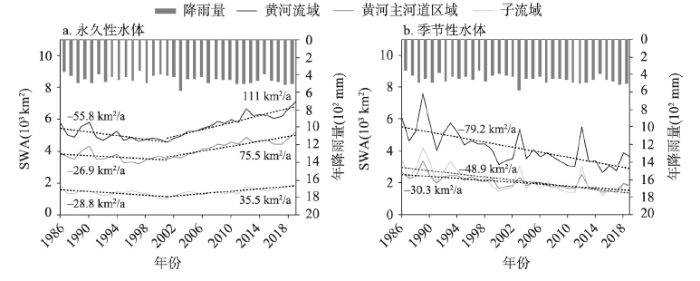
图6
1986—2019年黄河流域降雨量与永久性和季节性SWA年际变化
Fig. 6
Interannual variation of precipiation and year-long and seasonal SWA in the Yellow River Basin during 1986-2019
黄河流域多年平均季节性SWA为4208.04 km2,年际变化速率-79.2 km2/a。2019年季节性SWA比1986年减少了2432.52 km2,减少幅度为40.05%。子流域区季节性水体积极性年际变化速率为-48.9 km2/a,对全流域季节性SWA年际变化的贡献率为61.8%(图6b)。
4.2.2 不同区间SWA动态变化
本文分析了6个区间SWA时间变化特征。唐乃亥以上区域多年平均SWA为1983.67 km2,占全流域的36.18%,而头道拐—龙门区间多年平均SWA最小,仅占全流域的9.23%。不同区间多年平均SWA的排序为:唐乃亥以上>花园口—利津>青铜峡—头道拐>唐乃亥—青铜峡>龙门—花园口>头道拐—龙门。不同区间SWA年际动态变化如图7所示。唐乃亥以上、青铜峡—头道拐、头道拐—龙门、龙门—花园口区间的SWA均呈现出先减小后增加的变化特征,唐乃亥以上的突变发生于2004年,而其他3个区间的突变均发生于2001年。1986—2019年唐乃亥—青铜峡和花园口—利津区间的SWA增长速率分别为11.4 km2/a和17.1 km2/a,对全流域SWA年际变化的贡献率分别为22.1%和34.3%。
图7
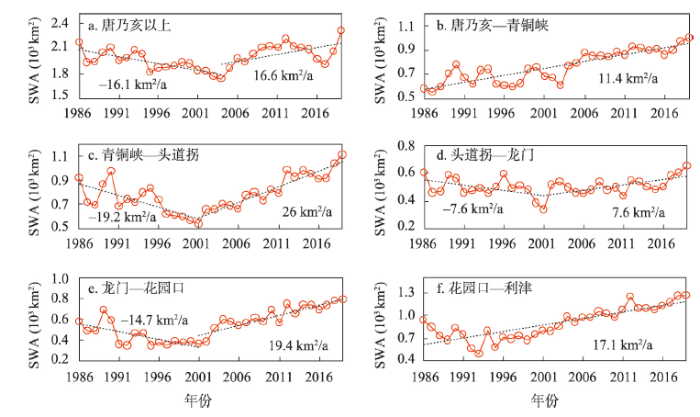
图7
1986—2019年黄河流域不同区间SWA动态变化
Fig. 7
Interannual variations of SWA of six sub-basins from the upper to the lower Yellow River Basin during 1986-2019
4.2.3 主要湖泊水库SWA动态变化
本文分析了黄河流域8个主要天然湖泊SWA时间变化特征。从图8中可看出,鄂陵湖SWA呈现缓慢增长趋势(2.01 km2/a),与梁超[37]的研究结果基本一致,1995年降至最低值,仅为659.33 km2(图8a);位于源区的其余4个湖泊(扎陵湖、岗纳格玛错、星星海、阿涌该马错)均呈现出先减小后增加的时间变化特征,增长速率分别为0.47 km2/a、0.24 km2/a、0.02 km2/a和0.01 km2/a,突变时间主要发生在2004—2006年(图8b~8e)。乌梁素海和红碱淖均为沙漠淡水湖,具有十分重要的生态屏障作用。从图7f中乌梁素海SWA呈强烈波动变化特征,1998年之前总体变化为下降趋势,1998年之后总体变化趋势呈显著增加。由于气候变化与人类活动对该湖泊的双重影响,导致乌梁素海SWA波动剧烈。由于当地地下水开采严重,1986—2019年红碱淖SWA呈显著减少趋势,年减少速率达1.01 km2/a,2015年之后SWA又重新出现小幅上涨。位于下游的东平湖SWA总体呈现增加趋势(2.35 km2/a),1994年之后SWA基本保持稳定。
图8

图8
1986—2019年黄河流域主要天然湖泊SWA动态
Fig. 8
Interannual variations of SWA of eight major natural lakes in the Yellow River Basin during 1986-2019
本文分析了黄河主河道上6个大型水库SWA时间变化特征。1986—2019年龙羊峡水库SWA呈持续增加趋势(6.88 km2/a),自2006年之后SWA较为稳定(图9a);刘家峡水库SWA总体保持稳定(0.4 km2/a)(图9b);三盛公和三门峡水库SWA均呈现先减小后增加变化趋势特征(图9c、9f);从图9d~9e可看出基于Landsat卫星数据提取的SWA时序信息可准确探测水库正常蓄水开始时间与蓄水量年际变化规律,万家寨和小浪底水库SWA分别于1999年和2000年发生突增,这与两个水库的正常蓄水时间基本吻合。2000年小浪底开始运行后,水库蓄水量显著增加,在2005年之后SWA基本维持稳定。万家寨水库开始蓄水后SWA变化波动较大,整体呈缓慢减少趋势。其中龙羊峡水库、刘家峡水库和小浪底水库SWA变化趋势与梁超[37]的研究结果基本一致。
图9
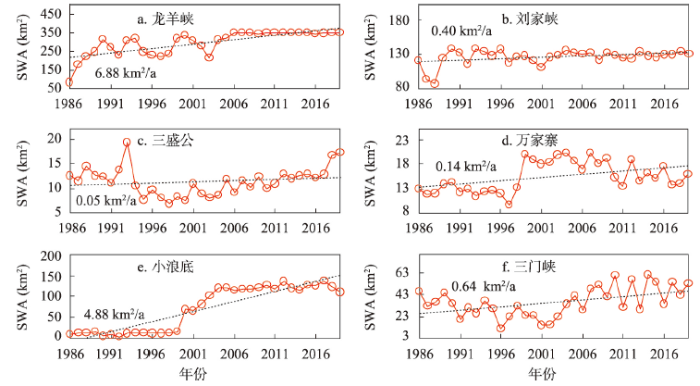
图9
1986—2019年黄河流域主要大型水库SWA年际动态
Fig. 9
Interannual variations of SWA of six major reservoirs located at the main channel in the Yellow River Basin during 1986-2019
4.2.4 子流域SWA动态变化
本文对黄河流域86个子流域1986—2019年SWA动态变化进行分析,其中50个子流域SWA呈增加趋势,主要分布在中下游区;36个子流域SWA呈减小趋势,主要分布在上游区。图10显示了1986—2019年黄河流域86个子流域SWA的绝对变化率和相对变化率。
图10
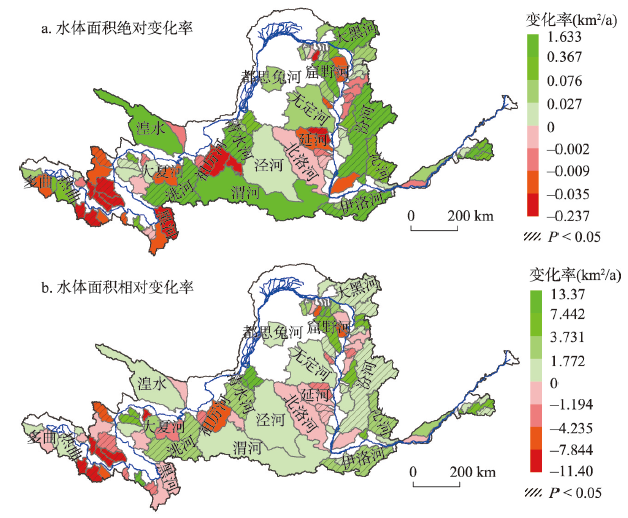
图10
1986—2019年黄河流域子流域SWA变化率
Fig. 10
Change trends of SWA for each sub-basin in the Yellow River Basin duiring1986-2019
流域上游区SWA增长率最大的流域为洮河(0.9 km2/a),变化率最大的流域为柯曲(-0.237 km2/a);流域中游区伊洛河SWA增长率最大(1.36 km2/a),葫芦河变化率最大(-0.063 km2/a);流域下游区SWA增长率最大为大汶河(1.63 km2/a)。整个黄河流域,年际SWA增长程度最大的是红柳沟(13.3%),减少程度最大的为达日勒曲(-11.3%)。
4.3 不同影响因素对黄河流域SWA趋势的定量影响作用
根据公式(7)~(10),分别计算了降水、温度、叶面积指数、前一年水体面积和其他因素对主河道区和子流域区SWA趋势的影响量与相对影响率(图11)。
图11
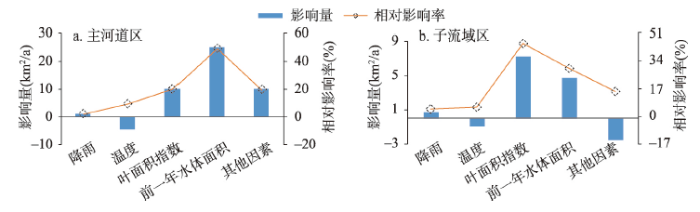
图11
各影响要素对主河道区和子流域区SWA趋势的影响量和相对影响率
Fig. 11
Impacts and relative impact rates of each influencing factor on the SWA trend for the main river channel area and sub-basin areas of the Yellow River Basin
在非气象因素中,前一年水体面积对主河道区SWA的影响作用最大(49.18%),这主要是由于前一年SWA可间接表征陆地水储量状况,而前一年水储量状态对当年的SWA存在延续效应,且区域内SWA占比越大该效应越明显[23]。
其他因素包括修建水库和淤地坝、引水灌溉、工业和生活供水等。其中,水库和淤地坝等水利水保工程措施可有效调蓄河道或沟道径流,起到增加SWA作用,而引水灌溉和工业生活供水等人类用水活动则会大幅减小SWA[41]。主河道区其他因素对SWA变化起正作用,表明主河道上的大型梯级水库对SWA的增加作用明显大于人类活动引水对SWA的减小作用。然而,在子流域区,人类用水活动对SWA的减小作用则明显大于水利水保工程措施等对SWA的增加作用。
不同影响因素对不同子流域SWA趋势的影响作用存在明显空间分异性(图12)。降雨对SWA趋势起增加作用的流域个数占79.1%,其中对无定河SWA的正影响作用最大。温度升高对SWA趋势起减小作用的流域个数占51.2%,主要分布于中游区域。但是对于黄河源区,温度升高加速了源区冰川积雪和冻土融化速率[26],导致SWA明显扩张。叶面积指数对SWA趋势起增加作用的流域个数占59.3%,主要分布于中游区域,其中对渭河SWA的正影响作用最大。前一年水体面积对SWA趋势起到增加作用的流域个数占61.6%,分布于整个黄河流域,其中对洮河SWA的正影响作用最大。其他因素对SWA趋势起到减小作用的流域个数占53.4%,分布于上中游区域,其中对大汶河SWA的正影响作用最大。
图12
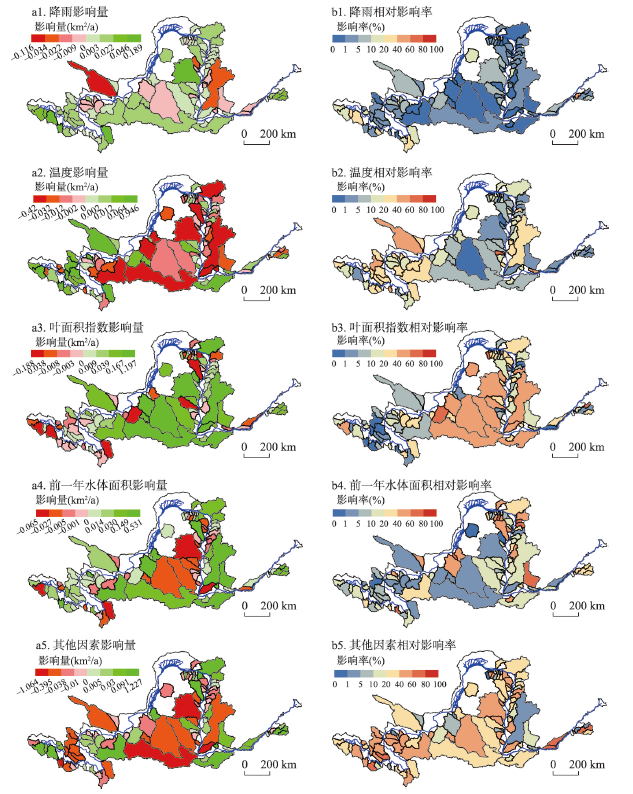
图12
降水、温度、叶面积指数、前一年水体面积和其他要素对各支流SWA的影响量和相对影响率
Fig. 12
Impacts and relative impact rates of Pre, Temp, LAI, Pre_SWA and residual factors on SWA trend for each sub-basin in the Yellow River Basin
4.4 不确定性分析
5 结论
针对黄河流域SWA长期动态变化及其空间分异特征和SWA趋势变化影响机制仍不清晰的问题,本文基于Google Earth Engine云平台,生产了1986—2019年30 m分辨率黄河流域SWA时间序列数据集,并揭示了SWA年际变化规律及其影响机制,研究结论如下:
(1)通过Google Earth所选水体样本验证结果表明,本文水体提取算法识别总体精度为97%,具有高可信度,且能够有效捕捉到各类地表水体的年际动态变化轨迹。
(2)全流域多年平均SWA为5482.79 km2,全流域永久性SWA年际增长速率49.82 km2/a,其中主河道区的贡献为83.2%。2001年为SWA趋势由减小到增加的变化转折点。除了红碱淖SWA呈持续减小,其他主要天然湖泊SWA均较为稳定。主要大型水库SWA均呈现增加趋势,其中小浪底和龙羊峡SWA增加显著。在86个子流域中,50个子流域SWA呈增加趋势,主要分布在中下游,36个子流域SWA呈减小趋势,主要分布于上游。
(3)在主河道区,前一年水体面积能够解释SWA变化量的49.18%,植被叶面积指数对SWA趋势的影响作用(19.88%)大于气象要素的影响作用(11.34%),且温度对SWA趋势的负作用(9.24%)大于降雨的正作用(2.1%)。在子流域区,植被叶面积指数能够解释SWA变化量的45%,起主导作用。温度对中游区SWA趋势起到减少作用,但却导致黄河源区SWA增加。子流域内剧烈人类用水活动对SWA减小作用大于水库调蓄作用,因而其他要素对子流域SWA表现为负影响。
本文有助于明晰黄河流域地表水资源时空变化规律及其驱动机制,对地表水资源变化归因、合理开发利用和未来规划管理提供了数据与技术支撑。但目前水体提取方法仍存在不足,归因分析方法较为单一,今后可结合雷达卫星等多源遥感数据和高级水体识别算法提高水体提取精度,结合水文模型或陆面模式等多种手段综合研判SWA变化的影响作用。
参考文献
Cascading impacts of Asian water tower change on downstream water systems
“亚洲水塔”变化对下游水资源的连锁效应
Suggestions for strategic allocation of the Yellow River water resources under the new situation
新形势下黄河流域水资源配置战略调整研究
Impact of climate change on water resources and adaptive management in the Yellow River Basin
气候变化对黄河水资源的影响及其适应性管理
Analysis and understanding on runoff variation of the Yellow River in recent 100 years
黄河近百年径流量变化分析与认识
Status and ponder of climate and hydrology changes in the Yellow River Basin
黄河流域气候与水文变化的现状及思考
A new perspective on water issues in north China
关于中国北方水资源问题的再认识
Speech at the forum on ecological protection and quality development in the Yellow River basin
在黄河流域生态保护和高质量发展座谈会上的讲话
The application of TM image in reservoir situation monitoring
TM图象在大型水库库情监测管理中的应用
Comparison and analysis of several common water extraction methods based on TM image
基于TM影像的几种常用水体提取方法的比较和分析
Improvement of the techniques for distinguishing water bodies from TM data
TM资料水体识别技术的改进
The use of the Normalized Difference Water Index (NDWI) in the delineation of open water features
DOI:10.1080/01431169608948714 URL [本文引用: 1]
A study on information extraction of water body with the modified normalized difference water index (MNDWI)
利用改进的归一化差异水体指数(MNDWI)提取水体信息的研究
Optical remotely sensed time series data for land cover classification: A review
DOI:10.1016/j.isprsjprs.2016.03.008 URL [本文引用: 1]
A meta-analysis of remote sensing research on supervised pixel-based land-cover image classification processes: General guidelines for practitioners and future research
DOI:10.1016/j.rse.2016.02.028 URL [本文引用: 1]
Continued decrease of open surface water body area in Oklahoma during 1984-2015
DOI:10.1016/j.scitotenv.2017.03.259 URL [本文引用: 1]
Open surface water mapping algorithms: A comparison of water-related spectral indices and sensors
Divergent trends of open-surface water body area in the contiguous United States from 1984 to 2016
DOI:10.1073/pnas.1719275115 URL [本文引用: 1]
High-resolution multi-temporal mapping of global urban land using Landsat images based on the Google Earth Engine Platform
DOI:10.1016/j.rse.2018.02.055 URL [本文引用: 1]
Mapping paddy rice planting area in northeastern Asia with Landsat 8 images, phenology-based algorithm and Google Earth Engine
DOI:10.1016/j.rse.2016.02.016 URL [本文引用: 1]
High-resolution mapping of global surface water and its long-term changes
DOI:10.1038/nature20584 URL [本文引用: 2]
Water observations from space: Mapping surface water from 25 years of Landsat imagery across Australia
DOI:10.1016/j.rse.2015.11.003 URL [本文引用: 1]
Continuous monitoring of lake dynamics on the Mongolian Plateau using all available Landsat imagery and Google Earth Engine
DOI:10.1016/j.scitotenv.2019.06.341
[本文引用: 1]

Lakes are important water resources on the Mongolian Plateau (MP) for human's livelihood and production as well as maintaining ecosystem services. Previous studies, based on the Landsat-based analyses at epoch scale and visual interpretation approach, have reported a significant loss in the lake areas and numbers, especially from the late 1990s to 2010. Given the remarkable inter- and infra-annual variations of lakes in the aril and semi-arid region, a comprehensive picture of annual lake dynamics is needed. Here we took advantages of the power of all the available Landsat images and the cloud computing platform Google Earth Engine (GEE) to map water body for each scene, and then extracted lakes by post-processing including raster-to-vector conversion and separation of lakes and rivers. Continuous dynamics of the lakes over 1 km2 was monitored annually on the MP from 1991 to 2017. We found a significant shrinkage in the lake areas and numbers of the MP from 1991 to 2009, then the decreasing lakes on the MP have recovered since circa 2009. Specifically, Inner Mongolia of China experienced more dramatic lake variations than Mongolia. A few administrative regions with huge lakes, including Hulunbuir and Xilin Gol in Inner Mongolia and Ubsa in Mongolia, dominated the lake area variations in the study area, suggesting that the prior treatments on these major lakes would be critical for water management on the MP. The varied drivers of lake variations in different regions showed the complexity of factors impacting lakes. While both natural and anthropogenic factors significantly affected lake dynamics before 2009, precipitation played increasingly important rule for the recovery of lakes on the MP after 2009. J.V, (C) 2019 Elsevier B.V.
Gainers and losers of surface and terrestrial water resources in China during 1989-2016
Dynamic monitoring of surface water area during 1989-2019 in the Hetao Plain using landsat data in google earth engine
Changes in lake area in response to climatic forcing in the endorheic Hongjian Lake basin, China
Variation of alpine lakes from 1986 to 2019 in the headwater area of the Yellow River, Tibetan Plateau using Google Earth Engine
DOI:10.1016/j.accre.2020.05.007 URL [本文引用: 2]
Temporal and spatial variation characteristics of land surface water area in the Yellow River Basin in recent 20 years
近20年黄河流域陆表水域面积时空变化特征研究
Continental-scale validation of MODIS-based and LEDAPS Landsat ETM+ atmospheric correction methods
DOI:10.1016/j.rse.2011.12.025 URL [本文引用: 1]
Changes in water surface area during 1989-2017 in the Huai River basin using landsat data and google earth engine
Improvement and expansion of the Fmask algorithm: Cloud, cloud shadow, and snow detection for Landsats 4-7, 8, and Sentinel 2 images
DOI:10.1016/j.rse.2014.12.014 URL [本文引用: 2]
Introduction of the professional interpolation software for meteorology data: ANUSPLINN
专用气候数据空间插值软件ANUSPLIN及其应用
A SPECLib-based operational classification approach: A preliminary test on China land cover mapping at 30 M
DOI:10.1016/j.jag.2018.05.006 URL [本文引用: 1]
Remote sensing estimation of catchment-scale reservoir water impoundment in the upper Yellow River and implications for river discharge alteration
Long-term surface water dynamics analysis based on landsat imagery and the google earth engine platform: A case study in the middle Yangtze River basin
Influences of removing linear and nonlinear trends from climatic variables on temporal variations of annual reference crop evapotranspiration in Xinjiang, China
DOI:10.1016/j.scitotenv.2017.02.196 URL [本文引用: 2]
Temporal and spatial variation of surface water andits impact on precipitation in the Yellow River basin in recent 18 years
[D].
近18年来黄河流域地表水体时空变化与降水影响分析
[D].
Quantitative association between the water yield impacts of forest cover changes and the biophysical effects of forest cover on temperatures
Estimating forest ecosystem evapotranspiration at multiple temporal scales with a dimension analysis approach
DOI:10.1111/j.1752-1688.2007.00148.x URL [本文引用: 1]
A comparative analysis of forest cover and catchment water yield relationships in Northern China
DOI:10.1016/j.foreco.2011.06.013 URL [本文引用: 1]
What is the main driving force of hydrological cycle variations in the semiarid and semi-humid Weihe River Basin, China
DOI:10.1016/j.scitotenv.2019.05.333 URL [本文引用: 1]
Spatial and temporal variability in extreme temperature and precipitation events in Inner Mongolia (China) during 1960-2017
DOI:10.1016/j.scitotenv.2018.08.262 URL [本文引用: 1]
