

1 引言
温室气体引起的全球气候变暖已成为全世界面临的重大环境问题,严重危害到人类的生存环境和健康安全。建立以可再生能源(包括太阳能、风能、生物质能、海洋潮汐能等)为主体的可持续能源体系成为解决能源短缺与环境安全问题的重要途径[1,2]。中国是当前世界上最大的CO2排放国[3],习近平在第七十五届联合国大会一般性辩论上宣布了中国在2060前年实现碳中和的决心。而中国要实现碳中和则要尽可能扩大清洁电力的使用。早日实现碳中和目标是区域经济社会转型发展与能源结构调整的内生动力与外在要求,而太阳能资源具有分布广泛、就地可取、无需运输、对环境影响小等优势[4,5,6,7],以其无可比拟的低碳属性和便利开发为未来经济增长与不断增加的碳排放脱钩提供机会,因此对区域光伏开发适宜性及减排效益进行评估对区域乃至全国“双碳”目标的达成具有十分重要的意义。同时独具中国特色的光伏发电扶贫项目对中国减贫起到了积极正向的影响,可以显著提升贫困地区人民的生活水平并扩大就业[8]。
对区域光伏开发适宜性评估是太阳能资源开发利用的前提和基础,国内外研究人员对此作了大量工作。国外诸多学者将地理信息系统(Geographic Information System, GIS)与多因子评价方法(Multi-Criteria Evaluation, MCE)相结合来分析不同区域太阳能开发的适宜性差异[9]。诸如Charabi等[10]应用FLOWA模块评估了阿曼进行大型光伏电站建设的区域适宜性,发现光伏蕴含着巨大的发电潜力;Lurwan等[11]基于GIS选取了同时满足多个自然环境与社会经济条件的栅格因子,确定了马来西亚大型智能光伏电站的最佳位置。同时大量研究从国家、区域及全球等不同尺度上评估了光伏发电的潜力。Hoogwijk率先在全球范围内对太阳能发电的潜力进行了评估[12]。近年对太阳能发电潜力的研究集中于西非、东南亚和欧盟等地区[13,14,15,16]。其中相当部分的研究倾向于分析影响光伏发电潜力的个别技术因素,如土地适宜性分析和选址标准[17,18];光伏板的倾斜角度和方向如何影响利用太阳辐射[19,20,21]、温度对光伏发电的影响[22]、不同遮阳条件下的性能模型[23]以及太阳能电池板退化和性能比率的量化[24]等。国内学者如袁小康等[25]从太阳能资源估算、利用价值、稳定度和日最佳利用时段几个方面回顾了中国在太阳能资源评估方面的主要研究成果;肖建华等[26]提出了影响选址的宏观因素和微观因素,但并没有提出一个可以定量计算的解决方案;赵明智[27]确定了槽式太阳能热发电站选址的影响因素,利用层次分析法建立了槽式太阳能热发电厂选址的指标体系。
综上发现,目前鲜有在综合考虑地形、气象、成本等多种影响因素的基础上对区域光伏开发适宜性进行空间显性的评价并量化其未来不同开发强度下的发电潜力的研究。相较于以往研究,本文不仅在较精细的百米栅格尺度上对光伏开发适宜性进行了空间显性的评价,还对区域光伏发电潜力进行了估算,这将为后续光伏开发的选址工作提供有力支撑。其次,本文是在考虑到光伏在区域能源结构调整中的占比份额逐渐递增,设置了不同开发强度情景下光伏发电潜力的评估及其与区域用电量的对比,可为区域能源结构调整和光伏产业合理发展提供科学依据。最后,对标中国“双碳目标”在对光伏发电潜力进行估算之后,本文还对其节能减排效益进行了分析,评估了京津冀光伏发电对该区域乃至全国碳减排的贡献。
京津冀地区是中国经济规模最大、最具活力的区域之一,也是中国重要的区域能源消费中心[28]。如何统筹该区域“经济发展、节能减排和民生福祉”的协同发展是亟待解决的问题。而大规模光伏开发恰是实现京津冀“生产—生态—生活”协调发展的重要工具与关键抓手。因此本文基于气象、灯光、地理矢量数据和社会经济统计数据等基础数据,构建“气象—地形—成本”多维评价指标体系,运用地理信息系统、空间主成分分析(Spatial Principal Component Analysis, SPCA)等空间模型与方法,对京津冀地区2018年光伏开发适宜性的空间差异进行评价。在此基础上,引入光伏发电潜力评价方法并结合实地调研,评估了不同开发强度下京津冀地区2018年的光伏发电潜力,进一步对标“碳达峰和碳中和”背景下分析该区域光伏开发的减排效果,以期为早日实现碳中和目标、优化调整区域能源结构和实现协调发展提供理论依据与科学支撑。
2 研究区概况
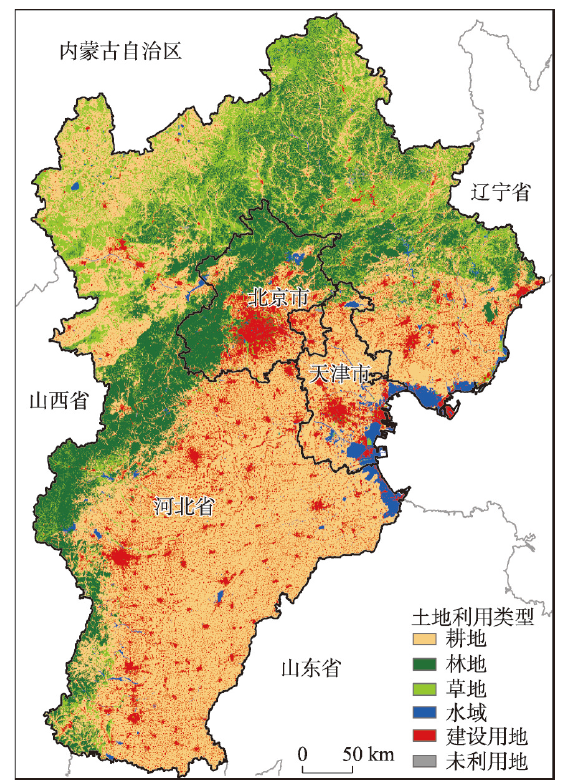
京津冀地处中国华北,北接辽宁、内蒙古,西邻山西,南交山东、河南,东傍渤海湾,区域面积为21.6万 km2,约占中国国土总面积的2.2%。京津冀地区西北为燕山—太行山山脉,东南为华北平原,地貌类型多样,山区与平原分别约占京津冀地区总面积的48.2%和43.8%(图1)。2018年京津冀地区GDP和能源消费总量的占比均超过全国总量的1/10,且煤炭消费占京津冀能源消费总量的3/4。2018年京津冀地区累计光伏装机容量1402万kW,新增装机容量441万kW,《中华人民共和国国民经济和社会发展第十四个五年规划和2035年远景目标纲要(草案)》(下称规划纲要草案)中明确提出在京津冀北部承德地区建立国家级清洁能源生产基地,该地区发展光伏产业的潜力巨大。
图1
3 数据与研究方法
3.1 研究技术路线
本文首先剔除京津冀地区的耕地、城市建成区、自然保护区、水域等陆地集中式光伏不易建设的区域(约占京津冀面积67%),再通过构建“地形—气象—成本”的光伏开发适宜性评价指标体系对其余区域(约占京津冀总面积33%)进行光伏开发适宜性评价。进而,根据评价结果将这些区域划分为非常适宜区、较适宜区、一般适宜区、较不适宜区和不适宜区5类并获得其数量与空间分布状况。并据此,在综合考虑光伏板效率、损耗率等的基础上,估算京津冀在不同开发强度情景下的光伏发电潜力及其减排效益(图2)。
图2
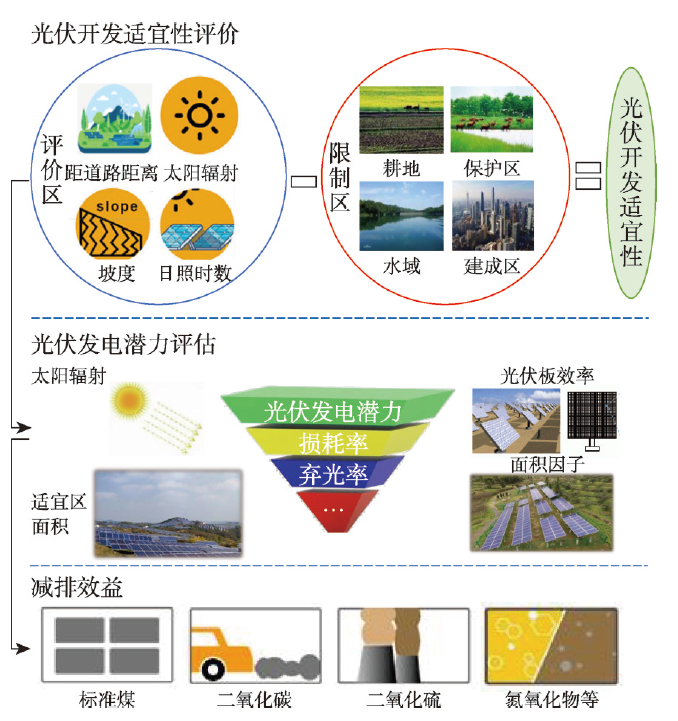
图2
光伏开发适宜性评价与效益评估分析框架
Fig. 2
The analysis framework of photovoltaic development suitability and benefit evaluation
3.2 数据来源
本文所需的数据主要有以下6类,分别是气象数据、地形地貌数据、土地利用数据、夜间灯光数据、基础地理要素数据以及社会经济统计数据(表1)。① 气象数据包括:年总太阳辐射数据和年日照时数数据,来源于中国气象数据网(
表1 评价指标数据及其预处理
Tab. 1
| 指标名称 | 处理方法 | 数据来源 |
|---|---|---|
| 年太阳总辐射 | 站点数据Anusplin插值为百米栅格数据 | 中国气象数据网 |
| 年日照时数 | 站点数据Anusplin插值为百米栅格数据 | 中国气象数据网 |
| 数字高程模型 | 拼接(Mosaic)后重采样(Resample)为百米栅格数据 | 地理空间数据云 |
| 坡度 | 采用坡度(Slope)工具计算得到百米栅格数据 | 根据DEM数据计算 |
| 土地利用类型 | LUCC 100×100 m栅格数据 | 中国科学院资源环境科学与数据中心 |
| 地貌类型 | 中国1:100万地貌类型重采样(Resample)为百米栅格数据 | 中国科学院资源环境科学与数据中心 |
| 距城镇距离 | 欧式距离(Euclidean distance)计算得到百米栅格数据 | 国家基础地理信息中心 |
| 距道路距离 | 欧式距离(Euclidean distance)计算得到百米栅格数据 | 国家基础地理信息中心 |
3.3 评价指标选取及其合理性验证
光伏电站建设的适宜性评价需要考虑多因素的影响,可分为3方面:① 地形因素包括高程、坡度、地貌类型等。随着海拔的升高,建设施工和后期保养维护的难度和成本也随之增大,当海拔增加至一定高度时,不适合建设光伏电站。坡度影响着太阳辐射强度和日照时间,进而影响太阳能资源的空间分布。平原和相对平坦的高原等地貌是光伏开发的理想场所,陡峭的山地等则不适宜光伏建设。② 成本因素包括距最近城市距离、距最近道路距离;光伏电站的施工建设,离不开大型机械和设备的运输,良好的交通条件是保障,距主干道路的远近可衡量建设的成本和便利程度。离城镇越近,越靠近消费市场,电力传输线路的建设成本和电力长距离运输的损耗也越少,光伏发电成本越低。③ 气象因素包括太阳总辐射和日照时数,前者与光伏电站的发电量密切相关,是影响光伏电站区域适宜性的重要指标,后者影响光伏发电的稳定性,日照时数变化会相应引起发电量变化。太阳总辐射越大,日照时数越长,说明其太阳能资源条件越好,越有利于该地区光伏的开发利用。
为确保评价的科学性与准确性,避免出现各指标信息重叠、高度相关的情况,在进行光伏开发适宜性评价前需对指标进行多元共线性诊断。通常采用方差膨胀因子(VIF)和容忍度(TOL)来判断指标间的多元共线性程度。当VIF>10(即TOL<0.1)时,表明所选指标的多元共线性较为严重,不宜开展评价研究。通过创建1 km×1 km的网格覆盖整个研究区,共均匀生成214369个网格,利用网格提取8个指标和光伏开发适宜性指数(SPU)值,通过Stata软件进行共线性诊断(表2)发现各指标的方差膨胀因子均小于10,说明各指标间并无显著的相关关系。
表2 多重共线性检验结果
Tab. 2
| 指标名称 | 方差膨胀因子 (VIF) | 容忍度 (TOL) |
|---|---|---|
| 年太阳总辐射(ASR) | 3.93 | 0.25 |
| 数字高程模型(DEM) | 3.54 | 0.28 |
| 年日照时数(ASH) | 2.6 | 0.38 |
| 坡度(SLO) | 1.88 | 0.53 |
| 距城镇距离(DFC) | 1.74 | 0.57 |
| 土地利用类型(STY) | 1.5 | 0.66 |
| 距道路距离(DFR) | 1.42 | 0.70 |
| 地貌类型(GEO) | 1.11 | 0.89 |
3.4 研究方法
式中:S表示第i指标的标准化值,其值域范围为0~1;Ii为第i指标的实际值;Imax为第i指标的最大值;Imin为第i指标的最小值。
图3
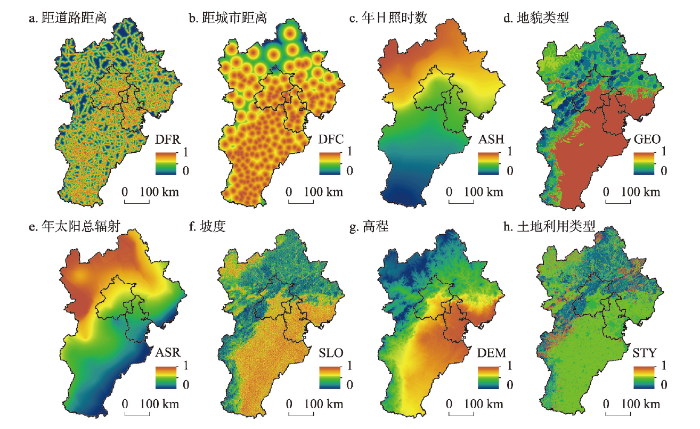
图3
光伏开发评价因子数据集
Fig. 3
Dataset of evaluation factor for photovoltaic development
SPCA通过对特征光谱空间坐标轴的旋转,将相关的多变量空间数据转化为少数几个不相关的综合指标,实现用较少的综合指标最大限度的保留原来较多变量所反映的信息[29]。采用空间主成分分析法并不需要人为确定各个指标的权重,可以避免因主观因素而造成最终结果的偏差。借助ArcGIS软件多元分析工具(Principal Components),可得到每个主成分所对应的空间载荷图和各主成分的累积贡献率。根据光伏开发适宜性指数计算公式(式(3)),结合主成分载荷矩阵(表3),计算SPCA分析得到的8主成分的方差贡献率,得到各评价因子的权重(表4),最后通过ArcGIS栅格计算器将各评价单元进行加权求和,采用ArcGIS中自然断点法(Natural breaks)对结果进行重分类,定义为不适宜、较不适宜、一般适宜、较适宜和非常适宜区5类。再将限制区图层与分类结果叠加,得到光伏开发的适宜性分布。计算公式如下[30]:
式中:SPU为光伏开发适宜性指数;ri为第i个指标的权重;Xi为第i个归一化的指标。
表3 主成分的特征值及其贡献率
Tab. 3
| 主成分 | 特征值 | 方差贡献率(%) | 累计方差贡献率(%) |
|---|---|---|---|
| PC1 | 4.45 | 55.72 | 55.72 |
| PC2 | 1.18 | 14.77 | 70.50 |
| PC3 | 0.87 | 10.92 | 81.43 |
| PC4 | 0.57 | 7.23 | 88.66 |
| PC5 | 0.47 | 5.95 | 94.61 |
| PC6 | 0.22 | 2.80 | 97.42 |
| PC7 | 0.14 | 1.76 | 99.18 |
| PC8 | 0.06 | 0.81 | 100 |
表4 主成分载荷矩阵
Tab. 4
| 指标 | PC1 | PC2 | PC3 | PC4 | PC5 | PC6 | PC7 | PC8 | 权重(%) |
|---|---|---|---|---|---|---|---|---|---|
| DFR | 0.49 | 0.15 | 0.78 | -0.31 | -0.10 | -0.07 | -0.01 | 0.01 | 11.36 |
| DFC | 0.65 | 0.30 | 0.25 | 0.63 | 0.08 | -0.08 | -0.03 | -0.01 | 12.52 |
| DEM | 0.86 | 0.26 | -0.02 | -0.05 | 0.08 | 0.40 | -0.02 | 0.02 | 12.05 |
| SLO | 0.82 | 0.46 | -0.03 | -0.05 | 0.25 | -0.07 | 0.03 | 0.18 | 12.73 |
| GEO | 0.86 | 0.35 | -0.01 | -0.06 | 0.26 | -0.04 | 0.10 | -0.18 | 12.69 |
| STY | 0.57 | 0.63 | 0.01 | 0.15 | -0.48 | 0.06 | -0.05 | -0.02 | 11.97 |
| ASH | -0.76 | 0.43 | 0.27 | 0.06 | 0.28 | 0.09 | -0.23 | -0.03 | 13.44 |
| ASR | -0.82 | 0.25 | 0.35 | 0.18 | 0.02 | 0.15 | 0.25 | 0.02 | 13.25 |
式中:SGEP为光伏发电潜力(kWh);SA为适宜发展光伏电站的面积(km²);AF为接受太阳辐射的面积因子;ASR为单位面积的年太阳总辐射(kWh·km-2·a-1);PE为太阳能电池板的发电效率;LO为损耗率;AP为弃光率。参数值及设定依据参见表5。
表5 光伏发电潜力估算参数设置
Tab. 5
| 参数 | 设定依据 | 参数值 |
|---|---|---|
| AF | 承德市正北沟光伏发电厂实地调研 | 0.35 |
| ASR | 统计插值后的单位面积太阳总辐射 | 5621 |
| PE | 采用目前应用最为广泛的多晶硅电池板的发电转换率 | 16.5% |
| LO | Li等[33] | 7.5% |
| AP | 国家可再生能源中心( | 1.8% |
4 结果与分析
4.1 光伏开发适宜性分析
剔除限制开发区域,光伏开发适宜性评估区域(以下简称“评估区”)面积占京津冀地区总面积的32.78%(图4)。将评估区的适宜性评价结果依据自然断点法分别按0.38~0.59、0.59~0.65、0.65~0.70、0.70~0.77、0.77~0.92的范围定义为不适宜、较不适宜、一般适宜、较适宜和非常适宜区5类。适宜区总面积为4.82万km2,占评估区面积的67%,其中非常适宜区、较适宜区和一般适宜区面积分别占到了评估区的9.6%、22.9%和34.5%,不适宜区总面积约为2.44万km2,约占到评估区面积的33%。在非常适宜区的主要分布地市中,张家口所占面积最多,承德次之(图4);较适宜区主要分布在保定、张家口和承德等市;一般适宜区面积最大,分布最广,在11个地市中均有分布,其中尤以承德市占比最大,达到了39%(图4);较不适宜区和不适宜区的面积比之其他几类适宜区相对较少,少量分布在石家庄、邢台和承德等地市(图4)。
图4
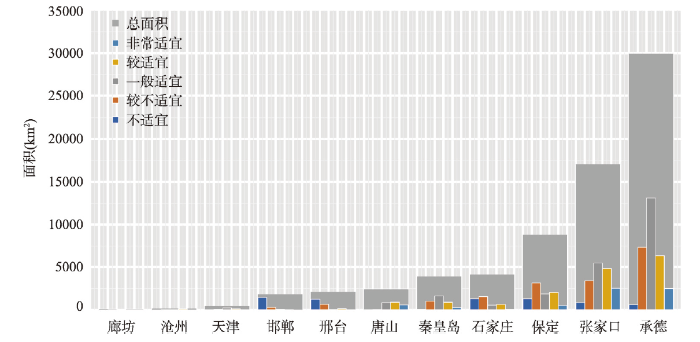
图4
京津冀各类光伏开发适宜区在不同地市的面积统计
Fig. 4
Area statistics of various suitable areas of photovoltaic development in different cities in Beijing-Tianjin-Hebei region
京津冀地区光伏开发适宜性呈现出由西北向东南递减的空间分布趋势,各类适宜区及不适宜区主要分布在“燕山—太行山”一线西北侧,集中了京津冀地区近90%的适宜区面积,其范围横跨东北和华北两大区域,汇集了华北地区绝大部分的山脉和丘陵,其中燕山作为一条天然地理界线将适宜区和不适宜区分开,其北侧以适宜区为主,南侧以不适宜区为主(图5)。非常适宜区主要分布在冀北地区的承德市、张家口市,同时在燕山南侧的京津地区也有零星分布(图5)。这些区域具有进行光伏开发的天然优势,其用地类型以草地为主,主要地貌类型为山地丘陵、山前冲积平原和少部分平原,地形总体坡度在15°~25°之间,年日照时数在2500 h以上,年总太阳辐射在5800 MJ·m-2·a-1之上,这使光伏发电效率大大提高,距离城市和主要道路距离适中则极大地降低了光伏电站在建设中的运输成本。
图5
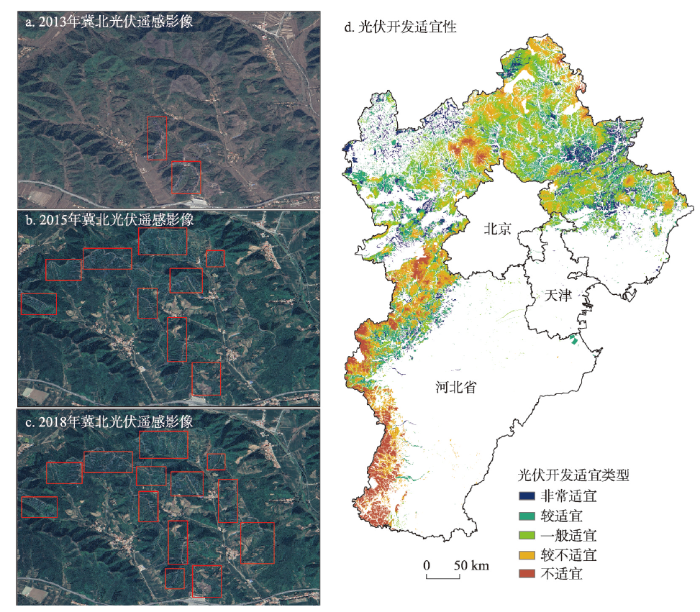
图5
京津冀光伏开发适宜性
注:图a~c中的红框内为光伏区域。
Fig. 5
Suitability of photovoltaic development in Beijing-Tianjin-Hebei region
较适宜区和一般适宜区空间分布较为广泛,呈集中与零散式分布并存的态势,集中分布于“燕山—太行山”一线的北侧,零散分布于其南侧。北侧区域进行光伏开发的优势较为明显,以荒草地为主的用地类型使得用地成本降低、用地手续简化,相对缓和的坡度则可以保证大规模集中式光伏的建设,较长的年日照时数(2200 h以上)和较强的年总太阳辐射(5500 MJ·m-2·a-1之上)则保障了发电量和发电效率减少了电站亏损风险,相对适中的距离城市和主要道路距离则可以部分降低材料与建设运输成本。不适宜区和较不适宜区主要分布在太行山西侧(图5),这些区域内虽然日照时数和太阳辐射条件较好,但主要地貌类型以陡峭的山地为主、海拔较高(2500 m以上)、地形起伏、坡度较大、不利于大规模光伏建设项目的开展,同时这些区域距离主要城市及道路较远,无形之中也会增加开发建设的成本。
4.2 光伏发电潜力与电力需求分析
通过对京津冀地区光伏发电潜力估算发现,京津冀地区光伏发电发展潜力巨大,年发电潜力约为1.857×10¹² kWh,相当于2018年京津冀地区全社会用电量的3.47倍,其中非常适宜区发电潜力5.348×10¹¹ kWh、较适宜区发电潜力1.322×10¹² kWh(表6)。开发利用28.89%的光伏发电潜力,即可满足京津冀地区2018年的电力需求,若达到100%的开发强度(非常适宜区与较适宜区全部开发),则可基本满足京津冀及其周边省份(山东、河南,山西)在2018年的电力消耗。同时需要注意的是,光电相较于水电、风电等清洁能源具有较高的能源密度(单位体积内包含的能量)(7.8 W·m-2)[34],但相较于煤炭、石油等传统化石能源则低得多,这意味着光电的大规模开发也伴随着大量的土地占用。计算可得,若要达到京津冀地区能源结构中光伏发电占比50%以上,需要约3247 km2的土地。
表6 京津冀不同光伏开发情景下的发电潜力
Tab. 6
| 开发情景 | 情景释义 | 面积(km2) | 发电潜力(亿kWh) | |
|---|---|---|---|---|
| S1 | S1-Q1 | 非常适宜区开发25% | 1622.59 | 1337.09 |
| S1-Q2 | 非常适宜区开发50% | 3245.10 | 2674.17 | |
| S1-Q3 | 非常适宜区开发75% | 4867.64 | 4011.26 | |
| S1-Q4 | 非常适宜区开发100% | 6490.19 | 5348.34 | |
| S2 | S2-Q1 | 较适宜区开发25% | 4011.38 | 3305.64 |
| S2-Q2 | 较适宜区开发50% | 8022.76 | 6611.28 | |
| S2-Q3 | 较适宜区开发75% | 12034.13 | 9916.91 | |
| S2-Q4 | 较适宜区开发100% | 16045.51 | 13222.55 | |
注:S1景下,S1-Q1情景、S1-Q2情景、S1-Q3情景均已开发; S2情景下,S2-Q1情景、S2-Q2情景、S2-Q3情景均已开发。
研究发现光伏发电潜力分布存在较强的空间异质性。从区域层面看,京津冀西北部的年发电潜力最大,光伏发电潜力为1.67万亿kWh,合计占京津冀全部光伏发电潜力的90.9%。而京津冀东部东南地区的光伏发电潜力仅为0.18万亿kWh。从市级尺度看,京津冀13个地市中承德、张家口和保定3个城市的用电量仅占京津冀地区的21.32%,但光伏发电潜力占比高达83.62%。夜间灯光值和区域间电力需求具有显著的相关性[35],可以较好地反映区域间人类活动与工业发展状况,因此用夜间灯光值来表征不同区域间电力需求的差异。通过对光伏开发适宜性与夜间灯光进行双变量局部自相关分析发现,除不显著区域外,高潜力—低需求、低潜力—高需求和低潜力—低需求是3种主要的聚类类型(图6b),京津冀地区电力生产和消费需求之间存在着较为显著的空间错配问题。高潜力—低需求地区主要分布在冀北地区,低潜力—高需求地区则主要分布在各城市建成区,低潜力—低需求地区则分布在太行山区(图6b)。总体来看,京津冀区域间电力需求差异十分显著。京津唐地区工业产业集聚,电力需求旺盛(图6a),但大部分电力来源于火电厂,环境问题凸显,而冀北地区具有较强的光伏发电潜力。
图6

图6
京津冀光伏开发适宜性与夜间灯光数据叠加图
Fig. 6
Overlay map of photovoltaic development suitability and nighttime light data in Beijing-Tianjin-Hebei region
4.3 不同开发强度下的减排效果
京津冀地区是中国大气污染物排放量和排放强度(单位国土面积排放量)最高的区域[36,37,38]。光伏开发受到国家政策、市场调节、原材料供应等诸多因素的影响,是一个循序渐进的过程,短期内较难实现大规模的光伏开发。因此,本文考虑到光伏发电在区域能源结构中占比逐步上升,按照非常适宜区和较适宜区的开发比例,设置了8个不同开发强度情景。研究发现,在非常适宜区全部开发情景下(S1-Q4),京津冀地区年碳减排量约为5.33亿t,占京津冀当年碳排放量的50%,可节约近2.14亿t标准煤,少排放SO2约0.16亿t、NOX约0.08亿t、粉尘约1.45亿t;在较适宜区全部开发的情景下(S2-Q4),年碳减排量是S1-Q4情景下的2.5倍,相当于中国2018年碳排放总量的13%,同时相较于S1-Q4情景,可节约近2.5倍标准煤,少排放2.27倍的SO2、NOX以及粉尘;在非常适宜区和较适宜区全部开发的情景下(“S1-Q4”+“S2-Q4”),年碳减排量约为18.51亿t,是京津冀地区2018年碳排放的1.8倍,占全国2018年碳排放总量的五分之一,同时相较于S1-Q4情景,还可节约3.47倍的标准煤,少排放3.5倍的SO2、NOX和粉尘(表7)。
表7 不同光伏开发强度下的减排效果
Tab. 7
| 开发情景 | 情景释义 | 减排物(万t) | |||||
|---|---|---|---|---|---|---|---|
| 氮氧化物 | 二氧化硫 | 粉尘 | 标准煤 | 二氧化碳 | |||
| S1 | S1-Q1 | 非常适宜区开发25% | 200.56 | 401.12 | 3636.87 | 5348.34 | 13330.74 |
| S1-Q2 | 非常适宜区开发50% | 401.12 | 802.25 | 7273.74 | 10696.68 | 26661.47 | |
| S1-Q3 | 非常适宜区开发75% | 601.68 | 1203.37 | 10910.61 | 16045.02 | 39992.21 | |
| S1-Q4 | 非常适宜区开发100% | 802.25 | 1604.50 | 14547.48 | 21393.36 | 53322.95 | |
| S2 | S2-Q1 | 较适宜区开发25% | 495.84 | 991.69 | 8991.33 | 13222.55 | 32957.21 |
| S2-Q2 | 较适宜区开发50% | 991.69 | 1983.38 | 17982.67 | 26445.1 | 65914.42 | |
| S2-Q3 | 较适宜区开发75% | 1487.53 | 2975.07 | 26974.01 | 39667.66 | 98871.63 | |
| S2-Q4 | 较适宜区开发100% | 1983.38 | 3966.76 | 35965.34 | 52890.21 | 131828.8 | |
5 讨论与结论
5.1 讨论
科学、合理评估区域光伏开发适宜性及其发电潜力对实现能源结构转型与达成“双碳目标”至关重要。本文研究发现,京津冀地区适宜光伏开发的面积为22535.7 km2,年发电潜力为1.85×10¹² kWh,碳减排潜力为18.51亿t,而Qyabc等学者研究发现中国有3.79×10⁶ km2适宜用地可以开展光伏电站建设,年发电潜力为1.38×10¹⁴ kWh[32]。对比分析得知,京津冀光伏开发适宜区面积占全域总面积的22%,发电潜力是2018年当地用电量的3.47倍,而全国光伏开发适宜区占国土总面积38%,发电潜力是全社会用电量的18.1倍,这表明光伏发电在京津冀与全国均具有很大的发展空间。规划纲要草案中计划新建的冀北清洁能源基地也说明京津冀地区存在大规模光伏开发的必要性,而本文则可为规划草案的落地、大型光伏电站的选址提供空间显性的数据支撑。值得注意的是,本文研究发现光伏发电平均土地密度为0.012 m2·kWh-1,与联合国环境规划署(UNEP)公布的全球平均数据(0.01 m2·kWh-1)及全国尺度研究数据(0.027 m2·kWh-1)差异较小[32],但仍高于煤炭、石油、天然气等传统化石能源的平均土地密度,意味着大规模光伏开发势必占用更多土地[33]。根据国家能源局在《关于2021年风电、光伏发电开发建设有关事项的通知》中规划2025年京津冀地区光伏发电要占到其电源结构16.5%,需要约674 km2的土地支撑其发展,这意味着仅需开发京津冀光伏开发非常适宜区中的10.4%即可实现京津冀2025年电源结构调整中的光伏发展目标,这也意味着未来京津冀区域的光伏发展仍有较大的潜力与空间。值得注意的是,本文当前所评估的为理想状态下的光伏开发适宜性,并没有考虑到在实际施工过程中的下垫面与气候状况,因而光伏工程实际施工时,还应该考虑京津冀地区不同岩性、降水量以及易发地质灾害对项目的影响。此外,大规模的光伏开发对生态环境也有一定程度的影响。相关研究表明,光伏开发建设过程中短期内虽会造成部分物种数量减少或丰度降低,但不会使这些物种在区域内绝对消失[39,40]。同时,在光伏电站营运期间,人为扰动减少,且大型的光伏基础设施可以保护植被免受强烈太阳辐射和强风的影响,清洗太阳能光伏板的水可以为植物提高生长所需的水分,为耐荫性植物的生长创造条件[41],显著提高该区域植被覆盖率,有利于改善脆弱的生态环境[42]。此外,大面积覆盖的光伏电板会吸收太阳辐射并将其转换成电能,减少地表大量的太阳直接辐射,对局部小气候还具有降温增湿的作用[43]。
进一步地分析,京津冀地区要大规模开发光伏,提高其在能源结构中的占比,机遇与挑战并存。首先,光伏发展适宜性评估结果显示京津冀区域光伏发展的适宜区较为集中地分布在冀北山区,克服地形困扰是光伏大规模开发建设必须考虑的议题。随着近年来中国光伏产业装备制造能力、施工建设水平及运维水平的大幅提升,为在资源条件复杂地区开展光伏建设提供了可能,诸如在冀北山区开发建设的三沟镇100 MW光伏发电项目是中国北方最大的山地光伏项目。其次,储能系统是保障光伏发电平稳运行的关键措施,也是当前光伏发展的主要制约因素[44,45,46]。鉴于此规划纲要草案提出新建“冀北清洁能源基地(产储输一体)”以助力京津冀光伏发展,同时冀北电网除大力发展锂电池储能技术之外,也积极推动丰宁、抚宁、尚义抽水蓄能电站建设,规划到2025年抽水蓄能电站装机达到527万kWh。再次,受限于大型电力传输系统的缺乏,光电的大规模区域间输送还存在较大困难。因此在规划纲要草案中拟新建多条特高压输电线路(UHV),再结合京津冀地区已有的“四纵四横”电力输送网络,这使得光电的跨区域、远距离输送成为可能,将极大促进京津冀地区光伏产业发展。最后,光伏开发的生态影响也是光伏大规模发展的隐忧,越来越成为学者、决策者和大众关注的热点议题之一。综上,随着光电在京津冀能源结构体系和节能减排中扮演着越来越重要的角色,纵然其有诸多发展限制因素,但施工运维水平提升、储能技术普及、大型输电网络建设、光伏发展的生态影响的逐渐明晰,将破解光伏选址、储能和运输、生态影响等难题,助力京津冀地区光伏大规模开发。
5.2 结论
本文在中国致力实现碳中和背景下,选取地形、气象和成本等多维度指标,对京津冀地区光伏发电适宜性空间格局、发电潜力、节能减排效益进行了评估,为中国碳减排及区域能源结构调整提供了新思路,主要结论如下:
(1)京津冀地区光伏开发适宜区占到区域总面积的1/5,其中一般适宜区是最主要的适宜区类型,同时各类适宜区呈现出较为明显的空间分异特征,“燕山—太行山”一线则是适宜区与不适宜区的主要分界线,承德、张家口和保定市是各类适宜区的主要分布区。
(2)京津冀地区光伏发电发展潜力巨大,年发电潜力相当于2018年京津冀地区电力总消耗的3.47倍,此外该地区光伏发电还可依靠特高压输电网向周边辐射。
(3)光伏发电节能减排效果显著。在非常适宜区和较适宜区全部开发的情景下,年碳减排量是京津冀地区2018年碳排放的1.65倍,占到全国排放的近1/5,同时还可节约大量标准煤和减排大量SO2、NOX和粉尘。
(4)大规模的光伏开发还存在一定的现实困难。其中土地利用限制、大型电力输送网络、储能系统是限制光伏大规模开发的主要因素。
参考文献
The technical, geographical, and economic feasibility for solar energy to supply the energy needs of the US
DOI:10.1016/j.enpol.2008.08.011 URL [本文引用: 1]
Spatial spillover effect and driving forces of carbon emission intensity at city level in China
DOI:10.11821/dlxb201906005
[本文引用: 1]

Since the Paris Climate Change Conference in 2015, reducing carbon emission and lowering carbon intensity has become a global consensus to deal with climate change. Due to different economic development stages, carbon intensity is regarded as a better index to measure regional energy-related carbon emissions. Although previous scholars have made great efforts to explore the spatiotemporal patterns and key driving factors of carbon intensity in China, the results lack the perspective from city level because of limited availability of statistical data of city-level carbon emission. In this study, based on carbon intensity of 283 cities in China from 1992-2013, we used the kernel density estimation, spatial autocorrelation, spatial Markov-chain and quantile regression panel model to empirically reveal its spatial spillover effects and explore the critical impact factors of carbon intensity at the city level. Our result indicates that although the total carbon emission increased during the study period, carbon intensity saw a gradual decline and regional differences were shrinking. Secondly, the city-level carbon intensity presented a strong spatial spillover effect and diverse regional backgrounds exerted heterogeneous effects on regions. Thirdly, quantile panel data analysis result showed that for low-intensity cities, on the one hand, FDI and transport sector were main contributing factors, and economic growth, technical progress and high population density negatively affected carbon intensity. On the other hand, industrial activity, extensive growth of investment and urban sprawl were key promoting factors for high-intensity cities, and population density was beneficial to emission reduction task. Furthermore, technological advance has not exerted negative influence on carbon intensity in high-intensity cities. At last, we suggested that Chinese government should take different carbon intensity levels into full consideration before policy making.
中国城市碳排放强度的空间溢出效应及驱动因素
A quantile regression analysis of China's provincial CO2 emissions: Where does the difference lie?
DOI:10.1016/j.enpol.2016.09.003 URL [本文引用: 1]
Solar Energy Technology Handbook
Solar energy in progress and future research trends
Spatiotemporal patterns of energy carbon footprint and decoupling effect in China
DOI:10.11821/dlxb202101016
[本文引用: 1]
The global environment issue resulting from carbon emissions has aroused worldwide concern for governments, the public and scientific communities. A precise measurement of the time-resolved and spatial distribution characteristics of carbon dioxide (CO2) and carbon footprint as well as its long-period evolution mechanism, can help clarify the relationship between environmental carbon load and economic growth, and are critical references to the formulation of scientific carbon emission reduction targets with reasonable and differential emission reduction policies. In this study, the mainland of China is taken as the research object. According to the quantitative correlations between DMSP-OLS nighttime light image data and carbon emission statistics, the carbon emission panel data model was simulated for China's carbon emissions in the period 2000-2013, and then the spatiotemporal evolving trend and spatial distribution characteristics of carbon emissions in the 14-year research period were discussed using Theil-Sen Median trend analysis and Mann-Kendall test method. Based on the framework of exploratory spatial-temporal data analysis (ESTDA), the spatial pattern and spatiotemporal dynamic evolution of carbon footprint from 2001 to 2013 were analyzed from the perspective of spatiotemporal interaction. In the three periods, the decoupling effect between environmental carbon load and economic growth of 336 prefecture-level cities were analyzed using the improved Tapio decoupling model. The results show that the overall carbon emissions in China had been on the rise from 2000 to 2013, in which the stable-slow rise type was dominant. China's carbon footprint and carbon deficit increased year by year, and the central and western regions became the focus of the growth of carbon footprint and carbon deficit from 2001 to 2013. At different administrative city scales, the spatial distribution pattern of carbon footprint and carbon deficit show obvious administrative orientated and spatial zonal differentiation characteristics. The annual average of global Moran's I index of each level unit is 0.491, which indicates that there is a significant spatial auto-correlation feature in the carbon footprint of China's prefecture-level units. The relative length of the LISA time path is greater in the north than in the south, and it tends to increase from the coastal areas to the central and western regions. The curvature of LISA time path decreases from coastal areas to inland areas on the whole. The curvature of northeast and central regions is higher, while that of eastern and western regions is lower. There is a different trend of the decoupling effect of environmental carbon load in China. Meanwhile the expansion-connection and expansion of negative decoupling regions continuously increased and spatially agglomerated, presenting an "E"-shaped distribution pattern from the north to the south. The national average decoupling elastic value is gradually increasing, while the coefficient of variation continues to decline, and the decoupling type has a significant evolution trend. Therefore, the unbalanced trend of economic growth and carbon emissions in China will continue for a certain period.
中国能源碳足迹时空格局演化及脱钩效应
Integrated life-cycle assessment of electricity-supply scenarios confirms global environmental benefit of low-carbon technologies
DOI:10.1073/pnas.1312753111 URL [本文引用: 1]
Social impact assessment of photovoltaic poverty alleviation program in China
Selection of potential sites for solar energy farms in ismailia governorate, Egypt using SRTM and multicriteria analysis
PV site suitability analysis using GISbased spatial fuzzy multi-criteria evaluation
DOI:10.1016/j.renene.2010.10.037 URL [本文引用: 1]
GIS-Based optimal site selection for installation of large-scale smart grid-connected photovoltaic (PV) power plants in Selangor, Malaysia
DOI:10.3844/ajassp.2017.174.183 URL [本文引用: 1]
Renewable energy sources: Their global potential for the first-half of the 21st century at a global level: An integrated approach
DOI:10.1016/j.enpol.2006.09.002 URL [本文引用: 1]
GIS-based assessment of photovoltaic (PV) and concentrated solar power (CSP) generation potential in West Africa
Estimation of the PV potential in ASEAN with a high spatial and temporal resolution
DOI:10.1016/j.renene.2015.11.061 URL [本文引用: 1]
An assessment of the regional potential for solar power generation in EU-28
DOI:10.1016/j.enpol.2015.10.004 URL [本文引用: 1]
Wind and solar PV technical potentials: Measurement methodology and assessments for Russia
DOI:10.1016/j.energy.2017.02.050 URL [本文引用: 1]
Land suitability analysis for solar farms exploitation using GIS and fuzzy analytic hierarchy process (FAHP): A case study of Iran
Spatial factors consideration in site selection of ground-mounted PV power plants
DOI:10.1016/j.egypro.2016.10.135 URL [本文引用: 1]
East to west: The optimal tilt angle and orientation of photovoltaic panels from an electricity system perspective
DOI:10.1016/j.apenergy.2015.08.097 URL [本文引用: 1]
On the estimation of the optimum tilt angle of PV panel in Saudi Arabia
DOI:10.1016/j.rser.2016.07.032 URL [本文引用: 1]
Optimal solar-PV tilt angle and azimuth: An Ontario (Canada) case study
DOI:10.1016/j.enpol.2010.12.012 URL [本文引用: 1]
Effect of temperature on PV potential in the world
DOI:10.1021/es200635x URL [本文引用: 1]
A review on maximum power point tracking for photovoltaic systems with and without shading conditions
DOI:10.1016/j.rser.2016.09.013 URL [本文引用: 1]
Performance analysis of a 190 kWp grid interactive solar photovoltaic power plant in India
DOI:10.1016/j.energy.2013.03.075 URL [本文引用: 1]
Research progress of solar energy resources assessment in China
中国太阳能资源评估研究进展
Review on optimal site selection for grid-connected solar photovoltaic plants
并网太阳能光伏电站选址研究述评
Study on methods of parabolic trough solar thermal power plant site selection
[D].
槽式太阳能热发电站微观选址的方法研究
[D].
Analysis of the spatial characteristics and driving forces determining ecosystem quality of the Beijing-Tianjin-Hebei region
DOI:10.1007/s11356-020-11146-8 URL [本文引用: 1]
Spatio-temporal evolution and motivation analysis of ecological vulnerability in arid inland river basin based on SPCA and remote sensing index: A case study on the Shiyang River Basin
基于SPCA和遥感指数的干旱内陆河流域生态脆弱性时空演变及动因分析: 以石羊河流域为例
Landscape pattern optimization in Ningjiang River Basin based on landscape ecological risk assessment
DOI:10.11821/dlxb201907011
[本文引用: 1]
The ecological risks facing the landscape in the Ningjiang River Basin are influenced by multiple parameters. Landscape optimization is an effective way to assess the detrimental effects on the ecosystem. In this study, an integrated "natural-social-landscape" landscape ecological risk assessment system was produced, and the landscape ecological risk classification of the Ningjiang River Basin was based on spatial principal component analysis. Ecological resistance surfaces were constructed using the results of the landscape ecological risk analysis. The landscape resistance surfaces were produced based on the minimum cumulative resistance model (MCR). The results show that human activity and landscape patterns had a more significant influence on the final risk assessment than natural factors do, such as terrain and distance from water. The landscape ecological risk was generally high, and the high ecology risk region covered 523.99 km 2, constituting the largest area and accounting for 36.06% of the research area. With the aim of decreasing the landscape ecological risk of the Ningjiang River Basin, areas of forestland greater than 50 km 2 and areas of water greater than 0.2 km 2 were selected as the eco-sources. Using interlinked points, lines and surfaces, a regional ecological network was constructed out of 15 ecological corridors. The length of the first level corridors was greater than 30000 m, the length of second level corridors was between 10000 m and 30000 m, and the length of the third level corridors was less than 10000 m. A total of 19 ecological nodes were produced. The landscape connectivity was significantly improved following landscape pattern optimization. The results of this study may help improve the ecological stability level in the study area and provide a scientific basis for both landscape ecological risk assessment and landscape pattern optimization research.
基于景观生态风险评价的宁江流域景观格局优化
Suitability analysis of photovoltaic power plants in China using remote sensing data and multi-criteria evaluation
基于遥感数据和多因子评价的中国地区建设光伏电站的适宜性分析
A GIS-based high spatial resolution assessment of large-scale PV generation potential in China
DOI:10.1016/j.apenergy.2019.04.005 URL [本文引用: 3]
Global reduction of solar power generation efficiency due to aerosols and panel soiling
DOI:10.1038/s41893-020-0553-2 URL [本文引用: 2]
The spatial extent of renewable and non-renewable power generation: A review and meta-analysis of power densities and their application in the U.S
DOI:10.1016/j.enpol.2018.08.023 URL [本文引用: 1]
Modeling of electric demand for sustainable energy and management in India using spatio-temporal DMSP-OLS night-time data
DOI:10.1007/s00267-017-0978-1
PMID:29282533
[本文引用: 1]
Changes in the pattern of electric power consumption in India have influenced energy utilization processes and socio-economic development to greater extent during the last few decades. Assessment of spatial distribution of electricity consumption is, thus, essential for projecting availability of energy resource and planning its infrastructure. This paper makes an attempt to model the future electricity demand for sustainable energy and its management in India. The nighttime light database provides a good approximation of availability of energy. We utilized defense meteorological satellite program-operational line-scan system (DMSP-OLS) nighttime satellite data, electricity consumption (1993-2013), gross domestic product (GDP) and population growth to construct the model. We also attempted to examine the sensitiveness of electricity consumption to GDP and population growth. The results revealed that the calibrated DMSP and model has provided realistic information on the electric demand with respect to GDP and population, with a better accuracy of r = 0.91. The electric demand was found to be more sensitive to GDP (r = 0.96) than population growth (r = 0.76) as envisaged through correlation analysis. Hence, the model proved to be useful tool in predicting electric demand for its sustainable use and management.
Research on low-carbon energy transformation of China necessary to achieve the Paris Agreement goals: A global perspective
Research and development priorities for silicon photovoltaic module recycling to support a circular economy
DOI:10.1038/s41560-020-0645-2 URL [本文引用: 1]
Economic and environmental impacts of photovoltaic power with the declining subsidy rate in China
Effects of photovoltaic panels on the characteristics and diversity of Leymus chinensis community
光伏电板对羊草群落特征及多样性的影响
Urban renewable energy and ecosystems: Integrating vegetation with ground-mounted solar arrays increases arthropod abundance of key functional groups
DOI:10.1007/s11252-020-01063-6 URL [本文引用: 1]
Optimizing wind barrier and photovoltaic array configuration in soiling mitigation
DOI:10.1016/j.renene.2020.08.155 URL [本文引用: 1]
Sources of uncertainty in long-term global scenarios of solar photovoltaic technology
DOI:10.1038/s41558-021-00998-8 URL [本文引用: 1]
The design space for long-duration energy storage in decarbonized power systems
The role of energy storage in deep decarbonization of electricity production
Deep decarbonization of electricity production is a societal challenge that can be achieved with high penetrations of variable renewable energy. We investigate the potential of energy storage technologies to reduce renewable curtailment and CO emissions in California and Texas under varying emissions taxes. We show that without energy storage, adding 60 GW of renewables to California achieves 72% CO reductions (relative to a zero-renewables case) with close to one third of renewables being curtailed. Some energy storage technologies, on the other hand, allow 90% CO reductions from the same renewable penetrations with as little as 9% renewable curtailment. In Texas, the same renewable-deployment level leads to 54% emissions reductions with close to 3% renewable curtailment. Energy storage can allow 57% emissions reductions with as little as 0.3% renewable curtailment. We also find that generator flexibility can reduce curtailment and the amount of energy storage that is needed for renewable integration.
