

1 引言
国内外学者在雅鲁藏布江流域降水变化等相关领域上取得了大量有价值的科研成果。相关研究证明雅鲁藏布江流域的年尺度和季节尺度平均降水量以及极端降水指标整体呈上升趋势[16,17,18]。该流域未来多年平均降水量将高于1978—2009年的平均值,并且气候因子在未来将保持暖湿化的走势[19]。但相关研究更多集中在日及更长时间尺度上对非极端降水进行分析,对小时尺度极端降水指标的研究偏少,对不同时间尺度降水特征的综合对比分析不足,并且对流域内部极端降水空间差异性的刻画不够细致。极端降水多呈现出短历时、高强度和显著的空间异质性等特征[20,21,22]。在青藏高原气候暖湿化的背景下,极端降水频发,加剧了山地灾害的频率、规模和复杂性[14]。仅采用日尺度降水数据难以捕捉极端降水频次和强度特征,在空间上也无法细致刻画极端降水的区域分异性,难以反映区域极端降水的真实情况[23]。
综上所述,本文基于雅鲁藏布江流域1979—2018年的年、月、日、3 h降水数据,对流域内年、干湿季、月降水量以及日、小时尺度极端降水指标进行综合分析,以期在更全面的时间尺度和更精细的空间尺度上揭示雅鲁藏布江流域降水变化特征。研究结果有助于进一步掌握雅鲁藏布江流域不同时间尺度降水的基本特征和变化规律,以期为气候变化背景下的青藏高原水循环演变规律分析以及山地灾害防治等方面提供一定的科学支持。
2 研究方法与数据来源
2.1 研究区概况
雅鲁藏布江(28°N~31°N、82°E~97°E)发源于青藏高原西南部、喜马拉雅山脉北麓的杰玛央宗冰川,源头海拔约5590 m,流域全长2057 km,平均海拔在4000 m以上,是中国水资源方面重要的江河之一[24]。参考水利部划分的全国水资源区划(
图1

图1
雅鲁藏布江流域水资源分区及主要城镇分布
注:基于自然资源部标准地图服务网站审图号为GS(2020)4619号标准地图制作,底图边界无修改。
Fig. 1
Distribution of water resources subregions and main towns in the Yarlung Zangbo river basin
表1 雅鲁藏布江流域水资源分区概况
Tab. 1
| 水资源分区编号 | 分区内主要河流 | 集水面积(km2) | 长度(km) | 河口位置 | |
|---|---|---|---|---|---|
| 北纬 | 东经 | ||||
| Ⅰ-1 | 雅鲁藏布江 | 24189 | 311 | 29°56′ | 84°18′ |
| Ⅰ-2 | 雅鲁藏布江 | 24317 | 374 | 29°10′ | 87°99′ |
| Ⅱ-1 | 多雄藏布 | 19697 | 303 | 29°23′ | 87°58′ |
| Ⅱ-2 | 年楚河 | 11101 | 223 | 29°19′ | 88°54′ |
| 雅鲁藏布江 | 40832 | 241 | 29°24′ | 91°41′ | |
| Ⅱ-3 | 拉萨河 | 32471 | 551 | 29°19′ | 90°45′ |
| Ⅱ-4 | 雅鲁藏布江 | 35075 | 594 | 28°99′ | 94°56′ |
| Ⅱ-5 | 尼洋河 | 17732 | 286 | 29°25′ | 94°28′ |
| Ⅲ-1 | 帕隆藏布 | 28600 | 266 | 29°52′ | 95°07′ |
| Ⅲ-2 | 雅鲁藏布江 | 19988 | 496 | 28°01′ | 95°35′ |
2.2 数据来源
本文选用的大气环流因子数据来源于中国气象局国家气候中心(
2.3 研究方法
式中:Rm表示逐月降水量;Ry表示年平均月降水量。如果I > 0,说明该月实际降水强度大于平均降水强度,则该月降水偏多;反之,I < 0,说明该月实际降水强度小于平均降水强度,则该月降水偏少。通过计算可得,雅鲁藏布江流域5—9月,连续5个月降水偏多,10—次年4月,连续7个月降水偏少。因此,干湿季的划分采取10—12月和次年1—4月为干季,5—9月为湿季。
式中:σ为标准差;
2.3.3 极端降水指标方法 可以通过定义与极端降水事件有关的指标来研究极端降水变化特征[35,36],本文采用的是国际上常用的由气候变化与监测指数专家团队(ETCCDI)定义的指数。ETCCDI给出了27个核心指数的确切定义(
表2 雅鲁藏布江流域极端降水指标
Tab. 2
| 指标类别 | 指标 | 指标名称 | 定义 | 单位 |
|---|---|---|---|---|
| 极值指标 | Rx1day | 最大1 d降水量 | 年最大1 d降水量 | mm |
| Rx7day | 最大7 d降水量 | 年连续7 d最大降水总量 | mm | |
| Rx3hour | 最大3 h降水量 | 年最大3 h降水量 | mm | |
| Rx12hour | 最大12 h降水量 | 年最大12 h降水量 | mm | |
| 阈值指标 | PRCPTOT | 年湿润日降水总量 | 一年中降水量大于1 mm/d的降水总量 | mm |
| R95p | 极端降水量 | 一年中降水量超过序列中第95个百分位的降水量之和 | mm | |
| CWD | 持续湿润日数 | 一年中降水量大于1 mm/d的最大持续日数 | d | |
| R10 | 强降水日数 | 一年中降水量大于10 mm/d的总日数 | d |
3 降水时间变化特征
3.1 年、干湿季和月降水量时间变化特征
1979—2018年雅鲁藏布江流域年降水量在436.0~691.7 mm之间波动变化(图2a),整体呈2.5 mm·a-1的显著上升趋势,平均年降水量为575.6 mm,变差系数Cv值为0.11。由此可见,雅鲁藏布江流域年降水朝着偏多的方向变化,总体上离散程度低,波动变化小。
图2
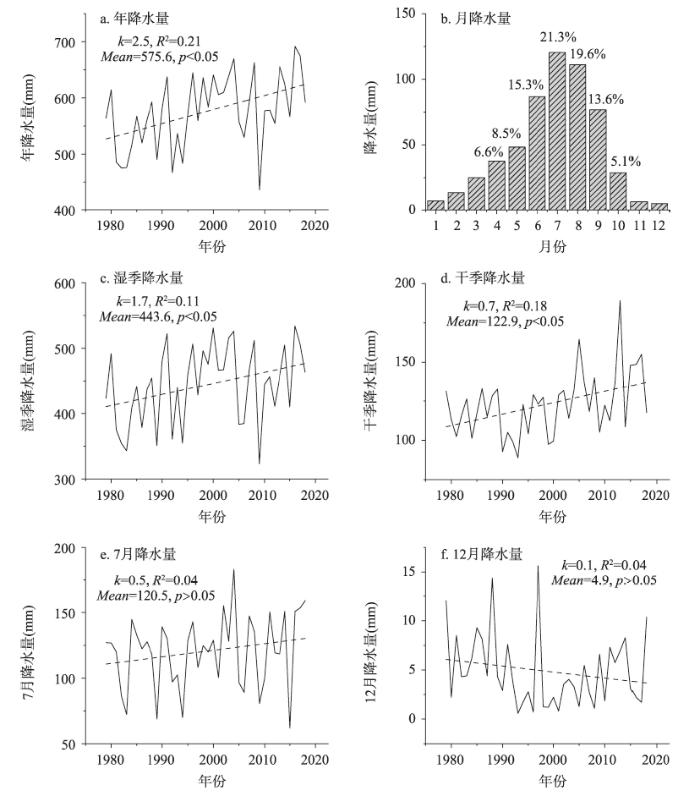
图2
雅鲁藏布江流域年、干湿季和月降水量变化趋势
Fig. 2
Variation trends of annual, wet and dry seasons, and monthly precipitation in the Yarlung Zangbo River Basin
1979—2018年雅鲁藏布江流域湿季和干季降水变化见图2c~2d,流域多年湿季降水量均值为443.6 mm,波动范围为323.3~534.1 mm,Cv值为0.13,呈现1.7 mm·a-1的显著上升趋势。流域多年干季降水量均值为112.9 mm,波动范围为88.9~189.1 mm,Cv值为0.17,呈现0.7 mm·a-1的显著上升趋势。
表3 雅鲁藏布江流域各月份降水概况
Tab. 3
| 月份 | 平均降水量(mm) | 变化趋势(mm·a-1) | 月最高降水量 | 月最低降水量 | 变差系数Cv | |||
|---|---|---|---|---|---|---|---|---|
| 年份 | 数值(mm) | 年份 | 数值(mm) | |||||
| 1 | 7.0 | 0.1 | 1989 | 25.8 | 2006 | 0.2 | 0.77 | |
| 2 | 13.5 | 0.1 | 2007 | 31.7 | 1985 | 5.0 | 0.40 | |
| 3 | 25.0 | 0.2* | 1998 | 39.2 | 1990 | 10.5 | 0.29 | |
| 4 | 37.6 | 0.3* | 2016 | 65.8 | 2009 | 21.3 | 0.28 | |
| 5 | 48.3 | 0.5* | 2000 | 72.1 | 1986 | 27.6 | 0.23 | |
| 6 | 86.8 | 0.4 | 2004 | 122.7 | 1987 | 46.0 | 0.24 | |
| 7 | 120.5 | 0.5 | 2004 | 183.4 | 2015 | 61.8 | 0.23 | |
| 8 | 111.2 | 0.4 | 1998 | 178.8 | 1982 | 53.4 | 0.26 | |
| 9 | 76.8 | -0.02 | 2016 | 122.5 | 2009 | 36.5 | 0.26 | |
| 10 | 28.7 | 0.01 | 2013 | 54.5 | 1981 | 8.9 | 0.39 | |
| 11 | 6.3 | 0.1 | 2006 | 16.1 | 1980 | 1.0 | 0.63 | |
| 12 | 4.9 | -0.1 | 1997 | 15.6 | 1993 | 0.6 | 0.14 | |
注:*表示通过95%置信水平检验,下同。
1979—2018年雅鲁藏布江流域9个分区的年、干湿季和月降水量概况见表4,自下游分区Ⅲ-2向上游分区Ⅰ-1,年、干湿季、月降水量整体自东向西呈现出先减少、后增加、再减少的趋势。除干季降水量外,其余降水量的最小值均出现在上游分区Ⅰ-1中。具体到各个分区,上游分区Ⅰ-2、下游分区Ⅲ-1的年、湿季和月降水量均呈下降趋势。且上游分区Ⅰ-2的湿季降水量,下游分区Ⅲ-1的年、湿季、月降水量下降趋势显著。这表明雅鲁藏布江流域整体降水量呈上升趋势,但流域东北部、西南部降水呈下降趋势。
表4 雅鲁藏布江流域水资源分区年、干湿季和月降水量概况
Tab. 4
| 水资源分区 | 年降水量 | 湿季降水量 | 干季降水量 | 月降水量 | |||||||||||
|---|---|---|---|---|---|---|---|---|---|---|---|---|---|---|---|
| 均值 (mm) | 趋势(mm·a-1) | 变差 系数 | 均值 (mm) | 趋势(mm·a-1) | 变差 系数 | 均值 (mm) | 趋势(mm·a-1) | 变差 系数 | 均值 (mm) | 趋势(mm·a-1) | 变差 系数 | ||||
| Ⅰ-1 | 330.9 | 3.3* | 0.24 | 211.5 | 1.9* | 0.29 | 115.4 | 1.3 | 0.47 | 27.2 | 0.3* | 0.24 | |||
| Ⅰ-2 | 472.0 | -1.8 | 0.16 | 343.7 | -2.2* | 0.18 | 121.0 | 0.4 | 0.38 | 38.7 | -0.1 | 0.16 | |||
| Ⅱ-1 | 413.6 | 2.0 | 0.18 | 356.5 | 1.0 | 0.20 | 49.5 | 0.9* | 0.37 | 33.8 | 0.2 | 0.18 | |||
| Ⅱ-2 | 394.2 | 2.3* | 0.21 | 357.4 | 1.5 | 0.22 | 29.3 | 0.7* | 0.48 | 32.2 | 0.2* | 0.21 | |||
| Ⅱ-3 | 528.6 | 3.5* | 0.18 | 456.9 | 2.3* | 0.18 | 62.9 | 1.1* | 0.33 | 43.3 | 0.3* | 0.18 | |||
| Ⅱ-4 | 530.2 | 4.5* | 0.18 | 434.5 | 2.9* | 0.20 | 86.9 | 1.5* | 0.29 | 43.4 | 0.4* | 0.18 | |||
| Ⅱ-5 | 698.5 | 3.4* | 0.16 | 574.0 | 2.0 | 0.17 | 113.6 | 1.4* | 0.23 | 57.3 | 0.3* | 0.16 | |||
| Ⅲ-1 | 759.1 | -4.1* | 0.14 | 546.5 | -3.7* | 0.16 | 201.6 | -0.3 | 0.18 | 62.3 | -0.3* | 0.14 | |||
| Ⅲ-2 | 1356.1 | 11.4* | 0.17 | 870.6 | 12.0* | 0.24 | 466.3 | -0.8 | 0.19 | 111.4 | 0.9* | 0.17 | |||
3.2 极端降水指标时间变化特征
3.2.1 极值指标时间变化特征 1979—2018年雅鲁藏布江流域降水极值指标时间变化见图3,极端降水的极值指标整体上均呈波动上升趋势,但在趋势大小和显著性上有差异。年最大1 d降水量(Rx1day)整体呈不显著上升趋势,多年均值和Cv值分别为11.8 mm、0.02。年最大7 d降水量(Rx7day)整体呈不显著上升趋势,多年均值和Cv值分别为50.4 mm、0.03。年最大3 h降水量(Rx3hour)整体以0.04 mm·a-1的趋势显著上升,多年均值和Cv值分别为3.1 mm和0.25。年最大12 h降水量(Rx12hour)整体以0.04 mm·a-1的趋势显著上升,多年均值和Cv值分别为8.4 mm、0.05。
图3
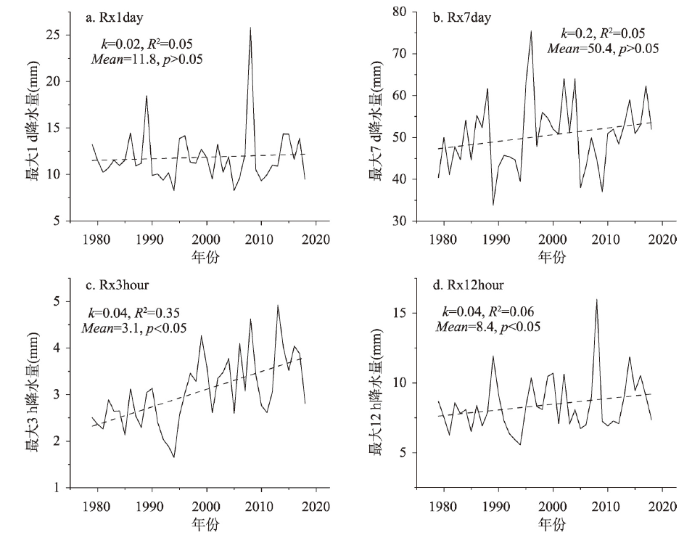
图3
雅鲁藏布江流域降水极值指标变化趋势
Fig. 3
Variation trends of precipitation extremum indexes in the Yarlung Zangbo river basin
雅鲁藏布江流域9个分区的降水极值指标概况见表5,自下游分区Ⅲ-2向上游分区Ⅰ-1,各极值指标均值整体自东向西呈先减少、后增加、再减少的趋势。Rx3hour、Rx12hour在所有分区中均呈显著上升趋势,这表明雅鲁藏布江流域各分区小时尺度强降水在增多。具体到各个分区,除Rx7day外,分区Ⅱ-2的各极值指标均为最小值。分区Ⅰ-2、Ⅱ-1、Ⅱ-2、Ⅲ-1的日尺度极值指标均呈下降趋势,分区Ⅱ-4、Ⅲ-2的日尺度极值指标均呈显著上升趋势,这表明雅鲁藏布江流域日尺度强降水整体呈现出东部增加西部减少的趋势。
表5 雅鲁藏布江流域水资源分区降水极值指标概况
Tab. 5
| 水资源分区 | Rx1day | Rx7day | Rx3hour | Rx12hour | |||||||||||
|---|---|---|---|---|---|---|---|---|---|---|---|---|---|---|---|
| 均值 (mm) | 趋势(mm·a-1) | 变差 系数 | 均值 (mm) | 趋势(mm·a-1) | 变差 系数 | 均值 (mm) | 趋势(mm·a-1) | 变差 系数 | 均值 (mm) | 趋势(mm·a-1) | 变差 系数 | ||||
| Ⅰ-1 | 19.6 | 0.03 | 0.59 | 40.4 | 0.3 | 0.39 | 7.8 | 0.2* | 0.54 | 14.9 | 0.4* | 0.50 | |||
| Ⅰ-2 | 21.3 | -0.2 | 0.64 | 53.7 | -0.4* | 0.30 | 8.0 | 0.2* | 0.55 | 15.8 | 0.3* | 0.43 | |||
| Ⅱ-1 | 16.5 | -0.1 | 0.30 | 55.8 | -0.3 | 0.24 | 7.1 | 0.1* | 0.42 | 16.2 | 0.3* | 0.37 | |||
| Ⅱ-2 | 13.5 | -0.1 | 0.17 | 55.8 | -0.2 | 0.20 | 5.1 | 0.1* | 0.37 | 13.1 | 0.2* | 0.31 | |||
| Ⅱ-3 | 14.9 | 0.03 | 0.18 | 57.1 | 0.2 | 0.14 | 6.1 | 0.1* | 0.37 | 16.1 | 0.3* | 0.32 | |||
| Ⅱ-4 | 16.4 | 0.2* | 0.28 | 61.3 | 0.5* | 0.23 | 5.2 | 0.1* | 0.32 | 13.6 | 0.3* | 0.34 | |||
| Ⅱ-5 | 18.8 | 0.1 | 0.20 | 72.0 | 0.3 | 0.21 | 7.2 | 0.1* | 0.31 | 19.9 | 0.3* | 0.28 | |||
| Ⅲ-1 | 19.5 | -0.1 | 0.31 | 69.7 | -0.6* | 0.28 | 6.3 | 0.1* | 0.43 | 15.4 | 0.1* | 0.24 | |||
| Ⅲ-2 | 41.8 | 0.9* | 0.50 | 130.9 | 4.5* | 0.26 | 12.8 | 0.4* | 0.48 | 30.3 | 0.9* | 0.40 | |||
3.2.2 阈值指标时间变化特征 1979—2018年雅鲁藏布江流域降水阈值指标时间变化见图4,极端降水的阈值指标整体均呈波动上升趋势,但在趋势大小和显著性上有差异。年湿润日降水总量(PRCPTOT)的波动范围为370.3~650.0 mm,整体以2.4 mm·a-1的趋势显著上升,多年均值和Cv值分别为517.9 mm、0.05。极端降水量(R95p)整体呈不显著上升趋势,多年均值和Cv值分别为138.1 mm、0.11。极端降水量约占年降水量的24%。持续湿润日数(CWD)整体呈不显著上升趋势,多年均值和Cv值分别为49.2 d、0.08。持续湿润日数大多集中在每年的6—9月。强降水日数(R10)整体呈不显著上升趋势,多年均值和Cv值分别为1.7 d、0.07,其中,1990年、1992年、1994年、2001年、2005—2006年、2010—2011年强降水日数为0。
图4
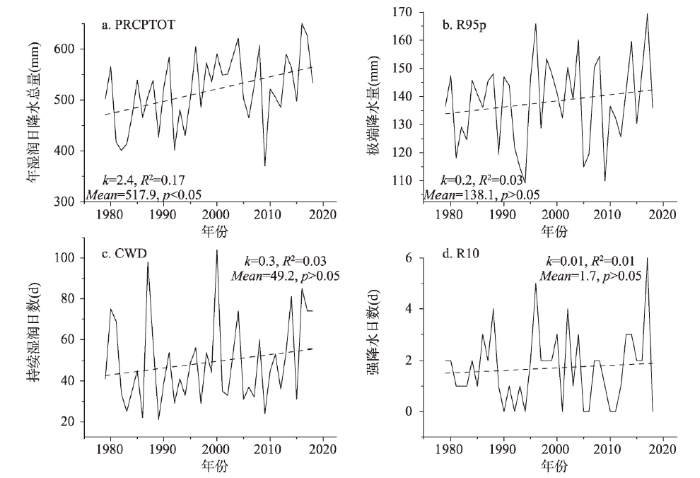
图4
雅鲁藏布江流域降水阈值指标变化趋势
Fig. 4
Variation trends of precipitation threshold indexes in the Yarlung Zangbo River Basin
雅鲁藏布江流域9个分区的降水阈值指标概况见表6,自下游分区Ⅲ-2向上游分区Ⅰ-1,各阈值指标均值整体上自东向西呈先减少、后增加、再减少的趋势。具体到各个分区,上游分区Ⅰ-1的各阈值指标均为最小值。上游分区Ⅰ-2、下游分区Ⅲ-1的各阈值指标均呈下降趋势,且下游分区Ⅲ-1的PRCPTOT、R95p、R10下降趋势显著。下游分区Ⅲ-2的各阈值指标均为最大值,且均呈显著上升趋势。
表6 雅鲁藏布江流域水资源分区降水阈值指标概况
Tab. 6
| 水资源分区 | PRCPTOT | R95p | CWD | R10 | |||||||||||
|---|---|---|---|---|---|---|---|---|---|---|---|---|---|---|---|
| 均值 (mm) | 趋势(mm·a-1) | 变差 系数 | 均值 (mm) | 趋势(mm·a-1) | 变差 系数 | 均值 (mm) | 趋势(mm·a-1) | 变差 系数 | 均值 (mm) | 趋势(mm·a-1) | 变差 系数 | ||||
| Ⅰ-1 | 274.5 | 2.8* | 0.28 | 129.2 | 1.0* | 0.28 | 11.8 | 0.1 | 0.37 | 2.6 | 0.04 | 0.77 | |||
| Ⅰ-2 | 421.6 | -2.3* | 0.18 | 163.8 | -0.7 | 0.21 | 23.8 | -0.03 | 0.51 | 4.5 | -0.1 | 0.66 | |||
| Ⅱ-1 | 365.8 | 1.6 | 0.21 | 156.8 | -0.1 | 0.17 | 23.6 | 0.2 | 0.41 | 4.9 | 0.01 | 0.63 | |||
| Ⅱ-2 | 352.2 | 2.0 | 0.24 | 152.6 | -0.03 | 0.17 | 21.4 | 0.02 | 0.42 | 4.5 | -0.1 | 0.68 | |||
| Ⅱ-3 | 482.4 | 3.2* | 0.20 | 167.6 | 0.5 | 0.13 | 24.6 | 0.3 | 0.44 | 5.5 | 0.1* | 0.53 | |||
| Ⅱ-4 | 469.0 | 4.4* | 0.22 | 168.6 | 1.1* | 0.19 | 28.4 | 0.3 | 0.39 | 5.8 | 0.1* | 0.64 | |||
| Ⅱ-5 | 650.1 | 3.4* | 0.17 | 210.7 | 0.6 | 0.14 | 27.3 | 0.2 | 0.37 | 12.1 | 0.1 | 0.42 | |||
| Ⅲ-1 | 710.5 | -4.2* | 0.15 | 204.0 | -1.9* | 0.21 | 33.0 | -0.1 | 0.39 | 9.7 | -0.2* | 0.55 | |||
| Ⅲ-2 | 1308.4 | 11.6* | 0.18 | 394.3 | 4.3* | 0.22 | 38.1 | 0.5* | 0.34 | 37.7 | 0.5* | 0.29 | |||
4 降水空间分布特征
4.1 年、干湿季和月降水量空间分布特征
1979—2018年雅鲁藏布江流域年降水量空间分布见图5a,整体上看,年降水量呈现从流域东部向西部逐渐减少的趋势,且在流域中西部会出现区域性高值中心。0~200 mm、200~400 mm、400~800 mm、800~1600 mm等值线所包络的面积比例分别为:38.7%、33.5%、24.7%、3.0%。流域东南部等值线密集,且在流域东部形成小范围的闭合等值线圆环,降水的量级、梯度均在东南部剧增。其中,日喀则和拉萨等重点城市所在的流域中游分区Ⅱ-2、Ⅱ-3、Ⅱ-4年降水量整体偏低,分区内绝大部分地区在200~400 mm之间。
图5
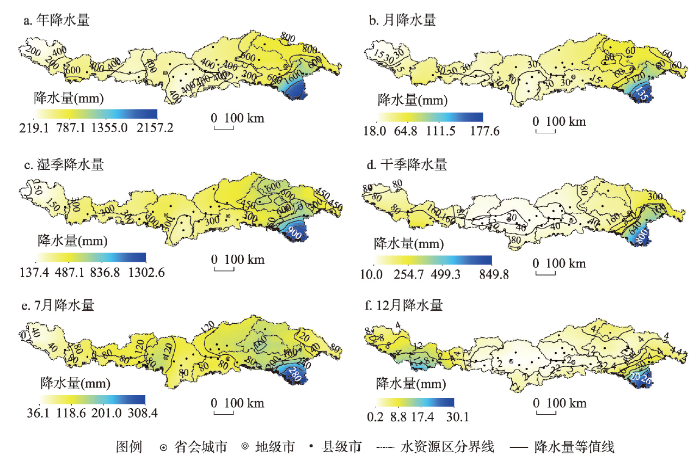
图5
雅鲁藏布江流域年、干湿季、月降水量空间分布
Fig. 5
Spatial distribution of annual, wet and dry seasons, and monthly precipitation in the Yarlung Zangbo river basin
1979—2018年雅鲁藏布江流域湿季、干季降水量空间分布见图5c~5d,湿季降水量从流域东部的1302.6 mm逐渐减少到流域西部的137.4 mm。干季降水量从流域东部的849.8 mm、流域西南部的240.0 mm逐渐减少到流域中部的10.0 mm。其中,上游分区Ⅰ-1、Ⅰ-2降水量受干湿季影响相对较小,湿季降水量在150~300 mm之间,干季降水量在80~240 mm之间。流域中游的分区Ⅱ-1、Ⅱ-2、Ⅱ-3降水量受干湿季影响相对较大,湿季降水量在300~450 mm之间,干季降水量在20~80 mm之间,流域中游分区在干季是一个明显的区域降水低值中心。
1979—2018年雅鲁藏布江流域月降水量空间分布见图5b,整体上看,月降水量呈现从流域东部向西部逐渐减少的趋势,从177.6 mm减少到18.0 mm。在流域东部形成小范围的闭合等值线圆环,说明存在小范围的降水中心。典型月7月、12月降水量空间分布见图5e~5f,7月降水量呈现从流域东部向西部逐渐减少的趋势,12月降水量呈现从流域东部、西部向流域中部逐渐减少的趋势。其中,分区Ⅱ-1、Ⅱ-2、Ⅱ-3、Ⅱ-4、Ⅱ-5、Ⅲ-1在7月份时,降水量相对较高,在80~160 mm之间;但在12月份时,降水量相对较低,在2~4 mm之间。分区Ⅰ-1、Ⅰ-2在7月份时,降水量相对较低,在40~80 mm之间;但在12月份时,降水量相对较高,在6~16 mm之间。
4.2 极值指标空间分布特征
1979—2018年雅鲁藏布江流域降水极值指标的空间分布见图6,Rx1day、Rx7day、Rx3hour、Rx12hour都表现出相似的空间分布特征,即整体呈现从流域东部向西部逐渐减少的趋势,但在流域的中西部地区会出现区域性高值中心,且都在流域东南部发生剧增。这说明雅鲁藏布江流域的极端降水事件主要发生在流域的东部或东南部。具体到各个指标,Rx1day从流域东南部的34.0 mm减少到西北部的2.4 mm。Rx7day从流域东部的133.1 mm减少到西部的6.8 mm,东部、中部地区出现部分区域性高值中心。Rx3hour呈现从流域东部、西部向中部逐渐减少的趋势,从5.9 mm减少到0.8 mm。Rx12hour从流域东部的21.0 mm减少到西部的1.4 mm。由图6可见,闭合等值线圆环主要出现在流域的中东部、东部,降水的量级、梯度均在东南部剧增。对各极值指标而言,随着时间尺度的缩短,流域内闭合圆环范围逐渐变大,中西部高值区也更加明显且范围变大。
图6
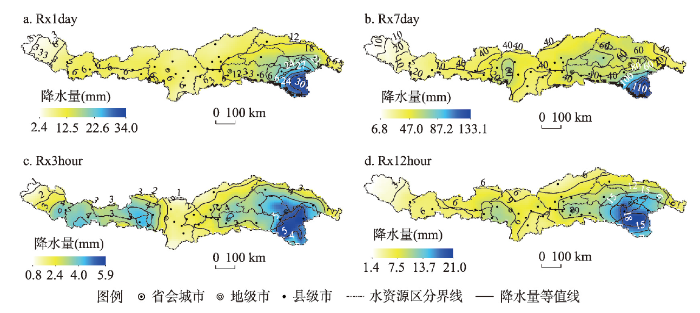
图6
雅鲁藏布江流域降水极值指标空间分布
Fig. 6
Spatial distribution of precipitation extremum indexes in the Yarlung Zangbo river basin
4.3 阈值指标空间分布
1979—2018年雅鲁藏布江流域降水阈值指标的空间分布见图7,PRCPTOT、R95p、CWD、R10都表现出与极值指标相似的空间分布特征,整体呈现从流域东部向西部逐渐减少的趋势,且在流域中西部会出现区域性高值中心。具体到各个指标,PRCPTOT从流域东部的2025.3 mm逐渐减少到流域西部的189.9 mm,与年降水量在数值及空间分布上相似。R95p出现多处闭合等值线圆环,呈现多处区域性高值中心,主要分布在流域中东部与中西部地区。特别值得注意的是,R95p在水资源分区Ⅰ-2、Ⅱ-1交界处、水资源分区Ⅲ-2东南部形成了两个极高值区域,该区域发生强降水的可能性较大。CWD从流域东部的11.0 d逐渐减少到流域西部的1.1 d。R10从流域东部的23.8 d逐渐减少到流域西部的2.5 d。由图可见,闭合等值线圆环主要出现在流域的中东部、东部,且分区Ⅲ-2始终是流域内高值地区,降水量级、梯度均在分区Ⅲ-2剧增。对R95p而言,闭合等值线圆环在分区Ⅱ-1、Ⅱ-3、Ⅱ-4、Ⅱ-5内多次出现,且闭合圆环数值范围为160~240 mm。
图7
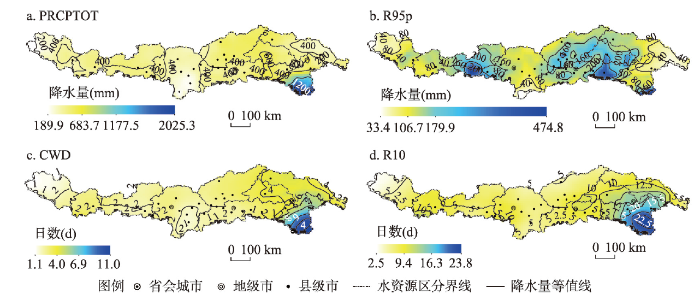
图7
雅鲁藏布江流域降水阈值指标空间分布
Fig. 7
Spatial distribution of precipitation threshold indexes in the Yarlung Zangbo river basin
5 流域降水与大尺度大气环流的关系
本文进一步探讨了雅鲁藏布江流域年、干湿季、月降水量以及极端降水指标与74项大尺度大气环流因子的相关性。分析表明:北半球副热带高压(NHSH)和北半球极涡(NHPV)是在北半球主导的两大大气环流,其变化对雅鲁藏布江流域降水变化具有显著影响。其中,北半球副高北界、北半球副高脊线、北半球极涡面积指数、北半球极涡强度指数与各降水指标的相关性最强。
雅鲁藏布江流域年、干湿季、月降水量以及日、小时尺度极端降水指标与大尺度大气环流因子的相关系数见表7,年、湿季、月降水量均与大气环流因子显著相关,且与北半球极涡面积、北半球极涡强度指数呈显著负相关。各极端降水指标与大气环流因子在显著性上有差异。除Rx1day外,其余极端降水指标均与北半球极涡面积、北半球极涡强度指数呈负相关,与其余大气环流因子呈正相关。可以推断,当NHSH较强或NHPV较弱时,雅鲁藏布江流域降水增多,极端降水发生频率提高。
表7 雅鲁藏布江流域降水与大气环流因子的关系
Tab. 7
| 降水指标 | 北半球副高北界 | 北半球副高脊线 | 北半球极涡面积 | 北半球极涡强度指数 |
|---|---|---|---|---|
| 年降水量 | 0.38* | 0.40* | -0.44** | -0.44** |
| 湿季降水量 | 0.34* | 0.42** | -0.34* | -0.32* |
| 干季降水量 | 0.15 | -0.01 | -0.33* | -0.40* |
| 月降水量 | 0.43** | 0.42** | -0.49** | -0.48** |
| Rx1day | 0.01 | 0.18 | -0.21 | 0.01 |
| Rx7day | 0.16 | 0.18 | -0.06 | -0.13 |
| Rx3hour | 0.26 | 0.40* | -0.61** | -0.45** |
| Rx12hour | 0.16 | 0.37* | -0.46** | -0.15 |
| PRCPTOT | 0.40* | 0.42** | -0.39* | -0.42** |
| R95p | 0.33* | 0.28 | -0.22 | -0.19 |
| CWD | 0.33* | 0.19 | -0.07 | -0.24 |
| R10 | 0.18 | 0.17 | -0.03 | -0.03 |
注:*表示通过95%置信水平检验,**表示通过99%置信水平检验。
6 讨论
6.1 雅鲁藏布江流域多时空尺度降水变化特征的对比分析
进一步对结果中的各时间尺度降水时空变化特征进行综合探讨。首先,对流域尺度下的不同时间尺度降水进行对比。对日及更长时间尺度降水而言,虽然流域整体的降水变化趋势是增加的,但是降水增加、减少趋势的区域分异性明显。降水趋势增加的区域主要集中在降水相对更多的中下游,趋势减少的区域主要集中在降水相对更少的上游以及流域东北部,在降水空间分配上呈现“湿的越湿、干的越干”的变化趋势,这将进一步加剧流域降水的空间分异性。而小时尺度极端降水在流域中均呈上升趋势,且小时尺度极端降水在流域尺度下相较于日及更长时间尺度降水空间分异性更加明显。其次,对水资源分区尺度下的不同时间尺度降水进行对比。同一分区,年、干湿季、月、日尺度降水的变化趋势基本一致,但小时尺度降水均呈显著上升趋势。以分区Ⅱ-5、Ⅲ-1为例,除小时尺度外的降水在分区Ⅱ-5中均呈上升趋势,在分区Ⅲ-1中均呈下降趋势。最后,将水资源分区尺度与流域尺度相比。各分区之间指标值的差异较大,以水资源分区尺度呈现的降水空间分异性更加明显。并且通过水资源分区之间的对比进一步发现,除了东部传统高值区外,雅鲁藏布江流域降水在中西部(分区Ⅰ-2、Ⅱ-1)出现了区域性高值中心,其原因可能是该区域南部山脉海拔相对较低,来自印度洋的暖湿气流得以北上,在该区域形成一个降水高值中心。
对雅鲁藏布江流域降水时空变化特征进行分析一直是学者们重点开展的研究方向之一。若根据时间尺度和指标特性的不同,可将这些研究大致划分为非极端降水研究和极端降水研究两大类。对于日及更长时间尺度的非极端降水研究而言,近几十年来雅鲁藏布江流域降水增多的变化方向是一致的。但由于数据源、时间尺度和趋势判别方法等的差异,不同学者得出的非极端降水均值及趋势大小是存在差异的。以年降水量为例,其多年均值在321~500 mm之间[17, 39],增加趋势在2.0~7.9 mm 10a-1之间[19, 39]。对极端降水而言,当前研究更多是对基于日尺度构建的极端指标进行分析,指出雅鲁藏布江流域典型的日尺度极端降水指标整体上呈现出上升趋势[17]。虽然本文的研究结果与前人的研究结果大体上一致,但是在时间尺度上,从单一尺度的研究拓展至多时间尺度的对比研究,尤其是针对小时尺度的拓展研究,在极端气候事件分析和区域山洪灾害防治等方面有重要的应用价值。在空间尺度上,本文基于河流水系情况,将三大水资源区细分为9个分区,采用流域整体空间分析、水资源分区差异性对比、降水等值线分析相结合的方式,更细致的刻画了雅鲁藏布江流域降水空间分布情况。
6.2 雅鲁藏布江流域水资源管理和山洪灾害防治启示
雅鲁藏布江流域整体的降水变化趋势是增加的,但是在降水空间分配上却呈现“中下游区湿的越湿、上游区干的越干”的变化趋势,这种降水分配倾向极端的趋势,很可能进一步加剧流域水资源管理和区域山洪灾害防治的压力。雅鲁藏布江流域下游水资源丰富,其中,下游分区Ⅲ-2年降水量在800 mm以上,部分区域超过1600 mm,且海拔高度差较大。中国“十四五”规划中明确指出,要推动雅鲁藏布江下游水电基地的建设。因此,应着重考虑在分区Ⅲ-2建设水电基地。以拉萨、日喀则、山南为代表的城市群集中分布在雅鲁藏布江流域中游(分区Ⅱ-2、Ⅱ-3和Ⅱ-4),该区域生产生活用水基本靠流域水资源[40]。虽然中游地区降水呈现增多趋势,但年内分配不均,干湿季差异较大,且该地区在干季会出现很明显的区域降水低值中心,因此,水资源的合理调配对缓解中游区城镇用水压力尤为重要。林芝、嘉黎和墨脱等城镇位于雅鲁藏布江流域中下游和下游区(分区Ⅱ-5、Ⅲ-1、Ⅲ-2),该区域降水丰沛,短时强降水集中,易达到山洪暴发的降水阈值[41]。此外,由于下垫面条件和降水的空间异质性等原因,中西部(分区Ⅰ-2、Ⅱ-1)区域性高值中心、中游分区Ⅱ-3、Ⅱ-4交界处同样是山洪灾害易发地。降水尤其是小时尺度极端降水的增加将进一步加剧这些分区山洪防治的压力。因此,应着重预防上述降水高值区和区域高值区山洪灾害的发生。
7 结论
本文综合对比分析了雅鲁藏布江流域及其9个水资源分区的年、干湿季、月降水量以及日、小时尺度极端降水的多时空尺度变化特征,得出了以下结论:
(1)在降水的时间变化特征上,雅鲁藏布江流域尺度上的各时间尺度降水整体上均呈上升趋势,但趋势大小和显著性有差异。在水资源分区尺度上,各分区不同时间尺度降水的变化趋势呈现出非一致性,除小时尺度极端降水均呈上升趋势外,其余时间尺度降水的趋势变化方向各异、差异更明显。流域小时尺度极端降水显著上升以及中部地区年内干季降水减少的独特变化趋势,对流域水资源管理、山洪灾害的防治提出了更大的挑战。
(2)在降水空间分布规律及变化特征上,各时间尺度降水整体均呈现自流域东部向西部减少的趋势,流域东南部(分区Ⅲ-2)始终是降水量值和趋势变化最剧烈区。全流域尺度和分区尺度降水均呈现较强的空间分异性,且空间分异性随着降水指标时间尺度的缩短而增强。流域总体呈现“湿的越湿、干的越干”的更加极端化的空间变化趋势,这将加剧流域降水的空间分异性,也会给“分区施策”造成一定的压力。
(3)北半球副热带高压和北半球极涡这两项大尺度大气环流因子对雅鲁藏布江流域降水变化具有显著影响。各时间尺度降水整体表现为与北半球副热带高压指数(副高位置和脊线)呈正相关,与北半球极涡指数(极涡面积和强度)呈负相关。
本文尝试在更全面精细的时空尺度上对雅鲁藏布江流域降水的变化特征进行综合分析。多时空尺度对比的研究模式在系统诊断和揭示流域降水时空变化特征上有较好的优势,对于流域的生态水文过程多时空尺度演变特征及驱动力分析、水文气象要素演变特征等相关研究具有一定的借鉴意义。但是,本文因缺少小时以内更高时间分辨率的降水数据而未能在时间尺度上实现全序列尺度分析,未来将进一步融合自动气象站和更长序列的多源降水观测数据,开展跨尺度的全序列对比分析。本文仅简单探讨了大气环流因子和降水之间的相关性,缺乏更深层次的机理分析。且降水变化机理随着时空尺度的精细而变得更加复杂,局地干扰因素增多增强。如何全面准确解析雅鲁藏布江流域降水多时空尺度变化机理是未来亟待深入研究的难点,也是为青藏高原及周边地区的水资源管理、山洪灾害防治等提供更加精准科学支撑的关键点。
参考文献
Progress in research on formation and evolution of Tibetan Plateau with its environment and resource effects
青藏高原形成演化及其环境资源效应研究进展
From Tibetan Plateau to Third Pole and Pan-Third Pole
从青藏高原到第三极和泛第三极
The response of environmental changes on Tibetan Plateau to global changes and adaptation strategy
青藏高原环境变化对全球变化的响应及其适应对策
Assessment of past, present and future environmental changes on the Tibetan Plateau
青藏高原环境变化科学评估: 过去、现在与未来
Impacts of climate change on hydrological processes in the Tibetan Plateau: A case study in the Lhasa River basin
DOI:10.1007/s00477-015-1066-9 URL [本文引用: 1]
Variations in the key hydrological elements of the Yarlung Zangbo River basin
DOI:10.2166/ws.2018.158 URL [本文引用: 1]
Hydrological responses to climate change in Yarlung Zangbo River Basin, Southwest China
Research progresses of precipitation variation over the Yarlung Zangbo River basin under global climate warming
气候变暖背景下雅鲁藏布江流域降水变化研究进展
Cascading impacts of Asian Water Tower change on downstream water systems
“亚洲水塔”变化对下游水资源的连锁效应
Hydrological changes during the past 50 years over the Tibetan Plateau and its regional difference
青藏高原50年来水循环要素变化趋势及其区域差异性
Groundwater in the permafrost regions on the Qinghai-Tibet Plateau and it changes
青藏高原多年冻土区地下水及其变化
Cryospheric changes and their impacts on regional water cycle and ecological conditions in the Qinghai-Tibetan Plateau
青藏高原冰冻圈变化及其对区域水循环和生态条件的影响
Evolution and trend of water resources in Qinghai-Tibet Plateau
青藏高原水资源演变与趋势分析
Disaster effect induced by Asian Water Tower change and mitigation strategies
“亚洲水塔”变化的灾害效应与减灾对策
Spatio-temporal evolution pattern and driving factors of mountain torrent disasters in China since the founding of the People's Republic of China
DOI:10.1360/N072017-00328 URL [本文引用: 1]
建国以来中国山洪灾害时空演变格局及驱动因素分析
Climate change over the Yarlung Zangbo river basin during 1961-2005
DOI:10.1007/s11442-007-0409-y URL [本文引用: 1]
Spatiotemporal variation of extreme precipitation events in the Yarlung Zangbo river basin from 1973 to 2016
1973—2016年雅鲁藏布江流域极端降水事件时空变化特征
Changes in daily climate extremes in the eastern and central Tibetan Plateau during 1961-2005
Spatial and temporal climate variations from 1978 to 2009 and their trend projection over the Yarlung Zangbo river basin
雅鲁藏布江流域1978—2009年气候时空变化及未来趋势研究
Ten-year return levels of sub-daily extreme precipitation over Europe
DOI:10.5194/essd-13-983-2021 URL [本文引用: 1]
Land monsoon and non-monsoon regions under climate change comparison of extreme precipitation characteristics
DOI:10.7522/j.issn.1000-0534.2020.00077
[本文引用: 1]

This article uses the monthly precipitation and monthly daily average temperature data from the monthly average surface climate element data set (CRU TS 4.02), and uses linear trend analysis, moving average and correlation analysis methods to study the background of climate change from 1901 to 2017 The characteristics of extreme precipitation in the global terrestrial monsoon and non-monsoon regions.The results show that the frequency distribution of extreme precipitation in the Asian monsoon region where China is located is relatively stable, and only large-scale and small-value areas appear during the warming slowing period; the non-monsoon area shows a polarization in the frequency distribution of extreme precipitation during the Sharply accelerated warming period.The small value area and the large value area coexist in the monsoon area, which is not easy to occur.The average change of extreme precipitation frequency in monsoon and non-monsoon regions basically tends to be the same, and only differs during periods of accelerated warming.Monsoon and non-monsoon extreme precipitation frequency changes in the proportion of grid points in the small value area tend to be consistent, and only differ in the two accelerated warming periods.For the large value area, excluding the periods of 1921 -1949 and 1950 -1972, the monsoon area is larger.The proportion of grid points in the value area is lower than that in the non-monsoon area.The distribution of extreme precipitation in monsoon and non-monsoon regions is relatively less affected by climate change, but no matter which period of cold or warm, the extreme precipitation in monsoon regions is much higher than that in non-monsoon regions.The correlation between extreme precipitation frequency and temperature in non-monsoon regions is better than that in monsoon regions.When temperature trends are superimposed, most areas of mid-to-high latitudes are positively correlated.After detrending, the correlation weakens.
气候变化背景下陆地季风与非季风区极端降水特征对比
The Yellow River basin becomes wetter or drier? The case as indicated by mean precipitation and extremes during 1961-2012
DOI:10.1007/s00704-014-1138-7 URL [本文引用: 1]
Temporal and spatial variation characteristics of intensity and frequency of hourly extreme precipitation in China from 1961 to 2013
透视中国小时极端降水强度和频次的时空变化特征(1961—2013年)
Characteristics of precipitation variation and its effects on runoff in the Yarlung Zangbo River basin during 1961-2010
1961—2010年西藏雅鲁藏布江流域降水量变化特征及其对径流的影响分析
Hole-filled SRTM for the globe Version 4
The first high-resolution meteorological forcing dataset for land process studies over China
DOI:10.1038/s41597-019-0340-y URL [本文引用: 1]
On downward shortwave and longwave radiations over high altitude regions: Observation and modeling in the Tibetan Plateau
DOI:10.1016/j.agrformet.2009.08.004 URL [本文引用: 1]
ANUSPLIN Version 4.3 User Guide
Hydrological rule and isotopic composition of water bodies in Yarlung Zangbo river
雅鲁藏布江径流水文规律及水体同位素组成
Dominant modes of dry- and wet-season precipitation in southwestern China
我国西南地区干湿季降水的主模态分析
Spatial and temporal characteristics of the precipitation over the Tibetan Plateau from 1961 to 2010 based on high resolution grid-observation dataset
基于高分辨率格点观测数据的青藏高原降水时空变化特征
Analysis and understanding on runoff variation of the Yellow River in recent 100 years
黄河近百年径流量变化分析与认识
The concise encyclopedia of statistics by Yadolah Dodge
DOI:10.1111/insr.2008.76.issue-3 URL [本文引用: 1]
Spatial and temporal variation in extreme precipitation events in southwestern China during 1962-2012
1962—2012年西南地区极端降水事件的时空变化特征
Change in extreme temperature and precipitation over northern China during the second half of the 20th century
中国北方近50年温度和降水极端事件变化
Clivar/GCOS/WMO Workshop on Indices and Indicators for Climate Extremes Workshop Summary
DOI:10.1023/A:1005491526870 URL [本文引用: 1]
Report on the activities of the working group on climate change detection and related rapporteurs
A climatic perspective on the impacts of global warming on water cycle of cold mountainous catchments in the Tibetan Plateau: A case study in Yarlung Zangbo River Basin
Multiscale spatial differentiation and physical influencing factors of urban and rural settlements in the middle reaches of the Yarlung Zangbo River Basin
雅鲁藏布江中游地区城乡居民点多尺度空间分异及自然因素影响分析
A review of advances in China's flash flood early-warning system
DOI:10.1007/s11069-018-3173-7 URL [本文引用: 1]
