

1 引言
目前,已有很多方法被应用于评估或反映人类活动强度。Sanderson等[17]用人类足迹来指示人类活动对自然环境的压力,他选取了人口与基础设施中的4类指标(人口密度、土地转换、可达性、电力基础设施),对4类指标的每个因子进行标准化赋值,并在1 km2的网格上叠加各因子值得到人类足迹指数。Theobald等[18]改进了人类足迹法,提出人类改造度模型。该模型在对人类活动各因子赋值时,考虑不同因子作用程度的差异,为每个因子赋予一定的权重值,进而得到了90 m分辨率的人类改造度数据。在国内,李士成等[19]参考了人类足迹法,根据高原人类活动特点,选取了人口密度、土地利用/土地覆被、道路和放牧密度4类指标,基于县级数据,采用专家打分法赋值,得到了青藏高原县域和1 km空间分辨率的人类活动强度值;李兰晖[16]以人类改造度模型为框架,选取了人类居住区、农牧业、交通运输、工矿和能源生产、电力基础设施5类人类活动压力源的12个相关指标,利用随机森林模型和模糊叠加模型求和,得到了1 km空间分辨率的青藏地区人类活动强度数据集。这些人类活动强度空间化结果,体现了人类活动的空间差异。但这些方法中评估指标的赋值多基于专家知识或经验模型,通过数理方法插值,缺乏对人类活动机理的理解和表达。比如说放牧强度,现实中并不是所有的草地都用作牧场,即便是适宜放牧的草场,也有部分草场因为环境保护或者生态建设的需要而禁止放牧[20];且放牧草场也不是进行同等程度的放牧,距离牧户或者离牧道较近的区域往往承载了更大的放牧压力[21]。而现有的空间化方法难以体现人类活动在空间分布上的这种机理性差异。
本文以青藏高原草地上的放牧活动为例,探讨人类活动强度空间化方法,刻画草地内部放牧强度的空间差异。并基于乡镇级牧业数据和自然地理基础信息,在高原典型牧业县—青海省泽库县进行实证研究。以期构建基于人类活动机理的高原放牧强度空间化方法,为土地变化机制分析提供参考。
2 模型构建
放牧强度可看作放牧密度与放牧概率偏差的乘积。
式中:GIi代表第i个栅格单元的放牧强度;Di代表第i个栅格单元所在行政区域的放牧密度;Bi代表第i个栅格单元的放牧概率偏差。
2.1 放牧密度
放牧密度是单位放牧面积上的牲畜数量,因放牧活动要受一定的范围限制,放牧面积不是区域所有草地面积的总和。首先,青藏高原放牧草场一般会按季节划分,不同季节的放牧活动多只在对应草场内进行,随着季节演替,牧民对牲畜转场[23]。因此,要先明确各季节放牧草场的空间分布及居民点位置。其次,放牧活动多围绕居民点展开[24],在国家相关政策的实施下,牧民放牧多采取定居放牧的形式,以居民点为原点,向四周散开。再者,政府为保护草原生态,划定了一定的禁牧区域,对禁牧区之外的草场实施草畜平衡管理[25],放牧面积等同于草畜平衡面积。草原生态保护补助奖励政策实施之前,放牧范围为区内所有可利用草地;政策实施后,放牧范围以草畜平衡面积为控制,依据一定规则,逐步拓扑筛选确定。
在明确了放牧范围后,区域放牧密度按如下公式计算:
式中:D代表放牧密度;N代表转换为统一标准的牲畜数量总数;S代表放牧面积;k为该区域牲畜种类数;ra为第a种牲畜标准羊单位折算系数;La为第a种牲畜的数量。
2.2 放牧概率
放牧概率是指在放牧范围内各个草地单元上进行放牧的可能性大小。在放牧过程中,牲畜总会采用最经济有效的策略获取最大的采食效率[26],即牲畜会优先采食资源条件好且较易获取的草地植被,此草地上的放牧概率大。因此,放牧概率的大小可以根据草地资源的放牧适宜性来确定。
2.2.1 影响因子选择 草地放牧适宜性主要依据草地植被状况的好坏和草地植被获取的难易程度来确定[26]。土地覆被数据中草地被分为高覆盖度草地、中覆盖度草地、低覆盖度草地3种类型,这直接反映了草本植物的生长状况。此外,植被的生长与所处的地理环境密切相关,地貌是影响区域小气候、水文、土壤等生境要素的主要因子[27],本文选取海拔、坡度、坡向等地貌因子作为放牧概率的影响因子。放牧活动也是人为规划的过程[28],在放牧轨迹跟踪实验中观察到,牧民放牧一般从居民点出发,沿着道路转移牧群[29],牲畜除了采食和行走还需饮水[30],所以放牧概率也要考虑距居民点、道路、河流的距离,这影响着草地植被获取的难易程度。
基于上述分析,本文选取草地类型、海拔、坡度、坡向、距居民点的距离、距道路的距离、距河流的距离7个因子,作为影响放牧概率的因子。
2.2.2 因子特征分析 基于影响因子的特点和共性,将因子归为限制因素、便利因素和偏好因素3类。
计算放牧概率的公式如下:
式中:Pi代表第i个栅格单元的放牧概率;Mi代表第i个栅格单元的影响因子的影响力总值;M代表行政区内放牧范围中所有草地栅格单元的影响力总值;n代表行政区域内放牧范围中草地栅格单元的数量;t代表影响因子的数量;uib代表第i个栅格单元第b个影响因子的影响力值。
计算放牧概率偏差的公式如下:
式中:Bi代表第i个栅格单元的放牧概率偏差;Pi代表第i个栅格单元的放牧概率;
2.3 放牧强度
经过上述分析,放牧范围中每个草地栅格单元的放牧强度可以表示为如下公式:
式中:GIi代表第i个栅格单元的放牧强度;k为该区域牲畜种类数;ra为第a种牲畜标准羊单位折算系数;La为第a种牲畜的数量;n代表行政区域内放牧范围中草地栅格单元的数量;t代表影响因子的数量;uib代表第i个栅格单元第b个影响因子的影响力值。
3 实例分析
3.1 数据来源及处理方法
3.1.1 泽库县概况 泽库县位于青海省东南部(34°45′N~35°32′N, 100°34′E~102°08′E)。土地总面积为665853 hm2,其中草场面积652527 hm2,占土地总面积的98%。主要草地类型为山地草甸和高寒草甸,二者分别占全县草地总面积的46.65%、26.33%[38]。
该县是青海省的典型牧业县,全县辖6乡2镇,64个行政村,2018年末乡村人口6.64万,占总人口的85.28%[39]。畜牧业在全县国民经济中占主导地位,2018年地区生产总值为16.27亿元,其中,牧业总产值达8.53亿元。全县各类牲畜年未存栏数为53.96万头(只、匹),其中,牛22.40万头,马1.02万匹,山羊0.28万只,绵羊30.26万只。牧民放牧的主要形式为定居放牧。
泽库县可利用草地面积为608747 hm2,自2011年开始实施草原生态保护补助奖励政策,对330080 hm2的可利用天然草地进行禁牧封育,放牧草场为278667 hm2,实施草畜平衡管理。
3.1.2 数据来源 DEM数据下载于地理空间数据云,空间分辨率为30 m;居民点、道路、河流等矢量数据来源于中国基础地理信息数据库,比例尺为1:25万,其中居民点结合Google Earth高清影像进行了核查补充。土地利用数据为中科院资源环境科学与数据中心的多期土地利用土地覆被数据集,时间跨度为2000—2018年,空间分辨率为30 m。年末牲畜存栏量来自于泽库县统计局编制的《泽库县国民经济统计资料》,草畜平衡面积由泽库县农牧科技局提供。植被指数数据采用NASA发布的EOS/MODIS数据中的MOD13Q1级数据产品,空间分辨率为250 m,时间序列为2000—2018年,采用最大值合成法(Maximum Value Composites, MVC)获取年最大NDVI值,用以表示当年植被生长的最好状况。
3.1.3 植被覆盖变化趋势分析 一元线性回归可以分析每个像元的年最大NDVI值的年际变化趋势,将线性回归方程的斜率视为植被覆盖变化的年际趋势率(Slope)[40]。计算公式如下:
式中:Slope为年最大NDVI与时间变量拟合的一元线性回归方程的斜率;n为年跨度;i为时间变量;Mi表示第i年的最大NDVI值。Slope > 0则说明年最大NDⅥ在n年间的变化呈现增加趋势,表明植被覆盖呈变好的趋势,反之则是减少,表明植被覆盖呈变差的趋势。
3.2 放牧强度计算
3.2.1 放牧范围的确定 2000年泽库县对天然草地进行划分并全部实现承包到户,放牧方式由游牧转为定居放牧,全县的放牧范围即为各乡镇的所有可利用天然草地。2011年起,泽施库县全面实草原生态保护补助奖励政策,以草畜平衡面积作为放牧草场面积(图1)。
图1
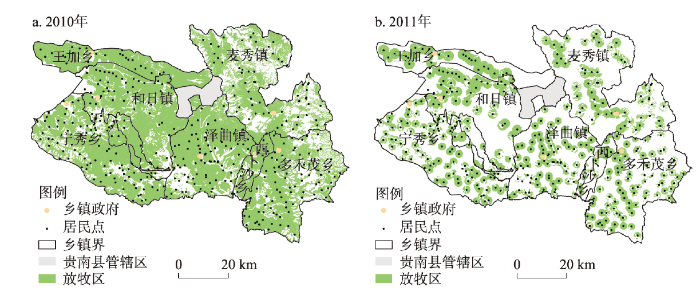
图1
草原生态保护补助奖励政策实施前后放牧活动空间分布
Fig. 1
Spatial distribution of grazing activity before and after Grassland Ecological Compensation Policy (GECP) implementation
表1 放牧概率影响因子分类赋值
Tab. 1
| 因素 | 因子 | 分类方法 | 函数 |
|---|---|---|---|
| 限制 | 坡度 | 将坡度≤ 35°的坡地分为10类,分别为0°~3°、3°~5°、5°~8°、8°~12°、12°~15°、15°~18°、18°~21°、21°~25°、25°~30°、30°~35°,坡度由小到大依次标号 | y=-0.0047x2+0.0503x+0.2279 |
| 海拔 | 对4700 m以下的海拔高度以100 m为间隔分带,由泽库县海拔高度2789~4700 m划分为16个高程带,由低到高依次标号 | y=0.00009x4-0.0032x3+0.0391x2-0.1756x+0.6073 | |
| 便利 | 居民点 | 以100 m为间隔在放牧范围内分带,由近及远依次标号 | y=-0.0175lnx+0.3808 |
| 道路 | 以100 m为间隔对离道路最远距离5 km内分带,划分为50个带,由近及远依次标号 | y=-0.0358lnx+0.4132 | |
| 河流 | 以100 m为间隔对离河流最远距离1 km内分带,划分为10个带,由近及远依次标号 | y=0.0003x4-0.0056x3+0.0403x2-0.1295x+0.4375 | |
| 偏好 | 草地 类型 | 将高覆盖度草地、中覆盖度草地、低覆盖度草分别标记为1、2、3 | 为保持同一数量级,1、2、3分别对应0.66667、0.50000、0.33333 |
| 坡向 | 坡度≤ 3°的为平地,标号为1,将坡向分为东南、南、西南、北、东北、东、西和西北8类,分别标为2、3、4、5、6、7、8、9 | y=0.0021x4-0.0476x3+0.3469x2-0.8814x+0.8753 |
注:>35°的坡地因土层薄,植物生长差,石砾含量高,不宜放牧,不将其作为此次研究重点,故在≤ 35°的坡度范围内分类。泽库县最高海拔为4961 m,因海拔高于4700 m的区域分布着大面积的裸岩石砾地,植被稀疏,不宜放牧,不将其作为此次研究重点,故在低于4700 m的范围内分带。距河流、道路最远距离的确定依据文献[21, 23]的研究中进行放牧轨迹跟踪实验所得的数据,将分类标号分别带入函数进行赋值。
图2
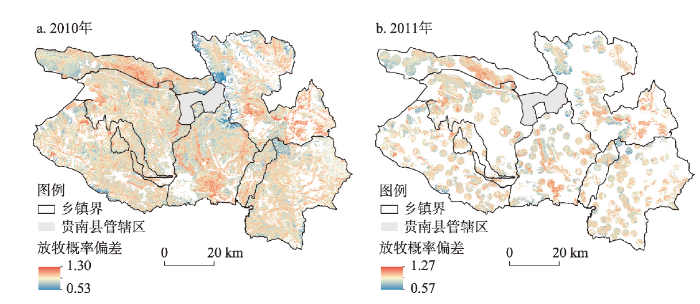
图2
泽库县草原生态保护补助奖励政策实施前后放牧概率偏差空间分异
Fig. 2
Spatial variation of grazing probability deviation in Zeku County before and after GECP implementation
3.2.3 放牧密度的计算 因不同牲畜品种在草地上日采食量不同,需要将不同品种的牲畜折算成统一单位,依据2015年农业部颁布的《天然草地合理载畜量的计算》标准,将各类牲畜数量统一换算为羊单位。
3.3 放牧强度空间化结果分析
根据构建的放牧强度模拟模型得到2000年、2005年、2010年、2011年、2015年、2018年6个年份的泽库县放牧强度空间分布图(图3)。从研究结果看,泽库县放牧强度空间差异明显,北部乡镇整体放牧强度较低,中南部乡镇整体放牧强度较高,每个乡镇范围内,放牧强度也存在较大空间差异,放牧强度高的区域多沿河流和道路呈条带状分布或呈块状集中连片分布。
图3
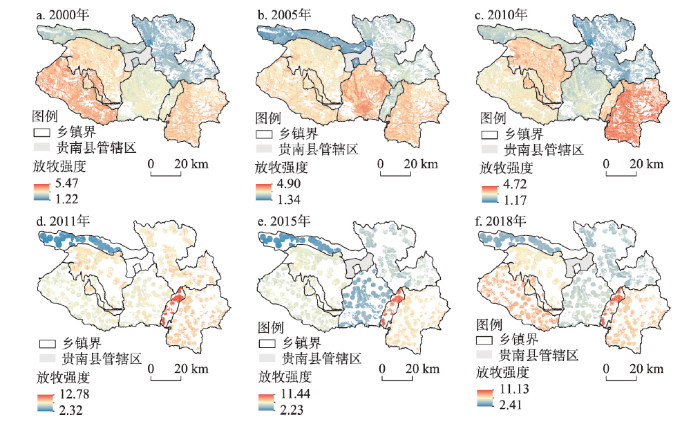
图3
2000—2018年泽库县放牧强度空间分布
Fig. 3
Spatial distribution of grazing intensity before and after GECP implementation
4 讨论
4.1 空间化结果的佐证
归一化植被指数(Normalized Difference Vegetation Index, NDVI)多用来反映地区植被生长状况[41,42,43]。分析泽库县2000年、2010年、2011年和2018年NDVI与放牧强度的对应关系(图4、表2)发现,2000—2010年泽库县放牧强度整体呈下降趋势,放牧强度均值减少0.414羊单位/hm2,而同期泽库县NDVI整体呈上升趋势,NDVI升高的单元格占99.14%。2000—2010年泽库县牲畜数量减少,可利用草地放牧压力减小,有利于草地植被的恢复和生长,这是草地NDVI上升的主要原因。2011—2018年泽库县放牧强度整体同样呈下降趋势,放牧强度均值减少0.789羊单位/hm2,此时,泽库县NDVI整体有所上升,NDVI增加的单元格占72.79%。放牧区NDVI值增加的面积占73.37%,高于非放牧区72.09%的对应比例。可以看出,放牧强度出现一定变动时,NDVI也出现对应变化,放牧强度变化与草地植被NDVI变化在时间和空间上均具有较好的一致性,且NDVI在放牧区变化的幅度更为明显,说明放牧强度变化可以在一定程度上解释NDVI的变化。
图4
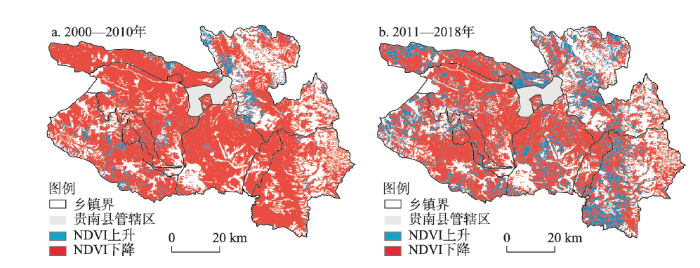
图4
2000—2010年和2011—2018年泽库县NDVI年际变化
Fig. 4
Trend of NDVI change in Zeku County from 2000 to 2010 and 2011 to 2018
表2 泽库县放牧强度与NDVI变化情况
Tab. 2
| 时段 | 放牧强度变化 | NDVI变化 |
|---|---|---|
| 2000—2010年 | 下降0.414羊单位/hm2 | 上升占99.14% |
| 2011—2018年 | 下降0.789羊单位/hm2 | 上升占72.79% |
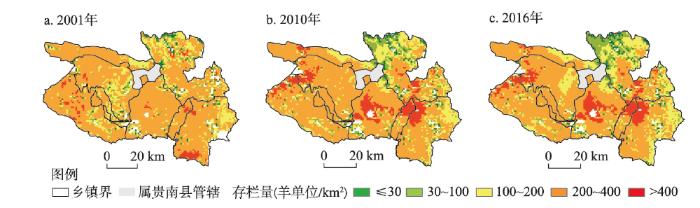
4.2 与相关研究的比较
图5
4.3 不足与展望
由于无法获取季节草场的分界图件及详细数据,本文未考虑季节草场居民点转场迁移问题。在实地调研过程中,通过牧户访谈,发现泽库县放牧草场有冬季草场和夏季草场之分,虽然不同牧户的冬、夏草场距离有远有近,但各乡镇牧户转场时间基本一致。未来可根据转场时间,结合NDVI值变化,确定季节草场的大致分界线,以更准确地确定不同时段的放牧范围。
本文中放牧居民点主要依据1:25万基础地理数据确定,并结合Google Earth高清影像核查补充,虽然基本上反映了研究区居民点总体状况,但由于区域内居民点分布相对零散,可能有部分放牧居民点未统计在内。另外,根据草地质量与牲畜数量的差异,不同乡镇实际放牧距离可能也不完全一致。这些都有待于进一步深入调研,以提升放牧强度空间化结果的准确性。
另外,本文仅探讨了高原牧区典型人类活动形式—放牧活动强度的空间化方法,而人类活动还涉及到耕作、城镇建设、交通、旅游、工矿开发等其他活动形式,如何全面掌握区域人类活动强度状况,需要对不同人类活动形式进行综合评估。希望本文能为相关人类活动的空间化提供参考和借鉴。
5 结论
本文以分布在青藏高原草地上最主要的人类活动形式—放牧活动为研究对象,依据放牧行为与居住点的关系,结合放牧管理策略,识别了放牧区和非放牧区;确定了放牧密度,以衡量区域整体放牧压力;分析高原草地生长状况和分布特征,选取了放牧影响因子,并根据牲畜采食行为与道路、河流、海拔、坡度等因子的函数关系,率定了单元格草地的放牧概率,表征放牧可能性;在此基础上,构建了放牧强度空间化模型,并在高原典型牧业县—泽库县进行了应用实证研究。放牧强度空间化结果较好地反映了泽库县放牧强度的空间差异,与相关研究结果具有很好的一致性,且能更清晰地表现出县域内部的差异;放牧强度变化过程与同期NDVI值变化具较好的统一性,反映出放牧是导致区域草地植被变化的重要原因。
本方法考虑了海拔、坡度、坡向等自然地理要素,以及围栏封育、草畜平衡等相关政策对放牧活动的限制,区分了放牧区和非放牧区。并依据相关研究成果中放牧活动影响因素与放牧行为间的函数关系对各影响因子进行赋值,这有效提高了放牧强度空间化结果的准确性。
人类活动强度空间化过程中,应尽量选取能够直接反映人类活动状况的指标,减少代用指标的应用;充分考虑人类活动的影响因子,从机理上分析各影响因子与人类活动强度的关联,避免简单机械地给因子赋值,这有望成为人类活动强度空间化研究的重要方向。
参考文献
Sixteen years of change in the global terrestrial human footprint and implications for biodiversity conservation
Human pressures on the environment are changing spatially and temporally, with profound implications for the planet's biodiversity and human economies. Here we use recently available data on infrastructure, land cover and human access into natural areas to construct a globally standardized measure of the cumulative human footprint on the terrestrial environment at 1 km(2) resolution from 1993 to 2009. We note that while the human population has increased by 23% and the world economy has grown 153%, the human footprint has increased by just 9%. Still, 75% the planet's land surface is experiencing measurable human pressures. Moreover, pressures are perversely intense, widespread and rapidly intensifying in places with high biodiversity. Encouragingly, we discover decreases in environmental pressures in the wealthiest countries and those with strong control of corruption. Clearly the human footprint on Earth is changing, yet there are still opportunities for conservation gains.
Response analysis of land use change to the degree of human activities in Beiluo River basin since 1976
1976年以来北洛河流域土地利用变化对人类活动程度的响应
Ecosystem carbon stocks and their changes in China's grasslands
DOI:10.1360/zc2010-40-7-566 URL [本文引用: 1]
中国草地生态系统碳库及其变化
Putting people in the map: Anthropogenic biomes of the world
DOI:10.1890/070062 URL [本文引用: 1]
Preliminary discussion on the method of quantitative assessment of human activity intensity
人类活动强度定量评价方法的初步探讨
Human activity intensity and its spatial distribution pattern in upper reach of Minjiang river
岷江上游地区人类活动强度及其特征
Construction and application of regional quantitative model of human activity intensity
DOI:10.3724/SP.J.1047.2009.00452 URL [本文引用: 1]
区域人类活动强度定量模型的建立与应用
Spatio-temporal variations and coupling of human activity intensity and ecosystem services based on the four-quadrant model on the Qinghai-Tibet Plateau
Changes of runoff consumption and its human influence intensity in the mainstream of Tarim River
塔里木河干流径流损耗及其人类活动影响强度变化
Anthropogenic impact on habitat connectivity: A multidimensional human footprint index evaluated in a highly biodiverse landscape of Mexico
DOI:10.1016/j.ecolind.2016.09.007 URL [本文引用: 1]
Simulation of human activity intensity and its influence on mammal diversity in Sanjiangyuan National Park, China
Spatial pattern of land use intensity in China in 2000
DOI:10.11821/dlxb201607004
[本文引用: 1]

In this paper, according to the intensity of human impacts, a national hierarchical land use intensity classification system was designed based on comprehensive and high-resolution spatial datasets. According to the degree and reversibility of surface disturbance by human activities, we obtained data for four main groups of artificial land, semi-artificial land, semi-natural land and natural land, which were further divided into 22 classes based on indicators such as human population density, and cropping intensity. Land use intensity in China with a 1-km spatial resolution was obtained. The area proportions of artificial land, semi-artificial land, semi-natural land and natural land were 0.71%, 19.36%, 58.93% and 21%, respectively. Besides, significant spatial variability was demonstrated at national, regional and provincial levels. The southeastern region with denser population had more classes of land use intensity and was more intensive than the northwestern region with sparse population. With the increase of longitude, a transition in dominated land use intensity type was detected from natural and semi-natural land to semi-natural and semi-artificial land. The land use intensity in provinces of eastern China was the highest, followed by those in central and western regions. The land use intensity types showed a remarkable spatial differentiation of clustered distribution. Compared with the previous studies, our research effectively characterizes the spatial heterogeneity of land use intensity, which can help us to get a better understanding of spatial pattern of human-environment interactions and its eco-environmental impacts, which can provide scientific basis for sustainable land use policies.
21世纪初中国土地利用强度的空间分布格局
Human activity intensity of land surface: Concept, method and application in China
DOI:10.11821/dlxb201507004
[本文引用: 1]
Human activity intensity is a synthesis index for describing the effect and influence of land surface. This paper presents the concepts of human activity intensity and construction land equivalent, builds an algorithm model for human activity intensity, and establishes a method for converting different land use/land cover types into construction land equivalent as well. An application in China based on the land use data from 1984 to 2008 is also included. The results are shown as follows: (1) Human activity intensity is defined as the degree of land use, transformation and exploitation by human beings. It is an effective way to determine the construction land equivalent coefficient of different land use/land cover types by taking construction land equivalent as a basic unit and identifying the alteration of land surface natural properties caused by human activities. The application in China and correlation analysis with population density indicated that it is feasible to take the ratio of the construction land equivalent area to the total area as an indicator of human activity intensity. (2) We adopted a two-level method of eight attribute labels to construct general standard of converting different land use types into construction land equivalent, and establish a method for calculating the coefficient of construction land equivalent. We also built a coefficient table for constructing land equivalent of 49 land use types based on the latest land use classification system. (3) The human activity intensity in China increased from 7.63% in 1984 to 8.54% in 2008. It could be generally divided into five levels: very high, high, medium, low and very low, according to the human activity intensity at county level in 2008, which is rated by over 27%, 16%-27%, 10%-16%, 6%-10% and below 6%. The human activity intensity in China was spatially split into eastern and western parts by the line of Helan Mountain-Longmen Mountain-Jinghong; the eastern part was characterized by the levels of very high, high and medium, while the western part was featured by the low and very low levels.
陆地表层人类活动强度: 概念、方法及应用
Improved population mapping for China using remotely sensed and points-of-interest data within a random forests model
DOI:10.1016/j.scitotenv.2018.12.276 URL [本文引用: 1]
Assessing anthropogenic and climatic impacts on vegetation greenness change on the Tibetan Plateau
[D].
气候变化和人类活动对青藏高原绿度变化的影响研究
[D].
The human footprint and the last of the wild
DOI:10.1641/0006-3568(2002)052[0891:THFATL]2.0.CO;2 URL [本文引用: 1]
A general model to quantify ecological integrity for landscape assessments and US application
DOI:10.1007/s10980-013-9941-6 URL [本文引用: 1]
Mapping human influence intensity in the Tibetan Plateau for conservation of ecological service functions
DOI:10.1016/j.ecoser.2017.10.003 URL [本文引用: 1]
Preliminary analysis of the grazing activities and the relationship with alpine grassland degradation base on the tracing experiment
[D].
基于跟踪实验的放牧活动与高寒草地退化关系初探
[D].
Response of vegetation and soil to different grazing intensities of alpine grassland in northern Tibet
藏北高寒草地植被和土壤对不同放牧强度的响应
The research on grazing routes in Qinghai Lake watershed based on the grazing behavior of herdsmen: A case of Gangcha County
基于牧民放牧行为的青海湖流域放牧路线研究: 以刚察县为例
Grazing, the basic form of grassland ecosystem and its transformation
草原生态系统存在的基本方式: 兼论放牧的转型
Grassland eco-compensation: Equivalent relationship between livestock reduction and compensation
草原生态补偿: 减畜和补偿的对等关系
Effects of grazing intensities on foraging behaviors of goats on a cultivated pasture of southern China
放牧强度对山羊采食行为的影响
Correlation intensity of vegetation coverage and topographic factors in Chishui watershed based on RS and GIS
基于RS和GIS的赤水河流域植被覆盖度与各地形因子的相关强度研究
Spatial and temporal characteristics of sheep displacement during grazing
绵羊放牧过程中的位移时空特征
A review of mountain grazing-paths and vegetation spatial heterogeneity
山地牧道与植被空间异质性研究评述
Advances in studies on livestock grazing behavior in grassland ecosystem
放牧生态系统家畜牧食行为研究进展
Vegetation and altitude gradient in southern part of Qinghai Lake Basin
青海湖湖盆南部的植被与海拔梯度
Spatial distribution of insolation-duration in Loess Plateau
黄土高原可照时间空间分布特征研究
Effects of grazing systems on the community characteristics of alpine steppe in Qinghai Lake region
放牧方式对环青海湖高寒草原群落特征的影响
Effect of slope aspect on vegetation growth and soil nutrient characteristics of alpine grassland in the source region of Yangtze River
坡向对长江源区高寒草地植被生长和土壤养分特征的影响
Spatial characteristic of vegetation change in the source regions of the Yangtze River, Yellow River and Lancang River in China
三江源地区植被指数下降趋势的空间特征及其地理背景
Response of vegetation to climate change and human activity based on NDVI in the Three-River Headwaters region
基于NDVI的三江源地区植被生长对气候变化和人类活动的响应研究
Greening of the Tibetan Plateau and its drivers since 2000
新世纪以来青藏高原绿度变化及动因
Effects of degradation degree on soil physicochemical properties and soil water-holding capacity in Zeku alpine meadow in the Headwater Region of Three Rivers in China
退化程度对三江源泽库高寒草甸土壤理化性质及持水能力的影响
Qinghai Statistical Yearbook (2019)
青海统计年鉴(2019)
The spatial-temporal changes of vegetation coverage in the Three-River Headwater Region in recent 12 years
The Three-River Headwater Region is the source areas of the Yangtze River, the Yellow River, and the Lancang River. The region is not only of key importance to the ecological security of China. Due to climate change and human activities, ecological degradation occurred in this region. Therefore, "The nature reserve of Three-River Source Regions" was established, and "The project of ecological protection and construction for the Three-River Headwater Nature Reserve" was implemented by Chinese government. This study, based on MODIS-NDVI and climate data, aims to analyze the spatial-temporal changes of vegetation coverage and its driving factors in the Three-River Headwater Region between 2000 and 2011 from three dimensions. Linear regression, Hurst index and partial correlation analysis were employed. The results showed that: (1) In the past 12 years (2000-2011), the NDVI of the study area increased, with a linear tendency being 1.2%/10a, of which the Yangtze and the Yellow river source regions presented an increasing trend, while the Lancang River source region showed a decreasing trend. (2) Vegetation coverage presented an obvious spatial difference in the Three-River Headwater Region, and NDVI frequency was featured by a bimodal structure. (3) The vegetation coverage improved area was larger than the degraded area, being 64.06% and 35.94% respectively in the 12 years, and presented an increase pattern in the north and a decrease one in the south. (4) The reverse characteristic of vegetation coverage change is significant. In future, the degradation trends will be mainly found in the Yangtze River Basin and north of the Yellow River, while the improving trend areas are mainly distributed in the Lancang River Basin. (5) The response of vegetation coverage to precipitation and potential evapotranspiration has time lag, while the temperature does not have. (6) The increased vegetation coverage is mainly attributed to the warm-wet climate change and the implementation of the ecological protection project.
2000—2011年三江源区植被覆盖时空变化特征
Dynamic changes of grassland vegetation coverage from 2001 to 2011 in Gannan Prefecture
2001—2011年甘南草地植被覆盖度动态变化分析
The relative roles of climate variations and human activities in vegetation change in North China
DOI:10.1016/j.pce.2015.09.017 URL [本文引用: 1]
Distinguishing the vegetation dynamics induced by anthropogenic factors using vegetation optical depth and AVHRR NDVI: A cross-border study on the Mongolian Plateau
DOI:10.1016/j.scitotenv.2017.10.253 URL [本文引用: 1]
