

1 引言
人口分布是人地关系最基本的空间表征[1,2],是地理学关注的核心问题之一。2015年中国劳动年龄人口达到峰值,城市之间的人才争夺战随即展开;全国人口达峰也是未来数年内不可避免的现实,城市和区域之间的人口竞争必将更加激烈。在此背景下,人口空间分布受到了学术界和政策界前所未有的普遍关注。中国共产党的“十九大”报告指出要“加强人口发展战略研究”,而人口分布正是人口发展在空间上的综合体现[3],是产业合理布局、资源优化配置和福利平衡供给的前提和基础[4,5]。从地理学的空间性和综合性视角分析中国人口分布格局的新动态,有助于判断人口空间发展的趋势性,解读人口和资源环境及经济社会发展要素之间的关系逻辑,识别人口和区域发展面临的问题和挑战,从而有针对性地提出人口发展的相应空间对策[6]。
在自然地理环境和社会经济条件的双重影响下,人口分布格局具有稳定性和动态性并存的典型特征[7]。地形地貌、海拔、气候等自然地理条件始终是中国人口分布格局的重要基础,因此国家尺度上的人口分布具有高度的稳定性[8,9,10]。1935年地理学家胡焕庸在《论中国人口之分布》中提出了瑷珲—腾冲线,生动刻画了当时中国人口东密西疏的空间分布规律[11],地形平坦、海拔较低、沿海沿江等自然条件较好的地区人口密度也相对较高[12,13,14,15],这一宏观格局在经历数十年的经济社会高速发展后仍未发生,未来也很难发生根本性的改变[16,17,18]。尽管如此,自然地理条件对中国人口分布整体格局的约束程度仍表现出不断下降的趋势,而经济发展和公共服务水平对人口分布的影响程度则不断提升,导致了区域和地方尺度上人口再分布的高度动态性[19]。这种动态性根源于区域竞争中人口和劳动力要素日益提升的关键作用和人民对更高收入和美好生活日益增加的向往之间形成了高度耦合,也得益于国家和区域空间战略的实施及交通通讯等基础设施的快速发展[8, 20]。
人口分布格局演变的动态性与人口迁移流动和城镇化格局变迁密切关联。1978年改革开放以来,随着户籍管制的不断放松,人口的大规模迁移流动成为重塑中国人口分布格局的主要力量[20,21,22,23]。然而,长江中上游、华北平原等主要人口流出地和作为主要流入地的沿海城市群地区均位于胡焕庸线东南侧,胡焕庸线西北侧的人口流动并不活跃[24],这就导致了胡焕庸线两侧的人口整体比例没有大的改变,但在省级和地级尺度上的人口空间聚散特征却经历着持续而剧烈的变动[25]。利用最具系统性和可靠性的人口普查数据,大量的实证研究发现,2000—2010年间中西部人口大规模向东部沿海地区集中[26],长三角、珠三角、京津冀等主要城市群及中心城市吸纳了大量流动人口[4, 20, 27],使得胡焕庸线东南侧的人口分布更为集聚[8];而西北侧的人口增长主要动力则是自然增长,迁移流动的贡献比较有限,整体呈现出相对均衡的人口集疏模式[28]。在省域尺度上,21世纪以来普遍实施的强省会战略进一步强化了省会城市在资源配置、产业投资和公共服务供给方面的优势,多数省份都出现了人口向省会城市集聚的明显趋势[29]。
2010年以来,中国的区域发展战略和经济地理格局都发生了急剧变化,人口迁移流动也进入深度转变的时期。国家新型城镇化的规划制定和战略推进为城市群地区和省会为主的大城市赋予了带动国家和区域发展的引领责任[30];资源要素配置市场化改革的推进、高铁通讯等基础设施的建设也大幅提高了这些地区和城市的人口吸引力和承载力[20];人口迁移流动更加活跃,流动人口的结构变化带动了其流向格局和流入地分布的持续变迁[31]。东部沿海地区和中西部内陆地区的发展差异长期存在,南方和北方发展不平衡的现象开始凸显[32,33],东北地区发展停滞和人口持续外流现象受到普遍关注[34],省会等大城市以省内不平衡发展为代价参与全国性人口和资源竞争的现象愈发普遍而严重[29]。在上述理论和现实背景下,中国人口分布的总体格局和地区差异出现了什么新特征和新趋势?“东南集聚、西北均势”的人口聚散特征是否仍然持续,抑或是表现出了新的人口聚散特征?国家和区域空间战略实施及宏观经济格局变迁如何影响并重塑了中国人口分布的格局动态?这些问题对于合理引导资源要素配置、推进基本公共服务均等化、实现以人为本的新型城镇化具有重要意义[35]。
中国在2020年开展了第七次全国人口普查,为新时期人口分布格局新动态的刻画、新动力的识别、新趋势的发现提供了系统可靠的数据基础。基于此,本文采用第五次、第六次全国人口普查资料及第七次全国人口普查各省(自治区、直辖市)公报数据,分析21世纪以来中国人口分布的格局动态,并试图对2000—2010年和2010—2020年两个时期的人口分布格局变化进行解释和对比,以期发现中国人口空间转变的新特点和新趋势,为促进人口和城镇化的空间布局优化及人地关系的协调发展提供参考。
2 方法与数据
2.1 人口分布格局演变分析
基尼系数是在洛伦兹曲线的基础上提出的判断收入分配平均程度的度量指标,其数学含义是在洛伦兹曲线图中绝对平均线和洛伦兹曲线之间的面积同绝对平均线和绝对不平均线之间的面积的比。本文将各省和自治区的各地级单元按照人口密度排序,利用人口和面积的累积百分比,建立各省和自治区的人口分布洛伦兹曲线。将区域R内所有n个空间单元按照常住人口密度从大到小排列,各空间单元的位序为i(i = 1, 2, …, n),计算各位序的常住人口占比(记作Pi)、面积占比(记作Ai)及面积累积百分比(记作AiC),则基尼系数(GR)的计算公式为:
在空间可视化分析方面,① 采用全国人口分布研究普遍使用的密度分级,便于本文结果与前人研究的比较,确保可比性的同时,有助于新特征、新趋势的发现;② 采用人口密度增速指标分析不同时段的人口分布变化,各地人口密度增速存在差异是人口分布空间格局变动的根本原因;③ 采用地级单元与所在省份之间的人口相对增长率(即各地区人口增长率减去全省人口增长率),消除各省人口增量的差异性,以聚焦省域内部各地人口增长的空间不平衡特征,分析各省人口分布变动模式的差异性;④ 根据2000—2010年和2010—2020年两个时期的人口增减状况对各地级单元进行人口增长类型划分,解读人口增减的区域分化特点,识别中国人口分布的趋势性特征。
2.2 解释模型和变量
人口分布受到自然地理环境和经济社会发展等多种因素的影响,本文将采用多元线性回归模型开展两项实证研究:① 探究2000—2020年中国人口分布动态的影响因素,分析不同因素影响力的变化特征;② 检验空间分析结果在控制其他影响因素之后的稳健性,进而探讨人口分布动态演化的机制。构建的基准计量模型如下:
式中:被解释变量growthit是i地区在t时段的人口增长率。解释变量方面,纳入基期人口密度(density),定量探讨中国人口整体的聚散趋势;并通过其与胡焕庸线两侧等区域性变量(region)的交互作用,考察不同区域人口聚散趋势的差异性。引入是否为省会的虚拟变量(capital),检验省会在吸引人口方面是否具有额外优势;并通过其与省域经济发展水平、基期省域人口分布基尼系数等省级指标(prov_attribute)的交互作用,考察不同类型省份的省会人口吸引力是否存在差异性和规律性。
在控制变量(CONTROL)方面,首先控制各地人口自然增长率(ngrowth)的影响;选取一月份平均气温(temJan)、PM2.5(pm25)和平均坡度(slope)表征自然地理特征,城镇居民人均可支配收入(incomeu)和地区人均非农就业数量(pcemp)表征经济发展状况,地区人均医护人员数量(pcmedp)和人均中小学教师数量(pctch)表征公共服务供给;此外,考虑到少数民族人口相对较低的流动参与率[36]也可能对人口聚散空间格局产生影响,因此将少数民族人口占比(ethp)纳入控制变量。在两个时期模型的估计结果中,上述控制变量系数的变动能够有效反映出自然地理和经济社会因素对中国人口分布动态影响程度的变动情况,有助于发现新时期的人口布局新动力和新趋势。
2.3 数据来源
研究数据主要来源于第五次、第六次全国人口普查资料及各省(自治区、直辖市)第七次全国人口普查主要数据公报,并将3个年份的数据按照2020年行政区划情况进行整合,最终确定为357个地级行政单元。需要说明的是,本文的分析暂未包含港澳台地区;此外,新疆维吾尔自治区直辖各县级行政单元缺少第七次人口普查数据,因此也不在本文的研究范围内;河南、湖北、海南的各省直辖县级行政单元,均按照地级行政单元处理。在进行胡焕庸线两侧人口占比的计算时,为保证结果的精准性及与前人研究结果的可比性,将与胡焕庸线相交的地级单元拆分至两侧,并以两侧面积为权重分配人口数量;在回归模型中则将完整地级行政单元划入面积较大的一侧。
此外,回归分析中还使用了一些其他自然地理和社会经济统计数据。地区生产总值、城镇居民人均可支配收入、非农就业数量、医护人员和中小学教师数量等数据来自2001年和2011年的《中国区域社会经济统计年鉴》及各省(自治区、直辖市)统计年鉴;少数民族人口占比和人口自然增长率来源于历次人口普查资料;1月均温通过对国家气象科学数据中心下载的各气象站点数据进行克里金(Kriging)插值得到;平均坡度基于中国科学院资源环境科学与数据中心下载的250 m全国DEM数据计算得到;PM2.5数据则来源于哥伦比亚大学国际地球科学信息网络中心公开发布的全球PM2.5栅格数据集。由于个别变量在一些行政单元中存在缺失值,最终纳入回归分析中的样本数量为290个;在考察省级指标变量时,样本不含北京、上海、天津、重庆4个直辖市。各变量含义和描述性统计见表1。各自变量间的方差膨胀因子(VIF)均< 5,不存在明显的共线性问题;White检验发现存在异方差,因此在回归中采用稳健性标准误来消除异方差的影响。
表1 变量描述性统计
Tab. 1
| 变量 | 符号 | 2000年 | 2010年 | |||||||
|---|---|---|---|---|---|---|---|---|---|---|
| 均值 | 标准差 | 最小值 | 最大值 | 均值 | 标准差 | 最小值 | 最大值 | |||
| 常住人口增长率(%) | growth | 7.39 | 13.22 | -21.04 | 72.00 | 3.28 | 15.31 | -26.56 | 69.53 | |
| 基期人口密度(千人/km2) | density | 0.39 | 0.39 | 0.00 | 3.61 | 0.44 | 0.51 | 0.00 | 5.33 | |
| 省会 | capital | 0.11 | 0.31 | 0.00 | 1.00 | 0.11 | 0.31 | 0.00 | 1.00 | |
| 所在省份人均GDP(万元) | provpcGDP | 0.73 | 0.32 | 0.28 | 2.77 | 3.07 | 1.18 | 1.32 | 7.46 | |
| 省域人口分布基尼系数 | provgini | 0.34 | 0.18 | 0.11 | 0.79 | 0.36 | 0.17 | 0.12 | 0.75 | |
| 一月平均气温(℃) | temJan | -1.36 | 9.96 | -25.99 | 20.56 | 0.25 | 9.34 | -24.80 | 21.21 | |
| PM2.5 | pm25 | 22.38 | 11.63 | 0.79 | 62.33 | 36.30 | 17.30 | 2.78 | 74.80 | |
| 平均坡度(°) | slope | 5.34 | 3.90 | 0.16 | 18.12 | 5.34 | 3.90 | 0.16 | 18.12 | |
| 城镇居民人均收入(千元) | incomeu | 5.92 | 2.05 | 3.22 | 21.63 | 17.15 | 4.44 | 8.26 | 35.69 | |
| 人均非农就业数量 | pcemp | 0.26 | 0.10 | 0.02 | 0.65 | 0.35 | 0.10 | 0.12 | 0.68 | |
| 每百人医护人员数 | pcmedp | 0.35 | 0.13 | 0.03 | 1.01 | 0.44 | 0.13 | 0.16 | 0.96 | |
| 每百人中小学教师数 | pctch | 0.82 | 0.15 | 0.20 | 1.46 | 0.83 | 0.16 | 0.42 | 1.33 | |
| 少数民族人口占比(%) | ethp | 11.64 | 21.78 | 0.04 | 97.73 | 11.53 | 21.67 | 0.01 | 96.91 | |
| 人口自然增长率(‰) | ngrowth | 5.88 | 3.35 | -1.17 | 17.42 | 4.89 | 3.27 | -2.74 | 16.14 | |
注:常住人口增长率在2000年和2010年的值分别为2000—2010年和2010—2020年的常住人口增长率;其他变量均为当年数值。
3 中国人口分布格局演变的新趋势
3.1 人口东密西疏格局依然稳定,胡焕庸线西北侧人口占比由升转降
胡焕庸线界定了中国人口分布东密西疏的基本格局,两侧自然地理环境的差异性决定了这一格局的长期稳定性[19]。20世纪80年代以来,中国经历了大规模远距离的人口迁移流动,但人口主要迁出地和迁入地均位于胡焕庸线东南侧,并未打破这种人口分布的空间格局[20],西北侧反而因为较高的生育率和较低的迁出率而实现了高于东南侧的人口增长,占全国人口的比例也从1982年的5.77%持续提升至2010年的6.32%[37]。最新的人口普查数据再次证实了自然地理环境影响下的人口分布格局稳定性。2020年人口密度超过1000人/km2的地级单元全部位于胡焕庸线东南侧,而西北侧人口密度超过400人/km2的地级单元仅有银川市,甚至200~400人/km2的地区也只有7个(图1)。
图1
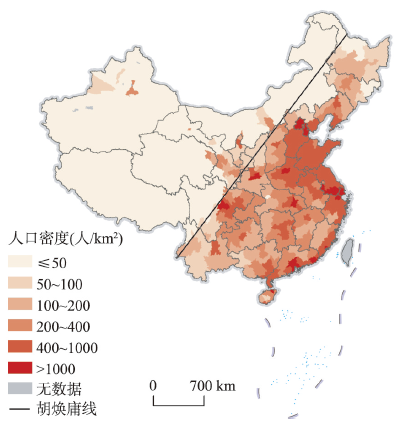
图1
2020年中国人口密度分布
注:基于自然资源部标准地图服务网站GS(2019)1815号标准地图制作,底图边界无修改,下文同。
Fig. 1
Population density of China in 2020
但值得注意的是,胡焕庸线西北侧人口占全国总人口的比重不再继续提高,甚至出现了小幅回落,其原因在于生育率的下降和户籍人口增长失速。一方面少数民族人口占比较高的西北地区生育率随经济社会发展而开始明显下降。2000年和2010年主要位于胡焕庸线西侧的新疆、西藏、青海、甘肃、宁夏、内蒙古等6省区的0~14岁人口占比分别比全国水平高2.68个和1.59个百分点,而2020年该差距已降至1.28个百分点,西北地区的生育率优势已非常有限。另一方面,虽然这些省区2010—2020年间净流入人口增量比2000—2010年间高出近350万,但户籍人口增量却少了近600万,增长率从2000—2010年的11.43%降低至2010—2020年的3.46%。这既反映了生育率的下降,也提示2010—2020年西北地区吸引人口落户的能力有所弱化。
3.2 人口分布集中化速度明显加快,且成为各区域的普遍趋势
人口分布的空间集中趋势明显加强。中国人口空间分布的基尼系数在2000—2010年间提高了0.0074,而2010—2020年则快速提高了0.0164,人口分布集中化的速度是前10年的两倍以上(表2)。这种快速集中化的人口分布趋势性得到多种统计指标的印证:人口密度在400人/km2以上的地级单元数量由122个逐步增至124个和128个,这些地区承载的人口占全国人口的比例也从51.19%逐步提高到53.35%和57.19%;承载全国80%人口的地区面积由24.96%逐步下降到24.59%和23.20%,而人口规模前20位城市占全国人口比重则由17.51%逐步提高到18.72%和21.05%;在全国人口保持增长的前提下,2010—2020年有156个地级单元人口减少,而在2000—2010年仅有94个。不同视角下的各种指标均可得到类似的结论:全国人口分布的空间集中度持续提高,且2010—2020年的集中化速度是2000—2010年的两倍左右,中国人口正在向少数地区加速集聚。
表2 2000—2020年各区域人口分布基尼系数变化
Tab. 2
| 2000年 | 2010年 | 2020年 | ||
|---|---|---|---|---|
| 全国 | 0.711 | 0.718 | 0.735 | |
| 胡焕庸线两侧 | 东南半壁 | 0.517 | 0.534 | 0.566 |
| 西北半壁 | 0.754 | 0.748 | 0.752 | |
| 四大地区 | 东部 | 0.365 | 0.398 | 0.427 |
| 中部 | 0.302 | 0.305 | 0.336 | |
| 西部 | 0.773 | 0.765 | 0.771 | |
| 东北 | 0.449 | 0.459 | 0.504 | |
中国人口分布的集中化趋势曾经长期主要发生在胡焕庸线东南侧,而西北侧的人口分布较为稳定,形成了“东南集聚、西北均势”的增长模式[37]。2000—2010年胡焕庸线东南侧集中度指数上升,人口向少数地区集中;而西北侧的集中度指数下降,人口分布更加均衡。而2010—2020年胡焕庸线两侧的人口分布均出现了明显的集中化特征,东南侧的集中化趋势大幅强化,基尼系数的提高幅度是2000—2010年的两倍左右;西北侧的集中化趋势也非常明显(表2)。按四大地区划分的计算结果与胡焕庸线两侧的规律性高度一致:2000—2010年人口分布集中化主要出现在东部和东北地区,中部维持稳定,西部人口分布均衡化;而2010—2020年的人口分布集中化则成为四大地区的共同趋势,东北和中部地区的集中化速度最快。这表明随着西北地区人口自然增长率下降和流动性提升,乌鲁木齐、兰州、银川等中心城市吸引人口的能力逐渐增强、效应逐渐显现,胡焕庸线西北侧的人口在2010—2020年向少数城市快速集中,也因此出现了全国各区域的普遍性人口分布集中化趋势。与其他地区类似,西北地区的这种人口集聚分布态势既有助于人民充分享受城镇化和现代化的成果,也有利于持续保障该地区生态功能的有效发挥[30, 37]。
3.3 东北地区普遍出现人口收缩,省会城市集聚能力全面增强
相比于2000—2010年,2010—2020年人口密度下降的区域明显增加,增长型地区和收缩型地区的数量之比从2000—2010年的2.80下降到2010—2020年的1.29(图2)。两类地区分布的最大变化是东北地区从普遍增长转变为普遍收缩,2000—2010年仅有朝阳、抚顺、铁岭、伊春等11个地区人口密度降低,而2010—2020年仅有长春、沈阳和大连等3地密度提高。人口收缩区域分布的另外两个显著变化是:川渝黔曾经是中国最大的人口收缩区,2010—2020年普遍实现了人口增长;从山西西部、陕西南部到河西走廊形成仅次于东北地区的全国第二大人口收缩区域。人口增长区域分布也出现了两个新特征:① 省会城市的人口吸引力普遍快速提升,且在胡焕庸线两侧均是如此;② 人口密度增速较快的区域在空间上更加分散,也形成了增长型地区和收缩型地区交错分布的新格局。
图2
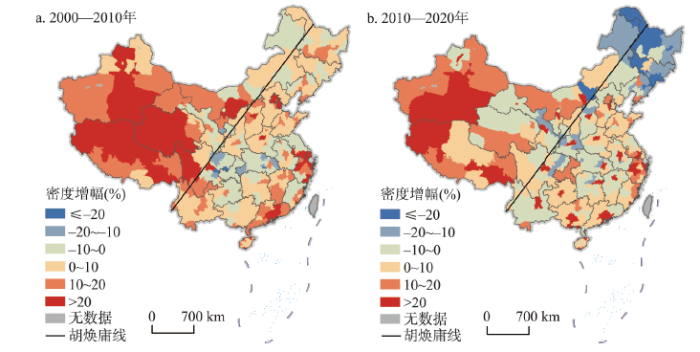
图2
2000—2010年和2010—2020年中国人口密度变化
Fig. 2
Population density change of China in 2000-2010 and 2010-2020
省会人口占比全面持续提升,2010—2020年来省会优势更加凸显。2000年以来,各省人口都在集中化,且省会是主要的人口集聚地。2000—2010年各省人口分布基尼系数平均提升了0.015,而在2010—2020年平均提升幅度达到了0.028,省域人口分布集中化速度明显加快;同时,20年来各省省会人口占比均持续提升,平均累计提升幅度达5.1个百分点,且多数省会人口占比在2010—2020年的升幅都高于2000—2010年。这种“共变”的特征表明,省会人口吸引力的提升是省域人口集中化的主要推动力,省域人口分布调整的主要方向也是向省会集中。图3显示两个时段各省人口分布基尼系数变化与省会人口占比变化的相关性大幅提升,也证明了上述结论。
图3

图3
中国各省基尼指数变化与省会人口占比关系
Fig. 3
Relationship between Gini coefficients of provinces and population share of provincial capitals
从各地的人口相对增长率分布中能够更加清晰地看出各省省会在集聚人口方面的优势(图4)。2000—2010年间,尚有厦门、苏州、嘉峪关、鄂尔多斯等28个地区的人口相对增速高于省会,而2010—2020年间仅有深圳、嘉峪关、珠海、三亚等12个地区的人口增速超过省会城市。省会的这种优势一方面体现了近年来越来越多的省份实施“强省会”战略的直接效果,行政力量在资源空间配置和人口分布引导上仍在发挥重要作用;另一方面也可能是大多数省会作为省内经济发展最好、社会保障和公共服务最完善的城市吸引了大量流动迁移人口的现实反映,是人们在效用最大化目标下“用脚投票”的结果。
图4
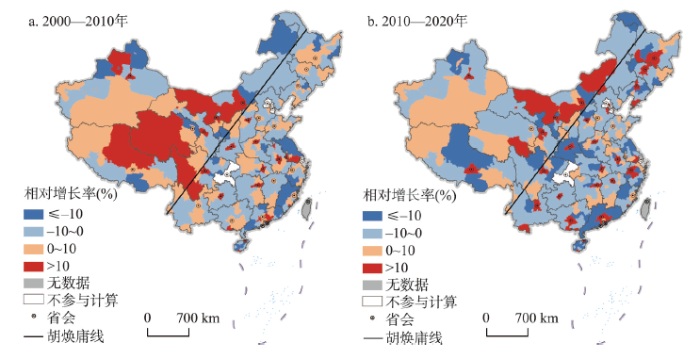
图4
2000—2010年和2010—2020年中国分省人口相对增长率分布
Fig. 4
Relative population growth rate by province in 2000-2010 and 2010-2020
3.4 人口增减的区域分化特征凸显,人口分布的趋势性逐渐明晰
按照2000—2010年和2010—2020年两个时间段的人口变化情况,本文将所有地级单元分为4类:持续增长型、止降回增型、止增收缩型和持续收缩型,各类型的空间分布均呈现出较为明显的规律性特征(图5)。持续增长型地区共165个,主要分布在沿海城市群、内陆省会城市和胡焕庸线西北侧,前两者一直保持着强劲的人口吸引力,后者则是高出生率、低流动性共同作用的结果。36个地级单元实现了人口的止降回增,主要包括长三角辐射带动的外围地区及投资驱动快速发展的成渝和贵州。止增收缩型(共98个)和持续收缩型(共58个)地区则主要分布在人口吸引力持续不足的城市群外围及非城市群地区。
图5
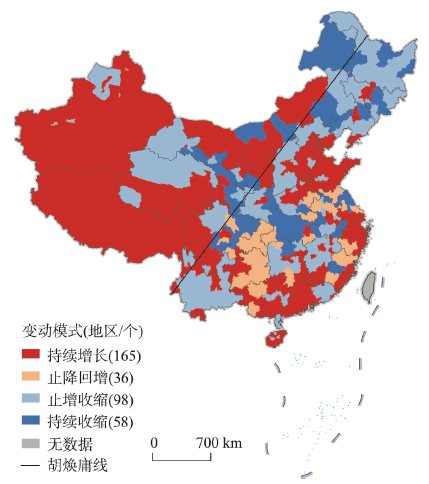
4类地区的划分结果凸显了全国人口增减动态的区域分化特征,也预示了未来人口分布的诸多趋势性。① 东北地区的低生育率、高迁出率特征对人口规模的双重负面影响持续累积,几乎全面进入区域性人口收缩的状态,很难实现逆转。② 京津冀、长三角、珠三角三大城市群虽然都实现了较大区域范围的持续性人口增长,但京津冀外围的冀北、山西等地出现了新的大范围的人口收缩区,而没有任何新的人口增长区,显然仍处于扩大范围的集聚发展阶段,对周边人口和资源的集聚效应远强于辐射带动效应。③ 长三角外围的多个地区实现了从主要人口流出区向新兴人口增长区的重要转变,虽然也有个别地区的人口开始减少,但辐射带动效应不断加强、影响范围持续扩大的趋势性仍十分明显。④ 珠三角的辐射带动作用受到地形的严重制约,但依然形成了沿主要交通线的多个人口持续增长带;2010—2020年在外围地区出现了交错分布的新兴人口增长区和收缩区,体现了地形限制条件下的辐射带动效应和资源集聚效应并存的状态,很可能成为该地区未来空间格局的新常态。⑤ 沿海的山东半岛城市群全面持续增长、海西城市群核心城市持续增长和周边城市止降回增,共同推动了从京津冀到珠三角这一大规模沿海人口增长带的形成和扩展。随着沿海高铁等重大基础设施的建设,沿海省市的区域一体化程度增强,仍将有持续较强的人口吸引力及不断拓展的人口承载能力[30]。⑥ 中部省份是各种类型地区并存且空间交错的区域,体现了以省会为主要核心城市的城市群发育程度、各地与沿海地区联系紧密程度及区域内生增长动力培育成效等多方面的差异性,是未来经济社会发展和人口资源集聚机会最多、竞争最激烈、不确定性最强的区域。⑦ 西南地区是人口止降回增类型最多的地区,在投资拉动的发展模式带动下,成渝城市群和贵州多数地区都实现了留住本地人、吸引回流者双重能力的提升[38],进而实现了从人口主要流出区向新兴增长区的转变,有望出现新时代的“西南振兴”;只有云南是明显的例外,几乎全省都从人口增长区转为收缩区,可能成为区域发展的“掉队者”和人口资源的持续输出地。⑧ 胡焕庸线西北侧的持续增长型地区仍较多,但并没有新兴的人口增长区,而人口密度最高的河西走廊则陷入持续性的人口收缩状态,加之多个人口增长区开始转变为收缩区,未来的人口发展趋势并不乐观。
4 中国人口分布格局的影响因素变迁
为探讨2000—2020年来中国人口分布动态的影响因素及机制,按照前文所述模型进行了计量分析。在包含控制变量的模型中,分别加入基期人口密度、地理区域和省会等相关变量,以检验空间分析结果的稳健性,回归结果如表3所示。计量模型的估计结果验证了前文所述的人口聚散趋势和动态。首先,以基期人口密度为自变量的回归结果表明,两个时段都表现出基期人口密度越高、人口增长越快的规律性,且相比2000—2010年,2010—2020年二者的关联性有了明显提升,验证了全国人口向高人口密度地区持续且加速集中的趋势。换言之,高人口密度地区能够在其他条件相同时吸引更多的人口,反映了区域经济和社会发展的集聚效应持续强化。在人口迁移流动自由度不断增强的背景下,这种趋势性对区域均衡发展提出了很大的挑战,但同时也意味着仍有大量人口会通过迁移流动提高生活环境和生活水平,迁移流动仍是促进人口发展、提高人民福祉的重要路径。
表3 回归分析结果
Tab. 3
| 变量 | (1) 基期人口密度 | (2) 基期人口密度×胡焕庸线 | (3) 基期人口密度×四大地区 | |||||
|---|---|---|---|---|---|---|---|---|
| 2000—2010年 | 2010—2020年 | 2000—2010年 | 2010—2020年 | 2000—2010年 | 2010—2020年 | |||
| density | 4.54(1.27) | 6.37***(3.91) | 4.82(1.38) | 6.21***(3.73) | 5.46(1.47) | 4.82***(2.78) | ||
| northwest | 4.02(1.26) | 6.36**(2.26) | ||||||
| density×northwest | 2.23(0.10) | 13.04(0.61) | ||||||
| central | 0.26(0.11) | -11.95***(-4.22) | ||||||
| density×central | -3.71(-0.73) | 18.69***(3.21) | ||||||
| west | -0.15(-0.05) | -8.74***(-2.79) | ||||||
| density×west | -6.57(-0.91) | 23.32***(2.97) | ||||||
| northeast | -5.42*(-1.67) | -19.54***(-6.08) | ||||||
| density×northeast | -8.00(-0.90) | 37.06***(5.53) | ||||||
| 控制变量 | 控制 | 控制 | 控制 | 控制 | 控制 | 控制 | ||
| 常数项 | -37.39*** (-5.38) | -53.89*** (-7.22) | -37.27*** (-5.36) | -54.06*** (-7.37) | -28.98*** (-3.24) | -39.14*** (-4.77) | ||
| 观测数 | 290 | 290 | 290 | 290 | 290 | 290 | ||
| 调整R2 | 0.569 | 0.568 | 0.574 | 0.637 | 0.578 | 0.670 | ||
| 变量 | (4) 省会 | (5) 省会×省基尼系数 | (6) 省会×省人均GDP | |||||
| 2000—2010年 | 2010—2020年 | 2000—2010年 | 2010—2020年 | 2000—2010年 | 2010—2020年 | |||
| density | 4.10(1.23) | 5.56***(2.95) | 3.10(0.91) | 6.84***(4.72) | 3.46(1.02) | 6.80***(4.77) | ||
| capital | 6.67***(3.65) | 15.31***(5.92) | 8.49**(2.04) | 18.09***(3.19) | 8.54*(1.83) | 35.51***(6.83) | ||
| provgini | 5.66(1.56) | 3.49(0.87) | ||||||
| capital×provgini | -6.67(-0.71) | -2.10(-0.14) | ||||||
| provpcGDP | 1.49(0.65) | 0.17(0.29) | ||||||
| capital×provpcGDP | -3.14(-0.49) | -6.24***(-4.57) | ||||||
| 控制变量 | 控制 | 控制 | 控制 | 控制 | 控制 | 控制 | ||
| 常数项 | -36.57*** (-5.50) | -49.06*** (-7.39) | -37.57*** (-5.51) | -54.27*** (-7.15) | -35.00*** (-5.22) | -54.36*** (-8.57) | ||
| 观测数 | 290 | 290 | 286 | 286 | 286 | 286 | ||
| 调整R2 | 0.588 | 0.691 | 0.568 | 0.723 | 0.565 | 0.738 | ||
注:括号内为采用稳健标准误的t值;*p < 0.1,**p < 0.05,***p < 0.01。
进一步分析各地理区域的人口变动特征,发现控制其他因素后,2010—2020年间胡焕庸线西北侧比东南侧地区具有更强的人口吸引力,反映出了国家战略在人口引导上的重要作用;同时也表明2010—2020年间胡焕庸线两侧出现的“趋势逆转”更多是因为西北半壁自身的区位和环境限制之下,经济和社会发展出现滞缓,且缺少人口吸引力强的中心城市。分四大地区看,2000—2010年间,相比于东部地区,仅有东北地区表现出人口增长劣势,中部和西部地区的人口增长并不明显弱于东部;在人口集聚模式上,各地区也没有表现出明显差异,即各地人口集中化的强度基本一致、趋势基本同步。而2010—2020年则出现了两个非常明显的新特征:一方面,与东部地区相比,中部、西部和东北地区的人口增长劣势都变得显著,东部的人口集聚优势更加凸显,全国人口增长的宏观格局发生了实质性转变;另一方面,中部、西部和东北地区人口向高密度地区集中的趋势性都显著强于东部地区,低密度地区人口面临着全国和区域层面的双重人口吸引压力,亟待探讨区域经济和人口发展模式的可持续转变路径。由回归结果可估算出,在其他变量相同的情况下,2010—2020年间对人口增长能够起到正向作用的密度门槛值在中部、西部、东北地区分别为639人/km2、375人/km2和527人/km2,表明中部地区人口向大城市集聚的现象最为突出。
两个时段的回归结果中,省会对人口增长都有显著的正向影响。这说明21世纪以来省会在人口增长方面始终具有优势,这种超额增长可能是由于中央和省级政府对高行政等级城市的偏爱,为这些城市提供了更优惠的产业和土地等方面的政策,进而对人口的集聚有正向影响[39]。进一步的分析发现,省会集聚趋势与各省人口分布模式无关,但会受到各省经济发展阶段的影响。各省人口分布基尼系数及其与省会的交互项在两时间段均不显著,提示人口向省会和高人口密度地区集聚一直是普遍的、广泛的,与各省的人口分布模式无关,验证了前文的空间分析结论。各省发展阶段及其与省会的交互项对人口增长的影响在两个时间段发生了一些变化:2000—2010年各省经济发展水平对人口空间聚散格局并没有显著影响,提示21世纪初10年由于人口流动规模还不是很大,各地自然增长对人口增长仍有重要贡献[20, 36];在人口流动更加活跃、户籍限制更少的2010—2020年间,所在省份的发展阶段对非省会地区人口增长速度的影响依然不显著,但对省会城市的人口集聚优势起到了明显的调节作用:所在省份整体经济发展状况越好,省会城市的人口集聚优势就越小。这种变化意味着省会人口优势将随全省整体经济发展而弱化,即某省发展到一定阶段后,通过行政手段提升省会人口“首位度”的效果将大打折扣,省内各城市间的人口竞争将更依赖于城市自身的经济社会发展状况。
最后,自然地理环境、经济发展、公共服务、民族结构和自然增长等控制变量对人口增长的影响也反映了中国人口分布格局的动力结构变迁。将所有控制变量加入模型,各变量标准化回归系数及变化特点显示(图6),少数民族人口占比对各地人口增速的重要性上升而人口自然增长率的影响力减弱,这印证了前文中关于近年来人口格局变动受迁移流动影响逐渐增强、以及少数民族人口迁移流动相对不活跃的论述。经济因素一直对人口迁移流动和空间分布具有重要作用,但在2010—2020年的影响程度有所弱化,这种弱化主要体现在收入水平的解释力下降,而就业机会对人口格局变动的影响程度变化不大;与此同时,公共服务尤其是医疗条件对各地人口增长的作用有明显提升。这一变化提示,中国人口流动迁移模式已经显现出从“经济型”主导向“经济型”和“舒适型”并存的转变趋势。鉴于经济要素的作用在减弱而舒适性的重要性在上升[36],未来各地提升人口吸引力需要更加重视以公共服务为代表的舒适物的供给。此外,在控制了其他因素后,一月平均气温在两个10年间呈现出了截然相反的影响效果,而一月平均气温具有非常明确的纬度分异性,表明中国人口增长格局存在明显的阶段性南北分化过程,且这一过程并非完全由南北方经济或公共服务差距导致,未来需要从文化、制度等方面进一步探讨其具体机制。
图6
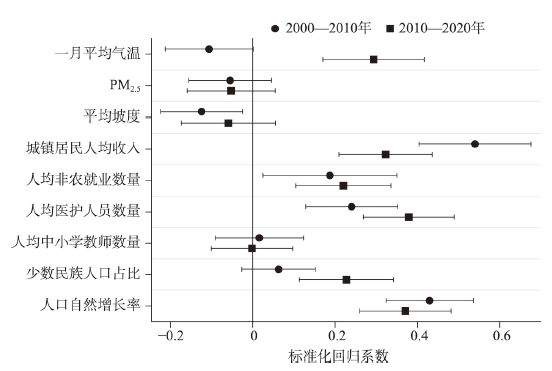
图6
两时间段各控制变量的标准化回归系数
Fig. 6
The standardized coefficients of control variables in 2000-2010 and 2010-2020
5 结论与讨论
人口普查通过“普遍调查”的方式,能够有效避免抽样误差,尤其对于人口空间分布格局的研究,具有抽样调查、被动采集等途径获取的数据不可比拟的真实性、系统性和可靠性。尤其是第七次全国人口普查采用了电子化手段、加强了多部门间行政记录数据的对比、增加了身份证号码采集等新措施,大大降低了漏报和重报率,为准确认知中国人口情况提供了坚实的数据支撑[40]。基于3次全国人口普查数据,本文分析了2000—2020年间中国人口分布格局和变动趋势,并尝试探讨了人口增长格局的变动机制,得到的主要结论有:中国人口东密西疏的分布格局没有发生根本改变,胡焕庸线西北侧受到生育率和人口吸引力双双下降的影响而使得人口占比由升转降;但在相对稳定的空间分布格局下,人口分布的集中化趋势却在明显加强,2010—2020年的集中化速度是2000—2010年的近两倍,并且成为各个区域的普遍趋势;省会城市在这一人口集中化过程中成为最大赢家,尤其是2010—2020年的优势更加明显,但在经济发展水平更高的省份,省会城市相比于其他城市的人口吸引力优势要明显弱于欠发达省份;人口增减的区域分化也揭示了东北地区人口全面收缩、沿海人口城镇密集带发育形成、成熟城市群辐射带动外围区域、西北半壁人口面临收缩风险等趋势性特征。本文还发现,2010—2020年人口空间分布特征及影响因素与2000—2010年相比已有了明显差异,不同地区人口增减的规律性明显。人口增长的驱动因素已逐渐从单一的经济要素主导转向经济要素和舒适性要素并重,各地区舒适性的差异可能成为未来人口竞争成败的关键。此外,人口集中化趋势虽然有助于实现集聚效应,但人口集中带来的“大城市病”、人口流失区域经济持续衰退、全国发展不平衡加剧等问题,将是未来人口发展的重要挑战。
本文的结论对把握中国人口分布整体格局和动态具有一定参考意义,但囿于篇幅和数据仍有一些话题尚未展开。首先,人口分布是经济社会、自然生态、制度政策等多种因素作用的综合结果,本文重点关注了经济、舒适性、自然条件等因素的影响,而婚姻、生育观念等社会性因素及计划生育、生态移民等政策性因素也在人口分布和聚散中发挥着一定的作用,对于特定地区人口分布变动的研究尤为重要,未来需要结合更多的专项调查等辅助数据库开展持续深化的分析;其次,人口分布和聚散因素的区域差异仍需要深入探索,东中西部、南北方、东南西北半壁的人口聚散因素是否一致,对各地因地制宜地制定人口政策有重要意义;再次,本文探讨了人口总体分布格局和变化机制,但特定人群如流动人口、高学历人才、老年人口、少数民族人口等群体的空间分布及变动对要素配置和政策制定也极为重要,需要待更精细的普查数据公布后尽快展开;最后,本文是基于地级行政单元尺度进行的分析与探讨,但由于存在尺度效应,基于不同尺度的分析结论可能会有所不同,需要进行多尺度的人口分布格局分析以检验结论的一致性,第七次全国人口普查分县、分乡镇街道数据的公布将有力支撑相关研究的深入。
参考文献
The distribution of population: A constructive problem
DOI:10.2307/208251 URL [本文引用: 1]
Evolvement of spatial pattern of population with data at county level in Jiangsu Province
江苏省人口空间格局演化特征
The challenge facing population geography
The current status of the study of population geography is examined, with some reference to the situation in the United Kingdom. The authors note that whereas the volume of studies in this area indicate its healthy growth, the subdiscipline has become increasingly distant from mainstream geography and runs the risk of being absorbed into general demography. The authors suggest that "population geographers, while taking a serious interest in the methods and philosophy of the neighbouring discipline of demography, should look elsewhere to find direction for their subdiscipline."excerpt
Spatio-temporal changes of population density and exploration on urbanization pattern in China: 2000-2010
中国人口密度时空演变与城镇化空间格局初探: 从2000年到2010年
Mismatch distribution of population and industry in China: Pattern, problems and driving factors
DOI:10.1016/j.apgeog.2018.05.021 URL [本文引用: 1]
Population geography
DOI:10.1177/030913257800200112 URL [本文引用: 1]
Research on the spatial pattern of population agglomeration and dispersion in China
DOI:10.11820/dlkxjz.2010.10.003
[本文引用: 1]

<p>Population agglomeration and dispersion are the most direct and the most concentrated expression of population spatial distribution pattern. The research on population agglomeration and dispersion spatial pattern and its formation mechanisms in a specific region will not only help to reveal the population agglomeration and dispersion in the region of the inherent law itself, but also benefit the study of the overall regional population spatial pattern, and even further, the study of regional economy agglomeration and urbanization. With the largest population and significant difference in regional natural condition and economy, China’s population agglomeration and dispersion, in terms of not only the size but also complexity, are not comparable in the world. Thereby, research on the spatial pattern of China’s population agglomeration and dispersion, which will contribute to grasping the essence of China’s population spatial distribution pattern, is of great significance in both academy and practice. The article chose the classification evaluation of population agglomeration, which classified China into many population agglomeration types of different levels according to their population centralization index, and then, discussed them in each type. Based on this and the comprehensive consideration on the spatial distribution pattern of China’s population, natural conditions, human environment suitability and economic development, the article generalized the spatial pattern of China’s population agglomeration and dispersion.</p>
基于人口集聚度的中国人口集疏格局
Spatial heterogeneity and its changes of population on the two sides of Hu Line
DOI:10.11821/dlxb201701012
[本文引用: 3]
Hu Line uncovers one of China's most important characteristics of population paper distribution: East is dense, while west is sparse. Different from most previous research, this paper examined the differentiation and changes of population distribution on both sides of Hu Line from a perspective of spatial stratified heterogeneity instead. Geodetector was employed based on the spatial database of China's census data of 1953, 1982, 1990, 2000 and 2010 to reconfirm spatial position of Hu Line and analyzed changes of spatial stratified heterogeneity of population between southeast and northwest sides of Hu Line in different periods. Changes of population distribution since the founding of New China were found and the reasons for these changes were discussed. Major findings include: (1) From the spatial stratified heterogeneity perspective, Hu Line could be improved and optimized, at least, in some periods. Although the ratio of total population on both sides of Hu Line has roughly been kept at 94:6 since 1953, spatial stratified heterogeneity of population between the two sides (the southeastern side: the northwestern side) increased when Hu Line moves to south slightly in 1953, 2000 and 2010, which means population distribution was more homogeneous within either southeastern or northwestern region and heterogeneity was more remarkable between the two regions. (2) Heterogeneity decreased gradually since the reform and opening up. We found characteristics of population distribution converged on the two sides, especially since the 1990s when convergence between the two sides became apparent. This finding is significantly different from the conclusion of "remain unchanged" from most literatures. The reasons why heterogeneity reduced were: pattern of population distribution on the southeastern side changed from relatively even distribution among cities before 1990 to agglomeration in a few huge cities after 2000, while the degree of spatial agglomeration of population decreased slightly after the reform on the northwestern side. These changes have been confirmed by the analysis from cumulative distribution function and Gini coefficient. (3) On the whole, the effect of economic factors on population distribution has become more and more important, while the effect of natural environment and institution reduced. Combined effect from economic development, natural environment and institution resulted in two opposite directions of changes of population spatial distribution on the two sides. It should be emphasized that although general effect of natural environment has decreased, some natural factors, such as Three Gradient Terrains, still have significantly influence on population distribution in China.
胡焕庸线两侧人口的空间分异性及其变化
The relief degree of land surface in China and its correlation with population distribution
中国地形起伏度及其与人口分布的相关性
Population distribution and the influencing factors based on ESDA
基于ESDA的中国人口空间格局及影响因素研究
The population distribution of China, with statistics and maps
DOI:10.11821/xb193502002
[本文引用: 1]
China is the most populous country of the world.Besides her great numberof population she has also the most densely inhabited regions which are notcomparable with any other country of the world.
中国人口之分布: 附统计表与密度图
Research on the spatial pattern & formation mechanisms of population agglomeration & shrinking in China
中国人口集疏格局与形成机制研究
Geographical cost and the population distribution pattern
地理成本与人口空间分布格局研究
Population distribution of China based on GIS: Classification of population densities and curve of population gravity centers
中国人口分布的密度分级与重心曲线特征分析
Characterizing spatial patterns of population distribution at township level across the 25 provinces in China
DOI:10.11821/dlxb201508004
[本文引用: 1]
Spatial pattern of population distribution has a typical character of scale dependency. Fine-scale estimation of the population distribution has been a huge challenge in the field of population geography. In China, township is the finest administrative unit in official population census data. Thus, population density data at township level can be used to describe and characterize the population spatial pattern and changes elaborately, and support optimized layout plan of Chinese population, and government policy decision making. Township boundaries across 25 provinces in China had been collected in this study. The 5th national population census data was spatially joined to the boundary layer for population density calculation. Methods of Lorenz curve, geo-spatial analysis, and latitude/longitude transect had been applied to reveal the agglomeration degree, spatial patterns of population distribution with latitude and longitude. Based on the correlation and stepwise regression analysis, four variables, including relief degree of land surface (RDLS), water system density (WSD), road system density (RSD) and nighttime light index (NTL), were introduced to check the variety of population distribution in each province. The results showed that: (1) the variety of population distribution can be distinguished clearly by the mean population density on township scale than that of county level. (2) The overall population distribution can be characterized as dense in the southeast and sparse in the northwest, while lower population density occurs in some part of southeastern China, and vice versa. (3) The population density at township level along six designed longitude and latitude transects varies greatly. The possible impact factors include the three-level landscape features, local topography, regional economy, and the proximity to coastline, transportation hub, and hydrological systems. The correlation coefficient at provincial level, between the RDLS, WSD, RSD, NTL, and the population density has been identified as 0.56, 0.28, 0.61, and 0.69, respectively. At township level, topography and economy exert more impacts on population distribution in Liaoning, Jilin, Beijing, Tianjin, Shanghai, Hebei, Henan, Shaanxi, Shanxi, Shandong, Anhui, Jiangsu, Hunan, Hubei, Jiangxi, Zhejiang, Fujian, Guangdong, and Hainan. In addition to the four factors mentioned above, it is necessary to introduce more natural or social factors to explore the population distribution pattern in Tibet, Qinghai, Inner Mongolia, Yunnan, and Guizhou. This study expanded the research scale and dimension of the research in population geography research in China. The resulted population density dataset in 2000 is expected to enrich the baseline data resources for population geography development in China and the world.
基于乡镇尺度的中国25省区人口分布特征及影响因素
A GIS-based study on the distribution pattern of China's population in 2000 and a comparison with Hu Huanyong's study in 1935
基于GIS的中国2000年人口之分布格局研究: 兼与胡焕庸1935年之研究对比
Study on population distribution pattern at the county level of China
中国县域人口空间分布格局研究
The population distribution spatial patterns evolution and the estimation of the disequilibrium based on county-level census: 1990-2010
中国人口空间分布格局演变与非均衡性测度: 基于分县尺度人口普查数据: 1990—2010
Spatial distribution pattern of population and characteristics of its evolution in China during 1935-2010
DOI:10.11821/dlyj201608012
[本文引用: 2]
Spatial distribution pattern of population and its evolution with the change of time and space is a hotspot and core content for human geography. Under the influence of complex environmental factors like geology, geography, ecology, and resources, population and social economy in western and eastern regions of China exhibit a lopsided development pattern over a long period of time. With the proposed New Urbanization Construction and the Belt and Road strategy, the social economy in western China, or even the whole China, has opportunities and space for development. Under the circumstance, this study on population distribution in different periods and areas in China will provide basis and spatial cognition for the development of relevant sustainable development policies and measures. Population data is acquired from the national statistical yearbook and population census data in different periods, and further built up spatial joint with the county administrative boundary in different periods. The population density is calculated based on the population data and regional area, and revised according to the adjacent years. With the support of geographical information technology, the inverse distance weighted method is used for spatial interpolation of the population density. Because of spatial density and distribution for the sampling points, average population density replaced interpolated results in western China. The study depicts the east-west dividing line of population density and discrepancies of population density in different periods and areas during 1935-2010 using county-level Chinese census data from six stages (1935, 1964, 1982, 1990, 2000, and 2010) with the index of population distribution structure, the Gini coefficient of population density, the movement trace of population center of gravity, and spatial autocorrelation analysis. The results showcase the dividing line of population density and discrepancies of population density in different periods and areas during 1935-2010. Because of the influence of history, environment and economy, the characteristics of population distribution evolution in different periods and areas keep changing in this study. It is known to all that the people are mainly distributed in Southeast China with little area, and population is much sparse in Northwest China, but with the larger area. Even though the population distribution trend of balanced development keeps increasing, the spatial distribution pattern of population has not changed obviously in the whole nation. The Hu Huanyong Line can still be a good summary of the characteristics of population distribution in China. To the west of the Hu Huanyong Line, population density in several provinces keep increasing during 1935-2010, such as Gansu Province and Ningxia and Inner Mongolia autonomous regions. The number of areas with population density with more than 50 people per kilometer increases greatly in the three provincial units. Moreover, the trend transferred to northwest China during 1935-2010. At the same time, the population distribution has obvious spatial autocorrelations in China in the last 80 years. In spatial scale, the hot and cold spots for population distribution have obvious aggregation, with great spatial difference in the whole China. The High-High regions are mainly distributed in South and East China where population density is very high and economy is developing repidly. The Low-Low regions are distributed on both sides of Hu Huanyong Line, namely, Southwest China and Northwest China. The natural environment and living standard are very poor in these regions. The spatial difference of population distribution in the High-Low and Low-High regions is very obvious because of local natural geographical environment and economic development, and these regions are usually distributed around the High-High and Low-Low regions. Thus, it is possible to coordinate the development between eastern and western China. We should understand the connotation and denotation of the question put forward by Premier Li Keqiang based on the natural law and economic development strategy of China in the new period. Meanwhile, people-oriented awareness should be further set up, and the New Urbanization Construction can be used to raise urbanization levels in China, thus improving the standard of living and environment.
1935—2010年中国人口分布空间格局及其演变特征
China's floating population in the 21st century: Uneven landscape, influencing factors, and effects on urbanization
DOI:10.11821/dlxb201504005
[本文引用: 6]
China has witnessed unprecedented urbanization over the past decades. The rapid expansion of urban population has been dominated by the floating population from rural areas, of which the spatiotemporal patterns, driving forces, and multidimensional effects have been scrutinized and evaluated by voluminous empirical studies. However, the urban and economic development mode has been reshaped by the globalization and marketization processes and the socioeconomic space has been restructured as a consequence. How has the spatial pattern of floating population evolved against these backdrops? How has the evolution been driven by the interaction of state and market forces? What have been the contribution of population mobility to the urbanization of origin and destination regions and the evolution of China's urban system? The latest national censuses conducted in 2000 and 2010 offer the opportunity to systematically answer these questions. Analysis based on the county-level data comes to conclusions as follows. (1) The spatial pattern of floating population remained stable over the first decade of the 21st century. Three coastal mega-city regions, namely the Yangtze River Delta, the Pearl River Delta, and the Beijing-Tianjin-Hebei Region, were major concentration areas. As the emergence and rapid development of other coastal mega-city regions, the coastal concentration area of floating population tended to geographically united as a whole, whereas the spatial distribution within each region variegated significantly. (2) Floating population gradually moved into provincial capitals and other big cities in interior regions and its distribution center of gravity moved northward around 110 km during the study period. (3) Compared with extensively investigated inter-provincial migrants, intra-provincial migrants had higher intention and ability to permanently live in cities they worked in and thus might become the main force of China's urbanization in the coming decades. (4) The spatial pattern of floating population was shaped jointly by the state and market forces in transitional China. While the impacts of state forces have been surpassed by market forces in the country as a whole, they are still important in shaping the development space of central and western China. (5) The massive mobility of population contributed a large proportion to the increase of urbanization levels of both origin and destination regions and reshaped China's urban system in terms of its hierarchical organization and spatial structure.
中国流动人口空间格局演变机制及城镇化效应: 基于2000和2010年人口普查分县数据的分析
Research on classification methods and spatial patterns of the regional types of China's floating population
DOI:10.11821/xb201010004
[本文引用: 1]
With the rapid increase of the number and influence of floating population in China, it is urgent to understand the regional types of China's floating population and their spatial characteristics. After reviewing the current methods for identifying regional types of floating population, this paper puts forward a new composite-index method and its further modification method consisting of two indexes simultaneously: the net migration rate and gross migration rate. Further, those methods are empirically tested by using China's 2000 Census data at county level. The results show: (1) The composite-indexes method is much better than the traditional single-index method because it can measure the migration direction and scale of floating simultaneously and in particular it can identify the unique regional types of floating population with large-scale immigration and emigration. (2) The modified composite-indexes method, by using the share of a region's certain type of floating population to the total in China as weight, can effectively correct the over- or under-estimated error due to the rather large or small total population of a region. (3) The spatial patterns of different regional types of China's floating population are closely related to regional differentiation of their natural environment, population density and socio-economic development level. The three active regional types of floating population are mainly located in the eastern China with lower elevation, more than 800 mm precipitation, rather than in the region with higher population density and economic development level.
中国流动人口地域类型的划分方法及空间分布特征
The influential factors and spatial distribution of floating population in China
中国流动人口的影响要素与空间分布
Changing patterns of the floating population in China, 2000-2010
Using data from the 2000 and 2010 Chinese Population Censuses and applying a consistent definition of migration, this paper examines changing patterns of China's floating population during 2000-2010. We find that during the first decade of the 21 century, there have been significant changes in China's floating population, as reflected in continuing rise of interprovincial floating population and the rise of the floating population in China's western and interior regions, geographic diversification of destinations for the floating population, a major increase in interprovincial return migration, and significant improvement in education and occupational profiles among the floating population. We argue that these patterns are driven by a combination of complex domestic and international factors, including the newly released Labor Law, removal of agricultural tax, the western China development program, increased investment in education by the Chinese government, and the global financial crisis. We also discuss several challenges facing the floating population in the coming years, which include equality of educational opportunity for migrant children and adequate housing and social welfare protection for the floating population. Finally, we reflect on the future of migration research in China.
The floating population and its effects on urbanization in cities above prefecture level in China
中国地级及以上城市人口流动对城镇化效应分析
Analysis of population movement and distribution based on sixth census
基于“六普”数据的我国人口流动与分布分析
Patterns of inter-provincial migration in China: Evidence from the sixth population census
我国省际流动人口的特征: 基于全国第六次人口普查数据
Spatio-temporal changes of population distribution at sub-district level in Jiangsu Province
DOI:10.13249/j.cnki.sgs.2015.011.1381
[本文引用: 1]
Since the reform and opening up, the large-scale migration in China has caused dramatic changes in population distribution, which has become a hot research field of human geography. Spatial pattern of population distribution has a typical character of scale dependency. Fine-scale estimation of the population distribution has been a huge challenge in the field of population geography. In China, sub-district is the finest administrative unit in official population census data. Thus, population density data at township level can be used to describe and characterize the population spatial pattern and changes elaborately, and support the optimized layout plan of Chinese population and government policy decision making. Sub-district boundaries across 13 cities in Jiangsu Province had been collected in this study. The national population census data were spatially joined to the boundary layer for population density calculation. Based on the fifth and sixth population censuses, using exploratory spatial data analysis, interpolation methods and semivariogram, the space differentiation and temporal variation of population density of all sub-districts in Jiangsu Province in 2000-2010 are explored, and further, the evolutionary mechanism of it is discussed. The results are reported as follows. In spatial distribution, the population density of Jiangsu Province was characterized by concave shaped structure, urban-rural dual structure, and core-periphery structure. Suzhou-Wuxi-Changzhou metropolitan area had the most widely dense population, and Nanjing City circle had the highest population density. In the evolution, the space differentiation of population density was becoming ever more obvious. Population density in the south of Jiangsu was generally increasing, but most towns’ population density was declining in the northern area. The variation of population density was presented spatial inequality. In evolutionary mechanism, spatial continuity and self-organization of population density have been intensified, and the spatial form of population density changed from decentralization in the initial stage to centralization. Additionally, the structural difference resulted from spatial association has become more and more obvious. The changes of population distribution were influenced mainly by policy and economic factors. First, regional strategies played a guiding role in the population distribution changes. Secondly, economic development reshaped the population distribution, and the population density had a significant positive correlation with economic density. Thirdly, location difference was the determinant. At last but not the least, physical geography difference had also affected the layout in a certain extent. This study expanded the research scale and dimension of the research in population geography research in China. The resulted population density dataset in 2000 and 2010 is expected to enrich the baseline data resources for population geography development in China.
基于镇域尺度的江苏省人口分布空间格局演变
China's different spatial patterns of population growth based on the "Hu Line"
DOI:10.1007/s11442-016-1347-3 URL [本文引用: 1]
Urbanization characteristics and spatial pattern of population in central cities of China in the 21st century
新时期我国中心城市人口城镇化特征及其空间格局
The population distribution and trend of urbanization pattern on two sides of Hu Huanyong population line: A tentative response to Premier Li Keqiang
DOI:10.11821/dlxb201602001
[本文引用: 3]
In November, 2014, Premier Li Keqiang raised a problem about Hu Huanyong population line (hereinafter referred to as "Hu line"), when visiting the exhibition of sciences of human settlements in National Museum of China, which was called "Premier's Question" by the press. Hence, Hu line has become a highlight currently, and aroused great controversy and different views. Aiming at such dilemma of cognition, this paper gives a general review of the origins of Hu line, which was put forward by the famous population geographer Hu Huanyong in 1935, under the background of a debate on the surplus of domestic population. Based on population census data and GIS platform, the paper analyzes the change of population scale, proportion and density in both southeast and northwest sides of Hu line. The results indicate that the population urbanization and migration do not change the pattern of population distribution determined by Hu line. On such basis, the pattern that the population density of southeast part is large, while that of northwest part is relatively small will not radically change over a longer period, and the pattern that urban agglomeration is mainly located in southeast part as well. The long-term existence of Hu line depends on integrated physical geographical conditions, like climate. At the meantime, this paper argues that the core issue of the Premier's concern is solvable, by positive policy guidance and reasonable spatial organization. It is definitely promising for western China to realize a higher level of modernization and a better quality of urbanization, and central region as well.
胡焕庸线两侧的人口分布与城镇化格局趋势: 尝试回答李克强总理之问
Research on the current situation of population mobility in China and its impact
当前我国人口流动形势及其影响研究
Multi-perspective observation and policy response to regional unbalanced development in China
对我国区域不平衡发展的多视角观察和政策应对
The talks on paper of the study of the spirit of the Fifth Plenary Session of the 19th Central Committee of the Communist Party of China
研究阐释党的十九届五中全会精神笔谈
Spatial evolution of population change in northeast China during 1992-2018
Spatial patterns of population mobility and determinants of inter-provincial migration in China
中国人口空间流动格局与省际流动影响因素研究
China's demographic transition
中国人口的迁移转变
Study on the stability of Hu Line and different spatial patterns of population growth on its both sides
DOI:10.11821/dlxb201504004
[本文引用: 3]
The Hu Line for population distribution in China has been regarded as one of the greatest geographical discoveries in China because it reveals the significant spatial characteristics of China's human-land relationship. Thus, the stability and significance for spatial development of Hu Line have become a major concern after the dramatic economic and social changes since China's reform and opening-up in 1978. With the support of GIS, this paper conducts a statistical analysis and systematic investigation on the stability and spatial patterns of population growth on both sides of Hu Line by constructing the spatial database of China's census data from 1982 to 2010 and initiating a new method for identifying the spatial patterns of population growth. The findings are as follows: (1) The Hu Line has been rather stable, while a new tendency of population change has emerged. On the whole, the ratio of population on both sides of Hu Line has roughly been kept at 94:6 (the southeastern side: the northwestern side) in the last 30 years. However, the proportion of population on the southeastern side of Hu Line has been slightly decreasing, while that on the northwestern side of Hu Line has been slightly increasing, which is benefited from its higher rate of natural population growth. (2) The spatial patterns of population growth on both sides of Hu Line were quite different. The agglomeration degree of population distribution on the southeastern side of Hu Line increased greater. The areas with negative population growth rate have rapidly expanded, mainly located south of the Qinling Mountains - Huaihe River line and the northeastern China, while the areas with the fast population growth rate concentrated in the areas such as the Yangtze River Delta, the Pearl River Delta and Beijing-Tianjin metropolitan region. Thus, the spatial pattern of population growth on the southeastern side of Hu Line presented an aggregating and diffusion mode of Matthew effect. (3) The spatial pattern of population growth on the northwestern side of Hu Line could be referred as the relative balance type. In this region, the positive rate of population growth and the lower agglomeration degree of population have been identified. There were lots of ethnic groups located on the northwestern side of Hu Line, and they generally lived dispersedly but with a higher rate of natural population growth due to preferential population policy. However, there were also some areas with negative rate of population growth on the northwestern side of Hu Line and they were mainly distributed close to the Hu Line and new Eurasia Land Bridge. (4) In the future, the spatial patterns of population growth on both sides of Hu Line will continue to change. On the southeastern side of Hu Line, the capacity of population agglomeration for those small and medium-sized cities and towns should be enhanced. As for the northwestern side of Hu Line, the emphasis should be placed on promoting its urbanization and enhancing the capacity of population agglomeration for major cities.
“胡焕庸线”的稳定性及其两侧人口集疏模式差异
Spatial pattern of population flow in China's typical outflow areas: A case study of the Sichuan-Chongqing area
中国典型人口流出地区人口流动格局: 以川渝地区为例
City administrative hierarchy, differential growth of city size and evolution of urban system in China
城市等级、人口增长差异与城镇体系演变
