

1 引言
健全的职业教育体系是保障中国制造业由大变强的人才根本,其资源的合理配置与布局优化是实施职业教育系统改革工程的重中之重。职业教育肩负着培养多样化技术型人才、促进青年就业和创业发展的职责,是提高劳动力生产效率、推动技能型社会建设和助力乡村振兴战略实施的重要途径[1]。其中,中等职业学校是指经政府有关部门依法批准设立,实施全日制中等学历教育的各类职业学校;高等职业院校包括专科和本科两个层次教育。据《中国教育统计年鉴》数据,截至2019年,职业教育院校约为1.15万所,中等职业教育占比约为87%,高等职业教育仅占比约13%,其实现了19大类1000多个专业的全覆盖,空间上广泛分布于全国2846个县。目前,中国已实现本科职业教育院校的破局,截至2022年已有32所本科院校遍布在20多个省份。2022年5月1日正式生效的修订版《中国职业教育法》重新诠释了职业教育的定位,提出了从“普职分流”到“协调发展”的发展理念,拓展了职业教育的发展前景,揭开了职业教育蓬勃发展的新篇章,也更加凸显了职业教育资源布局优化研究的重要性。
现代职业教育诞生于150多年前,是工业产业发展的产物[2]。中国现代职业教育经历了洋务运动时期的30多所洋务学堂,抗战时期形成“训练各种专门人才,以应对战争需要”的职业教育理念,到1949年中华人民共和国成立后建立“为国家大规模建设培养急需人才”的中专教育和技工教育体系,再到20世纪60年代推行“既是劳动制度,又是教育制度”的半工半读制,直至全面改革开放把发展职业教育作为经济社会发展重要基础的5个发展阶段[3]。随着社会经济快速发展,现阶段职业教育资源表现出空间分布不均衡、与区域产业结构不匹配、与市场需求技术人才脱节等突出问题,扩大了不同职业教育学校之间的水平差距,阻碍了职业教育体系的全面贯通完善。新时期中国经济增长动力已由劳动力数量红利向挖掘质量潜力转变[4],如何发展高质量的职业教育体系,优化其布局使之与社会经济发展需求匹配已成为教育地理学研究的重点议题[5]。
已有职业教育资源分布特征及影响因素研究表明,其空间分布与发展受经济、社会系统多维因素的影响[6]。地理和空间经济学者的研究证实了社会经济发展的转型和人口结构的改变塑造了中国职业教育空间的多样性和特殊性[7-8],明晰了职业教育资源的分布受国家政策、人口、经济、社会等因素的影响[9⇓-11],识别出职业教育资源分布与就业均衡[12]、地区生产力[13]、入学机会均等[14]、青少年人口占比[15]和区域企业密集度[16]等因素有关。然而,现有研究多为时间断面上、局部区域的研究认识,缺乏系统性、长时序数据支撑下对全国分等级职业教育资源空间分布特征及影响因素的定量化分析[17]。系统性地考虑不同因素对分等级职业教育资源分布的影响,进而对分级、分类职业教育资源空间布局进行优化的研究鲜有报道,因而无法全面回答中国分等级职业教育资源空间分布现状如何、哪些因素影响了不同等级职业教育资源的空间分布、在不同空间尺度上职业教育资源的分布是否均衡等一系列中国职业教育均衡化与高质量发展中亟待解决的关键科学问题。随着大数据技术和GIS空间分析方法的成熟,空间数据挖掘为分等级职业教育资源空间布局及影响机制的定量研究提供了数据和方法上的可能性和有力支撑。
当前教育资源均衡性测度的研究多集中于基础或者高等教育[18⇓⇓⇓⇓-23]。为数不多的对职业教育资源空间分布格局研究,重点关注于省级或大城市等中宏观尺度,识别出职业教育资源“东部高值集聚、中部随机分布、西部低值集聚”的空间分布特征[24⇓-26]。然而,省域内部的职业教育资源空间分布差异、同质化现象、结构不匹配、不同等级职业教育资源格局与区域产业发展错位等制约中国职业教育发展的关键问题仍有待深入研究。相关调查表明,高等职业教育持续就业能力相对较低,2016年特别是中国7000万产业工人中,只有1/3是技术工人,其中初级工占60%,中级工占35%,高级工仅为5%;而在德国,高级工的比例为35%~40%[27-28]。因而,厘清不同等级职业教育资源规模与空间分布是进一步优化职业教育结构、健全职业教育体系、加大就业政策扶持,助力职业教育高质量发展的重要内容。
鉴于此,本文首先利用大数据挖掘技术收集制备了中等与高等职业教育资源的类型、规模与空间分布等信息,与区县人口、产业、社会经济等数据进行了空间匹配,形成了一套分析县域尺度中国分等级职业教育资源与经济社会发展综合数据集;进而,在分析2000—2020年间中国职业教育资源时间演变特征和空间分布格局的基础上,利用空间计量经济模型解析了中国职业教育资源分布的影响因素;最后,定量分析了不同等级职业教育资源分布的均衡度和分产业的职业教育资源配备现状,凝练了促进中国职业教育均衡与高质量发展的布局优化建议。
2 数据与研究方法
2.1 数据处理
本文所采用中国职业教育资源信息主要来源于中国教育在线公共服务平台网站爬取的兴趣点(Point of Interest, POI)数据①(①参见:
2.2 研究方法
本文从“职业教育资源—经济社会”空间联动关系的角度出发,构建了涵盖“产业经济、劳动力结构、社会文化、职业教育资源”等多元要素的时空分布数据集。研究以区县单元的数据支撑,诊断职业教育资源空间分布特征及关键影响因素,解析中国职业教育资源均衡性的分布格局及其与区域产业及社会经济发展之间的耦合机制。
2.2.1 职业教育资源分布的影响因素分析
职业教育资源的分布与社会经济因素等密切相关,但也随着资源、人口和资本等生产资料或者消费产品的流动性而具有较强的空间溢出效应[29]。本文基于空间计量经济模型,解析了产业发展、人口结构、居民收入和贫富差距等因素对职业教育资源的影响,以及其影响的空间溢出效应。研究采用的一般空间计量模型公式如下:
式中:Y为区域内中等或高等职业教育资源的数量;W为空间权重矩阵,表示各区县的空间邻接关系;WY为因变量的空间滞后项,体现了邻接区域职业教育资源对本地的影响;WX为解释变量的空间滞后项,体现了邻接区域相关因素对当地职业教育资源的影响;Wμ体现了随机误差项的空间溢出效应。本文基于制备的县域尺度职业教育资源数据进行所有形式的空间计量模型的测试,并根据AIC指标和变量、参数的显著性从模型结果中遴选效果最佳的模型对职业教育资源分布的影响因素进行分析。
2.2.2 职业教育资源均衡度指数
职业教育与经济社会发展紧密相关,发展的不均衡和不充分为当前中国社会发展的主要矛盾。因此,诊断职业教育资源分布的均衡性,将在一定程度上促进经济社会的充分和均衡发展。本文借鉴均衡性测度的常用指标Theil指数计算和衡量全国不同地级市层次的均衡性和市域内不同区县间职业教育的均衡性。Theil指数最初是用来衡量收入差异的统计指标[30],后来被广泛地用于分析诸如能源消费和人口分布等社会经济指标的地区差异程度。职业教育资源分布的均衡度Theil指数定义为:
式中:ESN为中等或高等职业教育学校数量,Theil指数可以在不同的空间单元上进行计算。Theil指数具有良好的可分性。具体到本文而言,职业教育资源的Theil指数可以拆分成地级市尺度的市与市之间的差异(组间差异)和每个地级市内区县与区县间的差异(组内差异)两部分,并分别衡量这两部分差异分别对中国职业教育均衡度的贡献率。分解将采用以下形式:
式中:N为中国划分的地级市数,本文中取值为342;g(k)为对应地级市所下辖的区县。其中前半部分表征了地级市域内部区县间的不均衡性,后半部分表征了地级市之间的不均衡性,通过计算每个部分在Theil指数中的占比作为两部分对于整体不均衡性的贡献度。一般来说,Theil指数取值在0~∞之间,0表示均衡度最高,值越高表示越不均衡。
3 结果与分析
3.1 2000—2020年中国分级职业教育资源时空分布特征
就职业教育资源规模而言,中等职业学校数量保持绝对优势,中等职业教育资源约为高等职业教育院校数量的13倍(图1)。数据统计发现,2000—2020年中国职业教育发展总体呈现出高等职业教育学校数量持续快速增长,而中等职业教育学校持续减少的变化态势。然而,高等职业教育学校数量虽然少,但2020年其招生484万人,学校的平均招生规模为3250人/所;中等职业教育招生数量为645万人,学校的平均招生规模只有约650人/所;单从校均招生数量上两者相差4倍。究其原由,1999年中国高等教育改革,开始实施“扩招”政策,部分中等职业教育学校合并升格为高等职业院校,高等职业教育招生需求拉动其规模和数量扩大。而同时,受高等教育入学率提升的影响,普通高中规模扩大加大了对中等职业教育招生与就业的双重挤压。
图1
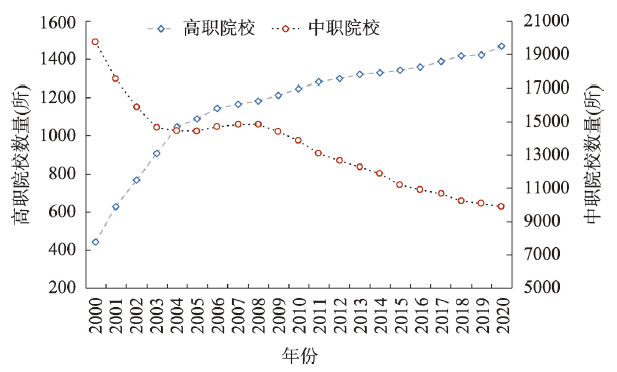
图1
2000—2020年中国职业教育院校数量变化情况
Fig. 1
Changes in the number of vocational schools in China during 2000-2020
2004年是高职院校和中职学校数量变化速率陡变的重要节点,自此,中职学校数量减少和高职院校数量增加的速率均有所放缓。2004年恰逢国家停止中等职业学校升格为高职或并入高等院校,高职院校也不再升格为本科院校;同时,高职院校的招生计划与就业状况实现硬性挂钩[31]。这些政策在一段时间内抑制了职业教育院校急速变化的趋势。此外,从办学类型来看,中等职业教育中公办类型的约占80%,民办类型约占20%;高等职业教育公办类型占86%,民办类型占14%。由此可见国家仍对职业教育办学发挥着主导作用。随着普通职业高中的资源整合和升级,部分中职学校升级为高等职业院校。特别是,近年来高等职业教育招生规模扩招超过了100万人/年,使得高等职业教育资源数量随之呈持续增长趋势。然而,虽然职业教育的年招生规模超过千万,中国的产业工人中的技术型人才却不到2000多万。职业教育毕业生的专业对口就业水平相对较差。究其原因,用人单位“人才高消费”的现象“高烧不退”,社会对高职教育认同度相对较低等因素一定程度上抑制了中国产业工人整体素质提升的速度。
省级尺度上,高等职业院校数量最多的省份是江苏、广东与河南,而西藏与青海的数量较少。市级尺度上,主要分布在省会城市和经济发达城市,省会城市职业院校数量约占据总数的1/3。高等职业院校发展趋势与中职学校变化趋势不同,各省份高等职业院校数量普遍在增加或维持不变,其中四川(+19)②(②括号内数值和符号代表增加(+)或减少(-)的职业院校的数量。)、贵州(+17)、新疆(+13)、云南(+11)增加幅度最大,均超过10所,而仅上海(-7)、福建(-4)的高职院校有数量上的略微减少。中等职业教育资源普遍处于大幅衰减的状态,各省份中等职业教育院校数量普遍降低,与全国中等职业教育资源变化趋势大致相同。黑龙江(-154)、河南(-142)、安徽(-135)、山东(-134)、江西(-102)、山西(-102)等省份的中等职业教育资源数量减幅最大,在统计时段内各省减少均超过了100所。然而,西部地区(西藏、新疆、云南、重庆)以及中小企业数量庞大的浙江省的中等职业教育资源与全国趋势不同,处于增长态势。
基于空间热点分析方法,研究揭示了区县尺度上中职与高职院校聚集度空间特征。结果表明,职业教育资源在不同空间尺度上均呈现出“胡焕庸线”以东错落聚集,以西稀疏分散的分布格局与空间集聚特征(图2)。华中、华东、华南、与华北南部地区为热点区,职业教育资源数量较多且分布密集;受西部地区人口相对稀疏的影响,西北、东北和西南地区为职业教育的冷点区。对比来看,高等职业教育主要聚集于京津冀地区和长三角地区,空间分布总体上主要呈现以省会城市、直辖市等次省级及以上城市为聚集中心逐渐向外扩散的趋势,并且形成“京津冀”“长三角”重点城市群的团状分布(图2a)。中等职业教育资源聚集区除了高等职业教育聚集的区域外,川渝地区的聚集性也较高,且与人口聚集状态较为一致,呈现“东聚西疏”的空间格局(图2b)。因此,西部地区需借鉴东部职业教育发展经验,因地制宜地根据当地人口结构和产业发展特点、针对性地制定职业教育发展规划。同时,政府需加大力度协同东部地区的优秀职业教育院校与西北地区院校进行合作办学,畅通跨区域招生与就业渠道,促进职业教育的均衡发展。
图2
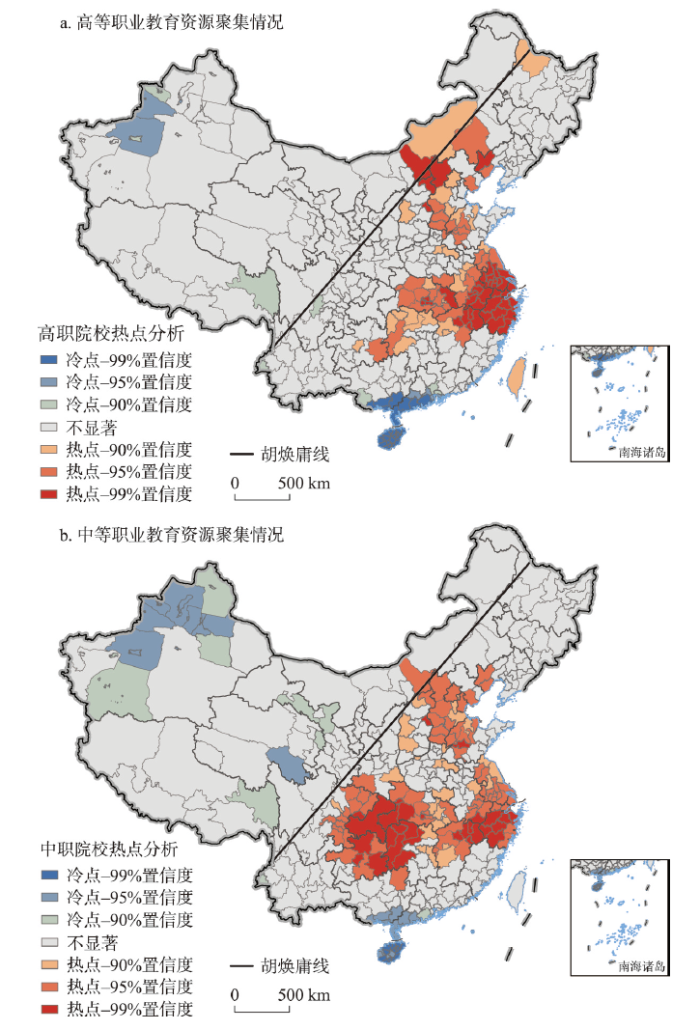
图2
2020年中国高等与中等职业教育资源聚集情况
注:基于自然资源部标准地图服务网站GS(2016)1594号标准地图制作,底图边界无修改。
Fig. 2
Aggregation of resources for higher (a) and middle (b) vocational education in China in 2020
3.2 职业教育资源空间分布的影响因素分析
研究利用空间计量模型诊断了地级市尺度上职业教育资源分布的影响因素。结果表明,考虑空间误差效应(SEM)、空间滞后效应(SAR)以及同时考虑空间误差和滞后效应(SAC)的空间计量模型所得结果具有较高的相似性和稳健性(表1),仅优化的SAC模型结果中λ的p值小于0.01,具有较高显著性,由此说明了误差项中存在空间溢出效应,即误差中存在同时对该市及其周边地区职业教育发展的共同影响因素,这也进一步印证了使用空间计量模型的合理性和必要性。模型结果中总人口的系数在中职与高职教育模型结果分别为0.10和0.08,且p值都小于0.01,说明城市每增加10万人,中、高职院校需增加1所。该结果表明当地人口基数是影响职业教育院校数量的重要因素,区域人口基数越大,入学需求也就越大,对职业教育资源的需求也会随之增加。然而,人口对中等职业教育资源的影响比对高等教育的影响更大,也就是说,中等职业教育资源分布更加具有地域锁定的特点。模型还合乎常理地识别出15岁以下人口数量对中职学校数量起到显著正的促进作用,中职教育模型结果中该变量系数为0.04,p值小于0.05,但对高职院校数量的影响结果不显著,说明15岁以下人口每增加100万人,中职学校增加4所。而人口密度、GDP总量与职业教育之间呈现显著负相关关系,在中、高职教育模型结果中,人口密度系数分别-0.01和-0.0008,GDP系数分别为-0.1和-0.12,结果均具有较高显著性。结果表明,人口与经济的聚集发展导致了教育资源的相对集中,降低了数量,提高了利用效率。同时,人口密度与GDP总量高的城市经济活力和聚集人口的能力强,这类城市所占有的优质教育资源(如高中、高等教育资源)也相对丰富,这种更加富裕的生活使得对于普通高中而非中职学校、高等教育而非高职院校有更多的选择机会和更强的选择倾向[32]。也进一步印证了“普职分流”带来城镇居民焦虑增加的原因。与之不同的是,当采用体现公平的人均GDP之后,对职业教育的发展起到了显著的促进作用,虽然这种影响的程度并不大。这也反映出经济发展水平对职业教育布局影响极具复杂性[33]。
表1 高等与中等职业教育资源影响因素分析
Tab. 1
| 变量 | 中职教育 | 高职教育 | |||||||||
|---|---|---|---|---|---|---|---|---|---|---|---|
| OLS | SAR | SEM | SAC | SAC(优化) | OLS | SAR | SEM | SAC | SAC(优化) | ||
| 截距 | -6.98 | -10.74 | -16.45 | -12.82 | -21.47*** | 2.46 | 3.38 | -6.17 | -4.84 | 14.78*** | |
| 总人口(万人) | 0.1070*** | 0.1050*** | 0.1045*** | 0.1042*** | 0.1048*** | 0.0694*** | 0.0677*** | 0.0674*** | 0.0677*** | 0.0768*** | |
| 人口密度(人/km2) | -0.0125*** | -0.0122*** | -0.011*** | -0.0103*** | -0.0107 | -0.0084*** | -0.0078*** | -0.0071*** | -0.0067*** | -0.0008*** | |
| 15岁以下人口(万人) | 0.0431** | 0.0415** | 0.0451** | 0.0446** | 0.0437** | 0.0084 | 0.0087 | 0.0097 | 0.0089 | ||
| 人均GDP(元/人) | 0.0001*** | 0.0001*** | 0.0001*** | 0.0001*** | 0.0001*** | 0.0001*** | 0.0001*** | 0.0001*** | 0.0001*** | 0.0001*** | |
| GDP | -0.1098*** | -0.1050*** | -0.1038*** | -0.1056*** | -0.1043*** | -0.1122*** | -0.1084*** | -0.1065*** | -0.1075*** | -0.1209*** | |
| 第二产业(亿元) | 0.0011*** | 0.0010*** | 0.0010*** | 0.0010*** | 0.0010*** | 0.0011*** | 0.0011*** | 0.0010*** | 0.0010*** | 0.0011*** | |
| 第三产业(亿元) | 0.0011*** | 0.0010*** | 0.0010*** | 0.0010*** | 0.0010*** | 0.0012*** | 0.0011*** | 0.0011*** | 0.0011*** | 0.0012*** | |
| 二产占比 | -0.1906 | -0.1753 | -0.0903 | -0.0937 | -0.2164 | -0.2068 | -0.1180 | -0.0980 | -0.2980*** | ||
| 三产占比 | 0.2315 | 0.2608 | 0.3327 | 0.3087 | 0.4070*** | 0.1336 | 0.1489 | 0.2254. | 0.2241. | ||
| 第二产业企业数量(个) | -0.00004 | -0.00005 | 0.00007 | 0.0001 | 0.0003* | 0.0003** | 0.0003*** | 0.0004*** | 0.0004*** | ||
| 第三产业企业数量(个) | -0.00002 | -0.00002 | -0.00004 | -0.00004 | -0.0002*** | -0.0002*** | -0.0002*** | -0.0003*** | -0.0003*** | ||
| 0.0911 | -0.1045 | -0.0094 | 0.0778 | -0.1453 | -0.1509 | ||||||
| 0.3692*** | 0.4378 | 0.4277*** | 0.2636 | 0.3816*** | 0.3629*** | ||||||
| AIC | 2135 | 2135 | 2116 | 2115 | 2110 | 2012 | 2013 | 2004 | 2003 | 2001 | |
| R2 | 0.725 | 0.67 | |||||||||
| Wald statistic | 2.6294 | 22.528*** | 1.6587 | 11.21*** | |||||||
| LR test | 23.94*** | 24.971*** | 12.933*** | 10.97*** | |||||||
注:*、**、***分别代表p < 0.1、p < 0.05、p < 0.01。
其他经济变量方面,第二、三产业产值对中等与高等职业教育数量均有显著的正向影响,其中二产产值系数在中职与高职教育模型结果分别为0.001和0.0011,三产产值系数在中职与高职教育模型结果分别为0.001和0.0012,p值均小于0.01,结果均具有较高显著性。同时也说明,第二或第三产业产值每增加100亿元,则需要增加1所中、高职院校。原因在于第三产业的发展会为社会提供更多的新兴岗位,从而促进社会对口职业教育资源的需求;且第二产业以工业制造业为主,在中国大部分城市占据主导作用,对具有职业技能的劳动力需求巨大。相比之下,第一产业产值以及产业结构变量与职业院校资源分布的关系较弱(在变量筛选中被剔除掉),这是因为农牧业等第一产业行业劳动力的经验知识相对缺乏标准化的体系,通过全面的职业教育实现知识传播存在一定的困难。然而,面向中国农业转型发展的迫切需求和未来农业产业化、标准化的发展需求,构建与完善农牧业职业教育体系、培育理论技术并重且适应本地农业生产的新型职业农民对于促进中国农牧业可持续发展意义重大。
更为有意思的是,第二、三产业企业数量对中等职业教育数量无显著影响,却对高等职业院校数量的影响较大。其中第二、三产业企业数量系数在高职教育模型结果中分别为0.0004和-0.0003,p值均小于0.01,结果具有较高显著性,说明每万个二产或三产企业则可支撑3~4所高等职业学校。在第二、三产业产值一定的情况下,企业数量实质上也侧面反映出企业规模,这说明中职学校对于企业的规模不敏感,不管大中小型二三产企业,对于中职学校的发展而言没有显著差别。而对于高等职业教育而言,因第二产业工业企业所需的主要为技术型人才,具有较大的不可替代性,因而企业数量多意味着所需要的工种丰富度高,对应的高等职业教育学校的需求也就旺盛。第三产业企业所需要的服务型人才,虽也具有一定的技能性,但也有相当大的部分具有一定程度的普适性(如管理、政法等),因而并非三产企业数量越多越有吸引力,反而是企业规模越大,对职业教育的需求量越有正向的刺激作用。
3.3 职业教育资源均衡度分析
从表征的职业教育均衡度的Theil指数来看,中等职业教育均衡度优于高等职业教育(图3)。中等职业教育资源不均衡性在地级市间和地级市内部相差不大,贡献度分别为0.48和0.52;这说明中职教育资源在空间分布上具有较好的普遍性和下沉性,不管是在市一级,还是县一级,均是中职教育资源的栖息地。而高等职业教育的不均衡性主要来源于地级市内部各区县上的不均衡性,其贡献度为0.85,这说明同一地级市不同区县内的高等职业教育学校分布极不平衡,与高等职业教育资源相对较少且分布具有明显偏好的特征相一致。
图3
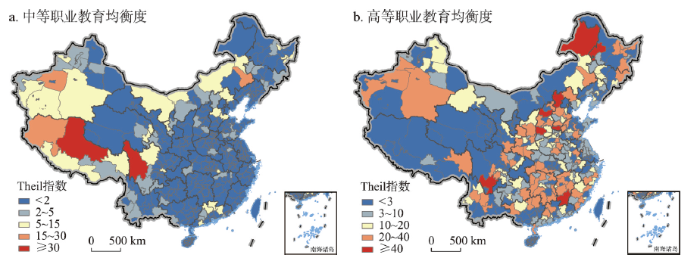
图3
2020年中国中等与高等职业教育资源均衡度Theil指数分布
注:基于自然资源部标准地图服务网站GS(2016)1594号标准地图制作,底图边界无修改。
Fig. 3
Middle and higher vocational education development index and spatial equilibrium distribution in China in 2020
Theil指数的计算结果还表明,中职教育资源则在“胡焕庸线”东侧的均衡性指数值普遍低于2,相对比较均衡,而西侧不均衡性较高。在中职教育资源数量相对丰富的情况下,造成这种东西不均衡的主要原因是东部的区域经济发展水平、人口集聚度高于西部地区。与之不同的是,高等职业教育在“胡焕庸线”以东的均衡性指数值普遍大于10,相对不均衡(图3)。原因主要来自于局部资源聚集性,使得发达的东部地区内中心城市和城市核心区优先占据了更多的产业。产业快速发展对于技术和服务型劳动力的需求拉动了职业教育的发展,进而导致了东部区域内高等职业教育发展的不均衡。鉴于对中、高等职业教育资源分布的均衡性定量分析,建议西部区域整体加强中等职业教育资源建设,而东部区域加大对高等职业教育资源的合理配置。事实上,社会经济发展的转型和人口结构的改变塑造了教育空间的多样性和特殊性。从经济发展的角度来看,更优质的职业教育资源可以提供更优质的高技能劳动力,从而促进当地经济的发展;同样的,经济的发展会带来更多的地方资金支持职业教育的发展,同时也会提供更多的就业岗位,为职业教育注入新的动力。因而,在职业教育资源配置时,应正视东西部地区的发展阶段,注重东西部地区的产业对接,针对性地部署与统筹职业教育资源,建立发展有序、布局合理的中国职业教育发展体系。除此之外,国家需要对职业教育体系制度进行改革与创新,通过完善职业教育体系地方分权体制,推动中央职业教育规划统筹规划机制,提高地方政府对职业教育资源规划独立性,提升地方政府职业教育办学积极性,更好地促进区域产业与职业教育的协调发展。
研究进一步探究职业教育资源分类型分布特征。统计发现,理工和技工职业类学校数量相对较多。这两种类型学校在省尺度上,湖南最多,其次是黑龙江、湖北、安徽、河南、河北。从职业教育学校类型广泛性看,广东拥有职业院校的类别最为丰富,18类专业类型的职校均有分布。而西藏拥有的职业院校的类型最少。分级来看,中等职业教育院校类型在省尺度上相对比较均衡,而高等职业教育院校类型在省尺度上的均衡性较差。高等职业教育在纺织、管理、环境、食品、外事类型上的省域差异明显。中等职业教育在纺织、环境、食品与特殊教育类型上的省域差异相对明显。纺织类高等职业学校浙江和江苏最多,中等职业学校在江苏、广东两省分布最多,这与纺织类企业在浙江、江苏、广东的集中分布较具有匹配性。环境类高等职业学校主要分布在湖南、江苏和甘肃,中等职业学校主要分布在上海、湖南和广东。从中职到高职的专业深造便利程度上,湖南更具有便利性。食品类专业中等职业学校在广东省分布较多,而高等职业院校在广东、江苏和山东的分布较多,从专业深造便利程度上,广东具有优势。外事类专业高等职业院校在湖北、河南、甘肃和福建分布较多,中职相对均衡(图4)。总体来看,职校数量与区域经济发展水平息息相关,尤其是第二、三产业的发展水平。同时,各类型职业教育资源分布不均衡,但与各区域的强势产业密切相关。例如东南沿海地区的第二、三产业高度集中,工业化水平高,对于技能型人才的需求也较多,技术型职业教育发展也相对成熟。而西北内陆地区,产业结构相对单一,农业以及资源依赖型产业较多,因此对于技能型人才的需求也相对较少[34]。因此,职业教育的发展也应因地制宜、根据各地的发展定位、优势产业、文化氛围、应用需求等,产教结合,提供对口的高素质、高技能劳动力。
图4
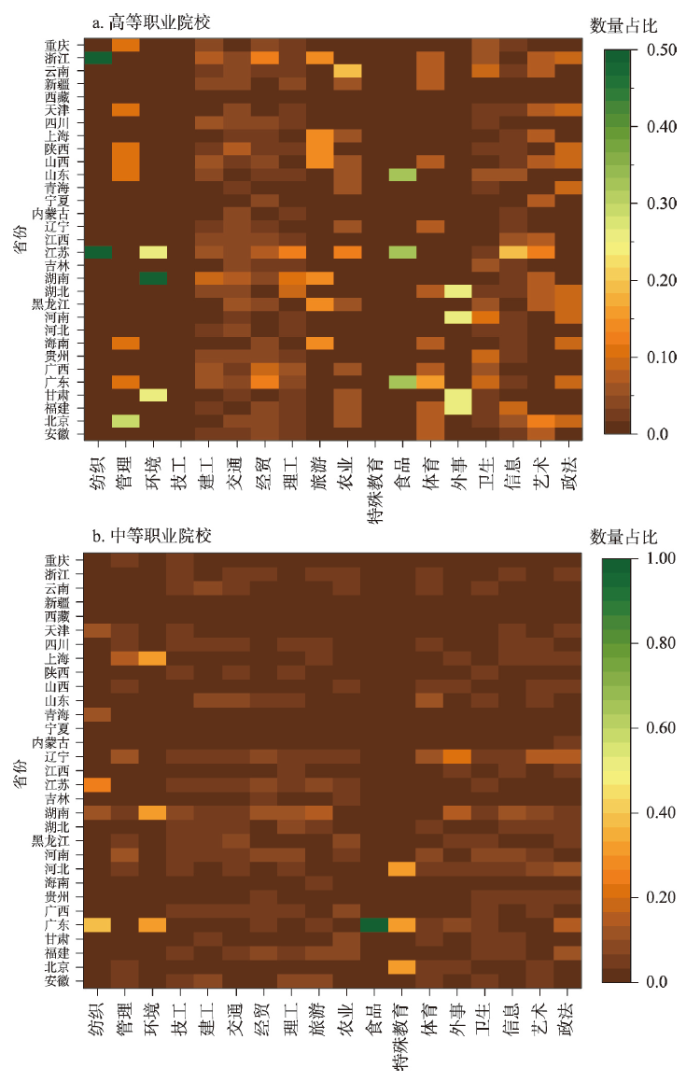
图4
中国各省高等与中等职业院校分类型数量占比
Fig. 4
Distribution of higher (a) and middle (b)vocational schools in each category by province and as percentages
4 结论与讨论
4.1 结论
本文基于网络大数据和统计数据,分析了中国中等与高等职业教育资源的空间分布特征和动态演变趋势,并基于空间计量经济模型解析了产业发展、经济水平、人口结构等因素对中高等职业教育资源分布的影响。总体来看,中等职业教育资源基数大,但呈逐年衰减状态;高等职业教育资源基数小,但呈逐年增长态势。职业教育年均毕业生近千万,专业对口的持续就业水平直接影响了职业教育的发展,产业工人中的技术型人才仅有2000多万。加强中高职业教育的专业衔接增强就业能力和水平成为关键。从职业教育资源的地域性来看,中等职业教育资源的均衡性高于高等职业教育资源。中等职业教育资源的空间分布情况与区域人口总量,尤其是15岁以下人口数量高度相关,而高等职业教育资源的空间分布与区域经济发展水平紧密相关。从空间均衡性来看,中职教育资源则在“胡焕庸线”东侧的均衡性指数值普遍低于2,相对比较均衡,而西侧不均衡性较高;高等职业教育在“胡焕庸线”以东的均衡性指数值普遍大于10,相对不均衡。职业教育涵盖的中职、高职、在职以及继续教育培训等多元教育培养层次,是推进县城城镇化劳动力素质提升与产业振兴的重要途径。2022年新修订的《中国职业教育法》通过立法,着力确保职业教育与普通教育具有同样重要的地位,实现职业教育与普通教育的衔接融通和前后贯通。未来中国职业教育的发展应在正视目前职业教育资源空间分布差异的前提下,根据地方和周边经济发展、产业和人才需求,优化分级、分类职业教育资源的配置。东部市域不均衡区合理调控高职院校资源配置,西部地区不均衡县域加大中等职业教育资源投入,实现跨区协同合作,全面深入发展与区域及周边产业相协同的各类别职业教育院校;依托高等职业院校资源聚集的城市群,带动周边县域专业相衔接的中等职业院校发展,持续提升其社会认可度,助力乡村振兴与新型城镇化建设。
4.2 讨论
综合考虑中、高等职业教育资源分布与其影响因素的均衡性,仍需分级优化职业教育资源的分布、中高职衔接机制。中国的产业结构空间分布差异显著,高等职业教育资源规划中需在考虑区域产业技术水平与用人需求情况的同时,考虑其影响经济发展的滞后性,以及产业发展的未来趋势[35],未来优化的空间仍是产业增长潜力大、城镇化建设和乡村振兴推进的国家重点扶持区县。同时,依据就业缺口和劳动力供应结构,结合区域经济发展水平与资本集聚能力的客观差距,中西部地区应当发挥地域内的比较优势,加强城市群的带动与协同合作,使职业教育政策的空间溢出正效应发挥积极作用,进而优化均衡性较差区域的高等职业教育资源。然而,对于中等职业教育均衡性较差区域而言,建议依托市域、周边区域或者东部高等职业教育资源,发展专业衔接好与就业途径宽的县域中等职业教育,切实提升入学或就业率。通过人口结构匹配度调整改造或兼并重组定位不明确、办学质量低、服务能力弱的中等职业学校。鼓励优质学校通过兼并末位学校、与企业或模范学校合作办学等形式整合办学资源,根据就业缺口和人口变化趋势规划当地中等职业教育资源的投入。本文在校级尺度上职校师资、办学模式、跨省市招生及就业政策等影响职校质量的指标还较欠缺,后续持续收集完善,但职业教育资源的区域特征、影响因素和均衡性研究对职业教育资源优化布局仍具有一定的启示意义,可服务于中国职业教育的高质量发展规划与资源优化配置。
参考文献
Vocational education: Supply-side structural reform
职业教育: 供给侧结构性改革
From a country with the biggest vocational education scale towards a country with the most developed vocational education:Research report of China vocational education 2030
从职教大国迈向职教强国:中国职业教育2030研究报告
Vocational undergraduate education: The value of the times and the choice of strategies
职业本科教育: 时代价值与策略选择
Research on the new mechanism of China's economic growth momentum
我国经济增长动力转换的新机制研究
Optimize the type orientation of vocational education and accelerate the establishment of modern vocational education system
优化类型定位加快构建现代职业教育体系
Vocational education and training: An engine for economic growth and a vehicle for social inclusion?
DOI:10.1111/j.1468-2419.2010.00357.x URL [本文引用: 1]
Progress in geographies of education: Literature review and local reflections
DOI:10.13249/j.cnki.sgs.2019.12.012
[本文引用: 1]

Influenced by the development of Marxist geography and social and cultural geography in the past two decades, geographies of education, which focus on the connections between educational space and social structures with a multi-dimensional perspective, have become one of the most fast-growing research fields within human geography in the west. This paper focuses on its definition, approaches and topics in the existing literature on geographies of education, sorting out the current research from two aspects: political-economic perspective and social-cultural perspective. The findings of this paper include: 1) geographies of education is a relatively new but fast-growing sub-field of human geography; 2) its process of knowledge production is mainly based on the western social contexts; 3) few research has focused on the educational phenomenon in non-western social contexts, and China in particular. This research argues that China -one of the biggest and most diverse educational systems in the world-has great potential of contributing to the current western-dominant geographies of education, especially given that the social and economic transformations in China has led to significant changes to its educational spaces.
西方教育地理学研究评述与本土反思
DOI:10.13249/j.cnki.sgs.2019.12.012
[本文引用: 1]
近20 a来,西方教育地理学受马克思主义地理学以及社会文化地理学思想的影响,重新审视教育空间与社会结构的关联,从多维度进一步认识教育空间建构过程中的政治经济与社会文化机制。对西方教育地理学的产生和发展演变进行分析,并尝试从政治经济和社会文化两大视角,总结和归纳当前西方教育地理学研究的主要成果和内容。教育地理学是一门新兴而又发展迅猛的人文地理学分支,但该学科的理论和实证发展尚处于以西方为主导的阶段,强势的西方话语体系还未充分涉及和理解非西方国家背景下的教育现象。当前是非西方国家建构自身教育地理学理论特色,并与西方教育地理学研究展开理论和实践对话的重要机遇和窗口。中国拥有世界规模最大的教育群体,当前社会经济发展的转型和人口结构的改变也进一步塑造了教育空间的多样性和特殊性。总之,加深教育与空间关系的研究,增强教育地理学研究的中西对话,构建中国化的教育地理学研究体系,使教育空间成为考察中国社会经济转型的重要视角,是中国教育地理学研究未来应努力的方向。
The re-examination of human geography research and the research methods in the context of big data
大数据背景下国内人文地理研究进展与方法审视
Education spaces: Embodied dimensions and dynamics
The basis and context of balanced regional vocational education development
区域职业教育均衡发展的基础与背景
Cultural geographies of education
DOI:10.1177/1474474015612717 URL [本文引用: 1]
Thinking through education: The geographies of contemporary educational restructuring
DOI:10.1177/0309132508093475 URL [本文引用: 1]
Research on the relationship between spatial distribution of higher vocational education and productivity level in China
我国高等职业教育空间分布与生产力发展水平的关系研究
Research on supply-side reform of vocational education based on industrial transformation and upgrading
基于产业转型升级的职业教育供给侧改革研究
Developing China's workforce skill taxonomy reveals extent of labor market polarization
Spatial distribution of higher vocational colleges in China: Form, motivation and optimization
我国高职院校空间布局: 形态、动因与优化
Geo-spatial analyses in education research: The critical challenge and methodological possibilities
DOI:10.1111/1745-5871.12188 URL [本文引用: 1]
Reform and development of vocational education in China: Experiences and rules
中国职业教育发展与改革: 经验与规律
A review of research on the distribution of basic education resources in China
DOI:10.18306/dlkxjz.2017.05.004
[本文引用: 1]
Unequal allocation of resources is the core problem in the development of China's basic education system, spatially reflected as uneven distributions. Spatial allocation of basic education resources, which is closely related to people's livelihood, social justice, and healthy urbanization of China, has become the research hotspot of many disciplines such as education, economics, sociology, geography, and urban planning. In order to promote research development and application of the subject, this article reviews the development of Chinese research on the distribution of basic education resources and divides it into three stages: exploration stage, deepening stage, and rapid expansion stage. It summarizes the achievements and analyzes the deficiencies of the four major research contents with regard to basic education resources distribution: the characteristics of layout and change in regions and urban and rural areas; the supply and demand factors that influence distribution, including the distribution of school-age population, technical standards of planning, ability and principles of local government's resource allocation that are controlled by education financing system and education policies; the standards and methods of evaluation for spatial equilibrium based on efficiency and fairness; and the effects on population mobility, residential differentiation, and traffic structure change in urban and rural areas. Over the past decade, Chinese studies on the distribution of basic education resources have made great progress, especially in improving models of accessibility analysis and measuring and evaluating resource distribution. However, some problems still exist. Disciplinary integration is inadequate. The current research on spatial features, whose main function is to serve for layout evaluation, lacks analysis on structure and modes. Mechanism investigation based on local characteristics is insufficient. Above all, interdisciplinary methods and techniques should be used in future studies. Long-term follow-up research and systematic analysis based on case studies, political and economic background and influence, regular patterns of spatial structure and change, and the formation mechanism for spatial change by multi-factor integrated impact should receive more attention in studies on resource distribution of basic education.
中国基础教育资源布局研究述评
DOI:10.18306/dlkxjz.2017.05.004
[本文引用: 1]
资源配置不均是当前中国基础教育发展面临的核心问题,反映在空间上则为资源布局不均。在新型城镇化建设阶段,基础教育资源空间布局作为关乎民生与社会公正的重要议题,成为教育、经济、社会、地理、城乡规划等多学科共同关注的研究热点。本文梳理中国基础教育资源布局研究发展脉络,将其分为探索期、深化期、快速拓展期3个阶段;对基础教育资源布局的空间特征与演化趋势,需求与供给方影响要素,均衡性评价标准与方法,以及对城乡空间发展影响等主要研究领域进行综述;指出现有研究在基于可达性分析的基础教育资源布局评价模型引介与优化方面成果丰富,但总体仍存在学科融合不足、研究体系不完整等问题;并鉴于此,提出今后应在结合教育发展规律分析基础教育资源空间布局模式与演化规律、多学科融合探索基础教育资源空间布局生成机制、关注地方特色对案例区长期系统追踪等方面深入研究。
Analysis of the spatial structure, mechanism and social-political effects of the high-quality basic educational resources in China
DOI:10.11821/dlxb202002008
[本文引用: 1]
Education is not only important for strengthening a country's population quality and comprehensive power but key in reshaping the "man-land" relations in a country. This article reviews studies on the distribution of educational resources in both Chinese and Anglophone literature and summarizes the research gaps in the Chinese literature, which include but are not limited to the downplay of the analysis of mechanism and comprehensive effects of the spatial structure of educational resources. Employing different map-making technologies and mechanism-analysis methods, this article dives into three findings. First, though spatial features are slightly different between primary school level and middle school level, eastern regions generally have higher quality educational resources than western regions. In addition, urban agglomeration, including Beijing-Tianjin-Hebei, Shanghai-Ningbo-Hangzhou, and the Pearl River Delta, have an advantage in attracting and cultivating high-quality educational resources. Second, the quantity of high-quality primary school resources is positively correlated with annual per capita disposable income of urban households and number of full-time primary school teachers. The quantity of high-quality middle school resources is positively correlated with the comprehensive economic and social performance of the city. Third, when affected by multiple mechanisms, the spatial structure of China's high-quality educational resources is dynamic and deeply intertwines with the interrelations between cities as well as between the societies within each city. This article contributes both to the understanding of the unequal spatial structure of high-quality educational resources in China and to the analysis of complex socio-political effects on this transforming structure. Its findings encourage further research on the connection between the spatial structure of a region's educational resources and its cooperation and geopolitics as well as on the resulting social mobility among different social strata. Study limitations include: place-related elements, such as local political resources, were not sufficiently considered when selecting factors; there is a lack of longitudinal analysis; and not enough attention is paid to the combination of number-based data and geo-information-based data in analyses.
中国优质基础教育资源空间格局形成机制及综合效应
DOI:10.11821/dlxb202002008
[本文引用: 1]
教育关乎一个国家人口素质的提升和综合实力的发展,也是塑造国家和地区人地关系的重要因素。通过回顾并反思中西方人文地理学视角下的教育资源配置研究,总结当前中国相关研究的不足。借鉴当前西方教育资源空间格局研究中所采取的“资源格局—影响机制—社会效应”的主流路径,本文利用多种空间分析和机制研究方法,对中国优质基础教育资源空间格局、形成机制和综合效应进行了分析。研究发现:① 优质小学基础教育资源和优质中学教育资源的区域格局和强度虽各有差异,但都体现出不平衡的发展特征,特别是在区域尺度上,体现出明显的东西部差异。此外,中国几大城市群,如京津冀,沪宁杭,珠三角,武汉都市圈以及成渝都市圈等,是优质基础教育资源的优势区域;② 优质小学教育资源的形成和规模增长与城市居民经济自由度以及城市专任教师规模两个因素高度相关;优质中学教育资源的形成和规模增长和城市本底经济社会发展水平因素高度相关;③ 在多元相关机制作用下,中国优质教育资源空间结构在当下及未来必定处于复杂动态变化之中,并将更为深刻地塑造着城市与城市、城市与社会之间的互动关系。本文有助于理解中国优质教育资源空间结构不平衡的现状,同时反思和探索教育资源结构所蕴含和产生的政治意义和社会影响。
Analysis on the spacial difference of vocational education institutions in Henan province
河南职业教育空间差异分析
An analysis of education inequality in China
DOI:10.1016/j.ijedudev.2014.03.002 URL [本文引用: 1]
The multidimensional problems of educational inequality require multidimensional solutions
The spatial distribution and balanced development of the secondary vocational education in five provinces of southwest China
我国西南地区中等职业教育的空间分布与均衡发展
The status quo and development strategies of vocational education for ethnic minorities in Yunnan province
云南民族职业教育发展的时空格局与对策
Spatial differentiation of the development level of secondary vocational education in China and its analysis
我国中等职业教育发展水平的空间分异及解析
Inherent logic and necessary choice of the development of professional adaptability in vocational education
职业教育专业适应性发展的内在逻辑与应然选择
Three worlds of vocational education: Specialized and general craftsmanship in France, Germany, and The Netherlands
DOI:10.1093/esr/jcaa025 URL [本文引用: 1]
Ensuring quality assurance in vocational education
DOI:10.19030/cier.v6i4.8112 URL [本文引用: 1]
The retrospect and the prospect of the development of VET discipline in the past 40 years of reform and opening-up
改革开放40年职业技术教育学科发展的回顾与思考
The spatial distribution of China's higher education resources and its effect on regional economic growth
我国高等教育资源的空间分布及其对地区经济增长的影响
Evaluating systems reform in vocational education and training:learning from Danish and Dutch cases
The coordinated development of vocational education and industry and its strategies
职业教育与产业协同发展及其策略
Spatio-temporal patterns of urban land use efficiency in the Yangtze River Economic Zone during 2005-2014
DOI:10.11821/dlxb201807005
[本文引用: 1]
How to obtain the greatest social and economic benefits with the least input of urban land resources is the center of regional ecological civilization construction. Based on municipal input-output data from 2005-2014, we introduce the SFA (stochastic frontier analysis) to measure the urban land use efficiency of 110 cities located in the Yangtze River Economic Zone, and then analyze the spatial association characteristics of the efficiency. The results show that: (1) Urban land use efficiency in the Yangtze River Economic Zone increases from 0.344 to 0.53 during 2005-2014, showing a significant growth trend with a cumulative growth rate of 54.07%. The efficiency growth rate of cities in the upper reaches of the Yangtze River is faster than that of cities in the middle and lower reaches. There is great growth potential across the whole area. (2) The urban land use efficiency shows a "bar-like" distribution across the whole area, which gradually decreases from the east to the west. Not only does it present great differences within each province, but also the inter-provincial differences and differences among the upper, middle and lower reaches are extremely evident. The total land use efficiency of cities in the lower reaches is the highest, followed by cities in the middle reaches and cities in the upper reaches. (3) The Moran's I of the study area is above 0 and increases year on year, which indicates that the land use efficiency among cities has positive spatial correlation, and the agglomeration level is enhanced. The LISA (local indicators of spatial association) reveals the characteristics of "small agglomeration and large dispersion". The High-High agglomeration area spreads outward along Zhejiang and Shanghai, while the areas with a Low-Low agglomeration pattern are mainly concentrated in northern Anhui province and northern Sichuan province. To sum up, the research framework and results are of great significance to sustainable land resource use and regional coordinated development.
2005—2014年长江经济带城市土地利用效率时空格局特征
DOI:10.11821/dlxb201807005
[本文引用: 1]
如何以最小的城市土地资源投入获得最大的社会经济效益是区域生态文明建设关注的重点之一。以长江经济带110个地级市为研究对象,基于2005-2014年的市级投入产出面板数据,引入随机前沿模型(Stochastic Frontier Analysis,SFA)测度城市土地利用效率,并对其空间关联特征进行分析。结果表明:① 2005-2014年长江经济带城市土地利用效率由0.344升至0.53,累计提升率为54.07%,呈现明显的增长趋势,上游效率增长速率快于中游和下游,全域土地利用效率仍有较大上升潜力;② 城市土地利用效率呈现“条块状”分布特征,从东向西逐步递减,不仅省内、省际差异显著,上中下游的差异也较大,下游地区土地利用效率最高、中游次之、上游最低;③ 10年间城市土地利用效率Moran's I均大于0且逐年上升,说明城市土地利用效率存在空间正相关性且集聚特征逐年增强,LISA空间形态呈现“小集聚大分散”特征,H-H集聚区沿浙江、上海向外扩散,L-L集聚区集中于皖北、川北等地。研究框架和结果对区域土地资源可持续利用和统筹协调发展具有重要意义。
