

1 引言
2010年以来,国家密集出台了《国家新型城镇化规划(2014—2020年)》《乡村振兴战略规划(2018—2022年)》等发展战略。深入推进以“人为核心”的新型城镇化战略,全面提升城镇化发展质量,成为“十四五”期间中国城镇化发展的重要目标。除坚持控制大城市规模外,“十四五”规划强调将中小城市、小城镇和乡村作为中国经济社会发展的新引擎。如何让城镇留得住人,乡村如何成为人口创业就业的新舞台,如何缓解要素由乡村向城市的单向流动,成为当前应对小城镇衰落、乡村人口老龄化和产业空心化的关键。事实上,中国的城镇化已进入快速发展阶段的中后期,广袤乡村正经历着发展转型,表现出城、镇和乡之间不断增强的联动关系。具体到中国的人口流向,尽管乡—城迁移流动仍是当前人口迁移流动的主要形式[1],但长距离人口迁移流动的规模和增速已在趋缓[2]。在大城市周边,一些中小城市和小城镇已成为城乡融合的平台和承接流动人口的重要载体[3-4]。以县城为中心的人口“就地”和“就近”城镇化趋势也愈加凸显[1]。在一些经济社会发展程度较高或具有独特资源禀赋的地区,城乡间的联系变得愈发频繁,乡村的流动人口已呈增长态势[5]。在这一系列转型背景下,对城、镇和乡3类地域类型加以区分,探究流动人口在城、镇和乡的时空分布动向及其背后机理,对于科学认知日趋多元的城镇化模式和城乡关系,有针对性地提出城乡融合发展和区域协调发展策略,具有重要的理论和实践价值。
中国流动人口分布格局的演变与城镇化进程密切相关[6-7]。1978年改革开放以来,中国大规模的人口迁移流动成为快速城镇化进程的重要表征。总体上,中国流动人口的分布具有明显的不均衡性和极化效应[8⇓-10]。流动人口主要选择向沿海城市群以及一些中西部的大中城市集聚[11⇓⇓⇓⇓-16];除了向城市的集聚,在中西部广大地区及非城市群地区,流动人口向镇的集聚也较为明显[4]。在乡村,人口的外流程度整体上不断加深[17],但在一些经济发达的乡村,流入人口的规模已有所增长[5]。区域间发展差异是流动人口分布不均衡的主要原因[7,18]。在不同区域之间或区域不同发展阶段之间,影响流动人口分布的机制会存在差别。改革开放初期,经济增长和工业化是流动人口集聚的重要推手[19]。21世纪以来,除收入水平、就业机会等经济因素外,人力资本和城市公共服务资源等要素的作用开始显现[9,20]。综上,目前相关研究主要聚焦于人口向城镇的流动,鲜有研究将流入地按照城、镇和乡加以区分并揭示和比较流动人口在这3类地域空间的时空分异及其背后的影响因素。随着城镇化的不断深入,城、镇和乡的要素互动愈发频繁,镇和乡的重要性进一步凸显,由此3类地域空间与流动人口之间的关系亟待分类探讨。
江苏省作为长三角的重要组成部分,其城镇化和城乡融合发展走在全国前列,对流动人口有较高吸引力。省内苏南、苏中和苏北3个发展梯度差异明显区域呈现出多样化的流动人口分布格局。近年来3个区域结合国家城乡发展战略与自身发展定位,积极探索推动城、镇和乡发展的新举措,并取得了一定成效。因此,在研究县市尺度下流动人口在城、镇和乡分布格局的多样性和演变规律方面,江苏省可作为较好的案例地。本文基于第六次和第七次全国人口普查数据,以江苏省为研究区刻画和比较了2010—2020年流动人口在城、镇和乡分布(即城区、镇区和乡村3类地域类型)的时空演变规律,并运用分位数回归模型揭示出影响流动人口空间分布的关键因素。研究主要创新点为:在县市尺度,首次将研究单元细化至城、镇和乡3类地域空间,并将研究对象划分为总体、省内和省外流动人口3类,试图通过全面刻画流动人口分布的时空分异及其影响因素,以期发现中国城镇化的新特点和城乡关系的新趋势。随着中国城镇化进入中后期,国家战略转向城乡融合发展和区域协调发展,本文不仅对近10年来国家战略的实施提供了评估,亦可对未来相关政策的颁布和实施提供理论参考。
2 研究区、数据与研究方法
2.1 研究区与数据来源
江苏省位于经济社会发展水平较高的东部沿海地区,是人口流入大省,但城、镇和乡对流动人口的吸引存在明显差异。按照经济社会发展梯度,通常把江苏省分为3个区域:发达的苏南(包括南京、镇江、常州、无锡和苏州5个地级市);发展中的苏中(包括扬州、泰州和南通3个地级市);相对欠发达的苏北(包括淮安、盐城、宿迁、连云港和徐州5个地级市)。高度城镇化的苏南已形成包括地级市和县级市在内的城市群,带动周边小城镇和乡村的发展;苏中和苏北的城镇化水平较苏南呈梯度下降,城镇发展通常以地级市为核心,并存在一批以城关镇为节点的县。
流动人口数来源于第六次和第七次全国人口普查(江苏省)的长表数据。该数据把外来人口按照其现居住地分为城、镇和乡3类地域空间,按照其户籍地分为市内跨县、省内跨市和省外多个类别。文中基于该数据的流动人口测算依据戚伟等2017年对于县市尺度流动人口的测算方法。分位数回归模型所涉及的社会经济数据来源于2011年和2021年《江苏省统计年鉴》。需要指出,文中对于城、镇和乡的划分参考《统计上划分城乡的规定》①(①按照《统计上划分城乡的规定》,城镇包括城区和镇区。城区是指在市辖区和不设区的市,区、市政府驻地的实际建设连接到的居民委员会和其他区域。镇区是指在城区以外的县人民政府驻地和其他镇,政府驻地的实际建设连接到的居民委员会和其他区域。乡村是指本规定划定的城镇以外的区域。),即以实际建设情况为主要划分依据。因此,文中所涉及的城、镇和乡代表了3类不同的地域类型:城和镇分别为城区和镇区;而乡则指划定的城镇以外的区域(即乡村)。
2.2 流动人口在城、镇和乡分布格局演变研究
(1)流动人口规模演变。以县市(包括县、县级市和地级市市辖区)为研究单元,依据戚伟等2017年对于县市尺度流动人口的界定,计算对应县市单元对应类型的流动人口数(流动人口类型细分为:总流动人口、省内流动人口和省外流动人口)。运用ArcGIS 10.2对数据结果进行可视化,采用自然断点法描绘两个普查年份研究区流动人口规模的空间分布和变化情况。
(2)流动人口占比演变。流动人口对区域社会经济环境往往存在“趋利避害”的特征,区域内流动人口占常住人口的比例(即人口流动的强度)可反映该区域对流动人口的吸引力。本文依次计算了流动人口(包括总流动人口、省内流动人口、省外流动人口)占该县市单元城、镇、乡常住人口的比例。相比已有研究,本文对流动人口吸引力的计算方法规避了地域空间面积增减带来的人口绝对规模变化所引发的数据干扰。该占比的分级参考自然断点法,并同时考虑到省内和省外流动人口与总流动人口之间的关系。
此外,本文还考察了2010年与2020年流动人口占比的比值,以刻画研究区内城、镇和乡对流动人口吸引力的时空演变。流动人口增幅大于常住人口的变动,以及流动人口减幅小于常住人口减幅,均可导致流动人口占比的增长。因此,流动人口占比的变化体现了两次普查期间区域吸纳新流动人口以及留住已有流动人口的能力,综合性地刻画了区域对流动人口吸引力的变化。需要指出,由于2010—2020年的行政区划调整,江苏省有5个县升级为县级市或市辖区,因此造成县市单元中地域类型的变动(即镇区升级为城区)。为减少这种变化对流动人口占比的影响,本文在计算两年期比值时,对涉及这个县的县市单元沿用2010年的行政区划图。
2.3 流动人口在城、镇和乡分布影响因素研究
迁移理论认为,与流出地相比,流入地更高的居民收入水平和更为丰富的就业机会是吸引人口流入和留下的重要原因[7,19]。近年来,随着流动人口城市生涯的不断增长、新生代农民工成为流动人口主体以及家庭化迁移流动的增多,影响人口迁移流动的因素日趋复杂。流动人口选择流入地时不再只关注当地收入水平和就业机会,地区的公共服务水平和人民生活质量也成为其关注要点[9,20]。具体到城、镇和乡,产业由城向镇的转移,小城镇和县城在教育和医疗资源的改善,乡村交通的通达与产业的发展等,都会深刻影响人口的迁移流动决策[4,17]。因此,本文聚焦政府社会投入、人民生活水平和相关产业发展三个维度对江苏省城、镇和乡流动人口占比的影响。考虑到三个维度在城、镇和乡吸引和留住流动人口的影响机制有所不同,本文有侧重地选择典型变量对城、镇和乡分别建立回归模型。
① 政府社会投入方面,流动人口对流入地政府社会投入的感知与当地政府在地区基础设施、城市面貌、社会福利等方面的投入密切相关,故以公共预算支出作为衡量变量。受数据获取的限制,城、镇和乡的模型均选取县市人均一般公共预算支出为变量。② 人民生活水平方面,城和镇的模型选取城镇居民恩格尔系数为衡量变量,乡的模型纳入城乡收入差距作为衡量变量。考虑到流动人口流入乡村的决策与乡村居民生活质量的联系较弱,而较大的城乡收入差距会使流动人口选择流入城镇而非乡村,故选择城乡收入差异这一指标而非农村居民恩格尔系数。③ 相关产业发展方面,分别纳入与城、镇和乡发展关系密切的产业因素。城和镇的模型纳入工业发展水平和产业结构高级化[24];乡的模型纳入工业发展水平、农林牧渔业发展水平作为变量。城、镇和乡模型所采用解释变量的说明和描述性分析结果如表1所示。
表1 回归模型主要变量及其描述性统计
Tab. 1
| 变量类型 | 变量名 | 变量解释 | 平均值 | 标准差 | 最小值 | 最大值 |
|---|---|---|---|---|---|---|
| 被解释变量 (城) | 城区流动人口占比 | 城区总流动人口/城区常住人口(%) | 16.56 | 13.08 | 0.68 | 54.87 |
| 城区省内流动人口/城区常住人口(%) | 6.64 | 4.35 | 0.67 | 14.48 | ||
| 城区省外流动人口/城区常住人口(%) | 9.92 | 9.80 | 0.12 | 40.47 | ||
| 解释变量 | ||||||
| 政府社会投入 | 公共服务投入 | 县市人均一般公共预算支出(万元/人·年) | 0.93 | 0.71 | 0.21 | 3.43 |
| 人民生活水平 | 生活水平 | 城镇居民恩格尔系数 | 33.16 | 4.08 | 24.90 | 44.10 |
| 相关产业发展 | 工业发展 | 人均工业产值(万元/人·年) | 3.17 | 2.15 | 0.49 | 10.64 |
| 产业结构高级化 | 第三产业产值/第二产业产值(比值大于或等于1赋值1,小于1赋值0) | 0.32 | 0.47 | 0.00 | 1.00 | |
| 被解释变量 (镇) | 镇区流动人口占比 | 镇区总流动人口/镇区常住人口(%) | 13.20 | 13.82 | 0.26 | 52.44 |
| 镇区省内流动人口/镇区常住人口(%) | 5.30 | 5.72 | 0.10 | 30.48 | ||
| 镇区省外流动人口/镇区常住人口(%) | 7.90 | 10.03 | 0.16 | 43.30 | ||
| 解释变量 | ||||||
| 政府社会投入 | 公共服务投入 | 县市人均一般公共预算支出(万元/人·年) | 0.93 | 0.71 | 0.21 | 3.43 |
| 人民生活水平 | 生活水平 | 城镇居民恩格尔系数 | 33.16 | 4.08 | 24.90 | 44.10 |
| 相关产业发展 | 工业发展 | 人均工业产值(万元/人·年) | 3.17 | 2.15 | 0.49 | 10.64 |
| 产业结构高级化 | 第三产业产值/第二产业产值(比值大于或等于1赋值1,小于1赋值0) | 0.32 | 0.47 | 0.00 | 1.00 | |
| 被解释变量 (乡) | 乡村流动人口占比 | 乡村总流动人口/乡村常住人口(%) | 8.19 | 12.12 | 0.43 | 50.95 |
| 乡村省内流动人口/乡村常住人口(%) | 2.37 | 2.84 | 0.15 | 12.78 | ||
| 乡村省外流动人口/乡村常住人口(%) | 5.82 | 9.53 | 0.24 | 40.41 | ||
| 解释变量 | ||||||
| 政府社会投入 | 公共服务投入 | 县市人均一般公共预算支出(万元/人·年) | 0.93 | 0.71 | 0.21 | 3.43 |
| 人民生活水平 | 城乡收入差距 | 城镇居民人均可支配收入/农村居民人均可支配收入 | 1.50 | 0.47 | 1.00 | 2.47 |
| 相关产业发展 | 工业发展 | 人均工业产值(万元/人·年) | 3.17 | 2.15 | 0.49 | 10.64 |
| 农林牧渔业发展 | 人均农林牧渔业产值(万元/人·年) | 0.96 | 0.61 | 0.14 | 2.86 | |
注:数据来源于2011年和2021年《江苏省统计年鉴》。
本文以江苏省所有县市单元2010年和2020年两期流动人口占常住人口的比例作为因变量,分别建立总流动人口、省内流动人口和省外流动人口的混合截面数据库。若以两期流动人口占比的变化为因变量,则会因数据量过小无法兼顾模型结果的可靠性。本文同时采用普通最小二乘法(OLS)回归和分位数回归来估计政府社会投入、人民生活水平和相关产业发展对城、镇和乡流动人口占比的影响。需要指出,分位数回归模型能够对不同分位数下的解释变量和被解释变量的线性关系进行估计[21]。与线性回归模型相比,分位数回归模型能更全面地描述因变量的全局特征,而不仅是均值;分位数回归模型对误差项的分布假设条件更为宽松,对非正态分布数据的估计结果更加稳健。另外,流动人口占比呈指数分布,采用分位数回归方法的估计结果更为可靠。综上,采用分位数回归或更适合本文研究。分位数回归模型选取经典的5个分位数(10%、25%、50%、75%、90%)以检验各影响因素与流动人口占比关系的异质性。
本文的分位数回归模型可表述如下:
式中:
3 江苏省流动人口分布的时空分异
3.1 流动人口整体分布格局演变
2010—2020年江苏省流动人口规模迅速增长,但存在明显的区域差异(图1)。苏南一直是吸引流动人口的高地,其高值区连片集聚。苏南的流动人口规模进一步扩大,形成苏锡常和南京两个明显的核心区。苏中和苏北的流动人口规模相对苏南较小,其高值区主要位于地级市市辖区。伴随着行政区划调整,这两个区域的流动人口在地级市市辖区内显著增长。其中,苏北的流动人口仍主要集中在地级市市辖区,而苏中地级市市辖区周边县市的流动人口规模有所扩大。
图1
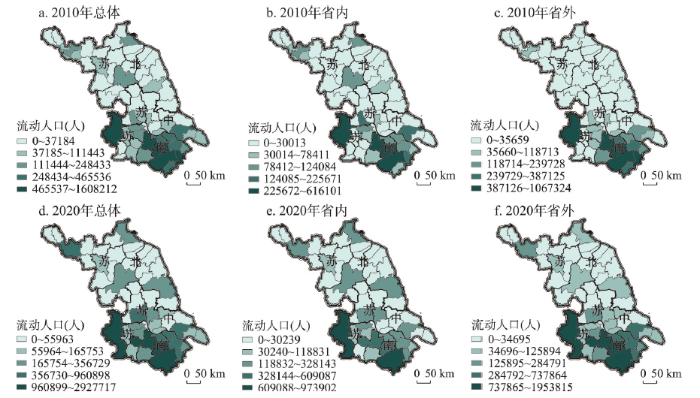
图1
2010年和2020年江苏省流动人口规模
Fig. 1
Spatial distribution of floating population size in 2010 and 2020
江苏省省内、外流动人口在规模上也存在区域差异。总体上,3个区域的省、内外流动人口规模保持着梯度差异格局,但两类流动人口的规模存在不一致。其中,苏南的省外流动人口规模明显大于其省内流动人口规模;苏北的状况与苏南相反;而苏中两类流动人口规模的差距不大。10年间苏南的省内流动人口进一步向南京市和苏州市市辖区集中,省外流动人口规模的高值区范围进一步扩大(涉及南京市、苏州市、无锡市和常州市的市辖区)。尽管苏中和苏北的省内、外流动人口的规模有明显增长,但与苏南相比仍存在显著差距,且主要在地级市市辖区集聚。
在流动人口占比方面,2010—2020年江苏省绝大多数县市单元的流动人口占常住人口的比例有所增加(图2)。苏南流动人口占比的高值区以苏锡常为核心向西延伸;苏中和苏北流动人口占比的高值区范围也有所扩大。尽管地级市市辖区仍是苏中和苏北吸引流动人口的节点,但已出现以此为核心向周边扩展的态势。
图2
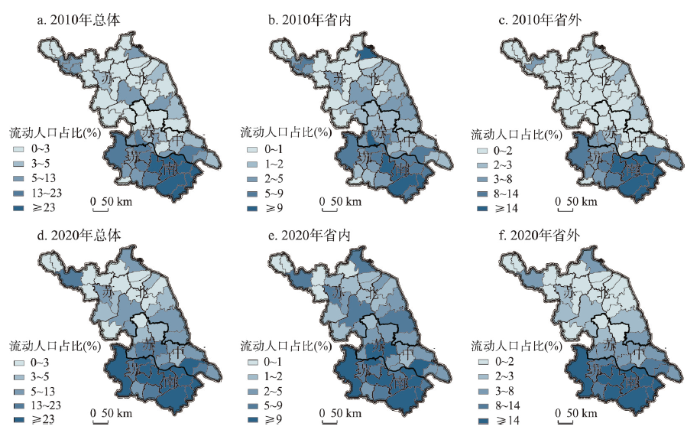
图2
2010年和2020年江苏省流动人口占常住人口比例
Fig. 2
Spatial distribution of floating-permanent population ratio in 2010 and 2020
2010—2020年间省外流动人口占比在3个区域增长明显,表明江苏省对省外流动人口吸引力的整体提升。2020年省外流动人口占比的高值区基本覆盖了苏南全域;苏中占比的高值区已呈现出在沿江地带的连绵集聚状态;苏北占比的高值区主要为地级市市辖区。此外,尽管苏南仍对省内流动人口保持着较强吸引力,但省内流动人口占比在苏中和苏北有明显提升,高值区范围进一步扩大。苏中和苏北的地级市市辖区,省内流动人口占比已与苏南无明显差距,体现出这两个区域对省内流动人口显著增长的吸引力。
3.2 城区流动人口分布格局演变
江苏省3个区域城区流动人口占比的高值区范围在2010—2020年间均有所扩大,但仍具有明显的区域差异(图3)。有别于苏中和苏北,苏南的县已完全升级为市辖区或县级市,其流动人口占比的高值区由苏锡常向西延伸(同时涉及地级市和县级市城区),形成明显的连绵集聚状态。当前苏南已形成以南京都市圈和苏锡常都市圈为核心的城市群,城市群内各等级城市对流动人口普遍具有较强吸引力。苏中城区的流动人口占比在2010—2020年间有所增加,但有别于苏南的连绵集聚状态,该比值在地级市城区表现出明显的极化特征。与苏中类似,苏北城区流动人口占比的高值区同样主要集中在地级市城区,但该区域不同地级市对于流动人口的吸引存在差异。2010—2020年间苏北的徐州、宿迁和盐城3个地级市城区的流动人口占比增幅明显,但连云港和淮安城区的流动人口占比却在减少。进一步比较两个普查年份流动人口占比比值发现,江苏省大部分城市城区的流动人口占比均在稳步增长(2020年与2010年占比比值大于1),增幅明显的地区(2020年与2010年占比比值大于2的县市单元)主要为近年来经济发展迅速且优势产业明显的县级市城区(如苏南的溧阳市、苏中的泰兴市、苏北的东台市)。
图3
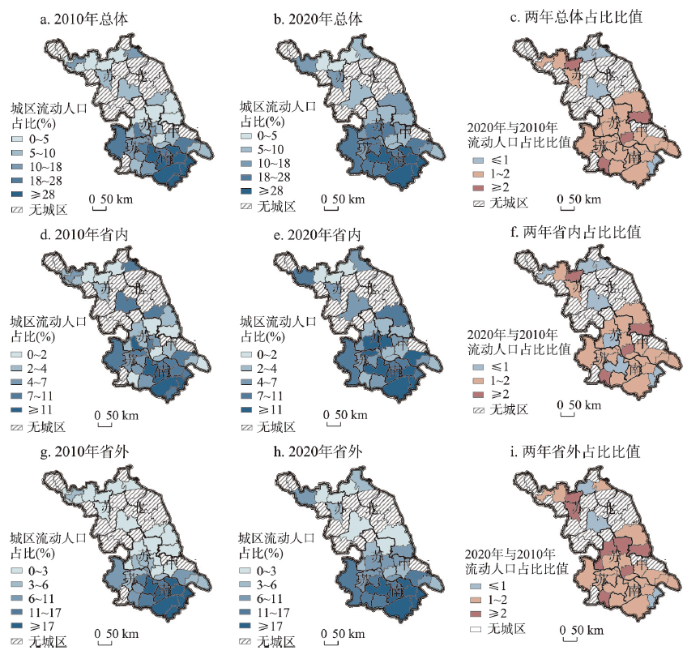
图3
2010年和2020年江苏省城区流动人口占常住人口比例
Fig. 3
Spatial distribution of floating-permanent population ratio in districts of cities in Jiangsu in 2010 and 2020
省内、外流动人口占比的高值区均在苏南连片集聚,且这一态势在2010—2020年间有所强化。相比省内流动人口,省外流动人口占比的高值区涉及苏南更多城市的城区(包括地级市和县级市),表明该区域更多城市对于长距离的跨省流动人口具有较强吸引力。与苏南相比,苏中和苏北的城区对省内流动人口更具吸引力,且地级市城区的优势明显。但在这两个区域更多的县市单元,省外流动人口占比较省内流动人口占比有所增加,一些县级市的省外流动人口占比增幅明显。结果表明,苏中和苏北存在省外人口补给现象,一些县级市正逐渐成为这两个区域吸引省外流动人口的增长点。
3.3 镇区流动人口分布格局演变
与流动人口在城区的分布相似,镇区的流动人口占比在3个区域的分布同样存在明显的梯度差异(图4)。苏南流动人口占比的高值区主要位于苏锡常的下辖镇,且向西延伸并连片集聚。苏南(尤其是苏锡常)具有发展乡镇企业的历史,形成独特的“苏南模式”。自20世纪90年代末,传统的“苏南模式”向以开发区建设和外向型经济驱动为特征的新“苏南模式”转变[22],进一步推动着该区域中镇的经济发展。此外,随着“三集中(农业向规模经营和农业园区集中、工业向开发区和工业集中区集中、农民居住区向城镇和农村新型社区集中)”等地方政策和中心城市都市区化的带动,苏南一些镇对流动人口保持着较强吸引力。苏中流动人口在镇的集聚程度不及苏南,该占比的高值区主要分布在地级市及一些县级市的下辖镇,且这一趋势在2010—2020年间有所强化,体现出该区域以城市为核心对周边小城镇的带动作用。苏北镇区的流动人口占比不及苏南,但该区域的相对高值区范围明显扩大,主要分布在各地级市下辖镇,成片集聚态势尚未形成。
图4
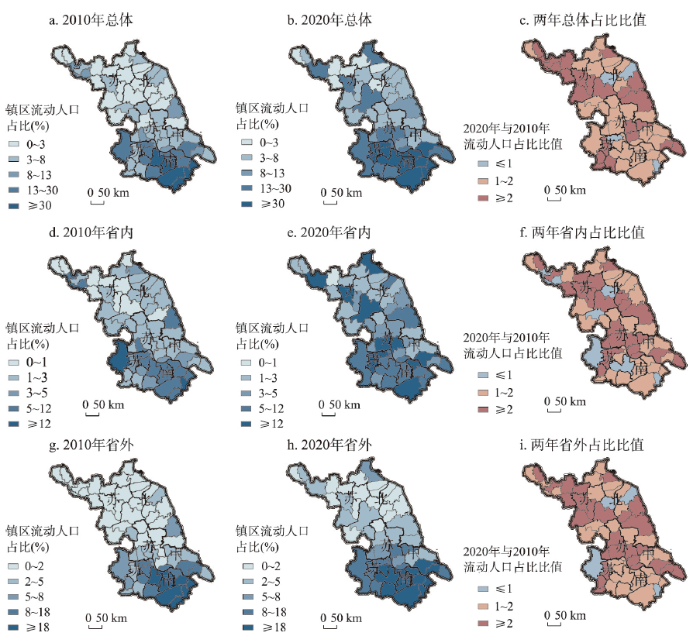
图4
2010年和2020年江苏省镇区流动人口占常住人口比例
Fig. 4
Spatial distribution of floating-permanent population ratio in towns of Jiangsu in 2010 and 2020
3个区域中流动人口在镇区的占比变化存在差异,体现出镇在3个区域中功能的不同。在苏南,城镇群的发育较为完善,小城镇的二三产业具有厚实基础,其作为都市功能的重要组成和经济增长节点,吸引着外来人口的流入。苏中流动人口占比增幅较大的镇主要位于地级市或县级市的市辖区内。而苏北除了都市圈内的小城镇外,县政府所在的城关镇和一些特色镇也是流动人口快速增长的地区。相比中国中西部的大部分镇,苏北的城关镇具有更大的人口规模(如阜宁县阜城镇的人口规模达到30余万,而睢宁县睢城镇的人口规模达到20余万),这些城关镇除了是流动人口就近城镇化的节点,也是返乡人口的落脚之处。此外,一些基于自身资源特色、电商平台和劳动密集型产业而发展的特色镇也已成为吸引流动人口的中心。
对比省内、外流动人口占比的变化发现,镇区的两类流动人口占比的高值区仍明显集中在苏南,且其范围均有所扩大。尽管苏南—苏中—苏北的区域差异仍然存在,但2010—2020年间两类流动人口占比增幅明显地区主要位于苏中和苏北而非苏南。其中,苏中的镇属于吸引省内和省外人口的中间地带,两类流动人口占比均有所增加。但相比省外流动人口,该区域省内流动人口占比在更多的县市单元增幅明显(主要集中在沿江地带)。苏北镇区的省内流动人口占比普遍比省外流动人口占比更高,但省外流动人口占比增幅明显地区范围更广。这些结果表明,苏南的镇对省内、外流动人口均保持着较强吸引力,但苏中和苏北的镇对流动人口的吸引力存在类型差异。
3.4 乡村流动人口分布格局演变
乡村流动人口占比的高值区明显集中在苏南(以苏州市和无锡市为核心)(图5),这当中包含部分流动人口快速增长的乡村(如溧阳市、常熟市、南京的溧水区和高淳区;已有研究亦发现苏南部分乡村已成为外来农村流动人口和城市人口的流入地[5,23]),以及更多流动人口呈减少趋势的乡村(如无锡、常州和苏州的市辖区,以及江阴和丹阳等县级市)。由于后者的流动人口减幅低于常住人口减幅,依然呈现出2010—2020年间流动人口占比增长的趋势。相比苏南,苏中和苏北乡村的流动人口占比较小。尤其在苏北乡村,流动人口占比在两个普查年份基本处于0~4%的范围,流动人口占比的增加主要源于撤乡并镇和人口外流造成的常住人口减少。但需要指出,流动人口和常住人口减幅的不一致也可一定程度反映该区域的乡村对流动人口吸引力的差异。
图5
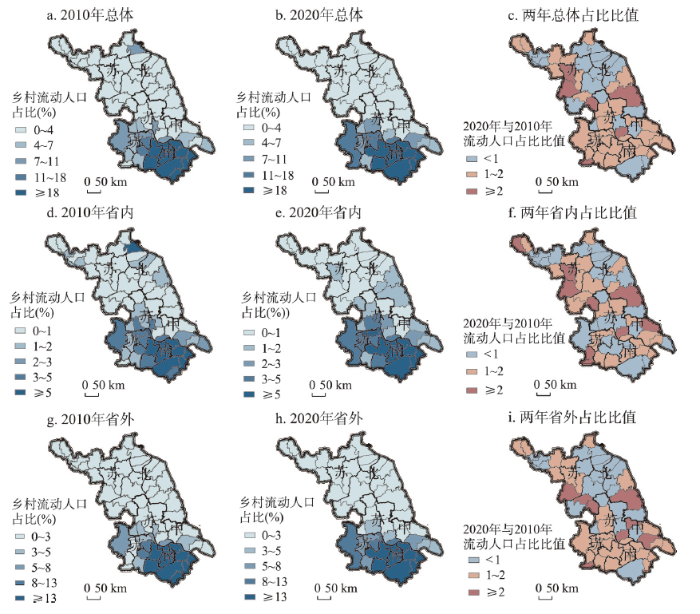
图5
2010年和2020年江苏省乡村流动人口占常住人口比例
Fig. 5
Spatial distribution of floating-permanent population ratio in rural areas of Jiangsu in 2010 and 2020
相比省内流动人口,苏南乡村的省外流动人口占比更为稳定,占比的高值区成片集聚,且在2010—2020年间基本呈增长态势。苏中和苏北的乡村则普遍存在流动人口(无论是来自省内还是省外)和常住人口同时减少的现象。但与此同时,在这两个区域的乡村,流动人口占比(尤其是省内流动人口占比)增幅明显的县市单元比苏南更多。这些结果表明,尽管流动人口“南密北疏”分布格局尚未发生根本性改变,但3个区域的乡村对流动人口的吸引力发生了变化,并且吸引着不同类型群体。
3.5 流动人口在城、镇和乡分布格局演变比较
总体上,2010—2020年间江苏省城区和镇区流动人口占常住人口的比例普遍增加,但镇区流动人口占比增幅相较于城区更为明显。具体而言,两年期城区流动人口占比比值主要在1~2区间范围,但两年期镇区占比比值大于2的地区涉及江苏约一半的县市单元,主要集中在苏中—苏北的沿江城市带、沿海城镇轴和沿东陇海城镇轴3条江苏重要的战略发展轴上。这些结果表明,尽管城仍是江苏吸引流动人口的节点,但镇对于流动人口的吸引力在2010—2020年间明显增强。从3个区域看,苏南的城和镇对流动人口保持着较强吸引力,但镇的占比增幅明显地区主要位于苏中和苏北,体现了这两个区域的镇对流动人口显著提升的吸引力。
相比城和镇,乡村流动人口占比的高值区更为集中在苏南,且2010—2020年间该占比在江苏更多的县市单元有所减少。尤其在苏北多于一半的县市单元,乡村对于流动人口的吸引力持续下降,人口(包括户籍人口和流动人口)仍明显地向城镇集聚;而在苏南和苏中,尽管人口仍保持着向城镇集聚的趋势,但一些乡村(尤其在苏南)对于流动人口已具有一定的吸纳和保留能力。
在3类地域类型空间,省外流动人口占比的高值区保持着在苏南的集中态势,但其在城区和镇区的占比增幅明显地区主要位于苏中和苏北而非苏南。对于省内流动人口,其在城区和镇区占比的高值区除位于苏南之外,还包括苏中和苏北的地级市市辖区和一些县(针对镇)。相较于城和乡,镇区省内流动人口占比增幅明显地区涉及苏中和苏北更多的县市单元。这些结果表明,江苏省3个区域的城、镇和乡吸引流动人口的类型存在差异,且在2010—2020年间其对省内、外流动人口吸引的变化明显。
4 江苏省流动人口分布影响因素
表2 回归模型结果(城)
Tab. 2
| 解释变量 | 流动人口 | OLS | 分位数 | ||||||
|---|---|---|---|---|---|---|---|---|---|
| 类型 | 均值 | Q10 | Q25 | Q50 | Q75 | Q90 | |||
| 政府社会投入 | 公共服务投入 | 总体 | 0.126*** | 0.075** | 0.143*** | 0.116*** | 0.142*** | 0.142 | |
| 省内 | 0.048*** | 0.022 | 0.044*** | 0.049*** | 0.049*** | 0.028 | |||
| 省外 | 0.078*** | 0.043 | 0.044 | 0.075*** | 0.078*** | 0.089* | |||
| 人民生活水平 | 城镇居民恩格尔系数 | 总体 | 0.071*** | 0.042*** | 0.045*** | 0.058*** | 0.072*** | 0.132*** | |
| 省内 | 0.028*** | 0.020*** | 0.029*** | 0.030*** | 0.033*** | 0.028* | |||
| 省外 | 0.043*** | 0.012* | 0.016* | 0.026 | 0.049** | 0.090*** | |||
| 相关产业发展 | 工业发展 | 总体 | 0.054*** | 0.047** | 0.020 | 0.057* | 0.059** | 0.093 | |
| 省内 | 0.010 | 0.019*** | 0.016*** | 0.014*** | 0.007 | 0.019 | |||
| 省外 | 0.044*** | 0.012 | 0.025* | 0.037** | 0.057*** | 0.086*** | |||
| 产业结构高级化 | 总体 | 0.014 | 0.024 | 0.009 | 0.002 | 0.011 | 0.066 | ||
| 省内 | 0.022** | 0.016 | 0.021** | 0.027** | 0.028* | 0.034 | |||
| 省外 | -0.008 | -0.011 | -0.018 | -0.015 | 0.010 | 0.046 | |||
| 常数项 | 总体 | 0.010 | -0.007 | -0.036 | 0.008 | 0.023 | 0.054 | ||
| 省内 | 0.006 | 0.002 | -0.009 | -0.003 | 0.019 | 0.054 | |||
| 省外 | 0.003 | -0.007 | 0.002 | 0.002 | 0.019 | 0.048 | |||
| 总体 | 0.663 | 0.388 | 0.441 | 0.495 | 0.504 | 0.425 | |||
| R2 | 省内 | 0.621 | 0.357 | 0.421 | 0.473 | 0.439 | 0.291 | ||
| 省外 | 0.585 | 0.319 | 0.336 | 0.401 | 0.483 | 0.437 | |||
| 观测数 | 77 | 77 | 77 | 77 | 77 | 77 | |||
注:***:p < 0.01, **:p < 0.05, *:p < 0.1。
表3 回归模型结果(镇)
Tab. 3
| 解释变量 | 流动人口 | OLS | 分位数 | |||||
|---|---|---|---|---|---|---|---|---|
| 类型 | 均值 | Q10 | Q25 | Q50 | Q75 | Q90 | ||
| 政府社会投入 | 公共服务投入 | 总体 | 0.131*** | 0.076** | 0.097*** | 0.149*** | 0.146*** | 0.119** |
| 省内 | 0.048*** | 0.024*** | 0.028*** | 0.043*** | 0.044*** | 0.034 | ||
| 省外 | 0.083*** | 0.022 | 0.030 | 0.059* | 0.083*** | 0.106* | ||
| 人民生活水平 | 城镇居民恩格尔系数 | 总体 | 0.048*** | 0.013** | 0.023*** | 0.024** | 0.026 | 0.036** |
| 省内 | 0.016*** | 0.009*** | 0.009*** | 0.012*** | 0.009*** | 0.009 | ||
| 省外 | 0.032*** | 0.011*** | 0.013 | 0.015 | 0.010 | 0.009 | ||
| 相关产业发展 | 总体 | 0.059*** | 0.015 | 0.027*** | 0.038* | 0.073*** | 0.082*** | |
| 工业发展 | 省内 | 0.010 | 0.009** | 0.010** | 0.010 | 0.013*** | 0.021 | |
| 省外 | 0.049*** | 0.020*** | 0.031** | 0.042*** | 0.068*** | 0.069** | ||
| 产业结构高级化 | 总体 | 0.019 | -0.012 | -0.007 | -0.041 | -0.036 | 0.012 | |
| 省内 | 0.034*** | 0.008** | 0.001 | 0.002 | 0.051 | 0.138*** | ||
| 省外 | -0.014 | 0.002 | -0.005 | -0.024 | -0.046** | -0.073** | ||
| 常数项 | 总体 | 0.004 | -0.015 | -0.004 | -0.007 | 0.045 | 0.107 | |
| 省内 | -0.003 | -0.003 | 0.002 | 0.001 | 0.012 | 0.029 | ||
| 省外 | 0.006 | 0.003 | 0.012 | 0.019 | 0.052* | 0.069 | ||
| 总体 | 0.732 | 0.271 | 0.319 | 0.475 | 0.577 | 0.567 | ||
| R2 | 省内 | 0.485 | 0.286 | 0.300 | 0.343 | 0.388 | 0.493 | |
| 省外 | 0.682 | 0.182 | 0.269 | 0.410 | 0.560 | 0.589 | ||
| 观测数 | 118 | 118 | 118 | 118 | 118 | 118 | ||
注:***:p < 0.01, **:p < 0.05, *:p < 0.1。
表4 回归模型结果(乡)
Tab. 4
| 解释变量 | 流动人口 | OLS | 分位数 | |||||
|---|---|---|---|---|---|---|---|---|
| 类型 | 均值 | Q10 | Q25 | Q50 | Q75 | Q90 | ||
| 政府社会投入 | 公共服务投入 | 总体 | 0.089*** | 0.027 | 0.031 | 0.085** | 0.102*** | 0.110** |
| 省内 | 0.016*** | 0.013*** | 0.012* | 0.012*** | 0.005 | 0.027 | ||
| 省外 | 0.073*** | 0.011 | 0.018 | 0.084** | 0.096*** | 0.091** | ||
| 人民生活水平 | 城乡收入差距 | 总体 | -0.061*** | -0.030 | -0.024 | -0.041** | -0.049*** | -0.057* |
| 省内 | -0.003 | -0.010* | -0.006 | -0.003 | -0.004 | -0.005 | ||
| 省外 | -0.058*** | -0.015* | -0.016 | -0.048** | -0.045*** | -0.043** | ||
| 相关产业发展 | 总体 | 0.039*** | 0.016 | 0.025** | 0.034** | 0.048** | 0.061* | |
| 工业发展 | 省内 | 0.007*** | 0.003 | 0.007** | 0.011*** | 0.019** | 0.011* | |
| 省外 | 0.032*** | 0.011*** | 0.019*** | 0.017** | 0.025*** | 0.046* | ||
| 农林牧渔业发展 | 总体 | -0.041*** | -0.009 | -0.018** | -0.026*** | -0.034*** | -0.047*** | |
| 省内 | -0.012*** | -0.003** | -0.005*** | -0.007*** | -0.007*** | -0.012** | ||
| 省外 | -0.029*** | -0.006 | -0.013*** | -0.020*** | -0.026*** | -0.040*** | ||
| 常数项 | 总体 | 0.090 | 0.043 | 0.045 | 0.058 | 0.092 | 0.134 | |
| 省内 | 0.013 | 0.010 | 0.012 | 0.015 | 0.031 | 0.024 | ||
| 省外 | 0.077 | 0.025 | 0.032 | 0.043 | 0.056 | 0.098 | ||
| 总体 | 0.728 | 0.154 | 0.233 | 0.413 | 0.593 | 0.635 | ||
| R2 | 省内 | 0.641 | 0.229 | 0.291 | 0.452 | 0.513 | 0.505 | |
| 省外 | 0.724 | 0.119 | 0.187 | 0.369 | 0.594 | 0.646 | ||
| 观测数 | 118 | 118 | 118 | 118 | 118 | 118 | ||
注:***:p < 0.01, **:p < 0.05, *:p < 0.1。
4.1 城区流动人口分布影响因素
总体上,政府社会投入的增加对流动人口占比的提升有普遍正向作用,印证了公共服务资源对人口迁移流动的影响[20]。这一影响对于总流动人口、省内和省外流动人口占比无明显差别。人民生活水平的影响方面,城镇居民恩格尔系数与城区流动人口占比存在一定的正相关关系,即城镇居民恩格尔系数越高,越会促使流动人口流入该城区和长期居住。这种效应对省内和省外流动人口占比的影响均较为显著,体现出城市生活质量对于吸引流动人口的意义。
根据分位数回归模型结果(表2),工业发展水平对省外流动人口占比的影响在更多分位数显著,而对省内流动人口聚集的影响主要集中在占比低分位的城区。这些结果表明了工业就业是城市吸引流动人口(尤其是省外流动人口)的重要因素。产业结构高级化的影响方面,OLS模型和Q25~Q75分位数模型的结果具有一致性,即:在三产产值高于二产产值的城区,其省内流动人口占比显著高于三产产值低于二产产值的城区,这可能与省内流动人口更多在第三产业从事相关工作有关。已有研究发现产业结构高级化对人口规模的影响在高级化初期与后期存在差别,亦存在区域异质性[24]。本文表明,产业结构高级化对于城市吸引流动人口的影响针对不同群体(省内、外流动人口)存在差别。
4.2 镇区流动人口分布影响因素
县市人均公共预算支出对镇区流动人口占比的影响与城区相似,即其对总体、省内和省外流动人口占比具有普遍正向作用。人民生活水平的影响方面,城镇常住居民恩格尔系数与流动人口在镇的占比存在正向关系。根据分位数回归模型的结果(表3),相比省外流动人口,该指标对省内流动人口占比的影响在更多分位数显著。这些结果表明,生活质量是吸引省内流动人口流入和留在镇的重要因素。
工业发展对镇区总体和省外流动人口占比的提升均有明显正向作用,对省内流动人口占比也具有一定影响。这可能因为,2010—2020年间“工业强镇”“小城镇、大战略”已成为江苏省不少镇的发展战略。随着工业向镇的集聚或转移,流动人口也向镇聚集。工业发展的正向影响在流动人口占比高分位的镇更为凸显,表明流动人口的聚集能够强化工业吸引流动人口流入和留在镇,这也符合流动人口往往通过由老乡和工友组成的社会网络寻找工作的特征。相较于三产产值低于二产产值的县市,三产产值高于二产产值县市的三产对人力资本的要求通常更高,而镇区三产的就业机会较为有限。在此背景下,省内流动人口比省外流动人口更容易抓住就业机会,因此表现出产业结构高级化与省内流动人口占比间的正效应,以及该指标对省外流动人口流入的抑制效应。
4.3 乡村流动人口分布影响因素
与城和镇相类似,政府社会投入对流动人口在乡村的占比有正向作用。与城和镇的模型结果相比,公共服务投入与流动人口吸引力的相关性在乡的模型中较弱(表4)。这可能与县市政府对城镇与乡村公共服务的投入力度存在较大差异有关。另外,在乡村公共服务投入对省内流动人口的正向吸引主要体现在低分位段,即当省内流动人口在乡村形成更高程度的聚集时,正向效应消失。与之相比,公共服务投入对乡村吸引省外流动人口的正向效应主要体现在高分位段。这些结果表明流动人口的聚集能一定程度调节公共服务投入对乡村人口吸引力的影响。城乡收入差异对于乡村流动人口占比具有负向影响,说明减少城乡收入差距能促使人口向乡村流入,这一结果体现出城乡协调发展对于乡村留住人的重要意义。产业发展影响方面,县市工业发展水平对总体、省内和省外流动人口在乡村的占比均有显著正向影响,这与城镇工业发展的外溢效应和乡村工业的发展密切相关。农林牧渔业的发展对省内和省外流动人口在乡村的占比均具有负向影响,这可能因为农林牧渔业均属于在地经营项目,而此类项目的经营权受土地所有权和承包权等影响较大,当地人相比更具有比较优势,从而形成了对外来经营者的排斥。
4.4 流动人口城、镇和乡分布的影响因素比较
总体上,政府社会投入、人民生活水平和相关产业发展对城、镇和乡的总体、省内和省外流动人口占比的影响存在共性与差异,并具有分位数差别。县市人均公共预算支出对流动人口在城、镇、乡的占比均有正向影响,该结果印证了公共服务等社会要素对区域人口吸引力的重要作用[20]。在城、镇和乡,县市人均公共预算支出在吸引省内流动人口方面表现出较小的分位数差异,但其对省外流动人口的影响主要集中在省外流动人口占比高分位的镇和乡。这可能因为省内流动人口的集聚不会影响其对于政府公共品投入的感知;但省外流动人口则更需要通过集聚(如通过老乡等渠道获取信息)了解县市基础设施和社会福利水平。反映居民生活水平的城镇居民恩格尔系数对城和镇流动人口流入或留下有普遍影响力。在城,该指标对于省内和省外流动人口占比均有显著影响,相较于省外流动人口,该指标在镇对省内流动人口的正向影响在更多分位数显著,体现出城和镇的生活质量对于吸引不同类别流动人口的作用存在差异。
产业发展对流动人口在城、镇和乡的占比有较强解释力且表现出明显异质性。县市工业发展水平对城、镇和乡吸引流动人口均有显著正向作用,表明该类产业的发展能显著增加城、镇和乡流动人口的就业机会。该指标对于省外流动人口占比(相比于省内流动人口占比)在更多分位数的城和镇有显著的正向作用,表明两类流动人口在城镇的就业结构存在一定差别。值得注意的是,乡村振兴战略虽然带动了农林牧渔业的发展,但人均农林牧渔业产值的增加反而对乡村吸引流动人口起到负向作用,可见乡村要想真正吸引流动人口不能局限于发展农林牧渔业。产业结构高级化正向影响省内流动人口在城镇的集聚,一定程度说明省内流动人口更有机会在本省县市的第三产业就业。
5 结论与讨论
当前中国城镇化已进入快速发展阶段的中后期,人口向城、镇和乡的迁移流动日趋复杂,除传统的乡—城迁移流动之外,一些小城镇和乡村已成为人口流入的新节点。与此同时,新型城镇化、乡村振兴和城乡融合发展等一系列发展战略的深入推进,带动了乡镇的产业升级转型,改善了当地的公共设施和基础设施,使得城—镇—乡之间人口的联系更加紧密。在这一系列转型背景下,本文对城、镇和乡3类地域类型加以区分,探究了2010—2020年间江苏省流动人口在城、镇和乡分布的时空分异和影响因素。主要研究结论如下:
(1)2010—2020年间江苏省流动人口在城、镇和乡的分布更趋多元。总体上,城区和镇区的流动人口占常住人口比例保持着普遍增长态势,但镇区流动人口占比增幅明显高于城区;一些乡村的流动人口占比出现增长。随着苏中和苏北一些原本相对滞后县市经济社会发展水平的提升,其对流动人口的吸引逐渐跳出“南密北疏”的梯度格局。例如苏中和苏北一些县级市对流动人口的吸引力明显增强;流动人口占比增幅明显的镇主要位于苏中和苏北而非苏南。尽管苏中和苏北的绝大多数乡村依然面临人口减少的问题,但不少乡村的常住人口减幅已大于流动人口减幅,表现出对流动人口相对吸引力的提升。随着苏南一些乡和苏中、苏北一些镇对流动人口吸引力的增强,江苏省的城乡关系正逐步由城乡二元分割向城乡融合的方向发展。
(2)2010—2020年间江苏省3个区域对流动人口的吸引均有所增长,但流动人口分布的梯度格局具有顽健性。苏南仍是吸引流动人口的高地,其不同等级城市对流动人口的吸引力进一步强化,流动人口占常住人口比例的高值区呈现出较为明显的连绵集聚状态;苏中和苏北的流动人口规模相对较小,地级市是吸引流动人口的节点,但一些县和县级市对流动人口的吸引力有所提升。此外,3个区域对省内、外流动人口的吸引力发生了一定程度的分化,苏南保持着吸引省外流动人口的优势地位,苏中和苏北则对省内流动人口的吸引明显增强。
(3)江苏省流动人口在3个区域城、镇和乡的集聚状态呈现分异。在苏南的城和镇,流动人口主要分布在各等级城市和小城镇组成的城镇群,呈连片集聚状态;此外,苏南部分乡村已出现流动人口聚集现象,这种城、镇和乡对流动人口吸引力的同步提升体现出苏南对传统城乡二元结构的突破。苏中和苏北的流动人口高度集聚在以地级市为核心的市辖区内,尚未形成明显的连片状态。但与此同时,苏北的城关镇和一些特色镇对流动人口的吸引力有所增强,成为就近城镇化和人口回流的节点。
(4)省内、外流动人口在不同区域城、镇和乡的分布存在差异。苏南的城、镇和乡对省内、外流动人口均保持着较强吸引力(对后者的吸引更强)。而苏中和苏北的城、镇和乡所吸引的流动人口则存在类别差异。苏中和苏北的城对省外流动人口的吸引显著增强;苏中的镇对省内流动人口的吸引明显提升,而苏北的镇则对省外流动人口的吸引力有所提升;苏中和苏北近一半县市单元的乡对省内流动人口的相对吸引力有所增强。3个区域城、镇和乡发展模式的不同可能是导致其流动人口吸引力存在类别差异的主要原因。
(5)影响城、镇和乡人口流动占比的因素存在差异。县市人均公共预算支出对流动人口在城、镇、乡的占比均有正向影响,该结果印证了公共服务等社会要素对区域人口吸引力的重要作用。对城和镇而言,城镇居民恩格尔系数对流动人口占比有显著正向作用,表明生活质量能影响城和镇流动人口流入和留下的决策。产业发展对城、镇和乡流动人口占比的影响表现出明显异质性。城的工业发展和产业结构高级化对省内、外流动人口占比的影响存在差别;工业发展对镇和乡流动人口占比的正向作用较为普遍,而农林牧渔业对乡村流动人口占比的影响为负,表明要想真正吸引人口流入不能局限于发展农林牧渔业,而应考虑其与二三产业的融合发展。
在新型城镇化和乡村振兴战略的双重要求下,无论是以城市群和都市圈带动发展的发达地区还是以城关镇和中小城市带动发展的欠发达地区,均需因地制宜地建立城、镇和乡的人口发展策略。在提升城市吸引力的同时,增强乡镇对于流动人口的吸引力是促进城乡融合发展和区域协调发展的重要环节。在发达地区,应注重中心城市的发展对城市群和都市圈中城、镇和乡的带动作用,弱化人口的城乡二元分割,推动城—镇—乡共同发展;在欠发达地区,应强调镇作为连接城乡的纽带对于区域发展的推动作用,通过提升镇的人口载体功能,优化传统的城镇化模式,促进城乡协调发展。此外,还应充分注意城、镇和乡3类地域空间吸引流动人口的机制差别,采取更为细化的区域政策(包括工农产业发展、公共品投入、城乡人民生活水平改善等方面),以缩小城、镇和乡之间的发展不均衡。总体上,政府应继续加大对城、镇和乡的公共品投入(特别是对镇和乡的投入),缩小城镇居民平均生活水平与流动人口的差距,以及通过促进特定产业发展和调整产业结构吸引流动人口。具体到3类地域空间,城市依然是吸引流动人口的节点,除了创造更多的就业机会和提高收入水平外,城市中平等开放的公共服务和不断提升的生活质量对于流动人口具有较强吸引力。在当前,江苏省各镇在就业机会、公共服务、生活水平等方面普遍落后于城[3],直接影响其能否有效联动城市和乡村的发展。由此,应继续加大镇的政府社会投入,发展工业以及第三产业(如,发展基于特色农业资源和产业转移的劳动密集型产业和服务业),以增强镇对流动人口的吸引力。此外,提升城关镇的综合职能潜力和功能配套也可以发挥其在县域的核心带动作用。对于乡村,第一产业的发展并不足以留住更多人口,亟需通过推动一二三产业融合发展增强其对流动人口的吸引力。另外,城、镇和乡的政府公共服务投入和相关产业对吸引省内和省外流动人口存在差异,制定人口吸引政策时亟需兼顾这些不同。
本文仍存在一些研究局限。① 尽管江苏省作为研究区具有一定的典型性和代表性,但全国尺度的研究可以更好地把握中国流动人口在城、镇和乡分布的整体格局和动态,具有更高的参考意义;② 受宏观层面统计数据的局限和样本量的限制,本文只选择一些典型因素进行分析,未来需要结合微观层面的案例分析进行更为深入的机制探讨。
参考文献
New trends in migration and urbanization in China: A preliminary investigation based on the seventh census data
中国人口流动与城镇化新动向的考察: 基于第七次人口普查公布数据的初步解读
Changes in the form of population migration and mobility in China and corresponding policy responses at the late-intermediate stage of urbanization
DOI:10.18306/dlkxjz.2020.12.008
[本文引用: 1]

The form of population migration and mobility constitutes a key element of the characteristics of migration. Since China has entered the late-intermediate stage of urbanization, it is very important to accurately identify and understand the transformation in the form of population migration and mobility. While a growing body of literature has been generated and significant progress has been made on China's population migration and mobility and its determinants, an important inadequacy of relevant research are often focused on rural to urban population migration and mobility, neglecting the multi-dimensional forms of population migration and mobility. Based on relevant theories and international experience relating to the transformation in the forms of population migration and mobility, and using data from the China Migrants Dynamic Survey (CMDS), Report on Monitoring and Investigation of Migrant Workers in China, and relevant statistics, this study examined the processes of the transformation in the forms of the population migration and mobility in China and their characteristics at the present stage and the issues and challenges arising therefrom. The results show that there have been significant changes in the forms of population migration and mobility in China, and such changes mainly manifest in the following aspects: First, there has been a steady increase in return migration and short-distance migration; Second, inter-urban migration has also significantly increased and become increasingly common; Third, the urbanization process of the floating population based on the rural-urban transfer of their hukou has started to accelerate, and their rural-urban multiple livelihoods has increasingly shifted towards the urban end; Fourth, there has been a developing trend of urbanization driven by housing purchases in both migrants' places of origin and destination. The study also identified issues and challenges in the process of transformation in the forms of population migration and mobility, including: First, there is a lack of sustainability in in situ urbanization promoted by return migration; Second, urban-urban migration are highly concentrated in a few provinces of the eastern region; Third, there are still many obstacles for the urbanization of rural migrants based on their hukou transfer. Finally, the article puts forward some policy recommendations from the perspectives of the construction of multi-level spatial system of urbanization of the floating population, the transformation of urban governance mode, and the promotion of the capacity for sustainable development of small towns in central and western regions.
城镇化中后期中国人口迁移流动形式的转变及政策应对
DOI:10.18306/dlkxjz.2020.12.008
[本文引用: 1]
人口迁移流动形式是构成人口迁移流动特征的一个关键要素。在中国进入人口城镇化中后期后,准确判断和把握人口迁移流动形式的转变是一项十分重要的工作。论文基于人口迁移流动形式转变的相关理论与国际经验,考察现阶段中国人口迁移流动形式转变的进程和特点及由此产生的问题与挑战。研究发现,中国人口迁移流动形式已发生转变,并突出表现为人口回流现象不断增多、省际和省内人口迁移流动此消彼长的趋势日益明显;城—城流动显著增加,人口的城-城间流动将渐成常态化;流动人口户籍城镇化进程开始加快,其城乡两栖生计的重心向城镇转移;住房驱动下的流动人口就地、异地城镇化渐成趋势等。同时,人口迁移流动形式转变过程中面临着人口回流推动的就近就地城镇化发展可持续性不足;城—城流动向东部少数省市聚集的态势明显;以户籍城镇化主导的农业流动人口市民化面临多重障碍等问题与挑战。最后,从流动人口城镇化的空间载体构建、城市治理方式转变、中西部小城镇自我可持续发展能力提升等方面提出相应的建议。
Development difficulties and paths of towns and small and medium-sized cities under the rural revitalization strategy
乡村振兴战略下的中小城市和小城镇发展困境与路径研究
Spatial-temporal difference of "townization" of urban population in China
DOI:10.11821/dlyj020180497
[本文引用: 3]
In this paper, the urbanization of China's population was subdivided into "townization" and "cityization", and the indicators of "townization level" and "townization contribution rate" were adopted. From the perspective of different spatial scales and major function oriented zones, this paper conducted the system analysis on space-time disparity and influencing factors of the development of urban population in China from 1982 to 2015. The main conclusions included: (1) China's urban population's "townization level" and "townization contribution rate" continued to increase. In 2015, townization level was 41.8%, and the townization contribution rate was 55.1% during the period from 2010 to 2015. (2) The urbanization of China's urban population presented significant spatial and temporal differences. The townization-dominated counties and cities were mainly distributed in the central and western regions of China, accounting for more than 70% of the country's total land area. The cityization-dominated counties and cities were mainly concentrated in coastal urban agglomerations, and had a relatively small proportion in the national land area. (3) Looking into the future, China's urban population's "townization level" and "townization contribution rate" would increase steadily but slower and slower. It was necessary to strengthen the exploration of a differentiated development model of small towns based on the differentiation of major function oriented zones.
中国城镇人口“镇化”发展的时空分异
DOI:10.11821/dlyj020180497
[本文引用: 3]
将中国人口城镇化细分为城镇人口“镇化”与“城化”,采用“镇化水平”和“镇化贡献率”两个指标,从不同空间尺度及主体功能区视角,系统分析1982-2015年中国城镇人口镇化发展的时空分异及影响因素。主要结论包括:① 中国的城镇人口“镇化水平”和“镇化贡献率”在不断提升。2015年镇化水平为41.8%,2010-2015年期间镇化贡献率为55.1%。② 中国城镇人口镇化呈现显著的时空分异特征。镇化主导型县市主要分布在中西部地区,占全国国土面积的70%以上;城化主导型县市主要集中分布在沿海城市群地区,在全国国土面积中所占比例较小。③ 展望未来,中国城镇人口的镇化贡献率和镇化水平将稳中趋缓,应加强探索出基于主体功能区域分异的差异化小城镇发展模式。
The spatial distribution patterns and its determinants of in-rural migrants: A case study of Jiangsu Province
入乡流动人口的空间分布格局及影响因素研究: 以江苏省为例
Rural development and rural to urban migration in China 1978-1990
"Economic reforms since the late 1970s have brought about significant changes in rural China. A large number of surplus rural labourers have been released from the agricultural sector and there has been a massive transition of rural residents from agricultural to non-agricultural employment. These changes will be analyzed by examining the changes in the employment structure of rural residents.... It is found that town and country populations tended to move to towns at the intra-provincial level, but to cities at the interprovincial level. Out-migrants from cities tended to move to cities at both the intra- and inter-provincial levels."excerpt
Interprovincial migration, population redistribution, and regional development in China: 1990 and 2000 census comparisons
DOI:10.1111/j.0033-0124.2005.00479.x URL [本文引用: 3]
The robustness of China's migration and Heihe-Tengchong line
中国人口迁移分布的顽健性与胡焕庸线
Spatial statistics and regional types evolution of China's County-level floating population during 1982-2010
DOI:10.11821/dlxb201712002
[本文引用: 3]
County-level units, which contain both counties and county-level cities, are the key floating population regulating units for China's new urbanization policy. This paper examines the statistical definitions of floating population for the censuses in 1982, 1990, 2000 and 2010. According to the principle of geographic data transformation among different spatial scales, the numbers of both the in-migrants and out-migrants at county level are calculated for each census. And the county-level spatial database of floating population is also built up. Besides, this paper puts forward a modified composite-index method to identify six types of the regional types of floating population, namely, large-scale active net in-migration, small-scale net in-migration, large-scale active net out-migration, large-scale active net out-migration, active balanced migration and inactive migration. Using this method, we analyze the spatial pattern evolution of China's floating population. The main results are listed as follows. (1) The regional types pattern of floating population transferred from inactive domination into active domination and from relative equilibrium into high polarization. Many regions turned into active net out-migration types. Most of the floating population moved into just a few cities which belongs to active net in-migration type. There were only 51 large-scale active net in-migration cities, but they occupied 55.85% of total inter-county in-migrants in China. (2) The spatial pattern of China's floating population regional types also presented a polarized feature. The Yangtze River Delta urban agglomeration and Pearl River Delta urban agglomeration in southeast coastal China are the main in-migrant floating population cluster regions, while Beijing, Tianjin and other provincial capitals are also main migration destinations with a monocentric pattern. The active net out-migration regions are mainly located in regions south of the "Qinling Mountains-Huaihe River" Line to the southeast of "Hu Line", which became the largest population losing area in China. (3) Social-economy was the major factor affecting the distribution of floating population regional types. Administration factor also gradually became a leading factor.
1982—2010年中国县市尺度流动人口核算及地域类型演化
DOI:10.11821/dlxb201712002
[本文引用: 3]
县市是中国新型城镇化发展过程中调控流动人口的重要单元。本文系统梳理了1982年、1990年、2000年、2010年四期人口普查的流动人口统计口径,根据地理流数据的空间尺度转换原则,核算四期人口普查县市尺度的流入人口和流出人口,构建对应的流动人口空间数据库。并提出新的修正复合指标法,划分出6种流动人口地域类型,包括大规模净流入活跃型、小规模净流入活跃型、大规模净流出活跃型、小规模净流出活跃型、平衡活跃型、非活跃型,据此分析中国流动人口地域类型的演化格局。主要结论为:① 中国流动人口地域类型经历了从不活跃到活跃、从相对均势到高度极化的演化过程,大部分地区逐步转化为净流出活跃型,流动人口向少数净流入活跃型县市集聚,51个大规模净流入活跃型县市集聚了全国55.85%的流入人口。② 中国流动人口地域类型在空间格局同样呈现高度极化的演化过程,形成长三角地区、珠三角地区2个流入人口高度集聚区,京、津及其他省会或首府等大城市则呈现单核式吸纳流入人口,净流出活跃型在“胡焕庸线”东南侧的“秦岭—淮河”以南地区呈现大面积扩张,成为中国最大的流出人口源区。③ 社会经济因素逐步成为影响流动人口集疏的主导因素,行政等级因素的作用也愈发突出。
The ideological origins and geographical demarcation significance of Hu Huanyong Line
DOI:10.11821/dlxb202106001
[本文引用: 1]
In the early 20th century, China was faced with domestic crisis and foreign invasion, and the man-land contradictions were unprecedented fierce. Geographers pondered and explored the issues of national fortune such as China's population status, northwest exploitation and internal migration, thus China's population geography emerged as the times required. "The distribution of population in China" published by Hu Huanyong in 1935 is a symbol of maturity of China's population geography. The Hu Huanyong Line (also known as Hu Line) proposed in this paper, which he originally called the Aihui-Tengchong Line, is a significant geographical demarcation of China's population. The existence and stability of the Hu Line have been repeatedly verified by census data, and its scientific principles have also been revealed and explained by the academic circles from aspects of nature, economy, social culture, etc. This paper points out that grain and employment are the two hidden logics behind the Hu Line. The Hu Line is becoming a crucial national geographic demarcation, which has an increasingly essential impact on the cognition and analysis of China's national conditions. Recent research on the Hu Line has been widely extended in various fields and meanings, and there arose some amendments and adaptations of the line in practice. Under the influence of "Premier Li Keqiang's three questions", whether the Hu Line can be broken through has become an academic hot spot. This paper holds that it is more important to create more opportunities of the northwest region than to increase the share of population so as to balance regional development.
胡焕庸线的学术思想源流与地理分界意义
DOI:10.11821/dlxb202106001
[本文引用: 1]
20世纪早期,中国面临内忧外患、人地关系矛盾空前剧烈,地理学家对于中国人口国情、西北开发及国内移民等关乎国运问题的思考与探索,孕育了中国的人口地理学。1935年胡焕庸发表的“中国人口之分布”是中国人口地理学走向成熟的标识,文中提出的“瑷珲—腾冲线”即“胡焕庸线”,是中国人口地理的重要分界线。胡焕庸线的存在性与稳定性被人口普查等现实数据反复验证,其科学原理也被学术界从自然、经济、社会文化等方面加以揭示和阐释。本文指出食物与就业是胡焕庸线潜在的两大逻辑。胡焕庸线正在成为一条重要的国家地理分界,对认知与分析中国国情产生越来越重要的影响。近年来胡焕庸线的研究有了广泛引申,并衍生出多个领域、多种意义下的胡焕庸线,在应用层面上还出现了对该线的修正与变通。在“总理三问”的影响下,胡焕庸线能否突破成为一个学术热点,本文认为重要的不是增加西北人口份额,而是让西北地区获得更多发展机会,促进区域均衡发展。
Research on classification methods and spatial patterns of the regional types of China's floating population
DOI:10.11821/xb201010004
[本文引用: 1]
With the rapid increase of the number and influence of floating population in China, it is urgent to understand the regional types of China's floating population and their spatial characteristics. After reviewing the current methods for identifying regional types of floating population, this paper puts forward a new composite-index method and its further modification method consisting of two indexes simultaneously: the net migration rate and gross migration rate. Further, those methods are empirically tested by using China's 2000 Census data at county level. The results show: (1) The composite-indexes method is much better than the traditional single-index method because it can measure the migration direction and scale of floating simultaneously and in particular it can identify the unique regional types of floating population with large-scale immigration and emigration. (2) The modified composite-indexes method, by using the share of a region's certain type of floating population to the total in China as weight, can effectively correct the over- or under-estimated error due to the rather large or small total population of a region. (3) The spatial patterns of different regional types of China's floating population are closely related to regional differentiation of their natural environment, population density and socio-economic development level. The three active regional types of floating population are mainly located in the eastern China with lower elevation, more than 800 mm precipitation, rather than in the region with higher population density and economic development level.
中国流动人口地域类型的划分方法及空间分布特征
DOI:10.11821/xb201010004
[本文引用: 1]
随着中国流动人口规模快速增长和影响日趋深远,各级政府在制订经济社会发展战略、区域与城市规划等各类重大决策时,亟需准确地认识和把握中国流动人口的空间分布特征及不同地域类型。本文在综合比较现有流动人口地域类型划分方法优缺点的基础上,提出了综合考虑净迁移率和总迁移率的复合型指标及其修正方法,并根据中国第五次人口普查分区县的流动人口数据,运用以上多种划分方法实证研制出中国流动人口地域类型的多种划分方案,并进行了比较分析。结果表明:① 综合考虑净迁移率和总迁移率的复合指标法,可以同时测度区域流动人口的方向性与活跃度,兼具以上两种单一性指标法的特色和优势,特别是能清晰地分辨出区域流入人口与流出人口的规模均比较大的平衡型活跃区这种独特类型,具有显著的优势。② 进一步考虑份额指标的修正型复合指标法,能有效地消除因区域人口总量过小或过大而导致流动人口活跃度被高估或低估的偏差,划分结果更加符合实际。③ 中国流动人口地域类型的空间分布格局与其自然环境、人口密度及经济社会发展水平的区域差异关系密切。中国各类流动人口活跃区主要分布在位处第三阶梯和大于800 mm等降雨线的东部季风区,其人口密度及经济社会发展水平相对较高。
A study on population spatial distribution in China from the perspective of urban agglomeration
城市群视角下中国人口空间分布研究
China's changing population distribution and influencing factors: Insights from the 2020 census data
DOI:10.11821/dlxb202202008
[本文引用: 1]
Using data of the latest three decennial censuses, this paper systematically analyzes the overall spatial pattern, changing trends, and influence mechanisms of China's population distribution since 2000. The study reveals that the general population distribution pattern of "dense east and sparse west" in China has not changed, which is determined by the differences in natural geographic environments on the two sides of Hu Line. In the first decade of the century, population concentration was mainly found in the southeastern area, but it has been observed in all regions in the recent decade. Provincial capitals have become the winners of population competition and the advantages of population growth of provincial capitals have been further strengthened in the recent decade compared with 2000-2010. However, the administrative power-led effects of the increasing dominance of provincial capitals will gradually weaken with the development of their provinces. The regional differentiation of population changes is also apparent: coastal region gradually forms a dense belt of population and towns with solid population attraction based on the development of urban agglomerations; the northeast region almost turns to a complete population shrinking status; central provinces still compete fiercely for population based on their capitals; the population of Sichuan, Chongqing, and Guizhou has stopped the decline and returned to growth; and the northwest region faces the risk of population loss. In addition, this paper finds that the driving factors of regional population growth have gradually changed from economic factors to both economic and amenity factors, and the difference of amenities among regions may become an important factor for future changes in China's population geography.
2000—2020年中国人口分布格局演变及影响因素
DOI:10.11821/dlxb202202008
[本文引用: 1]
基于第五、六、七次全国人口普查数据,本文分析了2000—2020年中国人口分布的空间格局、集散态势和影响因素。结果表明,中国人口分布依然保持东密西疏的基本格局,胡焕庸线两侧的自然地理环境差异性决定了这一格局的长期稳定性;人口空间集中化趋势在21世纪初的10年内主要发生在东南半壁,但在2010—2020年间成为各区域的共同特征。省会城市的人口集聚能力持续增强,2010—2020年的优势更加凸显,但这种行政力量主导的首位度提升效应将随着全省发展阶段的演进而逐渐弱化。人口变动的区域分化明显:沿海城市群的空间连绵化逐渐形成了强吸引力、高承载力的沿海人口增长带,东北地区几乎转向全面的人口收缩,中部各省依托省会展开的人口竞争依然激烈,川渝黔地区普遍实现了人口的止降回增,西北地区则面临人口收缩风险。此外,区域人口增长的驱动因素逐渐从经济要素主导转为经济要素和舒适性要素并重,各地区舒适性的差异可能将成为影响未来人口空间格局变化的重要因素。
Spatial distribution of immigrants at County level and its determining mechanism in Hubei Province
湖北省县域迁入人口的空间格局及影响因素
Characteristics and spatial patterns of floating population in the Beijing-Tianjin-Hebei urban agglomeration under the background of new urbanization
DOI:10.18306/dlkxjz.2018.03.007
[本文引用: 1]
On 18 November 2017, a major fire broke out in Xihongmen Town, Daxing District, Beijing, where migrants are concentrated, killing 19 people and injuring 8 others. Of the victims, 16 were floating population from Shandong, Henan, and Hebei Provinces. In March 2014, the Communist Party of China (CPC) Central Committee and the State Council distributed the National New Urbanization Plan (2014-2020). The new urbanization plan attaches great importance to the realization of "urbanization of people." Clarifying the characteristics and spatial patterns of floating population is an important prerequisite for promoting the urbanization of people and one of the core issues of the new-type urbanization initiative. Based on the survey data of migrant population health monitoring in 2015, this study explored the floating population's age, education level, employment, income, expenditure, and other characteristics, as well as the spatial distribution pattern of the source and destination areas in the Beijing-Tianjin-Hebei urban agglomeration. The results show that the age structure of the surveyed migrant population was dominated by young and middle-aged workforce, showing a low level of education, predominantly agricultural population registration (hukou), and inter-provincial migration. The main reasons for the migration were employment and business activities. The income of the sampled migrants was mainly in the low and medium range, and the Engel's coefficient was higher than the average Engel's coefficient of the resident population. The sectoral distribution of the floating population was diversified, but mainly in the low-end commercial service industry. The proportion of those engaged in the wholesale and retail trade, resident service, repair and other service industries, manufacturing industry, and catering industry accounted for 70.7% of the total. The enrolment rate of health insurance was high, but the penetration of health education was low. In terms of the spatial distribution of inflow and outflow areas, the surveyed floating population mainly came from the provinces with similar geographical locations or large output of labor, such as Hebei, Shandong, Henan, Heilongjiang, and Anhui Provinces, which accounted for 70.75% of the whole surveyed floating population. The Beijing-Tianjin region was the major destination area of migrants, accounting for 37.76% and 29.11% of the total in the Beijing-Tianjin-Hebei urban agglomeration respectively. Therefore, this article proposes to strengthen the social security and vocational training for migrants to improve the ability of migrants to integrate into cities, improve the openness and inclusiveness of cities, and enhance the sense of attainment and happiness of the floating population.
新型城镇化背景下京津冀城市群流动人口特征与格局
DOI:10.18306/dlkxjz.2018.03.007
[本文引用: 1]
新型城镇化突出强调实现“人的城镇化”,摸清流动人口的特征与格局是促进人的城镇化的重要前提,也是新型城镇化的核心议题之一。基于2015年流动人口卫生计生动态监测调查数据,探讨京津冀城市群流动人口的年龄结构、教育水平、就业、收支情况等流动特征,以及流动人口的“源”(来源地)、“汇”(流入地)的分布格局。研究发现:流动人口年龄结构以青壮年劳动适龄人口为主,呈现出受教育水平偏低,户口类型以农业为主,并以跨省流动为主等特征;流动原因以务工经商为主,收入水平以低、中收入为主,恩格尔系数高于常住人口平均水平,行业分布多样化,但以中低端商业服务业为绝对主体,其中从事批发零售业、居民服务、修理和其他服务业、制造业以及住宿餐饮业所占比合计达70.7%。从流动人口的“源”、“汇”格局来看,流动人口主要来源于与其地理位置邻近省份和劳动力输出大省,如河北、山东、河南、黑龙江、安徽等省份,占总流动人口的70.75%;京津两市为流动人口的主要流入地,分别占京津冀城市群的37.76%和29.11%。建议加强流动人口的社会保障完善和职业培训教育,提升流动人口融入城市的能力,提高城市的开放性和包容性,增强流动人口的获得感和幸福感。
Spatial-temporal characteristics and influencing factors of population distribution and floating changes in Beijing-Tianjin-Hebei region
DOI:10.11821/dlyj201809012
[本文引用: 1]
Based on multiple types of data and using qualitative and quantitative analysis, the paper analyzes the spatial-temporal characteristics and influencing factors of population changes in Beijing-Tianjin-Hebei (BTH) region from the two aspects of population distribution patterns and population floating in long and short periods. The main results are summed up as follows: (1) BTH region presents an obvious population distribution characteristic, which is influenced by physiographical conditions and traffic location factors; Beijing-Tianjin region reflects the prominent circle features, which is due to social and economic development; and Hebei lacks a mature regional sub-center. From 2000 to 2010, the population of this region is characterized by a significant growth. (2) Over a long period of time, the vitality of population floating has increased and the pattern of population floating is more concentrated. Over a short period of time, Beijing and Tianjin have become the hottest cities of population inflow and outflow respectively in China. The population floating among Beijing, Tianjin and Langfang is the most active, while the Beijing-centered population floating is relatively active. (3) The main influencing factors of the spatial-temporal change of population over a long period of time include human capital accumulation, industrial structure, urbanization, initial economic development level, rurality and public services, geographical location, central city radiation and topographic relief. Holidays and seasons are the important superimposed factors that affect the direction and quantity of short-term population movements.
京津冀人口时空变化特征及其影响因素
DOI:10.11821/dlyj201809012
[本文引用: 1]
基于2000和2010年人口普查和社会经济数据、2015年12月13日-25日百度迁徙数据及地理空间数据等多源数据,从人口分布格局与流动格局两个角度,探讨近年京津冀地区人口时空变化特征及其影响因素。研究表明:① 2000-2010年,京津冀地区呈现出明显的由自然地理条件与交通区位因素影响下的人口疏密特征、社会经济发展影响下的京津圈层特征,河北则缺少发育成熟的区域次级中心,京津冀地区人口普遍增加,且以人口显著增加为主要特征;② 人口普查的长时段迁移数据分析发现,京津冀人口流动活力增强,人口流入格局更为集聚;百度迁徙的短时段数据分析发现,北京是人口流入和流出的高热城市,天津是人口流出的较热城市,北京、天津、廊坊三地之间人口流动最为活跃,且以北京为核心的城市间人口流动较为活跃;③ 人力资本积累、产业结构特征、城镇发展水平、基期的经济发展水平、乡村化指数、公共服务水平,以及地理交通区位和地形起伏特征,是京津冀县域常住人口长时段内集散变化的主要影响因素,而短时段人口流动方向与数量还受节假日与季节的叠加影响。从城市功能、场强、网络及其演化的综合视角,更有助于深化人口集疏变化的地理研究。
Spatial-temporal evolution of rural population outflow and its mechanism in China
DOI:10.13249/j.cnki.sgs.2020.01.007
[本文引用: 2]
Human is the key to social and economic development, and plays a decisive role in rural evolution. However, influenced by urban-rural dual structure, there are large population outflow in rural China, which makes the strategy of rural revitalization lack of human capital support. Therefore, to scientifically promote the implementation of rural revitalization in the new era, it is necessary to study the rural population outflow. Using datasets of 2000 and 2010 population census of the People's Republic of China by county, this research analyzed the evolution and spatial pattern of rural population outflow in China. Then it explored the mechanism of regional differentiation of outflow rate of rural population (ORRP), which was reflected by the ratio of rural hukou-registered population and rural residential population. Results showed that the development of rural population in China from 1978 to present could be divided into three stages i.e., slow development stage (1978-1995), massive outflow stage (1995-2014) and citizenship of agricultural transfer population (since 2014). From 2000 to 2010, ORRP at county level in China generally showed an upward trend, the centralization of rural hukou-registered and residential population declined obviously. From the perspective of spatial pattern, they all showed significant spatial clustering and positive spatial correlation. In 2000, there were 76.06% counties with ORRP ranging from 100% to 150%, and only 14.01% of the counties' ORRP were less than 100%, which were mainly located in Qinghai-Tibet Plateau, Xinjiang and the border areas of northeast China. By 2010, the proportion of counties with ORRP less than 100% fell to 5.20%, concentrating in Xinjiang, and there were also a few counties in Qinghai-Tibet Plateau and Northeast China. Based on pre-selected influencing factors, estimated results of spatial error model (SEM) indicated that elevation, per capita GDP, urban-rural income ratio, proportion of primary industry, urbanization rate, road density, educational attainment and per capita investment in fixed assets were positively correlated with ORRP at county level, while per capita farmland, per capita net income of rural households and ratio of rural employees showed a negative correlation.
中国农村人口外流的时空演化及其驱动机制
DOI:10.13249/j.cnki.sgs.2020.01.007
[本文引用: 2]
以农村户籍人口和常住人口及两者表征的农村人口外流率为研究对象,利用“五普”和“六普”数据探讨了中国农村人口外流的演化及其空间格局,在预选取影响因素的基础上,基于空间计量模型剖析了县域农村人口外流率的地域分异机制。结果显示:农村人口发展演化可划分为缓慢发展阶段、大量外流阶段、农业转移人口市民化发展阶段3个时期;全国县域农村人口外流率呈现出程度不断加深的态势,农业户籍人口和乡村常住人口的集中度下降明显,并呈现出明显的空间聚类和空间正相关性;平均海拔、人均GDP、城乡居民收入比、第一产业占比、城镇化率、道路密度、受教育水平、人均固定资产投资与农村人口外流率呈现出正相关关系,而人均耕地面积、农民人均纯收入、乡村从业人员占比与农村人口外流率呈现出负相关关系。
Areal differentiation of inter-provincial migration in China and characteristics of the flow field
DOI:10.11821/xb200501012
[本文引用: 1]
The authors analyzed migration data of 2000 Census and discovered the areal differentiations of migration rates and the migration flow fields for different reasons in contemporary China. Internal migration in China reached a new era of high activity and high capability. The unbalance of migration rates among east, middle and west belts has been enforced gradually, proving that the "mid-belt subsiding" is a phenomena of society as well as economy. Within the three typical flow patterns, both convergence and radial migration pattern have developed which made the Peal River Delta a powerful convergence center, while convection between Northeast China and Shandong is disappearing. The Northwest is replacing Northeast as a new attractive area. If divided by Qinling-Huaihe and Heihe-Tengchong combined natural with human geographical lines, the migration field in China breaks into two "flow basins" of Southeast and Northwest. Priority of employment is getting greater in migration and market replacing planning acts the first driven force to migration and talent flow. The marriage migration directs mainly from southwest mountainous area to eastern rural area, which creates a "karst bride source" in Southwest China.
中国人口迁移的区域差异与流场特征
Changing patterns and determinants of interprovincial migration in China 1985-2000
DOI:10.1002/psp.668 URL [本文引用: 2]
The supply of local public goods and population migration: Empirical evidence from 260 cities at the prefecture level or above
地方公共品供给与人口迁移: 来自地级及以上城市的经验证据
Evolution of urban-rural integration in Huaihai Economic Zone from the perspective of spatio-temporal interaction
DOI:10.31497/zrzyxb.20200809 URL [本文引用: 1]
时空交互视角下淮海经济区城乡融合发展水平演化
Reflections and prospect of interactions between development zones and urbanization: A case study of Jiangsu
开发区与城镇化互动发展的反思和展望: 基于江苏的思考
The difference of crop diversity between migrant professional farmers and local peasant households and its influencing factors
DOI:10.18402/resci.2018.09.06
[本文引用: 1]
Crop diversity is an effective strategy for traditional small-peasant to cope with the impact of agricultural risks. The transition of agriculture driven by migrant professional farmers may be different from local peasant households’crop diversity. The purpose of this study aims to investigate the difference of crop diversity between migrant professional farmers and local peasant households and its influencing factors at farm household level. Based on survey data from 393 farmers’crop diversity in Nanjing City, Jiangsu Province in 2015, we established a Poisson regression model. Different from the previous studies, the current investigation was carried out at farmer level, the farmer is not only the household head but also the family member in charge of agricultural production. Furthermore, the crop diversity was valued more directly by crop kinds instead of diversity index. The result shows that several factors affected farm households’ crop diversity. First of all, compared with the local peasant households, the crop diversity of migrant professional farmers is 17% less than that of local peasant households. Moreover, crop acreage has a significant effect on crop diversity, crop diversity decreases approximately 2.7% with an increase of 1 hm2 of crop acreage. Besides, the age of farmers who are in charge of agricultural production, the agriculture land plot quantities of farmers who own, and the distance from peasants residence to the main city zone also have significant effects on crop diversity. Holding all other variables constant, the expected number of crop diversity increases by about 0.9% with an increase of the age of farmers, the expected number of crop diversity increases approximately 4.6% with an increase of 1 plot of agriculture land; the expected number of crop diversity increases approximately 0.8% with an increase of 1 km from peasants residence to the main city zone.
外来职业农民和本地农户种植多样性差异及影响因素研究
DOI:10.18402/resci.2018.09.06
[本文引用: 1]
种植多样化是传统农户应对农业风险冲击的有效策略,而外来职业农民驱动下的农业转型发展可能会与本地农户种植多样性存在差异。为分析不同类型农户种植多样性差异及影响因素,本文利用2015年在江苏省南京市通过农户问卷调查获得的393份有效样本数据,以农户种植作物种类数为指标测度种植多样性,采用Poisson(泊松)回归模型进行实证检验。结果表明:① 不同类型农户种植多样性存在显著差异,在保持其他变量不变的情况下,外来职业农民的种植多样性比本地农户少17%;② 种植面积是影响种植多样性的重要因素,种植面积每增加1hm<sup>2</sup>,种植多样性降低2.7%左右;③ 其它影响农户种植多样性的因素还包括农业生产决策者的年龄、农户地块总数和农户住地到主城区的距离:在保持其它变量不变的情况下,农业生产决策者的年龄每提高1岁,种植多样性提高0.9%左右;农户地块总数每增加1块,种植多样性提高4.6%左右;农户住地到主城区的距离每增加1km,种植多样性提高0.8%左右。
Interaction among population agglomeration, economic agglomeration and environmental pollution: A PECM model analysis
In order to coordinate development of population, economy, and environment, it is necessary to clarify the causal relationships among population agglomeration, economic agglomeration and environmental pollution. Based on the provincial data from 2007 to 2016, this paper uses the panel data unit root test, the panel cointegration test, and the panel error correction model (PECM) to generate the dynamic generalized least square (DGLS) estimation in order to explore the long-term and short-term causality among the three variables. The results show that for the short-term relationship, there is a one-way circular causal relationship among population agglomeration, economic agglomeration, and environmental pollution, while for the longterm relationship, these three variables demonstrate a double-circular causality. Based on the difference between the long-term and short-term causality, China should pay more attention to the development of regional economy, population urbanization, and environmental protection in order to realize the coordinated development of these three elements.
人口集聚、经济集聚与环境污染交互影响关系: 基于面板协整和PECM模型的分析
协调好人口、经济与环境的发展关系,必须厘清人口集聚、经济集聚与环境污染的因果关系。文章基于我国2007~2016年省级数据,运用面板数据单位根检验、面板协整检验以及面板误差修正模型(PECM)采用动态广义最小二乘法(DGLS)估计,对三者之间的长期因果关系和短期因果关系进行了研究。结果表明,在短期关系中,人口集聚、经济集聚与环境污染三者之间呈现单向环形因果关系;在长期关系中,人口集聚、经济集聚与环境污染呈现双向环形因果关系。基于长期和短期因果关系的不同,我国在制定长期规划和短期规划时应抓住侧重点,以期实现区域经济、人口城镇化、环境保护之间的协调发展。
