

1 引言
人口分布既是区域人口发展的历史积累,也是城市空间结构的重要组成部分。现代人口地理学格外注重人口结构变化及空间分布和地域差异的演化规律[1⇓-3]。自20世纪50年代开始,欧美学者对城市内部及边缘区的人口分布[4]、流动与迁移[5]、数量与密度[6]、城市化周期[7]等演化规律开展了大量实证研究,其中,人口密度作为反映区域人口分布的重要指标,成为西方国家制定人口发展政策的重要参考依据,并形成了一系列具有代表性的人口密度理论模型,如Clark模型[8]、正态密度模型[9]、单中心修正模型和多中心模型[10⇓⇓-13]等。在研究主题上,从侧重人口数量的时间序列变化,转向强调人口现象与人口发展过程的机理研究,如郊区化[14]、人口就业中心[15]、边缘城市[16]、居所流动性[17]等。
国内人口研究沿袭了欧美的分析框架和理论模型,将人口普查数据或迁徙数据空间化。从研究区域来看,主要聚焦于京津冀[18]、长江三角洲[19]、东北三省[20]等热点区域,或北京[21]、上海[22]、南京[23]、杭州[24]、深圳[25]、广州[26]等大中城市。在研究内容上,既注重探究不同城市发展阶段的人口密度模型与人口重心迁移[27]、人口分布的自相关性和变异性[28]、人口分布的演变特征[29]、人口规模预测[30]等,也关注“胡焕庸线”两侧人口发展功能区与东西部地区的人口时空分异特征[31⇓-33]。从研究结论看,各大城市不同发展阶段的最优人口密度模型有所不同,人口空间多中心化结构与趋势的结论不一。总体上,案例总结归纳多,演绎推理少,且多中心模型的优越性与普适性一直不能被证实[34-35]。既有跟踪性研究尽管充分演绎与剖析了城市人口增长与空间分布规律,但受限于案例城市的数据可获得性,研究数据主要基于1978年改革开放后的4次全国分区县人口普查数据或地级市人口抽样数据,时间跨度集中在1980—2010年,鲜有从长时间尺度刻画城市内部人口分布发展演变规律的研究,以致尚缺乏对中国城市人口时空分布特征的连续性解释。
1928—1937年南京作为中华民国首都,为加强城市管理,制定了《首都计划》,保存了完整的城市地区人口户籍资料。以南京为案例,通过获取精细尺度的户籍人口空间数据,开展近百年时间尺度的城区户籍人口分布研究,探究1928—2017年南京城市户籍人口时空演变规律,总结户籍人口格局的演进机制及方向性与阶段性差异,提出基于中心地理论的多中心人口密度模型假设,改进传统密度函数,为中国城市人口和空间结构研究提供参考。
2 数据与方法
2.1 研究区与数据来源
本文以南京市区为研究区。为保证空间单元与统计数据匹配,兼虑城市发展时序和区位关系,以对应年份的行政区划图为基础,构建对应年份的人口密度专题地图。区辖所、乡镇的边界数据来源于相近年份的《首都警察厅管辖区域图》《陆师学堂新测金陵省城全图》。其中,1928年南京市区范围为城墙外郭以内及江北的浦口地区,面积约157 km2。1934年南京市与江苏省划界,原属江宁县的燕子矶、孝陵卫、上新河3个乡划归南京市,市区面积扩大至466 km2。1949年、1953年、1965年与1936年行政区划范围相近,基本与2017年主城区范围保持一致(1982—2017年,根据城市发展水平划分出内城、主城、近郊、远郊4个圈层,5个年份的圈层划分不尽相同:1982年、1990年圈层划分基本一致,内城为明城墙以内,主城为鼓楼、下关、白下、玄武、秦淮的城墙以外区域及建邺、栖霞、雨花台紧靠内城的乡镇/公社,近郊为建邺、栖霞、雨花台其余乡镇/公社及原大厂、浦口两区,远郊为其他剩余乡镇/公社;2000年、2010年、2017年圈层划分一致,内城为明城墙以内,主城为明城墙—绕城公路之间,近郊为绕城公路—绕越公路之间,远郊为绕越公路以外。)。1982年、1990年、2000年、2010年、2017年行政区划调整幅度较大,尤其是对街道和乡镇的拆分合并,但市区范围无大幅度变动,面积约4733 km2。截至2017年底,研究区内城市户籍人口总计463万人,占全市的93.1%,主要涵盖包括现今鼓楼、玄武、秦淮、建邺、雨花台、栖霞、江宁、浦口、六合等9个区级行政单元(图1)。
图1
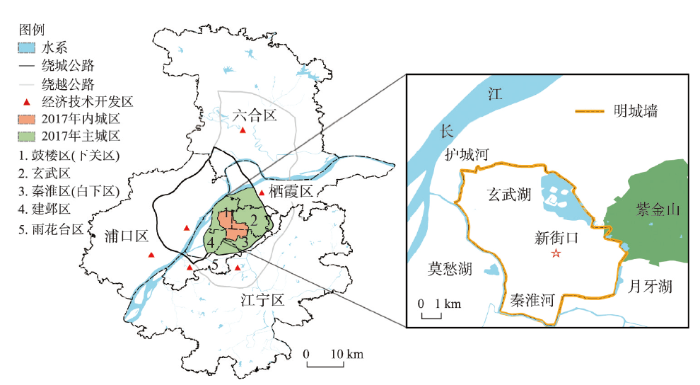
图1
2017年南京市区管辖范围
注:2013年白下区和下关区分别合并至秦淮区和鼓楼区。
Fig. 1
The urban area of Nanjing in 2017
1928年、1936年、1949年、1953年、1965年、1982年、1990年、2000年、2010年、2017年研究区域分别包含21个、92个、73个、81个、51个、166个、149个、120个、98个、85个分驻所/街道/乡镇/公社②(②文中各年份分驻所/乡镇/公社与2017年市辖区的对应关系为:1928年S1、S2区—秦淮区中部区域,1928年C1区—玄武区南部区域;1936年第三区—秦淮区中部区域,1936年第五区—建邺区及鼓楼区南部区域,1936年第七区—鼓楼区西部区域;1949年第二分局—秦淮区中部区域;1953年第二分局—秦淮区中部区域。)。1928年户籍人口数据来源于《首都户籍第一次调查报告》,1936年户籍人口数据来源于《民国二十五年南京市户口统计报告》,1949年、1953年、1965年户籍人口数据来源于南京市当年派出所统计年报,1982年、1990年、2000年、2010年常住人口数据来源于4次全国人口普查资料③(③文中人口统计指标主要是户籍人口,1982年前城镇人口是指市镇中的非农人口,1982年后城镇人口是指常住人口。),2017年城镇户籍人口数据来源于南京市公安局《人口及其变动情况统计年报表》。
2.2 研究方法
2.2.1 标准差椭圆与人口重心迁移
2.2.2 人口分布结构指数
人口集中指数和不均衡指数能衡量人口分布的均衡特征,其计算公式为[39]:
式中:U为不均衡指数;C为集中指数;n表示行政区划单元的数目;xi表示
2.2.3 空间插值
反向距离加权法(Inverse Distance Weighted, IDW)以插值点与样本点间距离的倒数平方为权重,通过对样本点的真实值加权平均,生成插值点的估测值,该模型有助于识别人口分布特征,其计算公式为[40]:
式中:n为样本点数量;Z(S)是插值点S的户籍人口密度估测值;Zi是样本点i的户籍人口密度真实值;di是插值点S到样本点i的距离。
2.2.4 单中心与多中心模型
表1 单中心人口密度模型及参数意义
Tab. 1
| 模型类别 | 模型名称 | 公式 | 参数意义 |
|---|---|---|---|
| 指数型 | Clark | a为城市中心人口密度理论值;b、c为人口密度衰减斜率;r为距离市中心的距离;D(r)为人口密度。 | |
| 幂函数型 | Smeed | ||
| 二次指数型 | Newling |
表2 多中心人口密度模型及相关假设
Tab. 2
| 模型类别 | 相关假设 | 数理公式 | 参数意义 |
|---|---|---|---|
| 模型(1) | 假设城市由多个单中心亚区组成,不同单中心的作用是互补关系,城市内某一点受所有单中心的影响,则多中心人口密度的对数为多个单中心共同作用之和。 | D为样本区的人口密度;n为中心数;ri为该区域与第i中心的距离;a、ai ( | |
| 模型(2) | 假设城市由多个单中心亚区组成,不同中心作用力介于完全依赖邻近中心(即单中心模型)和互补关系之间,则多中心密度为多个中心共同作用之和。 | ||
| 模型(3) | 基于中心地理论,强调主中心和其他次中心具有不同的功能。所有居民都需要到高级中心去获得高等级服务,而低等级服务在最近的次中心即可满足。对居民而言,重要的是主中心及最近的次中心。 |
3 南京城市户籍人口百年时空格局
3.1 户籍人口增长与城市化历程
通过梳理南京城市户籍人口发展进程,将1928—2017年南京城市户籍人口演变历程划分为5个阶段。总体来看,1928—2017年南京城市户籍人口数量呈扁“S”型阶梯式增长态势(图2),1928年户籍人口数为2017年的10.74%,年均递增2.54%。其中,在发展停滞时期Ⅱ(1936—1949年)南京城市户籍人口结构变动程度较大,数量呈减速衰退之势。在近代起步时期Ⅰ(1912—1936年)、道路探索时期Ⅲ(1949—1978年)、推进城市化时期Ⅳ(1978—2010年)、新型城镇化时期Ⅴ(2010—2017年)等阶段,南京城市户籍人口呈增长加速之势。
图2
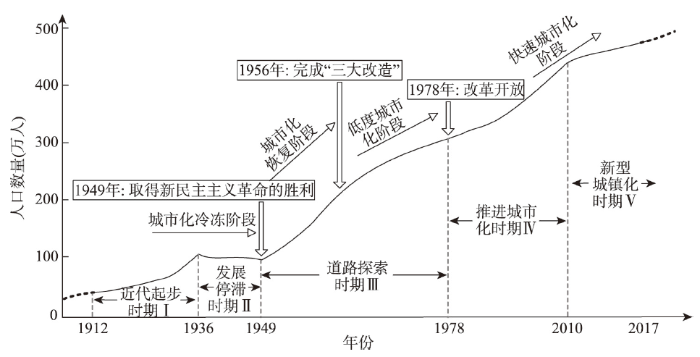
图2
南京城市户籍人口增长与城市化阶段划分
Fig. 2
Division of registered population growth and urbanization development stages in Nanjing
(1)近代起步时期Ⅰ(1912—1936年):南京都市区域最早产生于聚宝门④(④聚宝门始建于杨吴时期,曾是南唐国都江宁府和南宋陪都建康府的南门,明朝洪武二至八年(1369—1375年)扩建,今改名为中华门。)内。运送农产品、日用品的民船码头在城南水西门、通济门、中正街等一带集结,形成交易市场,便利的水运交通条件与良好的居住环境使得老城南的内秦淮河两岸成为城市发展的核心区。1929年《首都计划》中的城内新式“马路”交通干线建设付诸实施,使得城东、城北地区得以发展,进一步扩大了人口分布范围。1928—1936年南京城市户籍人口从49万人迅速增长至118万人。
(2)发展停滞时期Ⅱ(1936—1949年):沦陷期,南京人口发展与城市建设进程受到军事、政治因素制约而逐渐陷入低谷,经济停滞,人口衰减。抗日战争胜利后,国民政府还都南京,与低谷时期相比,南京城市户籍人口数量迅速回升至近90万人。居民仍大部分集聚在城南门东、门西及城中白下路、洪武路、建邺路一带,以空间拥挤、贫困集聚现象为表征的“棚户居住区”日益凸显。
(3)道路探索时期Ⅲ(1949—1978年):1949年中华人民共和国成立之初,南京作为中央政府直辖市,迅速进入恢复和整顿期。1949—1965年南京城市户籍人口从87万人增长至149万人,居民主要集中在鼓楼以南的老城区、中华门和城北下关地区。社会主义改造时期,确立了计划经济管理体制,南京在“重生产,轻生活”的指导原则下,城市性质由消费型城市转向生产型城市,逐渐建立了以户籍制度为基础的二元社会体制,形成了人口迁移的制度性屏障,抑制了该阶段南京城市户籍人口结构与数量变化。20世纪70年代起,南京人口出生率逐渐降低,但受原有人口增长惯性影响,户籍人口自然增长数量仍然较大。
(4)推进城市化时期Ⅳ(1978—2010年):1978年改革开放后,南京进入稳定发展期,工业化、城市化得到迅速推进。1982—2010年南京城市户籍人口从360万人稳定增长至447万人。在“多中心、开敞式”跨越发展与“都市圈”的城市发展思路推动下,建成区开始向外蔓延,区县政府驻地、近郊工业园区等地受城市规划指引,区域集聚规模效应显著,户籍人口不断聚集。内城发展历史悠久,基础较为稳固,得益于其完善的城市基础设施与文化底蕴,老城南地区(秦淮区、鼓楼区)继续作为城市的核心,对人口产生了独特的吸引力,继续保持较高的户籍人口数量与密度。
(5)新型城镇化时期Ⅴ(2010—2017年):南京已经建立了社会主义市场经济体制,南京内城用地结构发生显著变化,商业用地和居住用地明显增加。2010—2017年南京城市户籍人口增长为463万人。内城区、主城区、河西新城的户籍人口数量持续增加,“新街口—山西路”成为南京的新人口中心。
3.2 户籍人口时空格局演变
3.2.1 人口密度
图3

图3
1928—2017年南京城市户籍人口密度
Fig. 3
Registered population density of Nanjing from 1928 to 2017
3.2.2 人口重心
南京城市户籍人口重心逐渐从秦淮区迁移至玄武区(图4)。1928—1965年人口重心沿着秦淮区朝天宫街道、鼓楼区华侨路街道、鼓楼区湖南路街道,依次自南向北移动;1982—2010年人口重心始终在内城西北方向的玄武区玄武门街道内,平均迁移距离仅为0.45 km,说明城市户籍人口分布趋于稳定;2017年人口重心再次跃迁至玄武区新街口街道。1936—1949年、1965—1982年、2000—2017年期间人口重心的跃迁幅度较大。结合标准差椭圆分析结果来看(表3),各年份的户籍人口集聚热点区显著,主要分布在以秦淮河为核心的聚居区,并与外围人口次中心结合,形成形态各异的户籍人口空间结构,总体呈现向心式“大分散、小集中”的户籍人口分布格局。1928—1953年标准差椭圆长轴较长,扁率较大,稳定在150以上,户籍人口轴线特征明显;1965—2017年标准差椭圆长短轴差距逐渐缩小,扁率较小,在0~32间波动,户籍人口再分布的活跃程度低,说明城市户籍人口分布格局趋于均衡。标准差椭圆涵盖的中央核心区域主要涵盖了鼓楼区、玄武区、秦淮区、建邺区及雨花台区等紧邻内城的区域。
图4
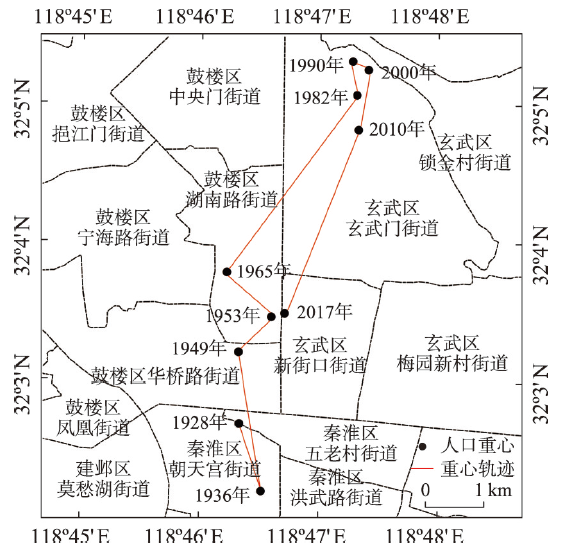
图4
1928—2017年南京城市户籍人口重心迁移轨迹
Fig. 4
Trajectory of registered population gravity center in Nanjing from 1928 to 2017
表3 1928—2017年标准差椭圆分析
Tab. 3
| 年份 | 1928 | 1936 | 1949 | 1953 | 1965 |
|---|---|---|---|---|---|
| 标准差椭圆扁率 | 158.89 | 157.18 | 159.89 | 149.82 | 4.72 |
| 年份 | 1982 | 1990 | 2000 | 2010 | 2017 |
| 标准差椭圆扁率 | 31.53 | 22.32 | 0.18 | 8.62 | 6.66 |
3.2.3 人口空间结构的嬗变
图5
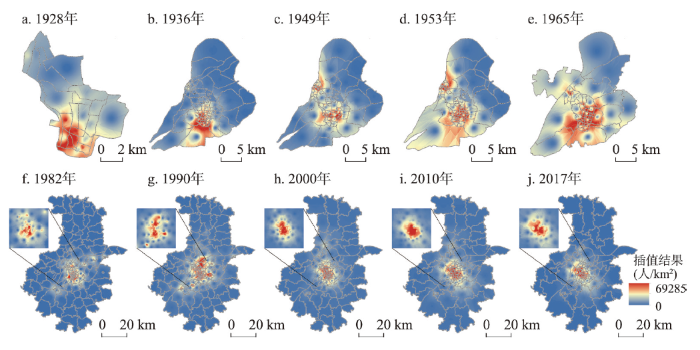
图5
1928—2017年南京城市户籍人口分布变迁过程
Fig. 5
Transition of the registered population distribution in Nanjing from 1928 to 2017
表4 1928—2017年南京城市户籍人口空间分异类型与特征
Tab. 4
| 年份 | 空间特征 | 空间结构 | 人口轴线方向 |
|---|---|---|---|
| 1928 | 人口主要分布在S1、S2区,集中在内秦淮河两岸 | 点状单中心 | 西北—东南向 |
| 1936 | 内秦淮河仍为人口主中心,下关地区的人口次中心开始萌芽 | 西北—东南向 | |
| 1949 | 形成“下关—内秦淮河”双人口中心格局 | 轴式双中心 | 西北—东南向 |
| 1953 | 夫子庙、鼓楼、下关等区域人口密集,形成“>”型的轴式双中心 | 西北—东南向 | |
| 1965 | 人口集中分布在新街口、下关等区域,人口集聚区自内城向外扩散 | 南—北向 | |
| 1982 | 人口集中分布在内城区、主城区和远郊外围中心镇区 | 飞地式复合多中心 | 西南—东北向 |
| 1990 | 人口在远郊的工业园区和镇区、近郊的经济开发区集中 | 西南—东北向 | |
| 2000 | 人口集中在内城区、主城区及近郊,圈层特征初显 | 放射圈层式 多中心 | 南—北向 |
| 2010 | 人口空间圈层性明显,内城区人口进一步集中 | 西南—东北向 | |
| 2017 | 形成以内城区、主城区为核心的人口集聚区,向心圈层性凸显 | 西南—东北向 |
从南京城市户籍人口空间演化的百年历程来看,影响户籍人口空间结构嬗变的关键因素包括:城市交通模式变革、政经制度变迁、工业化与城市化进程等。不同历史时期、不同发展阶段的主导因素各不相同。
在近代起步时期Ⅰ(1912—1936年)、发展停滞时期Ⅱ(1936—1949年),城市交通模式变革深刻地影响着南京城市户籍人口活动模式与社会空间形态,成为影响户籍人口空间结构的主导因素。这一时期南京市区的人口增长与城市拓展模式同中国近代新式交通创办变革阶段相互对应,以开辟中山路为标志,南京城市交通模式逐步发生变革,南京市区逐步从依靠下关港航运、码头,依托内秦淮河贸易的封闭式地域中心,转向开放式的商贸中心。交通模式变革对南京城市户籍人口流动和开放贸易起到重要的空间导向作用。沿长江的轴向扩张和以内城区为主体的凸向西北“触角”式外延并举的户籍人口分布格局初见端倪。户籍人口空间发展轴带的联系与辐射能力逐渐增强,城市现代道路开发与延展方向与户籍人口轴线转变方向一致,户籍人口空间结构也随之从以“老城南”为点状单中心的空间格局向“>”型的轴式双中心转变。
道路探索时期Ⅲ(1949—1978年),南京的政治地位发生根本性变化,城市规划的探索让城市人口空间历经变局,但稳定的人口自然增长与社会生产秩序的重构进一步强化了发展轴的联结强度,现代工商服务业、市政道路设施继续发展建设。经济腹地的拓展与交通格局的巨变,使得位于中山大道⑤(⑤中山大道是指以中山北路、中央路、中正路(今中山南路)、中山东路为骨架的城市道路系统。)关键结点的新街口成为新兴商业、文化与人口集聚中心,户籍人口核心集聚区呈组团式近域外延扩散,双中心人口空间结构逐渐孕育,形成近现代南京“一条轴线(中山大道)、两个中心(下关、新街口)”的城市空间结构。
推进城市化时期Ⅳ(1978—2010年)、新型城镇化时期Ⅴ(2010年至今),户籍人口空间格局伴随着经济制度变迁再次分化。一方面,交通与信息技术的发展使得居民依赖河流、水系的倾向性与必要性降低,南京城市轨道交通的修建使城市建设逐渐突破秦淮河、紫金山和长江三大自然屏障,城市建成区扩张,人口分布范围扩大。另一方面,经济制度的变迁对城市发展轴线、户籍人口分布格局、商业与住宅区的区位选择的引导作用愈发明显,户籍人口空间分异的市场区位指向性显著,成为此阶段影响南京城市户籍人口区际差异与变动性的主导因素。改革开放初期,下乡知识青年返城,成建制的单位入城,大都集中在环境较差的城市边缘区(棚户区、城中村)。《南京市总体规划(1981—2000)》提出“圈层式城镇群体”,进一步控制城区人口规模,1985年起逐步向城市外围3个沿江工业、交通城镇⑥(⑥大厂区位于主城区北部,西善桥街道、板桥街道位于雨花台区腹地,西临长江,北与主城区相接。)(大厂区、西善桥—板桥、栖霞—龙潭)、3个镇(六城镇、东山镇、珠江镇)以及两浦地区(浦口和浦镇)疏散。户籍人口分布格局在近郊外围率先响应,呈现出渐变离散的“飞地”人口集聚分布特征。确立社会主义市场经济体制改革目标后的经济转轨时期,南京经济开发区与工业园区迅速发展,近郊沿江镇区户籍人口迅速集中,在土地和房地产市场的组织和调控下,城镇的增长极效应达到顶峰。新型城镇化时期,产业结构转型升级和城市规划进一步引领人口进行“乡一城迁移”,南京依托高新技术产业开发区、浦口经济开发区、南京经济技术开发区、江宁经济技术开发区迅速发展,显现出以内城区、主城区及近郊经济开发区为核心区的人口集聚效应,近郊人口受到城市规划指引,再次增长集聚,而外围城镇人口飞地斑块逐渐消解。
4 南京人口密度模型分析
4.1 单中心模型
表5 1928—2017年单中心人口密度模型拟合结果对比
Tab. 5
| 年份 | Clark模型 | Smeed模型 | Newling模型 | |||||||||
|---|---|---|---|---|---|---|---|---|---|---|---|---|
| R2 | F检验 | a | b | R2 | F检验 | a | b | R2 | F检验 | |||
| 1928 | - | 15.802 | 24737.69 | -1.38×10⁻⁴ | - | 14.963 | 6.51×10⁴ | -0.172 | - | - | ||
| 1936 | 0.393 | 83.870 | 74343.61 | -3.46×10⁻⁴ | - | 56.447 | 4.95×10⁵ | -0.369 | 0.389 | 55.698 | ||
| 1949 | - | 28.983 | 32313.02 | -1.22×10⁻⁴ | - | 25.379 | 6.51×10⁴ | -0.172 | - | - | ||
| 1953 | - | 47.886 | 35309.42 | -1.04×10⁻⁴ | - | 25.379 | 1.28×10⁵ | -0.233 | - | - | ||
| 1965 | 0.403 | 99.135 | 41421.89 | -1.27×10⁻⁴ | 0.396 | 81.422 | 9.32×10⁴ | -0.166 | 0.301 | 21.914 | ||
| 1982 | 0.508 | 105.661 | 44440.94 | -1.07×10⁻⁴ | 0.356 | 80.938 | 3.54×10⁶ | -0.604 | 0.441 | 32.132 | ||
| 1990 | 0.598 | 123.829 | 40004.44 | -1.28×10⁻⁴ | 0.388 | 97.214 | 9.84×10⁶ | -0.750 | 0.579 | 46.860 | ||
| 2000 | 0.565 | 114.877 | 30416.01 | -1.29×10⁻⁴ | 0.348 | 78.284 | 4.03×10⁶ | -0.676 | 0.567 | 46.942 | ||
| 2010 | 0.534 | 109.441 | 29313.76 | -1.42×10⁻⁴ | 0.307 | 57.713 | 8.79×10⁵ | -0.518 | 0.324 | 40.553 | ||
| 2017 | 0.644 | 130.435 | 45374.13 | -2.16×10⁻⁴ | 0.494 | 79.797 | 4.51×10⁶ | -0.689 | 0.498 | 32.840 | ||
注:“-”代表拟合未收敛或回归系数小于0.3,表明结果不显著。
从3种模型的解释效力来看。Clark模型在历年的拟合分析中效果最好,R2基本保持在0.5~0.65之间,代表城市中心人口密度理论估计值a与实际人口密度峰值区数值相近,代表人口密度斜率的参数b不断减小,表明人口密度随距离的衰减趋势变缓。Newling模型的构建与解释以西方城市多中心空间结构和居住郊区化现象为基础:由于土地利用类型的置换变迁,城市中心人口密度出现低谷(图6c~6e),在曲线图像上呈现先升后降的趋势,并出现密度峰值的“火山口”,分析结果显示,Newling模型回归系数R2维持在0.3~0.6间,数值区间波动大,解释效力缺少鲁棒性,且参数a、b、c未能客观反映实际人口密度值和斜率变动,予以剔除。Smeed模型适用于描述包括城市腹地和边缘区在内的人口密度分布规律,然而事实上,经调整后的回归系数R2均低于0.5,结果显示拟合效果不佳。上述分析结果与冯健等的研究结论相似:在发展中国家,以负幂指数形式为代表的Clark模型更符合城市户籍人口分布规律[45]。
图6
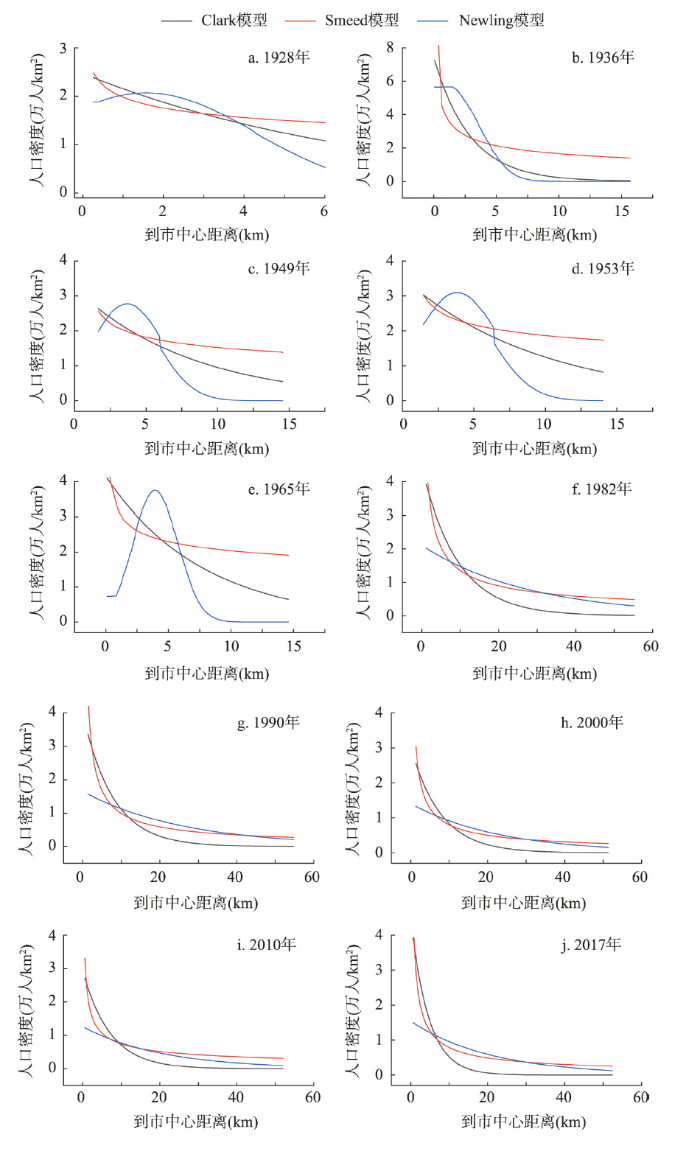
图6
1928—2017年南京单中心人口密度模型拟合对比图
Fig. 6
Fitting comparison of population density model from 1928 to 2017
城市中心到城市边缘区人口密度变化的单中心模型拟合二维图如图6所示,描述了南京城市户籍人口集聚区域和圈层特性。从各年份模型曲线变动趋势来看,1936—1965年Clark模型曲线斜率较小,拟合度不高(图6b~6e)。尽管Newling模型解释效力欠佳,但其正态分布函数的曲线样式(先升后降)表明南京在市域尺度上,人口存在强度不一的多中心,在外围已经形成次级人口集聚区,这与前文人口空间结构分析结果相一致。1982年的Clark模型显示(图6f),城市户籍人口集聚在距市中心22 km以内的地区(以外区域斜率趋缓),并随距离市中心距离增加,人口密度持续降低。1990—2017年各曲线拐点所处区间从22 km逐步缩小至18 km左右(图6g~6j),表明南京城市户籍人口集聚中心一直维持在内城区、主城区附近,并且呈现渐进式向城市内部收缩聚敛的态势。
综上,尽管西方学者选择了诸多描述空间衰减现象的函数模型来拟合人口分布规律,但对于以工业郊区化为导向,乡村城市化为特点,城市空间发展形态各异(同心圆式、组团式、轴带式变迁演替)的国内大都市而言,城市人口密度的峰值点(即曲线的峰值)并不唯一,人口密度并非沿着城市CBD向外圈层式单调对称衰减,可能存在潜在的人口次中心与其边缘区共同构成局部的人口高密度区域。通过分析单中心人口密度模型曲线和拟合结果可知,南京户籍人口分布的发展轴线具有方向性和异质性。
4.2 多中心模型
由于南京内城区和主城区的街道与近郊和外围乡镇的空间单元面积差距较大,若仅依据行政区划计算人口密度梯度,或基于经验判断选择城市或就业中心位置,会导致模型适用性降低。故参照国内外学者划分城市主次中心的方法,结合前文人口密度空间插值结果,选取密度梯度峰值最高的分驻所/街道为各年份主中心。次中心候选项依照如下原则选取[46-47]:① 1928年:距离主中心/各次中心间距离≥ 2 km,人口密度≥ 1.5万人/km2;② 1936—1965年:距离主中心/各次中心间距离≥ 2.5 km,人口密度≥ 5万人/km2;③ 1982—2017年:距离主中心/各次中心间距离≥ 2.5 km,人口密度≥ 3万人/km2(图7)。
图7
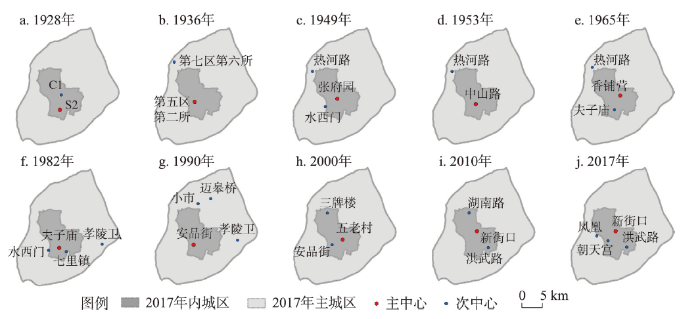
图7
1928—2017年南京城市主次中心的变化过程
Fig. 7
Transition of the main and sub-urban center from 1928 to 2017
基于人口多中心假设的模型数据均经非线性曲面迭代直至拟合收敛,达到10-9的chi-sqr容差值,分析多中心人口密度模型回归系数R2(表6)。从各个模型拟合结果、验核过程及适用性分析来看,经检验后的各个年份多中心模型R2均在0.4~0.8之间。基于模型(1)的回归显示多中心模型的适用性整体高于单中心模型,大部分中心符合距离衰减规律,对于1928年、1936年、2000年、2010年、2017年等5个具有人口聚集强中心的年份,模型解释力较强。基于模型(2)的回归在实际中较难实现,拟合不易收敛,无法识别与解释1949—1982年具有双/多人口中心的密度分布形态。因此在案例研究时,要对比、识别显著性较低的中心,否则可能导致模型参数摄动的鲁棒性产生误偏。基于模型(3)的回归较好检验了基于中心地理论的多中心模型假设,可以基本解释南京不同历史时期的人口密度分布,结果表明城市主、次中心的选择对密度模型有主导作用,拟合效果最佳。
表6 1928—2017年多中心人口密度模型拟合结果对比
Tab. 6
| 年份 | 模型(1) | 模型(2) | 模型(3) | |||||
|---|---|---|---|---|---|---|---|---|
| R2 | F检验 | R2 | F检验 | R2 | F检验 | |||
| 1928 | 0.714 | 52.226 | 0.680 | 34.766 | 0.657 | 36.015 | ||
| 1936 | 0.638 | 28.209 | 0.340 | 8.009 | 0.412 | 20.151 | ||
| 1949 | 0.498 | 49.352 | - | 21.057 | 0.563 | 101.162 | ||
| 1953 | 0.501 | 50.141 | - | 31.992 | 0.586 | 97.966 | ||
| 1965 | 0.413 | 62.352 | - | 17.063 | 0.621 | 99.155 | ||
| 1982 | 0.481 | 84.226 | - | 35.402 | 0.702 | 120.121 | ||
| 1990 | 0.471 | 82.790 | 0.699 | 100.587 | 0.648 | 103.264 | ||
| 2000 | 0.682 | 148.920 | 0.707 | 123.587 | 0.752 | 150.464 | ||
| 2010 | 0.610 | 139.568 | 0.604 | 69.045 | 0.776 | 143.275 | ||
| 2017 | 0.738 | 194.156 | 0.727 | 184.332 | 0.803 | 199.321 | ||
注:经Reduced chi-sqr的开方根缩减误差,“-”代表拟合未收敛或回归系数小于0.3,结果不显著。
从模型(3)的各年份回归系数变化趋势来看,1928—1936年R2从0.657降至0.412,显示多中心模型解释力下降,表明南京在“黄金十年”⑦(⑦黄金十年(Golden Decade)又称南京十年、十年建设,是指1927—1937年。此阶段的国民政府在政治、经济、外交、军事、文化、教育、边疆民族政策等方面取得了若干成就,整体为近代中国较高水平。)间,以秦淮河为核心区的人口单中心集聚程度显著上升。1949—1982年R2均大于0.5,拟合度较为一致,1982—2017年R2持续增大,从0.702稳步上升至0.803。通过分析回归系数结果的变动特征,可以将R2数值在1949—1982年向1982—2017年的突变下降跃迁、1982—2017年的梯度渐进上升,归因成距离衰减规律、异速增长效应、空间极化特性、区域边缘结构等4种空间区位法则的共同作用结果。
距离衰减规律、土地与城市户籍人口数量耦合变动的异速增长效应,影响人口分形特征,决定模型拟合效力。结合人口集中指数和不均衡指数测度户籍人口数量与城市建成区面积的异速增长效应(图8),1928—2017年两个指数曲线呈“W”型波浪式变动,且趋势一致,呈现先升后降,再稳步上升的态势。在数值特征上:1949—1965年人口集中指数和不均衡指数分别维持在0.7和0.02左右,处于历年最高数值区间,显示整体户籍人口分布的相对不均衡,表明在社会主义过渡期,乡城人口迁移空间自组织能力受计划经济体制规制,城市建成区的外延拓展速率与户籍人口分布蔓延态势趋同,工业、商业用地布局受内在秩序性规约,双中心人口结构趋于稳定。在变动趋势上:1965—2010年期间,人口集中指数从0.5142降至0.4866,不均衡指数从0.0217降至0.0086,表明南京土地城镇化明显快于人口城镇化。2000—2010年期间,人口城镇化率增加19.2%,而建成区面积翻倍,相较于建成区的大幅度扩张,户籍人口迁移的空间范围和户籍人口数量的增长幅度有限,户籍人口增长速度远低于土地开发速度。此时,以主城区、内城区为人口密度峰值区得以显现,在模型检验特性上呈现向心集聚式的距离衰减规律。在异速增长效应的促转之下,表现为趋向圈层式的多中心人口空间特征。
图8

图8
1928—2017年人口集中指数和不均衡指数
Fig. 8
Population concentration index and disequilibrium index from 1928 to 2017
空间发展规划理念的区域边缘结构、以秦淮河为核心区域的空间极化特性,影响城市功能布局,决定户籍人口空间分布。从历年人口主次中心的形成机制上来看,香铺营因紧邻南京市政府驻地与江苏省政府驻地,形成行政主中心;城南一带历来为南京繁华之地,延续商业和居住混合的传统城市中心人口集聚形态,形成商业主中心;孝陵卫镇因大专院校的迁入,形成科教次中心;七里镇、小市镇、迈皋桥镇等因工业企业的集聚,形成工业次中心。百年南京城市户籍人口的历史演变中,人口变动和城市演替模式以同心圆式与星状扩张为主。市场经济时期,政府与市场联合形成“增长联盟”,通过运用级差地租,推动内城区的城市更新,使得“江南六区”⑧(⑧“江南六区”是指长江以南、由绕城公路围合的主城区,主要涉及鼓楼、玄武、秦淮、建邺、栖霞和雨花台等6个区。)产生人口与资源的虹吸效应,内城区和主城区户籍人口绝对数量并未下降,城市中心区未经历衰败和激烈的人口空心化历程,传统的城市中心——秦淮河两岸,一直占据城市户籍人口的主中心地位。南京的工业郊区化也并非表现为户籍人口、各类业态从城市中心区跳跃式向近郊区的完全集中迁移,而是通过挖掘旧城潜力,拓展新区活力,呈现中心繁荣区与近域扩展式的郊区化(近郊化)并存的户籍人口分布格局。新型城镇化时期,仙林副城、江北副城、河西新城的户籍人口分布与变动协同率趋向一致,逐渐呈现主城和近郊扁平扩散的多中心化人口景观,多中心模型验核优势明显。
5 结论与讨论
5.1 结论
(1)1928—2017年南京城市户籍人口数量呈扁“S”型阶梯式增长态势与向心式“大分散、小集中”的户籍人口分布格局,以秦淮河为核心的人口集聚区一直是南京城市户籍人口分布的主中心。百年尺度南京城市户籍人口空间结构呈现点状单中心、轴式双中心、飞地式复合多中心与放射圈层式多中心等4个发展阶段。
(2)户籍人口自然增长和城乡人口迁移是南京城市户籍人口数量和结构变化的内生性动源,交通方式革新引导城市空间拓展和人口轴线的衍生,在推进城市规划和经济体制转轨过程中,通过改革户籍制度、变革生产体制、优化经济结构、产业战略引领,调整行政区划,不断重构城市户籍人口分布格局。
(3)单中心和多中心的人口密度模型的验核显示,基于中心地理论的多中心模型假设验核效果最优,符合城市户籍人口分布格局的识别特征。在单中心模型中,Clark模型解释力较强,在多中心模型中,模型(3)解释力较强。南京城市户籍人口分布格局可归因成距离衰减规律、异速增长效应、空间极化特性、区域边缘结构等4种空间区位法则的共同作用结果。
(4)城市户籍人口时空演化机制与城市触媒效应在南京城市化和城镇化不同阶段的空间表征不尽相同,内涵式增长和外延式扩张的城市发展模式导致南京户籍人口空间结构的演化呈现明显的异质性和多元性,近百年来内城区户籍人口集聚态势稳定,郊区化仍以近郊为主体,并非统一遵循从人口单中心转向多中心的发展趋势,单中心与多中心人口空间形态也非截然对立,而是伴随着人口与经济活动布局的变动趋于分散化,在传统的内城区附近形成了不同功能和等级的人口次中心。
5.2 讨论
近百年来南京城市户籍人口“单中心—双中心—多中心”时空格局演变历程(图9)是中国近现代城市转型的缩影。对于前工业社会的中国大城市而言,由于依赖大量城外物资和生活水源,通常在水运河道两岸形成高密度、混合居住的人口“单中心”。自古代开始历经两千多年发展,南京一直延续以秦淮河为核心的“强中心”人口分布格局。18世纪中后期,洋务运动肇始,城北下关开埠通商,使得沿江地区开始聚集大量人口。1929年《首都计划》编制完成后,通过引入近现代西方城市规划中单一功能分区的理念,南京开始逐渐摆脱古代都城建设的传统模式,迈向城市近代化发展道路,至此,古代南京城市人口重心一直在城南的旧有格局被打破。
图9
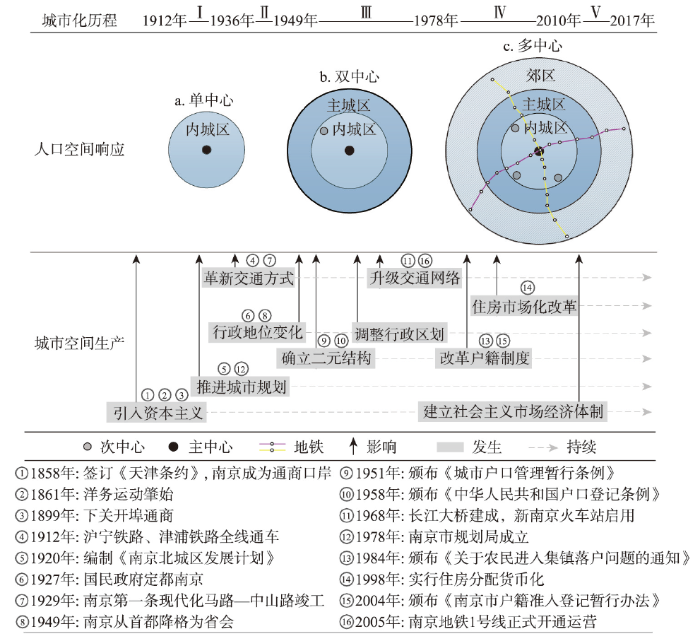
图9
南京城市户籍人口空间响应与演变机制
注:1920年下关商埠局编制的《南京北城区发展计划》是近代南京第一部城市规划。
Fig. 9
The responding and evolution mechanism of registered population in Nanjing during the past century
取得新民主主义革命胜利后,在计划经济体制下,南京处于低度城市化阶段的工业化发展时期,区域空间发展规划从属于城市工业发展计划,呈现出工业城市的城乡布局和空间肌理。行政中心的核心地位、单位大院的割据、商业网点的社会主义改造进一步固化了内城区户籍人口的空间集聚形态。由于计划机制主导下的中国城市化水平逐年下降,西方学者便为该阶段的中国城市贴上“反城市”(anti-urban)的标签,称之为“逆城市化”(de-urbanization)时期[48⇓-50]。诚然受二元户籍结构制约,人口的等级身份与空间秩序被定格,导致城市户籍人口机械增长停滞,但亦不可忽视同时期生育高峰带来的人口自然增长因素加剧了城、乡人口自然增长率的不均衡发展,形塑出中国城市化与现代化的停滞“假象”。研究显示,尽管南京城市户籍人口占总人口比例下降,但同期城市户籍人口自然增长态势和人口空间布局仍然稳中有进,进中育新。1978年后,在市场经济体制下,制度环境适应经济体制变革,城乡户籍人口管理政策⑨(⑨中国户籍制度改革具有渐进性与区域性的特征。改革首先从小城镇开始,然后向大中城市推进,再从点状的城市向面状的区域拓展。2003年江苏省人民政府批转《省公安厅关于进一步深化户籍管理制度改革的意见》,要求各省辖市制定统一城乡户口改革的政策,并组织实施。)由指令型转变为指导型,允许农民进城务工经商和在集镇落户的通告发布,使得南京逐渐打破了二元户籍桎梏,乡村人口与外来劳动力迅速转化,向内城区外围的中心镇区集中,以城镇为载体的乡村城市化⑩(⑩农村经济体制改革后,乡镇企业的发展和外商直接投资成为南京乡村城市化的主要推动力。)迅速推进,21世纪以来培育的以现代信息产业为骨干的经济开发区以及新城,规划建设在主城区附近,汇聚了大量商贸、金融等服务业从业人口,为城市生长注入了新的基因。后者经济体制与制度环境发生根本变化,城市生产功能逐渐弱化,城市消费功能渐进升级,南京城市户籍人口主次中心再次向中心城区集中。
南京历经百年的城市转型与制度变迁后,城市户籍人口的“强中心”空间格局依旧,“双中心—多中心”人口时空格局演变历程则是“强”计划的空间效应。1928—2017年南京城市户籍人口密度较高的街道和人口主次中心均分布在“江南六区”,“明城墙”地域范围始终是城市户籍人口分布与变动难以逾越的边界,南京城市户籍人口的“围城空间景观”凸显。这与美国大城市在工业化发展时期呈现出人口与就业“单中心—多中心”的演变规律以及逆城市化阶段的旧城区人口“弱中心”空间结构特征有较大不同。罗马、巴黎、伦敦等欧陆城市的研究显示,20世纪60—90年代,衰落的中心城区与无序的郊区化并存,20世纪末以来,城市进入再城市化阶段[51⇓-53],人口回流,空巢及年轻家庭、乡村人口向中心城区迁居。可见,中国传统城市人口居住中心与西方以城市规划用地功能为基础的中心商务区有本质区别。
本文对南京城市户籍人口的时空格局演变进行了基础性研究,对户籍人口分布格局的演变机制和空间效应进行了归纳总结,但研究尚需对交通沿革和制度变迁的演进作用的强度与方式进行定量分析。进一步的研究将使用常住人口数据表征改革开放后南京城市生活与生产空间结构的阶段性差异,以发展轴线(如沿公路、水系、地铁)为基础地域分析单元,测度各类空间效应、检验人口密度模型,深度剖析城市人口结构变化特征与机理。
参考文献
A review of population geography research in China
DOI:10.11821/dlxb201408012
[本文引用: 1]

China's reform and opening up period saw a revival of research into population geography. Chinese researchers have discussed the issues of population capacity and realized that the total population of China will reach its maximum capacity and result in many social problems. The key to solving these problems is controlling total population capacity, developing production and changing lifestyles. Faced with resource shortages and environmental pollution, Chinese researchers have proposed strategies for creating a fourth industry, feeding environment, promoting labor employment, reducing environment pollution, and promoting gracious social behavior, cultural consciousness and new community organization at different scales. In response to rapid industrial shifts and various population structures, the research field proposed the theory of balanced population growth, and when faced with land use and development issues they developed a regional development model through industry transfer, population migration and payment transfer. Other themes covered in this review include unbalanced regional development, functional zoning indicators, a partitioned model of population development, population analysis, quantitative index and modeling. Future work on population geography in China requires (1) a distributed geographic information system around census and population thematic data to promote the exchange of population data and measurement models; (2) strengthening surveys of different micro-scale communities and control of the active behavior of community systems under rapid population change to improve our understanding and interpretation of quantitative population geography; and (3) international population intelligence exchange to better understand the population evolution trends of different countries, and regulate and control the allocation of labor and talent. Last, population geography researchers in China should adopt interdisciplinary methods to maximize their contribution to national development and scientific research.
中国人口地理研究进展
DOI:10.11821/dlxb201408012
[本文引用: 1]
1978年以来是中国人口地理学复兴和发展时期。中国人口地理学工作者消化吸收西方经典人口学理论,讨论中国人口容量问题,认识到中国人口总量即将达到增长极限,强调控制人口总量、努力发展生产和转变生存方式是解决人口问题的关键。针对资源短缺和环境污染问题,提出了创建第四产业,实施环境抚育,推动劳动力就业,降低环境污染的策略。针对民生问题,提出深入开展微观社会调查,主动再造跨尺度的社区制度,推进对人口行为的尺度综合和文化自觉。针对中国人口快速转变和人口结构问题,提出了人口均衡发展理论。针对国土空间开发格局问题,提出了区域发展均衡模型,强调通过产业转移、人口流动、转移支付等手段,形成相对均衡的区域发展格局。针对区域人口发展不平衡问题,提出了人口发展功能分区指标和分区模型,初步实现了视野综合化、指标定量化、分析模型化,将人口地理学研究推向新高度。未来中国人口地理学研究,一要围绕人口普查和人口业务数据库,建设分布式人口地理信息系统,推动人口专题数据和人口计量模型共享,巩固和发展人口地理学定量化研究之特色;二要加强不同尺度的社区微观调查,主动调控人口快速转变情景下的社区行为,提高对人口地理学定量研究结果的理解和解释;三要加强国际人口情报交流,把握各国人口演化趋势,从经济全球化的分工合作体系的视角,合理配置中国劳动力资源和人才资源。中国人口地理学应坚持走跨学科的发展道路,努力在世界人口之巅辛勤耕耘,为国家发展、学科建设做出应有的贡献。
Review of population geography in the past Century
DOI:10.11820/dlkxjz.2011.02.001
[本文引用: 1]
Population geography is a study of the ways in which spatial variations in the distribution, composition, migration and growth of population are related to the nature of places. Long before the last century, there was no discipline called population geography. However, the early substantial relevant investigations of population geography were embodied in the traditional geography. In the first half of the 20th century, yet researches of population geography still did not become independent from human geography. The philosophy of anthropogeography of Friedrich Ratzel was inherited during the same period. After the Second World War, the studies of population geography progressively develop toward a subfield within geography. It was not until the 1950s was the science of population geography gradually established. Since then, the population geography as a branch subject has gained a persistent and fast development. Bulks of population matters are involved in the scope of population geography in the start of new millennium. Above all, some worldwide concerned and ongoing issues such as fertility and ageing, mobility and migration, and population and vulnerability have turned into hot themes lately. In the near future, population and difference, vulnerability, and spatial analysis will still be key interests of population geographers. To cope with the new challenges, the geographic scale and geographic dimensions of population problems should be emphasized, and the methodologies of spatialization of statistical population should be intensified simultaneously.
20世纪人口地理学研究进展
Growth principles of urban spatial structure
城市空间结构增长原理
Physics of population distribution
DOI:10.1111/j.1467-9787.1958.tb01366.x URL [本文引用: 1]
Spatial flows and competing central places: Towards a general theory of hierarchical interaction
DOI:10.1068/a220527 URL [本文引用: 1]
The spatial distribution and changing pattern of urban population density
DOI:10.1080/00221348608979033 URL [本文引用: 1]
Cellular automata and fractal urban form: A cellular modeling approach to the evolution of urban land-use patterns
DOI:10.1068/a251175 URL [本文引用: 1]
Urban population densities
DOI:10.2307/2981088 URL [本文引用: 2]
A review of monocentric urban density analysis
DOI:10.1177/088541229701200201 URL [本文引用: 1]
Aspects of lognormal function in the analysis of regional population distribution
DOI:10.1068/a210961 URL [本文引用: 1]
Derivation of the negative exponential model by an entropy maximizing method
DOI:10.1068/a020295 URL [本文引用: 1]
Less is more, more is different: Complexity, morphology, cities, and emergence
DOI:10.1068/b2702ed URL [本文引用: 1]
City growth as a leap-frogging process: An application to the Tel-Aviv metropolis
DOI:10.1080/00420980120084877 URL [本文引用: 1]
Population suburbanization in American metropolitan areas, 1940-1970
DOI:10.1111/j.1538-4632.1975.tb01040.x URL [本文引用: 1]
Living in two worlds: A review of home-to-work decisions
DOI:10.1111/j.1468-2257.2004.00250.x URL [本文引用: 1]
Spatial analysis of employment and population density: The case of the agglomeration of Dijon 1999
DOI:10.1111/j.1538-4632.2004.tb01130.x URL [本文引用: 1]
Spatial-temporal characteristics and influencing factors of population distribution and floating changes in Beijing-Tianjin-Hebei region
DOI:10.11821/dlyj201809012
[本文引用: 1]
Based on multiple types of data and using qualitative and quantitative analysis, the paper analyzes the spatial-temporal characteristics and influencing factors of population changes in Beijing-Tianjin-Hebei (BTH) region from the two aspects of population distribution patterns and population floating in long and short periods. The main results are summed up as follows: (1) BTH region presents an obvious population distribution characteristic, which is influenced by physiographical conditions and traffic location factors; Beijing-Tianjin region reflects the prominent circle features, which is due to social and economic development; and Hebei lacks a mature regional sub-center. From 2000 to 2010, the population of this region is characterized by a significant growth. (2) Over a long period of time, the vitality of population floating has increased and the pattern of population floating is more concentrated. Over a short period of time, Beijing and Tianjin have become the hottest cities of population inflow and outflow respectively in China. The population floating among Beijing, Tianjin and Langfang is the most active, while the Beijing-centered population floating is relatively active. (3) The main influencing factors of the spatial-temporal change of population over a long period of time include human capital accumulation, industrial structure, urbanization, initial economic development level, rurality and public services, geographical location, central city radiation and topographic relief. Holidays and seasons are the important superimposed factors that affect the direction and quantity of short-term population movements.
京津冀人口时空变化特征及其影响因素
DOI:10.11821/dlyj201809012
[本文引用: 1]
基于2000和2010年人口普查和社会经济数据、2015年12月13日-25日百度迁徙数据及地理空间数据等多源数据,从人口分布格局与流动格局两个角度,探讨近年京津冀地区人口时空变化特征及其影响因素。研究表明:① 2000-2010年,京津冀地区呈现出明显的由自然地理条件与交通区位因素影响下的人口疏密特征、社会经济发展影响下的京津圈层特征,河北则缺少发育成熟的区域次级中心,京津冀地区人口普遍增加,且以人口显著增加为主要特征;② 人口普查的长时段迁移数据分析发现,京津冀人口流动活力增强,人口流入格局更为集聚;百度迁徙的短时段数据分析发现,北京是人口流入和流出的高热城市,天津是人口流出的较热城市,北京、天津、廊坊三地之间人口流动最为活跃,且以北京为核心的城市间人口流动较为活跃;③ 人力资本积累、产业结构特征、城镇发展水平、基期的经济发展水平、乡村化指数、公共服务水平,以及地理交通区位和地形起伏特征,是京津冀县域常住人口长时段内集散变化的主要影响因素,而短时段人口流动方向与数量还受节假日与季节的叠加影响。从城市功能、场强、网络及其演化的综合视角,更有助于深化人口集疏变化的地理研究。
Change in distribution and growth shifts of population in the Yangtze River Delta and influencing factors
DOI:10.18306/dlkxjz.2020.12.009
[本文引用: 1]
Population distribution is an important indicator of regional development patterns. Also, regional coordinated development is closely related to the balanced distribution of the population. In the context of the regional integration of the Yangtze River Delta as a national strategy, the population distribution across the Yangtze River Delta has undergone significant changes. Using Kernal density analysis, gravity center analysis, concentration index, and shift-share analysis methods, this study examined the spatio-temporal change characteristics of the population in the Yangtze River Delta from 2000 to 2018, and explored the influencing factors as well as internal mechanisms of population growth shifts by utilizing quantitative methods. The main conclusions are as follows: 1) The shift in the population distribution trend led by some cities did not significantly change the imbalanced pattern of regional population distribution, and the increase in the concentration index indicates that the regional population concentration showed a steady growth trend. 2) The research based on shift-share analysis found that the shift in population growth pattern was mainly manifested in the acceleration of population growth in some underdeveloped areas. For example, Anhui Province was transformed into positive growth shift at the provincial scale. On the city scale, the positive growth shift dominated by core developed cities has changed to the positive growth shift dominated by some less developed cities. The spatial distribution of positive growth shift of municipal districts changed from the core areas to the peripheral areas. However, the population was still attracted to a few large cities and municipal districts. The diversified population growth shift trend characterizes the differentiated demands for future development strategies. 3) Economic factors, social development, and financial resources were important driving forces of population growth shift in the Yangtze River Delta. However, the temporal and spatial change of influencing factors shows that the formulation of future population balancing policies not only needs to be adapted to local conditions, but also should evolve through time. This research not only provides a reference for the formulation of relevant population policies, but also enriches the empirical findings on the spatial and temporal change of population.
长江三角洲人口分布演变、偏移增长及影响因素
DOI:10.18306/dlkxjz.2020.12.009
[本文引用: 1]
在长江三角洲区域一体化上升为国家战略背景下,论文运用核密度、重心、集中指数和偏移—分享等方法,研究2000—2018年长江三角洲人口时空演变规律,并采用定量方法探讨人口偏移增长影响因素。结果表明:① 部分城市主导下的人口集散趋势转变,并未显著改变区域人口不均衡格局,且集中度呈现稳步增长态势。② 基于偏移—分享法的研究发现,人口增长格局转变主要表现为部分欠发达地区人口增速加快,如三省一市上安徽省转变为正偏移增长、城市尺度上核心发达城市为主的正偏移增长向部分欠发达城市为主的正偏移增长转变、县域尺度上正偏移市辖区由核心区向边缘区的转移,但人口向少数大城市、市辖区集聚的态势显著,而多样化的人口偏移增长态势表征了未来城市发展策略的差异化需求。③ 经济因素、社会发展和财政水平等是长江三角洲人口偏移增长的重要驱动力,而影响因素的时空演变表明,未来人口均衡化政策的制定不仅要因地制宜,更要与时俱进。
Space pattern evolution of population distribution and the driving factors in northeast China
DOI:10.13249/j.cnki.sgs.2017.05.008
[本文引用: 1]
<p>Northeast China is considered as the important old industrial base. However the change of population distribution and driving factors were not clear yet under the circumstance of a new round of revitalization. Therefore, according to the population census data in 1990, 2000 and 2010, Lorenz curve, relative change rate of population density and Moran’s <i>I</i> are employed to analysis spatial pattern evolution of population distribution in Northeast China in 1990-2010, which consist of 176 counties. Subsequently, based on the partial least squares (PLS) regression method, 10 natural and social-economic factors are recognized to make quantitative analysis on spatial pattern evolution of population distribution in Northeast China. Major conclusion can be drawn as follows: 1) From the stand point of overall distribution pattern changes in nearly 20 years, average population density shows: Heilongjiang Province< Jilin Province<Liaoning Province. It is more obvious that ‘T’ type with multicenter of population distribution pattern which mainly to the provincial capital. 2) Population density experienced a changing process from comparative centralized to comparative dispersion. And zones which owned high population density occupy small land area, on the country, zones with low population density hold large land area. Population distribution presents remarkable and positive spatial autocorrelation. 3) From the perspective of changing type of population density, there are 80 counties’ population are increased and 96 are decreased, and it is obvious that polarization phenomenon of population distribution changing in Liaoning province. 4) Nature and social-economic are acting together on population density change, but the social-economic factors have impact on population density change more significantly than natural factors.</p>
东北三省人口分布空间格局演化及其驱动因素研究
DOI:10.13249/j.cnki.sgs.2017.05.008
[本文引用: 1]
东北地区作为全国重要老工业基地,在面临新一轮振兴机遇的形势下,人口分布的集疏变化及其驱动因素亟待细致梳理。根据中国第四、第五、第六次分县人口普查资料,运用洛伦兹曲线、人口密度相对变化率和空间自相关分析方法对东北地区1990~2010年、176个县域的人口分布空间格局演化进行深入分析,在此基础上,选取10个自然和社会经济指标,使用偏最小二乘法(PLS)对东北地区人口分布空间格局演化的影响因素进行定量分析,研究发现:①从总体分布格局变化特征来看,20 a来人口密度始终是黑龙江省②1990~2010年,东北地区人口密度经历了从相对分散到相对集中的变化过程,且人口密度高的地区所占土地面积小,人口密度低的地区占地面积大。人口空间分布呈现显著的正的空间自相关特征,即人口密度存在高高、低低集聚现象;③从人口密度变化类型来看,1990~2010年,共80个县域属于快速增加和缓慢增加类型,快速降低和缓慢降低类型的县域共96个,其中辽宁省县域人口密度变化“两极化”现象较为明显;④自然因素与社会经济因素同时作用于人口密度变化,但社会经济发展水平是人口密度变化的主要影响因素。
Study on spatio-temporal change and simulation of population in Beijing based on census data
DOI:10.11821/dlxb201410008
[本文引用: 1]
This study mainly aims to explore the spatio-temporal patterns and to simulate the future scenario of population change in Beijing based on the fifth and sixth census data at township level. The main contents and results were summed up as follows: (1) The resident population of Beijing increased with an average annual rate of 3.5% between 2000 and 2010, and the population increased by 0.6 million every year. Beijing was one of the megacities which were classified into the first range for their great amount of increased population. (2) There was an obvious circle structure in space. The population of inner city was almost stagnant; it had a rapid growth in the suburbs, and a high rate in the outer city. However, it had an increase only in the county seat and the key towns in the ecological conservation region of Beijing. (3) In terms of the CA/MAS scenario simulation analysis, in the spontaneous layout scenario, employment opportunities will be further agglomerated to the inner city, while population is suburbanized constantly. This will increase the city's commuter stress and aggravate the condition of city traffic block. When adjusting the parameters of employment and thus strengthening the guide policy of urban population living in working function, the problem of imbalance between industrial space and residential space in the urban internal space scale can be solved. At the same time, the formation of cluster of small towns can be promoted and urban commuter pressure can be reduced. Then comes the city’s radiation and diffusion effect. The authors suggest that, in order to optimize the spatial distribution of population in Beijing, more efforts should be made to coordinate the relationship between employment and residents. An important way is to accelerate regional coordinated development, and to plan multi-centers development as groups.
北京市人口时空变化与情景预测研究
DOI:10.11821/dlxb201410008
[本文引用: 1]
利用第五次和第六次人口普查数据,分析北京全域乡镇街道尺度人口空间变化格局特征,并借助CA-MAS模型对未来城市人口格局进行情景模拟,以期增进对北京人口时空动态的认识,为北京城市管理决策和宏观调控提供科学参考。研究表明:① 2000-2010年,北京常住人口年均增长率高达3.5%,年均增加近60万人,是同期我国人口增长最快的特大城市之一;② 北京全域人口变化在空间上具有明显的圈层式特征,集中表现为中心区人口增长几乎停滞、近郊区人口快速增长、远郊城市发展新区人口高速增长、远郊生态涵养区往往仅区县政府驻地及重点乡镇人口明显增长;③ 基于CA-MAS的情景模拟分析表明,在自发布局情景下,就业机会进一步向城市中心集聚,人口居住不断郊区化,这将增大城市的通勤压力,加剧城市交通拥堵状况,而通过调整就业参数,强化工作地居住功能的引导政策,则能在一定程度上解决城市内部空间尺度产城失衡的问题,可促进小城镇群的形成,有利于降低城市通勤压力,发挥城市的辐射和扩散作用。本文认为,为实现北京人口空间布局优化,应着力促进就业与居住相协调,推动区域间公共资源均等化,规划多中心组团发展。
Population redistribution and modeling of Shanghai city in the 1990s
20世纪90年代上海市人口分布变动及模拟
Population expansion and polycentric development of Nanjing city in a period of hyper-growth
DOI:10.11821/yj2013040014
[本文引用: 1]
Since the 1990s,China has been entering into a hyper-growth period,and urbanization in China is developing rapidly.Many large cities in China are also undergoing significant population growth and thus their spatial structures have been changed a lot. Previous studies showed that a few large cities had stepped into suburbanization process.For example,development in cities of Shanghai,Beijing and Guangzhou tends to form a polycentric pattern.However,case studies of other Chinese large cities have not been unfolded yet.It is very worth to explore more Chinese large cities for geographical scholars with the perspectives of population growth and spatial structure evolution.Based on existing theory and analysis method,this paper takes Nanjing city as a case study.The paper firstly analyzes the population spatial expansion process in Nanjing city by using geographical analysis methods,including street zoning method and circle division method.Then it simulates the polycentric development of urban population distribution through statistical models.The results show that:along with the total population growth,Nanjing's high population density areas have extended to inner suburban areas,forming a circled spatial expanding approach,which is the result of natural urban population growth.At the same time,the population densities of district-governments'seats and prioritized development areas in outer suburban areas also become very high,forming a fog-jumping spatial expanding approach.Population growth in these places has a close relationship with the government regulations and policies.The government-led population growth in urban China is different from that in edge city,suburban magnetic center and rural secondary employment center in the Western countries.Moreover,we also find that population spatial distribution in Nanjing has also been experiencing a tendency of polycentric development.Except the downtown area,Shanxi Road Street has become a population growth center,and the Wanda Plaza of Hexi New City Zone is becoming another population growth hot spot as well.This paper makes a good foundation forward to summarizing population spatial evolution theory in Chinese large city.Besides,it also provides some important experiential evidences for levels of government on optimization and regulation of Nanjing city's population distribution.
南京都市区人口空间扩张与多中心化
Multidimensional analysis of the polycentric urban spatial structure: A case of Hangzhou
多中心城市空间结构的多维识别研究: 以杭州为例
Fine grid dynamic features of population distribution in Shenzhen
DOI:10.11821/xb201004006
[本文引用: 1]
Shenzhen is the most densely populated city in China.In order to respond to emergencies,such as natural disasters,real time high resolution dynamic information of population distribution is needed.This paper analyzes the fine grid dynamic characteristics of Shenzhen population distribution,using the information of population density in respect of which the temporal resolution is an hour and the spatial resolution is a kilometer provided by the "Dynamic Monitoring System of Population Distribution Based on Mobile Stations".The mobile subscribers in Shenzhen total to 10.8259 million.The average population density is 5545 people/km2,and the maximum density reaches 165,000 people/km2.High density areas which have more than 50,000 people/km2 are mainly the business centers,custom ports,railway stations,and large residential communities.The value of the maximum population density depends on the size of grid used,for example the value of 1 km2 grid is about 18 times than the value of 1000 km2 grid.Some 50% of the population in Shenzhen is concentrated in 10% of the city\'s spatial area,and 60% resides in the areas where altitudes are between 50 m to 100 m.The building density and the road density on the grid are linearly correlated with population density,that is,1000 people are added when the building density increases by 1%,and about 2,000 people are added when the road density increases by 0.01%.The total population of a city is relatively stable during a period of time,the variation of which is commonly less than 4% and the daily variation is about 1%.Shenzhen is a typical immigration city,and the total population will decrease by 48% during the Chinese New Year because a lot of people will go back to their hometowns or traval around.This paper selects 9 typical grids to analyze the daily variation of the population and they are as follows:custom ports have a morning peak,and people going outbound crowd here at about 8 a.m.;bazaar areas have a noon peak;business centers have an evening peak with a net inflow/outflow over 20,000 people/hr;residential communities have a noon trough,and the density of population is always bigger on the weekends than on the weekdays;in the government offices and public service areas,there are fewer people on the weekends than on the weekdays and the population is decreased by 75% during the Chinese New Year;the factory area has a peak of population at about 4 a.m.because of the peak load shifting;outing area is more crowded during the holidays and weekends;in the out-of-the-way area,the daily variation of population is very little;and in the farming area,there is a morning trough of population at about 9 a.m.which corresponds to the traditional farming habits.
深圳市人口分布的细网格动态特征
Spatial-temporal evolvement of growth and distribution of population in Guangzhou in recent twenty years
DOI:10.13249/j.cnki.sgs.2004.06.641
[本文引用: 1]
It is well known that the growth and distribution of population have great influence on the city growth, which is more distinct in big cities in China after opening and reform policies were taken out. Furthermore, this phenomenon is more obvious in Guangzhou. Using the recent data of the third, forth and fifth census, the authors try to find some laws of the distribution of population in Guangzhou. First of all, the characteristics of population growth in Guangzhou are analyzed and the spatial models of population growth of different district are developed. Secondly, the distribution of population in Guangzhou tend to be regularization, equilibrium and the density of population change into more centers. Finally, the spatial-temporal models are developed out based on growth and distribution of population in Guangzhou.
近20年来广州市人口增长与分布的时空间演化分析
Evolvement of spatial pattern of population with Data at county level in Jiangsu province
DOI:10.11820/dlkxjz.2012.02.005
[本文引用: 1]
The core driving force of urban development is the growth of population, while the spatial-temoral structure of the distribution of urban population is one of the theoretical frontier issues. This paper, taking Jiangsu Province as an example, describes the spatial pattern and evolving trend of the diverse population of Jiangsu with data at county level since the 1990s through the related analysis of spatial autocorrelation analysis, population gravity center model and shift-share analysis, as well as other tools such as population density and unbalanced index. Based on three time discontinuity surfaces, with software platform of ArcGIS and GeoDA, some conclusions are drawn as follows. (1) Population density of Jiangsu Province has“low-south and high-north” features, which are corresponding with its economic development level. (2) There is certain spatial relevance on population distribution in Jiangsu. The similar areas cluster in space. And this trend is receding as time goes by. Because of the higher economic development level, people gathered to the Yangtze River downstream counties, to form a high-low area. Counties between high-high area and low-low area become a low-high area due to less radiation from developed cities. Densely-populated area is distributed along the Yangtze River. The general pattern remains relatively stable, and the counties in the high-high area firstly increase and then decrease while counties in the low-low area continue to decrease. (3) The population distribution in Jiangsu is imbalanced and such situation is enhanced. The population gravity center slowly moves to the northwest of Jiangsu since 1990. (4) The population of Jiangsu is growing at a slow rate in recent 20 years. Population concentration ability is not alike in the three regions of Jiangsu Province. Central Jiangsu is short of clustering people and the population concentration ability of Southern Jiangsu constantly strengthens but that of Northern Jiangsu weakens.
江苏省人口空间格局演化特征
DOI:10.11820/dlkxjz.2012.02.005
[本文引用: 1]
以江苏省为例,选取人口数及人口密度为研究指标,以县域为研究单元,通过人口密度、空间自相关、不均衡指数、重心移动及偏移—分享分析,描述20 世纪90 年代以来江苏省人口空间格局及其演变趋势。结果表明:近20 年来,江苏省人口密度有“南高北低”的特征,该现象与经济发展水平相对应;江苏省人口分布存在一定的空间关联性,在长江中下游各县市形成空间人口密度高的集聚区域,在苏北平原形成空间人口密度低的集聚区域,随时间推移人口集聚趋势不断减弱;江苏省人口呈不均衡分布状态且不均衡趋势加强,人口重心逐渐向西北方向迁移;江苏省人口增长速度在变慢,集聚人口能力在3 大区域之间有明显差异,苏中相对不足,苏南不断增强而苏北不断减弱。
Power spectra analyses of spatial auto-correlations of urban density: An application to the Hangzhou metropolis
DOI:10.11867/j.issn.1001-8166.2006.01.0001
[本文引用: 1]
<p>The standard negative exponential distance-decay relationship of urban population density, namely the Clark empirical law, <em>ρ</em>(r)=<em>ρ</em><sub>0</sub>exp(-<em>br</em>), is proved to be a correlation function reflecting the relation between the center of the city and the point at a given distance. Therefore the Fourier transformation of the urban density should give an index/exponent of power spectra such as <em>β</em>≈2 theoretically. However, when the fast Fourier transformation (FFT) is applied to the urban densities of the Hangzhou metropolis in 1964, 1982, 1990 and 2000 (according to Census time), it turns out to be that the β values vary from 1.44 to 1.80, not often approximating to 2. If the exponential function with power,<em>ρ</em>(r)=<em>ρ</em><sub>0</sub>exp(-<em>br</em><sup>σ</sup>), is employed to fit the urban density data of Hangzhou instead of Clark’s model, the results are the restraint parameter σ values vary from 0.45 to 0.78, not often approximating to 1. A semi-log relation between σ and β values can be expressed as <em>β</em>≈2+0.7 ln<em>σ</em>. Going a further step, the fractal dimension of self-similar curves, <em>D</em>, and Hurst exponent, <em>H</em>, can be given by means of the formulae <em>β</em>=5-2<em>D</em> and <em>D</em>=2-<em>H</em>. The conclusions can be drawn from the mathematical transformations and computations as follows: First, Urban density has a long-distance dependence, but it is passive/negative and tends to become weak with the lapse of time; Second, the action of urban population in space is localized as a city grows. Third, since the Clark model can be derived using entropy-maximizing method, the calculated results imply that the so-called entropy-maximization is only a developing tendency instead of a realistic state. Last but not least, the idea of action-at-a-distance has been introduced into the various urban simulations based on cellular automata (CA) and all that, but the localization of urban population activity means that the long-range effect should be reflected and revised in the light of amplitude-spectra analyses of urban density equation as an auto-correlation function.</p>
城市人口分布空间自相关的功率谱分析
DOI:10.11867/j.issn.1001-8166.2006.01.0001
[本文引用: 1]
从理论上可以证明标准的城市人口密度负指数距离衰减模型本质上是一种空间相关函数,基于这种思想对Clark模型进行Fourier变换,可以导出城市人口密度的幂次频谱分布,且功率谱指数理应为β=2<sup>±</sup>。负指数与幂指数的这种变换关系暗示了城市地理系统简单与复杂的辩证关系。借助中国杭州市4年的人口普查资料转换的平均人口密度分布数据对上述推论进行检验,发现β渐进式趋近于2但并不约等于2。将β值进一步换算为人口过程的分维D和Hurst指数H,结果表明:城市人口具有长程负相关作用,但这种空间作用显示明确的局域化倾向。目前的城市形态演化模拟几乎无一例外地引入了长程作用,根据杭州人口分布的局域化特征,有关地理长程作用的假设和应用有必要重新探讨。
Spatial distribution pattern of population and characteristics of its evolution in China during 1935-2010
DOI:10.11821/dlyj201608012
[本文引用: 1]
Spatial distribution pattern of population and its evolution with the change of time and space is a hotspot and core content for human geography. Under the influence of complex environmental factors like geology, geography, ecology, and resources, population and social economy in western and eastern regions of China exhibit a lopsided development pattern over a long period of time. With the proposed New Urbanization Construction and the Belt and Road strategy, the social economy in western China, or even the whole China, has opportunities and space for development. Under the circumstance, this study on population distribution in different periods and areas in China will provide basis and spatial cognition for the development of relevant sustainable development policies and measures. Population data is acquired from the national statistical yearbook and population census data in different periods, and further built up spatial joint with the county administrative boundary in different periods. The population density is calculated based on the population data and regional area, and revised according to the adjacent years. With the support of geographical information technology, the inverse distance weighted method is used for spatial interpolation of the population density. Because of spatial density and distribution for the sampling points, average population density replaced interpolated results in western China. The study depicts the east-west dividing line of population density and discrepancies of population density in different periods and areas during 1935-2010 using county-level Chinese census data from six stages (1935, 1964, 1982, 1990, 2000, and 2010) with the index of population distribution structure, the Gini coefficient of population density, the movement trace of population center of gravity, and spatial autocorrelation analysis. The results showcase the dividing line of population density and discrepancies of population density in different periods and areas during 1935-2010. Because of the influence of history, environment and economy, the characteristics of population distribution evolution in different periods and areas keep changing in this study. It is known to all that the people are mainly distributed in Southeast China with little area, and population is much sparse in Northwest China, but with the larger area. Even though the population distribution trend of balanced development keeps increasing, the spatial distribution pattern of population has not changed obviously in the whole nation. The Hu Huanyong Line can still be a good summary of the characteristics of population distribution in China. To the west of the Hu Huanyong Line, population density in several provinces keep increasing during 1935-2010, such as Gansu Province and Ningxia and Inner Mongolia autonomous regions. The number of areas with population density with more than 50 people per kilometer increases greatly in the three provincial units. Moreover, the trend transferred to northwest China during 1935-2010. At the same time, the population distribution has obvious spatial autocorrelations in China in the last 80 years. In spatial scale, the hot and cold spots for population distribution have obvious aggregation, with great spatial difference in the whole China. The High-High regions are mainly distributed in South and East China where population density is very high and economy is developing repidly. The Low-Low regions are distributed on both sides of Hu Huanyong Line, namely, Southwest China and Northwest China. The natural environment and living standard are very poor in these regions. The spatial difference of population distribution in the High-Low and Low-High regions is very obvious because of local natural geographical environment and economic development, and these regions are usually distributed around the High-High and Low-Low regions. Thus, it is possible to coordinate the development between eastern and western China. We should understand the connotation and denotation of the question put forward by Premier Li Keqiang based on the natural law and economic development strategy of China in the new period. Meanwhile, people-oriented awareness should be further set up, and the New Urbanization Construction can be used to raise urbanization levels in China, thus improving the standard of living and environment.
1935—2010年中国人口分布空间格局及其演变特征
DOI:10.11821/dlyj201608012
[本文引用: 1]
在自然地理和社会经济等因素影响作用下,中国东西部人口分布与社会经济长期处于不平衡的发展态势。采用人口分布结构指数、基尼系数、重心迁移、空间自相关等方法,以中国1935-2010年6期人口普查县级统计数据为数据源,实现人口密度分界线的空间刻画和中国人口分布的时空分析。结果表明:受社会历史、自然环境和经济条件的影响,中国人口空间分布的时空演变特征差异相对明显;尽管人口分布的均衡性发展态势不断增强,但总体空间格局并未发生明显的改变;胡焕庸线至今仍能很好地概括中国人口东南地狭人稠、西北地广人稀的空间格局,但该线西侧的甘肃、宁夏、内蒙古等人口密度超过50人/km<sup>2</sup>的区域面积呈现增长的趋势,且持续向西北扩张。
Prediction of China's population in 2020 and 2030 on county scale
基于分县尺度的2020—2030年中国未来人口分布
DOI:10.11821/dlyj201402010
[本文引用: 1]
选取1982年、1990年、2000年和2010年人口普查数据,运用Logistic模型系统预测了2020年和2030年中国分县人口规模,定量分析了未来中国人口分布的基本布局、各地区人口增减变化以及城市群人口集聚度变化。研究认为:①2020-2030年中国未来人口空间分布的总体格局不会发生根本改变,东南半壁人口比例会有所减少,西北半壁人口比例会有所增加,但增减变化在0.1%~0.3%之间;②2010-2020年中国有1641个分县单元人口将仍呈增加趋势,占地规模和相应人口都在全国3/4水平,人口增加仍是主要特征;2020-2030年中国人口增加的分县单元将大幅减少到598个,人口减少地区占地规模和相应人口将占3/5以上,人口减少成为普遍现象。③中国21个城市群地区人口总量将由2010年的7.81亿增加到2020年的8.68亿和2030年的9.17亿,相应的人口集聚度也将由2010年的1.99逐步提高到2020年的2.17和2030年的2.33,城市群地区人口集聚规模和集聚程度在逐步提高,人口集聚态势更加明显。
Spatial heterogeneity and its changes of population on the two sides of Hu Line
DOI:10.11821/dlxb201701012
[本文引用: 1]
Hu Line uncovers one of China's most important characteristics of population paper distribution: East is dense, while west is sparse. Different from most previous research, this paper examined the differentiation and changes of population distribution on both sides of Hu Line from a perspective of spatial stratified heterogeneity instead. Geodetector was employed based on the spatial database of China's census data of 1953, 1982, 1990, 2000 and 2010 to reconfirm spatial position of Hu Line and analyzed changes of spatial stratified heterogeneity of population between southeast and northwest sides of Hu Line in different periods. Changes of population distribution since the founding of New China were found and the reasons for these changes were discussed. Major findings include: (1) From the spatial stratified heterogeneity perspective, Hu Line could be improved and optimized, at least, in some periods. Although the ratio of total population on both sides of Hu Line has roughly been kept at 94:6 since 1953, spatial stratified heterogeneity of population between the two sides (the southeastern side: the northwestern side) increased when Hu Line moves to south slightly in 1953, 2000 and 2010, which means population distribution was more homogeneous within either southeastern or northwestern region and heterogeneity was more remarkable between the two regions. (2) Heterogeneity decreased gradually since the reform and opening up. We found characteristics of population distribution converged on the two sides, especially since the 1990s when convergence between the two sides became apparent. This finding is significantly different from the conclusion of "remain unchanged" from most literatures. The reasons why heterogeneity reduced were: pattern of population distribution on the southeastern side changed from relatively even distribution among cities before 1990 to agglomeration in a few huge cities after 2000, while the degree of spatial agglomeration of population decreased slightly after the reform on the northwestern side. These changes have been confirmed by the analysis from cumulative distribution function and Gini coefficient. (3) On the whole, the effect of economic factors on population distribution has become more and more important, while the effect of natural environment and institution reduced. Combined effect from economic development, natural environment and institution resulted in two opposite directions of changes of population spatial distribution on the two sides. It should be emphasized that although general effect of natural environment has decreased, some natural factors, such as Three Gradient Terrains, still have significantly influence on population distribution in China.
胡焕庸线两侧人口的空间分异性及其变化
DOI:10.11821/dlxb201701012
[本文引用: 1]
胡焕庸线作为人地关系的重要地理大发现之一,揭示了中国人口分布东密西疏的重要特征,是人文与经济地理学对社会的重要贡献之一。本文采用地理探测器等定量方法,以人口普查数据为基础,对胡焕庸线两侧人口分布的分异性特征进行了深入讨论,并尝试解释中国人口分布特征变化的原因及其机制。结果表明:① 胡焕庸线作为中国最重要的人口分界线仍基本保持稳定,但从空间统计学分异特征来看该分界线仍可进一步优化调整;② 胡焕庸线两侧内部人口集聚模式发生着明显变化,东南半壁人口分布由改革开放之前和初期的相对均衡状态,转变为以长三角、珠三角等少数区域为中心的集聚模式;而西北半壁人口分布的集聚程度则趋于下降;③ 从人口空间分布的影响因素看,尽管总体上,经济发展类因素对于人口空间分布影响不断增强,但三大阶梯等自然地理本底条件依然对中国人口分布有着重要影响。
Research progress on population geography in China in recent 40 years: A cross-disciplinary perspective
DOI:10.18306/dlkxjz.2017.04.008
[本文引用: 1]
This article reviews the progress of population geography in China since the 1980s. The review results suggest that contrary to the common perception of its decline and marginalization in the field of geography, tremendous progress has been made in population geography in China since the 1980s. Population geographers have made significant contributions to the understanding of a wide range of population issues from geographical perspectives, including migration, urbanization, population distribution, the relationships between population, environment and resources, aging, marriage patterns, and migrants' crimes, although such contributions often did not become visible in the geographical circle. Furthermore, population geographers have played an indispensable role in revitalizing population studies in China and forging its links to human geography, occupying an important position in this multi-disciplinary field. Population geographers' contribution to the areas of migration and urbanization research has been particularly significant, reflected in their leading roles in these research areas. This review demonstrates that as latecomers in the field of population studies, population geographers in China have gone through a process of catching up and increasing engagement with developments in social sciences and increasing interaction with social scientists since the 1980s, and have benefited greatly from this process. However, there is a tendency for population geography to be increasingly alienated from the main stream human geography, a phenomenon similar to but not exactly the same as Anglo-American geography in the late 1990s and early 2000s. The article argues that population geography is only half way in the course to forge the links between population studies and human geography, and it needs to return to geographical sciences to create a healthy and balanced identity between population studies and human geography, and promote its further development in a multi-disciplinary field.
近40年来的中国人口地理学: —个跨学科研究领域的进展
DOI:10.18306/dlkxjz.2017.04.008
[本文引用: 1]
本文对20世纪80年代以来中国人口地理学的发展进行了全面综述。尽管近年来中国人口地理学在地理学科领域给人留下的是萧条、甚至被边缘化的印象,但从跨学科的角度看,该学科还是取得了巨大进展。人口地理学者在复兴中国的人口学研究中发挥了不可或缺的作用,并在这一跨学科研究领域中占据了重要地位。人口地理学者从地理学的视角出发,在人口迁移流动、城镇化、人口分布、人口与资源和环境之间的关系、老龄化、婚姻模式和移民犯罪等众多人口问题的研究上作出了重要贡献,尤其是在人口迁移流动研究和人口城镇化若干问题的研究中占据着领先地位。中国人口地理学者自20世纪80年代以来与社会科学领域学者间的交流互动不断增加,在促进学科发展的同时,也出现了一种逐渐偏离主流人文地理学的倾向;今后,中国人口地理学应更多地回归地理学领域,在人口学和人文地理学两个领域间寻求健康、平衡的定位,以促进其在跨学科领域中获得进一步发展。
Spatial agglomeration and evolution of urban population in China
DOI:10.11821/xb200810004
[本文引用: 1]
The increasing urban agglomerative growth and urban interactions has been a conspicuous feature of urban development in China since the 1990s. This paper makes an analysis on the spatial agglomeration and evolution of urban population in China, 1990-2005. The spatial data in this study are the cities and towns population of 451 cities in 1990, 662 cities in 2000 and 634 cities in 2005. Moran's I, one of Exploratory Spatial Data Analysis (ESDA) techniques, is the main method, and Moran's I statistics are obtained with the usual 5% significance level in this paper. In order to investigate the rationality of the empirical results, the transition probability matrices are applied to test its robustness, then the results are visualized by ArcGIS 9.0 soft in the research. The main conclusions are as follows: (1) The findings for the global spatial agglomeration of urban population are the existence of positive effect. Though the positive effect of the global spatial agglomeration is not strong, it is more or less increased from 1990 to 2005. On the other hand, the law of the local spatial agglomeration is obvious with a spatial agglomeration of a "T-shaped" pattern or along the main railroad lines, indicating that evolution of spatial structure of urban system has been optimized since 1990. (2) The diversity between HH spatial agglomeration of urban population in the East Zone and the LL ones in the Middle and West zones shows significant imbalance, while its changes show the imbalance had an extended trend during the 1990s and was mitigated in a way after 2000. At the same time, the effect and the changes of spatial agglomeration also suggest that the urban regions in the East Zone represent an integrative development while the ones in the Middle and West zones tend to the polarized development or less harmonious ability as a whole. (3) Furthermore, both different urban regions and the intra-urban regions have distinct state and changes of spatial agglomeration, which manifests that the spatial disparity is reflected not only between regions but also between intra-urban regions. The empirical results also show that the influencing scope of spatial agglomeration has expanded and the state and location of urban agglomeration has changed. (4) To a certain extent, the feature and its change of spatial agglomeration of urban population accord with the functions of market forces, economic development, construction of transport infrastructure, China's spatial development policies and so on.
中国城市人口的空间集聚特征与规律分析
Population density functions of Chinese cities: A review
DOI:10.11820/dlkxjz.2010.08.010
[本文引用: 1]
Researches on distribution and modelling of urban population density exist vastly in English literatures in the discipline such as urban economics, regional science and urban study. Substantive studies reveal that as urban develops,distribution of urban population density evolves from monocentric to polycentric, and functions which can describe urban population density also vary from simple negative funcitons to modern complicated functions. In recent years, researches on population density function of Chinese cities enriched. Most studies focus on large cities like Beijing and Shanghai. Some conclusions from those studies are consistent with the findings from foreign cities. (1) Monocentric population density functions can describe population density distribution of Chinese cities well. (2) The expontenial denstiy function also fits the population densiy distribution in most chinese cites. (3) The density gradient is getting small and the city-center intercept drops over time. (4) Multi-centric functions can fit the density distribution in some big cities like Beijing and Shanghai. Those findings reveal that population suburbanization of Chinese cities develops rapidly, and the spatial structures of Chinese cities experience great changes from compact to decentralized. Studies on Chinese cities have some shortcomings. Most studies are confronted with poor quality data. There are fewer studies on cities. In the future studies, GIS should be applied to obtain high quality data, and research method should be enriched. Comparable studies or regional studies should also be launched.
中国城市人口密度分布模型研究进展及展望
Challenges to the monocentric model
DOI:10.1111/j.1538-4632.1993.tb00275.x URL [本文引用: 1]
Evolvement and comparative analysis of the population center gravity and the economy gravity center in recent twenty years in China
DOI:10.13249/j.cnki.sgs.2001.05.385
[本文引用: 1]
This thesis adopts production value of population, GDP, industry, agriculture and the tertiary industry and data of expenditure in recent twenty years in every province, every district, every city, and figures out the coordinate of gravity center of each years. It quantitatively express developing evolvement of population, GDP, industry, agriculture, the tertiary industry and the consumption center of gravity. On the basis of the result, it analyses the developing evolvement and relation of China population and region discrepancy of economic developing. From the developing evolvement of gravity center we can draw a conclusion: the discrepancies between east and west in China existed twenty years ago, and the population gravity center slowly moves to southwest in China in recent twenty years; on the whole the movements of GDP, industry, the tert iary industry and the consumpt ion gravity centers show to southeast. Against the geometry center in China: on the whole the region discrepancy in China is extended; against the population gravity center: between east and west take on imbalance developing, while between south and north tend to balance; but the change of the agriculture gravity center shows irregularity. The thesis simply analyses driving gene of the developing evolvement of each factor.
近20年来中国人口重心与经济重心的演变及其对比分析
Several fundamentals in implementing spatial statistics in GIS: Using centrographic measures as examples
A review on the Methodology of scaling with geo-data
DOI:10.11821/xb200502011
[本文引用: 1]
The ability to change scale is one of the main development topics in GIS and RS. GIS and image processing systems have offered some tools for multi-scale approaches. But the capabilities are limited. Scaling of multi-scale Geo-data is one of the suitable methods to deal with this problem. In this paper, the detailed review was done by comparing different methods in different research areas. Areal interpolation is the most important way to solve the scaling problems in GISci. And sociologists and economists have developed the small area statistics to solve the problem of the changing of the statistical units. And the review shows that there are some similar principles in different methodologies, and each one has its special pivots.
地理数据尺度转换方法研究进展
Population change and spatio-temporal distribution of China in recent 300 years
Based on the correlation theories of population geography, this study set 300 years as the time scale, took provinces as spatial units, and researched into the quantitative change, the temporal and spatial pattern of China's population. Using the revised population data of 286 time phases of Qing Dynasty, the Republic of China and new China, the study established 1724, 1767, 1812, 1855, 1898, 1936, 1982 and 2009 as 8 typical time sections. Analysis methods included unbalanced coefficient, concentration index, gravity center and spatial autocorrelation. The results showed that: (1) The population of China in recent 300 years presented a fluctuating rising trend. According to the feature of the growth curve, 5 stages could be identified, namely relatively rapid stable growth period, rapid wavelike reduction period, slow steady growth period, disordered undulate growth period and sharp wavelike growth period. (2) China's population in recent 300 years gradually tended to be evenly distributed; the population gravity center moved in a narrow range, generally shifting along the route of south-west, south-east, north-east, and north-west. (3) The distribution of China's population in recent 300 years showed a high autocorrelation, with the aggregation level fluctuating. Among them, Jiangsu Province, Shanghai, as well as provinces of Shandong, Anhui and Zhejiang in eastern China were stable aggregation zones with high density population; Henan Province in Central China was relatively stable aggregation zone with high density population; some provinces in southwest and northwest China were stable aggregation zones with low density population; Inner Mongolia in North China was stable aggregation zone with relatively low density population and Heilongjiang and Jilin provinces were unstable aggregation zones with low density population.
近300年来中国人口变化及时空分布格局
基于人口地理学相关理论,以近300a 为时间尺度,以省域为空间单元,利用经修正的清朝、民国及建国后286 个时相的人口数据,建立1724 年、1767 年、1812 年、1855 年、1898年、1936 年、1982 年和2009 年8 个典型时间断面,通过不均衡指数、集中指数、分布重心和空间自相关等分析方法,研究了近300a 来中国人口数量变化及时空分布格局。结果表明:①近300a 来中国人口数量波动上升,按增长曲线特征可分为较快稳定增长期、快速波动负增长期、低速平稳增长期、无序跌宕增长期、急剧波动增长期5 个阶段;② 人口分布逐渐趋于均衡,人口重心迁移幅度不大,总体呈西南—西北—东北—西北的移动趋势;③ 人口分布保持高度自相关,聚集程度波动变化,其中,华东的沪苏地区、山东省、安徽省、浙江省为稳定人口高密度聚集区,华中的河南省为较稳定人口高密度聚集区,西南、西北部分省份为稳定人口低密度聚集区,华北的内蒙古自治区为较稳定人口低密度聚集区,东北的黑龙江省、吉林省为不稳定人口低密度聚集区。
Research on spatio-temporal pattern of the urban registered poor: A case study of Nanjing
DOI:10.11821/dlyj020181290
[本文引用: 1]
Urbanization has exprienced rapid development in China since 2000. In the course of time, urban social space has been changed and reconstructed, which means that the urban poor is demonstrating a new spatial pattern. At present, significant portions of domestic urban poverty space studies mainly remain in the period of 2000 or so. Based on the MLSPU (Minimum Living Standard Programme for Urban residents) recipient data, this paper explores spatio-temporal pattern of urban registered poor of Nanjing in the new period by the method of ESDA (Exploratory Spatial Data Analysis). On this basis of previous related studies, this paper summarizes spatial evolutionary process and mechanism of urban registered poverty of Nanjing in the perspective of residential differentiation. The results are obtained as follows. (1) Spatial distribution of the urban registered poor has followed the pattern of dispersion globally and concentration locally of 2000, which tends to be further dispersive. Spatial agglomeration of the urban registered poor presented a core-periphery structure while the core namely hotspot region was located within Nanjing belt highway. (2) In the context of high-speed growth of national economy, both urban poor population composition and urban poverty space governance have witnessed a transformation process. The underage, unemployed, employable (not yet formally employed) and released poverty groups, especially the unemployed as well as released poverty group, are the focus of urban poverty space governance at present. (3) Compared with the year 2000, urban registered poverty-stricken area of Nanjing has obvious differentiation in the new period, which can be divided into three types: concealed, resettled and mixed. It is the consequence of urban expansion and reconstruction. (4) Under the interaction of government functions, market mechanism and social behavior, urban registered poverty space of Nanjing has emerged at the turning point form visible to invisible while it has been reconstructed. On the hand, the original dilapidated shanty towns or old neighborhoods have been renovated to a certain extent, and hidden between modern city landscapes. On the other hand, urban poor almost have migrated to security housing, where the living condition is quite different from that of commodity housing.
南京城市户籍贫困人口的时空分异格局
DOI:10.11821/dlyj020181290
[本文引用: 1]
以城市居民最低生活保障统计数据为基础,运用ESDA的方法,探讨2000—2017年南京城市户籍贫困人口的时空分异格局,并从居住空间分异的视角出发,归纳总结出南京城市户籍贫困空间格局的演化过程与机制。研究表明:① 贫困人口的空间分布沿袭了2000年“大分散,小集中”的特点,且分布状态进一步趋于分散,空间集聚则呈现出“核心-边缘”结构,“核心”即热点区域基本都位于绕城公路以内;② 未成年、无业、有就业能力(尚未正式就业)和刑释解教的贫困群体,尤其是刑释解教且无业的贫困群体,是当下城市贫困空间治理重点关注对象;③ 相比于2000年,目前南京城市户籍人口的贫困地域产生了明显分异,可划分为隐蔽型、安置型和复合型三种类型贫困人口聚居区;④ 在政府职能、市场机制和社会行为的交织作用下,南京城市户籍贫困空间重构的同时,也经历了从显性到隐性的转向。
What happened to the CBD-distance gradient? Land values in a polycentric city
DOI:10.1068/a210221 URL [本文引用: 1]
Suburban employment centers: The case of Chicago
DOI:10.1080/00420989420080201 URL [本文引用: 1]
Population and employment densities: Structure and change
DOI:10.1006/juec.1994.1037 URL [本文引用: 1]
Modeling the spatial distribution of urban population density and its evolution in Hangzhou
DOI:10.11821/yj2002050013
[本文引用: 1]
<p>The evolution of urban morphology in the process of urban growth is one of the theoretical frontier issues, while the spatial-temoral structure of the distribution of urban populationdensity is one of the important contents of urban growth. Combining with data of the previous censuses(the second census in 1964, the third one in 1982 and the fourth one in 1990), the author usesdata of the Fifth Census of Hangzhou to study the models of spatial distributionof population density and its evolution in Hangzhou for more than 30 years systematically. First of all, the author transforms data of population census into spatial data by using the map of Hangzhou, and extracts data of urban population density distribution of different years.Then seven kinds of models are tested, including the linear one, the exponential one, the logarithmic one, the power one, the lognormalone, the power-exponential one and the second degree exponentialone. With a viewpoint of the whole tendency, the power-exponential model, as an amended form of the negative exponential model, can describe spatial distribution of urban population density of Hangzhou well. The parameter σreflects the tendency of changes of information entropy of urban geographic system. The parameter σfluctuates, increases and approaches 1, indicating that the power-exponential distribution of urban population density evolves into the ideal Clark (negative exponential) one with the lapse of time. The analysis of urban growth and its spatial dynamics shows that the spatial complexity and the utility of Hangzhou's function unit increase, and that urban spatialstructure tends to be in a new order with the increase of urban ability as a self-organization and the development of suburbanization. As a result of regression, we can't get a model like that of Newling, and there isn't any tidal wave of expansion in the development of spatial distribution of population density in Hangzhou within the past several decades, so it is easy to draw a conclusion that there is a large gap between Chinese cities and western ones in multi-nucleus morphologyand process of suburbanization.</p>
杭州市人口密度空间分布及其演化的模型研究
2000—2010年南京都市区人口空间变动特征研究
DOI:10.13249/j.cnki.sgs.2016.01.010
[本文引用: 1]
利用南京市第五次、第六次人口普查数据研究南京都市区2000~2010年人口空间变动及其规律。研究发现,① 10 a间南京都市区各地域人口均呈现增长态势,近郊区成为人口增长最为剧烈的区域;人口重心逐渐向南移动,同时人口分布的核心区域有向内收敛的趋势。② 根据测定系数、F检验与图像分析的综合判断,对数正态模型能够较好拟合人口分布的单核心结构,两年份曲线的变化表明郊区化的主体仍然是近郊区,尚未发展到远郊化的程度。多核心模型的拟合表明南京都市区已初步形成多核心结构,且主中心对人口仍具有强大吸引力;而多核心与单核心模型同时具有良好的拟合效果说明多核心结构尚未发育成熟。③ 南京都市区人口分布的空间异质性越来越高,人口分布趋于复杂,表明都市区正在向更加高级的阶段发展。
Residential property values, the CBD, and multiple nodes: Further analysis
DOI:10.1068/a220829 URL [本文引用: 1]
De-urbanization in China the urban-rural contradiction
Urban transformation in China, 1949-2000: A review and research agenda
DOI:10.1068/a34192 URL [本文引用: 1]
City and countryside as ideological issues: India and China
DOI:10.1017/S0010417500006678 URL [本文引用: 1]
The rise of the small household: Demographic change and household structure in Paris
DOI:10.1002/psp.370 URL [本文引用: 1]
Urban population development in Europe, 1991-2008: The examples of Poland and the UK
In-between stability and subtle changes: Urban growth, population structure, and the city life cycle in Rome
DOI:10.1002/psp.1877 URL [本文引用: 1]
