

1 引言
“源—汇”的概念是生态过程和格局的重要概念之一,相关理论起源于全球变化和大气污染研究[8],后被引入生态学研究中。“源”指一个过程的源头,“汇”指一个过程消失的地方。而在景观生态学中,“源”“汇”景观分别指促进、抑制生态过程发展的景观类型,由于“源”“汇”的定义与生态过程紧密联系,因此“源—汇”的不同分布格局可以一定程度上反映生态过程发生的差异。将“源—汇”理论引入城市热岛效应的研究中,可以对影响城市热岛效应的景观进行分类,并根据“源”和“汇”景观与总体区域的地表温度、面积百分比,得到特定区域的热岛效应贡献度,该指数比传统的地表温度更能反映某区域的“源”景观促进热岛效应的程度、“汇”景观缓解热岛效应的程度,而不是仅仅比较某区域的地表温度大小的总值,忽略了具有热岛效应的区域与该区域平均值之间的关系。
基于以上研究,发现学者大多基于城市尺度进行地表温度“源—汇”景观的研究,很少研究基于全国或者省级尺度进行研究;且在探究地表温度“源—汇”景观的影响因素的研究方面,大多基于地表温度进行探究,少有研究是基于热岛贡献指数探究影响因素。因此,本文利用2005年、2010年和2015年中分辨率成像光谱仪(Moderate-Resolution Imaging Spectroradiometer, MODIS)数据反演地表温度及其相应土地利用情况,基于“源—汇”景观理论探究中国各省“源”景观和“汇”景观的热岛贡献指数及其比值的空间分布规律,并探究自然因素、社会经济因素和景观形态因子对“源”“汇”景观贡献度的影响。为进一步了解中国热岛效应差异,并为适时缓解热岛效应提出“因地制宜”的方法。利用MODIS图像数据以及各种地理空间方法,可以分析景观效益指数的时空变化,并探讨了“源—汇”景观贡献度与景观特征之间的关系,对结果进行综合调查可提供有关优化城市景观格局以促进可持续城市发展方面的宝贵信息。
2 研究区与数据来源
研究数据包括由美国国家航空航天局(NASA)官方网站提供的MODIS地表温度数据、地表反射率数据、地表蒸散产品数据、植被指数(NDVI);全国土地利用遥感监测数据和行政区划数据均来自中国科学院资源环境科学数据中心,土地利用类型包括耕地、林地、草地、水体、建设用地和未利用土地6个一级类型;高程数据(DEM)来自地理空间数据云;人口密度数据由美国国家橡树岭实验室提供;全国电力消费数据来源于《中国统计年鉴》;气象数据包括平均气温、相对湿度、降雨量、最高气温和最低气温,其中最高气温和最低气温来源于中国气象数据网,采用普通克里金插值方法生成相应的栅格数据,平均气温、降雨量均来源于国家青藏高原科学数据中心,相对湿度来源于国家地球系统科学数据中心地理资源分中心(表1)。由于受到数据的限制,本文的研究区为中国的31个省、自治区、直辖市(暂未包含港澳台地区)。
表1 数据来源及说明
Tab. 1
| 数据源 | 获取时间 | 数据说明 |
|---|---|---|
| MOD09反射率数据 | 2005年、2010年、2015年的1月和7月 | 时间分辨率8 d、空间分辨率500 m |
| MOD11地表温度数据 | 2005年、2010年、2015年的1月和7月 | 时间分辨率8 d、空间分辨率1 km |
| MOD13NDVI数据 | 2005年、2010年、2015年的1月和7月 | 时间分辨30 d、空间分辨率1 km |
| MOD16蒸散发数据 | 2005年、2010年、2015年的1月和7月 | 时间分辨率8 d、空间分辨率500 m |
| DEM | - | 空间分辨率为30 m |
| 土地利用数据 | 2005年、2010年、2015年 | 空间分辨率30 m |
| LandScan人口密度数据 | 2005年、2010年、2015年 | 空间分辨率1 km |
| 平均气温、降雨量、相对湿度 | 2005年、2010年、2015年的1月和7月 | 时间分辨率月、空间分辨率1 km |
| 最高气温、最低气温 | 2005年、2010年、2015年的1月和7月 | 共609个气象站点 |
| 行政区划数据 | - | 空间投影为Lambert正轴等角圆锥投影 |
| 电力消费数据 | 2005年、2010年、2015年 | - |
3 研究方法
3.1 地表温度“源”/“汇”景观识别
式中:
3.2 地表温度“源”/“汇”景观贡献度及其效应
当LI > 1时,研究区“源—汇”景观组合能够减缓热岛效应;当LI < 1时,研究区“源—汇”景观组合不能减缓热岛效应;当LI = 1,则表示研究区“源—汇”景观组合对缓解热岛效应无作用。
3.3 空间自相关分析
由于地表温度“源—汇”景观贡献度及其驱动因子往往存在着空间自相关,对此本文采用莫兰指数(Moran's I)来定量描述“源—汇”景观贡献度及其与驱动因子在空间上的统计分布规律。空间自相关分析可以表示空间单元与其周边单元之间的相关性,因此采用单变量全局自相关莫兰指数分析各省级行政单元间地表温度“源—汇”景观贡献度的全局空间相关性,采用双变量全局莫兰指数来分析“源—汇”景观贡献度与驱动因子的空间相关性,其可以测度两个变量在整个尺度上是否存在空间相关性,并衡量空间相关的程度,计算公式如下:
式中:n为空间单元总数;S2为所有样本的方差;wij为31×31的空间权重矩阵,用于测度空间单元i和j之间的邻接关系,但当Moran's I为单变量全局空间自相关指数时,xi、yj分别为i、j省地表温度“源—汇”景观贡献度,
3.4 空间杜宾模型
本文采用空间杜宾模型分析各因子(自然因子、社会经济因子、景观形态因子)对热岛景观贡献度的影响。相比于普通最小二乘法回归(Ordinary Least Square, OLS)、空间自回归模型(Spatial Autoregression, SAR)和空间误差模型(Spatial Error Model, SEM),空间杜宾模型(Spatial Durbin Model, SDM)[17-18, 20]的优点在于:同时考虑了变量的空间效应(空间依赖性和空间异质性)、自变量的空间延迟和因变量的空间延迟。因此需要有空间滞后最大似然(LM-lag)和空间误差最大似然(LM-error)以及Wald检验(Wald-lag和Wald-error)对OLS、SAR和SEM的模型进行检验,并综合拟合优度(R2)和对数似然函数值(LogLikehood)的大小选出最优模型,分析影响源/汇景观贡献度的影响因素。
式中:θ是外生交互效应的系数;当θ = 0时,即为SAR,当θ = -ρβ时,即为SEM。θ越显著表明解释变量存在的空间交互作用越强。
3.5 潜在因子分析
本文所涉及的影响因素分为三大类,分别为自然因素、社会经济因素和景观形态因素。其中自然因素包括1月和7月的平均温度、平均降雨量、相对湿度、温度日较差、高程、地表蒸散发量、植被指数;社会经济因子包括人口密度、建筑指数、电力消费。城市景观具有复杂的空间异质性,而景观指数能够高度浓缩景观格局信息,反映其结构组成和空间配置某些方面的特征[21]。尽管描述土地利用景观格局特征的景观指数较多,但大部分指数所反映的格局特征往往具有重复性和相似性,不能够全面反映土地利用的特征。因此本文根据研究需要,选出4种景观格局指数,分别为斑块密度、边缘密度、有效粒度尺度和标准斑块形状指数。由于“源”景观和“汇”景观在各省的区位不一样,因此需要分别计算“源”景观和“汇”景观所在区域的解释变量和被解释变量。其次需要对被解释变量进行筛选,通过相关分析结果,剔除与“源”景观或“汇”景观相关性不显著的因子,再对剩余的因子进行共线性诊断,最终可用于做进一步分析的变量共11个(表3)。
表3 影响因子
Tab. 3
| 序号 | 变量 | 符号 | 单位 |
|---|---|---|---|
| 1 | 降雨量 | P | mm |
| 2 | 相对湿度 | RH | % |
| 3 | 平均温度日较差 | DVT | ℃ |
| 4 | 高程 | E | m |
| 5 | 植被指数 | NDVI | - |
| 6 | 人口密度 | POP | 人/km2 |
| 7 | 建筑指数 | NDBI | - |
| 8 | 斑块密度 | PD | /100 hm2 |
| 9 | 边缘密度 | ED | m/hm2 |
| 10 | 有效粒径尺度 | MESH | m |
| 11 | 标准化形状指数 | NLSI | - |
4 结果
4.1 “源—汇”景观贡献度比值的时空演变
图1展示了2005—2015年冬季(1月)和夏季(7月)的地表温度“源—汇”景观贡献度比值(LI)类型的省份数量,其中的“强”表示LI值均大于1,即始终能够减缓热岛效应;“较强”表示LI由小于1变成大于1,即由促进热岛效应变为减缓热岛效应;“较弱”LI值由大于1变成小于1,即由减缓热岛效应变为促进热岛效应;“弱”表示LI均小于1,即始终是促进热岛效应。由此可知,冬季处于“强”LI的省份最多,夏季处于“弱”LI的省份均最多,均为16个,说明冬季大部分省份的“源—汇”景观结构能够减缓热岛效应,但夏季相反;而且从冬季到夏季,属于“强”LI的省份减少了6个,而“弱”LI增加了8,说明随着季节的转变,部分地区发生了由缓解热岛效应到促进热岛效应的转变。整体上,属于“较强”LI的省份主要在冬季,属于“较弱”LI的省份在不同季节其数量基本相同。
图1
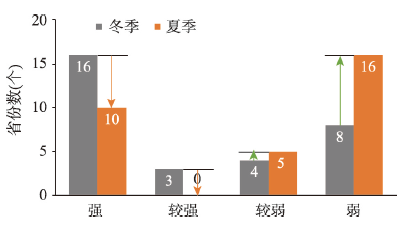
图1
2005—2015年冬季和夏季不同LI类型的省份数量
Fig. 1
Number of provinces with different LI types in winter and summer from 2005 to 2015
图2展示了2005—2015年冬季和夏季的地表温度“源—汇”景观贡献度比值的时空演变分布,呈现出图1在空间上变化。冬季,“强”和“较弱”LI集中分布在中国北部和南部,而“较强”和“弱”LI则主要分布在中部地区。夏季,“强”LI集中分布在北部地区,而“弱”和“较弱”LI集中分布在中部和沿海地区。具体来看,冬季,新疆维吾尔自治区、内蒙古自治区、西藏自治区、宁夏回族自治区、辽宁省均表现为“强”LI,这些地区人口密度低、地势高、建设用地面积比例低且分布离散并伴随强劲的冬季风,缓解热岛效应强度大。南部大部分地区表现为“强”LI,可能由于一年四季的常绿阔叶林对缓解热岛效应发挥极大作用。环京津冀地区多表现为“强”LI,可能由于临海区域较多,发挥较强的吸热作用。青海省、陕西省、山西省、安徽省、浙江省、江西省、湖南省等表现为“弱”LI,这些区域的“源”景观比例高,多位于中部地区,热空气不易循环,一定程度上促进热岛效应。河南省、黑龙江省、甘肃省等多表现为“较强”LI,从促进热岛的状态转为缓解热岛的状态,说明这些区域热环境有所改善。云南省、吉林省、北京市和江苏省缓解热岛的作用逐渐减弱,于2015年变为促进热岛效应的状态。
图2
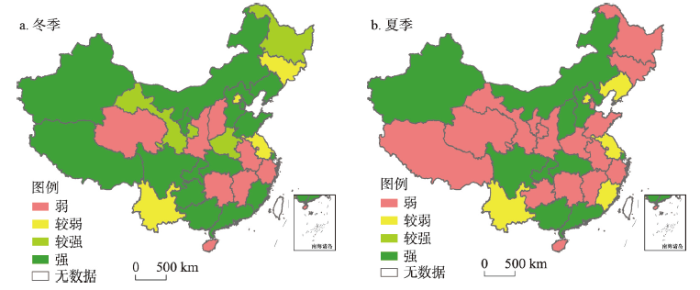
图2
“汇”景观与“源”景观贡献度之比的空间分布格局
注:基于自然资源部标准地图服务网站审图号为GS(2019)1822号的标准地图制作,底图边界无修改。
Fig. 2
Spatial distribution of LI
与冬季相比,夏季亦为“强”LI的区域有新疆维吾尔自治区、内蒙古自治区、河北省、山西省、四川省、重庆市、湖北省、上海市、广东省和广西壮族自治区。“较强”LI的省份的分布有以下两种情况,第一种是若冬季是“较强”LI,则夏季一定为“弱”LI,如黑龙江省、甘肃省、河南省;第二种是夏季为“较弱”LI,则冬季一定为“强”LI或维持不变,如辽宁省、福建省、江苏省、北京市和云南省。第一种是在较低温度下从促进热岛转变为缓解热岛,而在较高温度下是促进热岛效益。第二种是在温度较高下从缓解热岛转为促进热岛,但在温度较低下则是缓解热岛。“较弱”LI主要分布于建成区较为集中的区域,即人类活动比较频繁的地区,表明人类的干扰对城市热岛有较强的促进作用,引起了城市热岛效应的发生。“弱”LI主要是自西藏自治区从东向西一直延伸至江苏省和自贵州省从东向西延伸至浙江省。
4.2 “源—汇”景观贡献度的影响机制分析
4.2.1 相关性与双变量空间自相关分析 如图3所示,与地表温度“源—汇”景观贡献度相关程度最大的本地因子具有季节性特征,冬季是景观形态因子,夏季是自然因子。对于邻域因子,与地表温度“源—汇”景观贡献度相关程度依次为自然因子>社会经济因子>景观形态因子。其次,本地和邻域的同一个因子对“源”景观贡献度(或“汇”景观贡献度)的作用方向基本一致,但对“源”景观贡献度的作用方向与对“汇”景观贡献度的作用方向相反。具体来看,在冬季,本地因子中景观形态因子与地表温度“源—汇”景观贡献度的相关性最大,其中斑块密度(PD)、边缘密度(ED)和标准形状指数(NLSI)均与“源”景观贡献度有负相关关系,而与“汇”景观呈正相关关系;最大粒径尺度(MESH)与前者是正相关,与后者则是负相关。其次是社会经济因子和自然因子。在夏季,与地表温度“源—汇”景观贡献度相关程度最大的因子是自然因子,其中降雨量、相对湿度、植被指数(NDVI)均与“源”景观贡献度具有负相关关系,而与“汇”景观贡献度有正相关关系;高程和平均温度日较差与“源”景观贡献度有正相关关系,而与“汇”景观贡献度有负相关关系。其次是社会经济因子,最后是景观形态因子。
图3
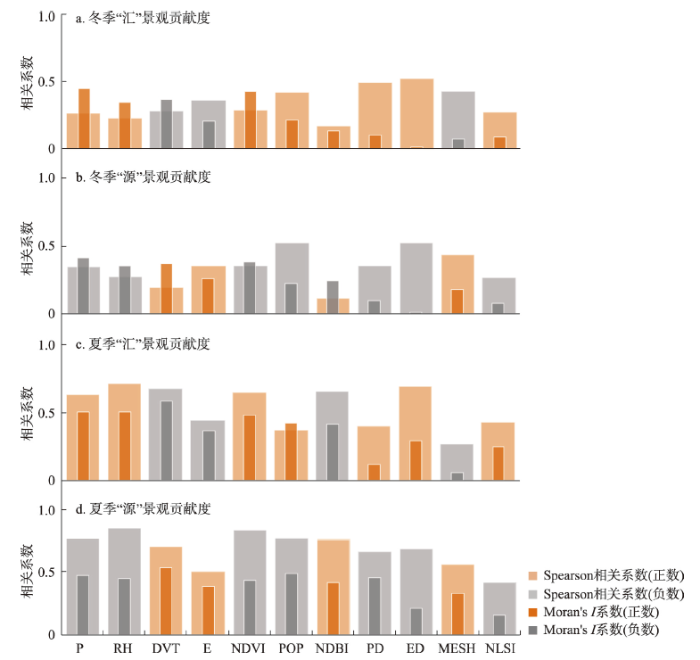
图3
“源—汇”景观贡献度与各影响因子的相关分析和空间自相关分析
Fig. 3
Correlation analysis and spatial autocorrelation analysis between CI and various factors
邻域因子中自然因子对“源—汇”景观贡献度的相关性始终是最大的,其次是社会经济因子和景观形态因子。其中邻域“源”景观和“汇”景观的降雨量、相对湿度、平均温度日较差、高程和NDVI与相应的景观贡献度的相关性和本地因子相似。社会经济因子中往往建筑密度会比人口密度对“源—汇”景观贡献的影响要大。而领域因子中的景观形态因子与“源—汇”景观贡献度的相关性最小,即本地因子、邻域自然因子和社会经济因子与“源—汇”景观贡献度相关性大。
4.2.2 “源—汇”景观贡献度回归分析 表4为全国“源”景观、“汇”景观贡献度在2005年、2010年、2015年1月和7月的全局Moran's I值,可知“源”景观和“汇”景观贡献度均呈现出一定的空间依赖性和空间异质性,若用传统的OLS模型往往导致结果的不准确,故需要构建距离空间权重矩阵进行空间回归。
表4 Moran's I值
Tab. 4
| 变量 | Ciy0501 | Ciy0507 | Ciy1001 | Ciy1007 | Ciy1501 | Ciy1507 |
|---|---|---|---|---|---|---|
| Moran's I | 0.104 | 0.325 | 0.067 | 0.323 | 0.108 | 0.360 |
| P值 | 0.043 | 0.000 | 0.084 | 0.000 | 0.048 | 0.000 |
| 变量 | Cih0501 | Cih0507 | Cih1001 | Cih1007 | Cih1501 | Cih1507 |
| Moran's I | 0.098 | 0.325 | 0.072 | 0.332 | 0.109 | 0.362 |
| P值 | 0.052 | 0.000 | 0.078 | 0.000 | 0.049 | 0.000 |
注:Ciy0501表示2005年1月的“源”景观贡献度,Cih0501表示2005年1月的“汇”景观贡献度,以此类推。
基于此,寻找最优的空间回归模型需借助拉格朗日乘数(Lagrange Multiplier, LM)检验。根据SEM、SAR和SDM的检验结果可知,LM-lag和Robust LM-lag、LM-error和Robust LM-error,Wald检验均显著且R2和Log likelihood均显示SDM最优,因此本文用SDM进一步探究影响“源—汇”景观贡献度的因素(表5),其4个模型的Log likelihood和Ajusted R2均表现出良好的拟合优度,可靠性较高。
表5 “源—汇”景观贡献度的回归结果
Tab. 5
| 变量 | Ciy_win | Ciy_sum | Cih_win | Cih_sum |
|---|---|---|---|---|
| P | -0.002 | 0.118 | -0.039 | 0.278 |
| RH | 0.382 | -1.540*** | 1.083** | 0.179 |
| DVT | -0.692*** | 1.573** | -0.420 | -1.439** |
| E | 0.217** | 0.035 | -0.206 | 0.152 |
| NDVI | -0.454** | -1.057** | 0.005 | -1.846** |
| POP | -0.083 | 0.150* | 0.030 | -0.099 |
| NDBI | 0.441*** | -0.247 | 0.283*** | -0.398** |
| PD | 0.284** | 0.223 | -0.416*** | -0.348*** |
| ED | -0.930*** | -0.489** | 0.362** | 0.747*** |
| MESH | 0.173*** | 0.090** | -0.136*** | -0.130*** |
| NLSI | -0.224 | -0.113 | 0.231 | 0.331** |
| W×P | -0.107 | 0.736* | -0.151 | 0.220 |
| W×RH | -1.550** | -0.876 | 3.428** | -1.875 |
| W×DVT | 1.012 | -1.231 | -0.530 | 0.473 |
| W×E | 0.257 | -0.273** | 1.335 | 0.391** |
| W×NDVI | 0.531 | 1.214 | -2.644** | 2.653** |
| W×POP | 0.341 | -0.635*** | 0.629 | 0.550** |
| W×NDBI | 1.353*** | 1.004** | 0.781** | -1.035** |
| W×PD | -0.434 | -0.773** | -1.920*** | -0.946*** |
| W×ED | 1.270** | 2.705*** | 0.668 | -0.667* |
| W×MESH | -0.350*** | -0.183 | -0.735*** | 0.068 |
| W×NLSI | -0.352 | -0.448 | -2.351** | 0.219 |
| W×y | 0.109 | -0.217 | -0.098 | -0.303* |
| R2 | 0.757 | 0.899 | 0.985 | 0.877 |
| Log likelihood | -66.090 | -25.318 | 62.609 | -34.598 |
注:win表示1月冬季,sum表示7月夏季;***表示0.01水平显著,**表示0.05水平显著,*表示0.1水平著。
由此可知,本地因子中,影响“源”景观贡献度大小在冬季依次为ED > DVT > NDVI > NDBI > PD > DEM > MESH,在夏季依次为DVT > RH > NDVI > ED > POP > MESH;影响“汇”景观贡献度大小在冬季依次为RH > PD > ED > NDBI > MESH,在夏季依次为NDVI > DVT > ED > NDBI > PD > NLSI > MESH。邻域因子中,影响“源”景观贡献度大小在冬季依次为RH > NDBI > ED > MESH,在夏季依次为ED > NDBI > PD > P > POP > DEM;影响“汇”景观贡献度大小在冬季依次为RH > NDVI > NLSI > PD >NDBI > MESH,在夏季依次为NDVI > NDBI > PD > POP > DEM。具体分析如下:
自然因子中,降雨量对“源—汇”景观贡献度的影响均不显著。相对湿度对冬季“汇”景观和夏季“源”景观贡献度分别有显著的正向和负向影响,即相对湿度增加1%,“汇”景观贡献度就会增加1.08%,而“源”景观贡献度就会减少1.54%。平均温度日较差对夏季“汇”景观和冬季“源”景观贡献度具有显著负向影响,而对夏季“源”景观具有正向影响。DEM对冬季“源”景观有显著正向影响。NDVI对“源”景观和“汇”景观贡献度均有显著负向影响。社会经济因子中,人口密度对夏季“源”景观具有显著正向影响。NDBI对“汇”景观贡献度的影响具有季节特征,在冬季是正向影响,在夏季则相反,说明建筑高度对释放LST具有一定的积极作用。景观形态因子中,斑块密度和有效粒径尺度对“汇”景观贡献度有负向影响,而边缘密度和形状指数对其有正向影响,对“源”景观贡献度则相反。即景观破碎度越低、形状越复杂,“汇”景观贡献度越小,而“源”景观贡献度越大。
其次,空间溢出导致对邻域“源—汇”景观贡献度具有一定的影响,邻域降雨量对夏季“源”景观贡献度具有正向影响;邻域相对湿度对夏季“汇”景观贡献度具有正向作用,即相对湿度越大,邻域“汇”景观贡献度越大,缓解邻域热岛效应的作用越小,而对冬季“源”景观贡献度具有负向影响。邻域高程对夏季“汇”景观贡献度具有正向影响,即高程越高,缓解热岛效应越弱,而对夏季“源”景观具有负向影响。邻域NDVI对“汇”景观贡献度的影响具有季节特征,冬季为负向影响,夏季为正向影响。邻域人口密度对“汇”景观贡献度的影响具有正向影响,而对“源”景观贡献度具有负向影响。NDBI对冬季“汇”景观和夏季“源”景观具有正向影响,而对冬季“源”景观和夏季“汇”景观具有负向影响。邻域景观形态对“汇”景观或“源”景观贡献度的影响与本地景观形态对“汇”景观或“源”景观贡献度的影响相似,即邻域“汇”景观的离散度越小、形状越简单,则缓解热岛效应越强。反之,则邻域“源”景观的离散度越大、形状越复杂,缓解热岛效应的作用越大。
5 讨论
5.1 各LI景观类型热岛效应变化的原因
结合各景观类型“源”与“汇”区域下各因子和面积比值(图4),对各LI景观类型热岛效应变化的原因进一步说明。研究发现“强”LI区域内“源”景观斑块离散度和边缘复杂度越大,“汇”景观斑块离散度和边缘复杂度越小,缓解热岛效应就越强;“弱”LI区域呈现相反的规律。由此推断,当区域内自然因素和社会经济因素差别较小时,“源”和“汇”景观的斑块离散度和边缘复杂度可能是决定热岛效应作用方向的关键因子。此外,“较强”LI区域热岛效应相对严重,但有些区域在2005—2015年冬季发生了从促进热岛效应向缓解热岛效应的转变。这可能与冬季能源利用结构的转变有关。尤其是在中国北方地区,暖气供应消耗大量能源,是影响热岛效应的重要因素。“较弱”LI主要分布在经济快速发展地区,往往由于城市扩张以及人口密度增加导致由缓解热岛转变为促进热岛。如云南省的城市化过程伴随着日益增多的旅游景点和“网红”打卡地[22],人口密度迅速增加,使得这些区域被识别为“较弱”LI。最后,温室气体排放可能导致一些区域从缓解热岛向促进热岛变化。如北京市存在严重的空气污染问题,不利于热量的扩散[23];吉林省早期无节制使用煤炭作为主要的加热能源对地表温度升高有很大的影响[24],这些地区被识别为“较弱”LI,经历了从缓解热岛向促进热岛变化。
图4
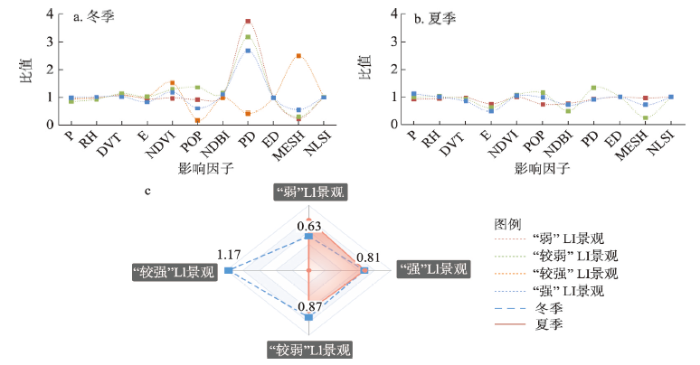
图4
各景观类型的“源”与“汇”区域影响因子、面积的比值
Fig. 4
Ratio of "source" and "sink" regional influence factors and area of each landscape type
“弱”LI景观在季节变化中起主导作用,且为空间变化最大的景观类型。研究发现从冬季到夏季,“弱”LI区域呈现增大的趋势。一方面,这可能是由温度升高直接导致的。如从西藏自治区自东向西至沿海地区,在夏季均被识别为“弱”LI。这些区域夏季平均气温达到35~40℃,降雨量和相对湿度较低,加之不合理的“源—汇”景观结构,因此在夏季表现为“弱”LI。另一方面,“弱”LI区域呈现增大的趋势还可能是人口增加导致。有些地区处于快速城市化进程中,人口发生剧烈增加,社会经济活动活跃,导致时间尺度上的季节观测结果呈现“弱”LI区域增大。如从云南省自西向东到江西省,均为人口不断增加的区域。最后,夏季比冬季具有更多的“弱”LI区域,还可能因为夏季可用的太阳辐射以及植被冠层在潜热和显热之间的能量分配都高于冬天[25,26],在已有针对诸多欧洲城市的分析中证实了这种情况[26,27,28]。
5.2 “源—汇”景观贡献度的影响因子分析
本文发现同一个因子对“源”景观和“汇”景观贡献度的影响不同,且在不同季节也存在差异。首先,对于“源”景观贡献度来说,相对湿度的增加能够缓解热岛效应,但相对湿度对“汇”景观的影响具有不确定性。这主要是由于蒸腾作用导致“汇”景观通常具有较高的相对湿度,这种过多的表面湿润导致大气中的水分含量增加,不仅减少了入射辐射,而且由于水蒸气是一种有效的大气温室气体,导致空气变暖[29,30,31]。因此相对湿度过大反而降低“汇”景观缓解热岛的效应。其次,多数研究已证明高程对热岛效应具有负向影响[32],即高程越高则热岛越弱。但本文发现冬季“源”景观和夏季邻域对本地“源”景观的影响效果相反。推断可能与全球变暖冰雪反照率减弱[33,34]、云量对短波辐射和长波辐射的减弱[34,35]、全球变暖云凝结层增多潜热释放引起的变暖[34, 36]有关;此外,湿度和热态之间的关系导致的水蒸汽的少量增加会对下行长波辐射产生影响也会导致在较高海拔处变暖反应明显增大[34]。
植被指数对冬季“汇”景观贡献度的影响不显著,对其他的“源—汇”景观均呈现负向影响。这可能是由于冬季绿地地表均被冰雪覆盖,其反射率和比热容均与原绿地覆被不同,缺少蒸腾作用等导致的直接降温效应。但因为冬季植被叶子少,落叶之间的孔隙度大于夏季,进而对冬季风的阻碍小,且“源”景观往往比“汇”景观有更多的高层建筑物,可以视为峡谷[37]。因此,冬季植被的间接降温效应要远大于夏季,且对“源”景观的影响较大。而夏季植被的覆盖程度对“源—汇”景观起到一定的直接降温效应。对于邻域NDVI,其仅对“汇”景观有影响,在冬季是负向,在夏季是正向影响,可能由于冬季经过邻域植被的冬季风可以继续带走一部分热量。大多数研究发现建筑密度越小,越有利于缓解热岛效应。裸露的土壤和硬化的路面更有可能增加LST,而高密度的植被和水更可能减少LST。而本文中建筑密度对夏季“汇”景观贡献度的影响恰恰相反,可能原因是由于“源”景观多为高层建筑物,其有一定的遮蔽效应,能够阻碍太阳辐射与地表之间的相互作用[38],因此NDBI对夏季“汇”景观的作用呈现负相关。其次由于遮蔽作用与本地区域形成压力差,也能够带走一部分热量。
探究影响“源”或“汇”景观贡献度的影响因子中,由于地表温度景观贡献度在一定程度排除了由于地域差异所导致的原始累计地表温度的影响,而是表征“源”或“汇”景观所处区位在该省范围内的地表温度差异的土地百分比[39],因此自然因子如相对湿度、降雨量、温度日较差、高程等对景观贡献度的影响较小。由于“源”景观大多为建设用地等不透水面,其一般形式为水泥或混凝土,水分不易保存在土壤里,下渗量减少,地表径流增多,径流速度也加快,很快流入下水道,地面缺少水分,水分有蒸发吸热的作用,热量没法随着水分散失。同时,泥巴地变成水泥地后,还有水泥等沙石的比热容较小,吸收相同热量,温度要上升的多。而在“汇”景观通过植被、灌木、草地、枯枝落叶层等对降雨量有滞留作用,植物保持水土,又因为水的比热容大,吸收同样的热量,水的温度上升最低。同时植物的蒸腾作用散热[19, 40-41]。城市形态对“源—汇”景观贡献度的影响显著,对于“汇”景观来说,景观破碎度越低,形状越复杂,缓解热岛效应的作用越大,这与沈中健等[42]、王耀武等[6]的研究一致。城市景观形态对邻域“汇”景观贡献度具有季节性变化的特征,夏季本地的破碎度越高,形状越规则,则邻域“汇”景观贡献度越小,而冬季本地景观的破碎度越低,形状越复杂,邻域“汇”景观贡献度越小,缓解热岛效应的作用越大。对于“源”景观来说,冬季“源”景观形状越简单,其缓解热岛效应的作用越大,这与王耀武等[6]、高建成等[43]的结果一致。
5.3 展望与不足
本文具有以下3个方面的特点:① 从“源—汇”的角度探讨自然因子、社会经济因子、景观组成和配置对城市热环境的影响。与探究地表温度的影响因子相比,探究缓解/促进城市热岛程度影响因子可以减少不确定性并提高准确性。② 采用贡献指数模型来分析城市景观及其热效应,有助于了解“源—汇”景观格局及其生态过程。③ 本文的研究范围是全国,目前少有在国家尺度探究地表温度“源—汇”景观贡献度的影响因子。
本文基于省域尺度讨论影响地表温度“源—汇”景观贡献度的因素,而在地理学的研究中,研究结果会受到分析单元粒度大小的影响。在下一步研究中,可展开基于栅格单元的分析,探究基于不同粒度的研究单元城市热岛贡献度与自然、社会经济、景观格局指数关联关系的差异。同时,关于“源—汇”过程与热量输入—输出的动力学过程与机制的分析还存在欠缺,下一步工作中需增加更多的实证性案例分析。
6 结论
(1)2005—2015年期间,冬季缓解热岛效应的省份较夏季多。冬季,“强”和“较弱”LI区域集中分布在中国北部和南部,而“较强”和“弱”LI则主要分布在中部地区。夏季“强”LI区域集中分布在北部地区,而“弱”和“较弱”LI区域集中分布在中部和沿海地区;
(2)对于本地因子,景观形态对“源”或“汇”景观贡献度的影响较大,缓解热岛效应将附近小“汇”斑块结合来降低地表温度“汇”景观的离散度。同时在“源”斑块内部有条理地镶嵌部分“汇”斑块,有助于热岛的缓解。其次在夏季适当增加“源”景观相对湿度和植被覆盖率,严格控制“源”景观和“汇”景观的建筑密度及建筑高度,可达到最佳降温效果;
(3)邻域因子中相对湿度和建筑密度的影响更大,适当增加邻域“源”景观的相对湿度有利于缓解本地的热环境,但增加邻域“汇”景观的相对湿度对本地的热岛情况起着促进效果。景观形态中增加“源”景观的离散度及其边缘密度有利于缓解邻域的热岛环境,相反增加“汇”景观集聚度,简化其斑块形状有利于缓解邻域热岛效应。
参考文献
Approaches to study urban heat island: Abilities and limitations
DOI:10.1016/j.buildenv.2010.04.001 URL [本文引用: 1]
Research advances in understanding urban heat island effects with some future prospects
城市热岛效应的研究进展与展望
Relationships between urban landscape pattern and land surface temperature: A case study of Shenzhen
城市地表热环境与景观格局的关系: 以深圳市为例
Effects of urban morphology and wind conditions on land surface temperature in Changchun
DOI:10.11821/dlxb201905005
[本文引用: 1]

The urban heat island effect has received an increasing attention recently with the acceleration of urbanization. However, so far few studies have focuses on the effects of urban morphology and wind conditions on land surface temperature (LST). This study utilizes a range of multi-source data including architecture and remote sensing and applies a GIS spatial method combined with urban building frontal area index (FAI) and LST. This research aims to evaluate spatiotemporal differences in the FAI of urban built-up areas as well as to explore the influence of urban form on surface temperature. Results initially reveal that building FAI conforms to a spatial trend comprising outward diffusion from the city center and shows that high density, higher elevation buildings hinder the wind strongly. Data show that FAI values for the north of Chaoyang District are the largest, reaching a maximum of 15.1, while those for edge areas for each district are the smallest, falling to a minimum of 0.01. Secondly, the results of this analysis reveal large differences in surface temperature between day and night within the study area, ranging between 18.15 ℃ and 31.73 ℃ and between 4.27 ℃ and 18.43 ℃, respectively. Spatial distribution values exhibit the same characteristics as those for the FAI; the urban central city is characterized by high temperature, which gradually spreads out in a concentric manner. The range of high temperature areas during the day is also larger than that at night as these values are influenced by other variables including urban architectural form and artificial heat sources. Thirdly, the data assembled here show that FAI is related to surface temperature to a certain extent; recorded correlations between day and night are 0.371 and 0.355, respectively, both significant at the 0.01 level. It is also the case that building spatial shape is distinct in both vertical and horizontal directions and that the influence of surface temperature varies. Wind environmental data is an important component of quantitative research on building form and is necessary if urban climate scientists and planners are to explore and enhance potential ventilated corridors within cities.
长春市城市形态及风环境对地表温度的影响
How many metrics are required to identify the effects of the landscape pattern on land surface temperature?
DOI:10.1016/j.ecolind.2014.05.002 URL [本文引用: 2]
Coupling relationship between landscape pattern and urban heat island effect in Xi'an
西安市景观格局与城市热岛效应的耦合关系
Eco-environmental effects of urban landscape pattern changes: Progresses, problems, and perspectives
DOI:10.5846/stxb URL [本文引用: 1]
城市景观格局演变的生态环境效应研究进展
Location-weighted landscape contrast index: A scale independent approach for landscape pattern evaluation based on "Source-Sink" ecological processes
基于“源—汇”生态过程的景观格局识别方法: 景观空间负荷对比指数
Spatial-temporal distribution and causes of urban heat islands
城市热岛时空特征及其影响因素
Assessing the effects of land use and land cover patterns on thermal conditions using landscape metrics in city of Indianapolis, United States
DOI:10.1007/s11252-007-0020-0 URL [本文引用: 2]
Urban heat (or cool) island over Beijing from MODIS land surface temperature
基于MODIS地表温度产品的北京城市热岛(冷岛)强度分析
Urban heat island characteristics in Shenyang under different weather conditions
不同天气条件下沈阳城市热岛特征
The evolvement of the state maritime boundary in South China Sea by maps: China's nine-dotted maritime boundary line in South China Sea
DOI:10.13249/j.cnki.sgs.2012.09.1033
Many islets and reefs in South China Sea are main parts of China. The nine-dotted line is China’s maritime boundary line. To study the formation and evolvement of the nine-dotted line is not only a matter of maritime geopolitics, but also a matter of maintain sovereignty, protection of islets and reefs and resources management. How the nine-dotted line came into being is an academic topic that has not been studied much. Map is one of the means by which a country claims its territory. Besides demonstration in words, map-reading is used in this article to study the formation and evolvement of the nine dash lines to deline the South China Sea. The whole formation process is divided into three phases, namely the initial phase, taking-shape phase, and the final phase. Time before the 1930s witnessed the appearance of the maritime boundary line in South China Sea. The boundary line took shape in the 1930s, and its evolvement came to the final stage in the 1940s-1950s. The original continuous line demarcation and the dotted line demarcation in this sea area can all be found on maps in that period. The maps clearly showes how the eleven-dotted line demarcation changes to the current nine-dotted line demarcation. With the formation and evolvement of the nine-dotted line clarified, the historical fact could be confirmed that China has sovereignty over the islets and reefs within the line. The nine-dotted line is the final maritime boundary line of China.
从地图看中国南海海域疆界线的形成与演进
The evaluation of comprehensive competitiveness of coastal ports and spatial evolution of sea port hinterland in China
我国沿海港口综合实力评价与主要港口腹地空间的演变
Geomorphologic regionalization of China aimed at construction of nature reserve system
DOI:10.5846/stxb URL
中国地貌区划系统: 以自然保护区体系建设为目标
Nine principles that must be followed in the compilation and publication of maps of China
中国地貌区划系统: 编制出版中国地图必须遵循的九项原则
Spatiotemporal changes of carbon emissions in high-carbon manufacturing industry in China and driving factors
中国高碳制造业碳排放时空演变及其驱动因素
Environmental regulation, green innovation, and industrial green development: An empirical analysis based on the spatial Durbin model
TM/ETM+/LDCM images for studying land surface temperature (LST) interplay with impervious surfaces changes over time within the Douala Metropolis, Cameroon
DOI:10.1007/s12524-017-0677-7 URL [本文引用: 3]
The spatial-temporal characteristics and influencing factors of air pollution in Beijing-Tianjin-Hebei urban agglomeration
DOI:10.11821/dlxb201801015
[本文引用: 1]
Air pollution is now the most serious environmental problem in China, especially for Beijing-Tianjin-Hebei (Jing-Jin-Ji) urban agglomeration. Under the background of Jing-Jin-Ji integrated development, it is of great importance to study the spatio-temporal distribution and its influencing factors. This paper firstly analyzed the spatio-temporal characteristics of PM2.5 concentration in 202 counties of Jing-Jin-Ji urban agglomeration using spatial analysis and visualization. Then we quantified the effect degree of different natural and human factors and the spatial spillover effect of these factors using Spatial Durbin Model (SDM). The results are as follows: (1) The PM2.5 concentration was on the rise as a whole from 2000-2014, and it was high in autumn and winter, while low in spring and summer. Seen from spatial distribution, the PM2.5 concentration was high in the southeast, while low in the northwest of the study area, and the concentration in urban built-up area was 10-20 μg/m3 higher than that of its surrounding suburban and rural areas. (2) The counties, whose PM2.5 concentration was below 35 μg/m3, only accounted for 13.9% in 2014. There were significant spatial agglomeration and diffusivity of PM2.5, and the mean distance interacting among the cities was 200 km. The PM2.5 of a city increased by more than 0.5% for every 1% increase in the average PM2.5 of neighboring cities. (3) Socio-economic factors have positive impact on PM2.5, and most of natural factors have negative impact. (4) Among the influencing factors, contributions to local atmospheric pollution with direct effect are: mean wind speed > annual mean temperature > population density > relief amplitude > the secondary industry share of GDP > energy consumption > vegetation coverage; however, per capita GDP, annual precipitation, and relative humidity have no significant effect on local pollution. (5) Contributions to neighborhood atmospheric pollution with spatial spillover effect are: vegetation coverage > relief amplitude > population density. The findings suggest that we should adopt the adaptation strategies for natural factors and control strategies for human factors. A coordinated and strengthened cooperation between local governments should be established for air pollution control, and environmental planning and legislation should be strengthened in a new round of urban agglomeration planning in China.
京津冀城市群大气污染的时空特征与影响因素解析
Importance of landscape heterogeneity in sustaining hydrologic ecosystem services in an agricultural watershed
Temporal and spatial evolutionary characteristics of tourism intensity in the border areas
边境地区旅游强度时空演化特征分析
Effect of urban growth pattern on land surface temperature in China: A multi-scale landscape analysis of 338 cities
The difficulties and countermeasures of coal consumption controlling under the background of energy revolution strategy: Taking Jilin province with high coal consumption as an example
能源革命战略背景下控制煤炭消费的困境与对策: 以高比例煤炭消费的吉林省为例
The surface urban heat island response to urban expansion: A panel analysis for the conterminous United States
Surface urban heat islands in Italian metropolitan cities: Tree cover and impervious surface influences
Exploring indicators for quantifying surface urban heat islands of European cities with MODIS land surface temperatures
DOI:10.1016/j.rse.2011.07.003 URL [本文引用: 1]
Surface urban heat island across 419 global big cities
DOI:10.1021/es2030438 URL [本文引用: 1]
Influence of landscape features on urban land surface temperature: Scale and neighborhood effects
Direct human influence of irrigation on atmospheric water vapour and climate
DOI:10.1007/s00382-004-0402-4 URL [本文引用: 1]
Comparison of the urban heat island intensity quantified by using air temperature and Landsat land surface temperature in Hangzhou, China
DOI:10.1016/j.ecolind.2016.09.009 URL [本文引用: 1]
Thermal environment effects of urban human settlements and influencing factors based on multi-source data: A case study of Changsha city
基于多源数据的长沙市人居热环境效应及其影响因素分析
Human-induced changes in the hydrology of the western United States
DOI:10.1126/science.1152538
PMID:18239088
[本文引用: 1]
Observations have shown that the hydrological cycle of the western United States changed significantly over the last half of the 20th century. We present a regional, multivariable climate change detection and attribution study, using a high-resolution hydrologic model forced by global climate models, focusing on the changes that have already affected this primarily arid region with a large and growing population. The results show that up to 60% of the climate-related trends of river flow, winter air temperature, and snow pack between 1950 and 1999 are human-induced. These results are robust to perturbation of study variates and methods. They portend, in conjunction with previous work, a coming crisis in water supply for the western United States.
Elevation-dependent warming in mountain regions of the world
DOI:10.1038/nclimate2563 URL [本文引用: 4]
Warming in the Tibetan Plateau: Possible influences of the changes in surface water vapor
Robust responses of the hydrological cycle to global warming
DOI:10.1175/JCLI3990.1 URL [本文引用: 1]
The influence of underlying surface on land surface temperature: A case study of urban green space in Harbin
DOI:10.1016/j.egypro.2018.11.240 URL [本文引用: 1]
Analyses of land surface temperature (LST) variability among local climate zones (LCZs) comparing Landsat-8 and ENVI-met model data
Land use/land cover change and surface urban heat island intensity: Source-sink landscape-based study in Delhi, India
DOI:10.1007/s10668-019-00515-0
[本文引用: 1]
Urbanization-induced rapid land use/land cover change (LULCC) modifies the thermal characteristics of a region at local scale and often creates urban heat island (UHI) effects. Delhi also experiences such enhancing UHI scenario. In present study, LULCC was linked with the land surface temperature (LST), and surface urban heat island intensity (SUHII) was measured at the sub-district level. Landsat imageries and MODIS LST product for 2001, 2009 and 2017 were main data sources. LULC classification and LST were derived using maximum likelihood classification and single-channel algorithm techniques, respectively. Proposed LULC classification scheme was built-up, current fallows land, bare land (or source landscape); and crop land, vegetation and water bodies (or sink landscape). SUHII was calculated using the contribution index of both source and sink landscapes and landscape index (LI). Results from LI also supported with temperature vegetation feature space index, transformed difference vegetation index, enhanced vegetation index, diurnal temperature range, population density and transect analysis. The result showed that sub-districts of North, North-East, East and West Delhi were more prone to SUHII due to the highly dense built-up area and industrial area. SUHII was comparatively low in the sub-districts of South and South-West Delhi because of less built-up area as well the presence of greenery. Not only built-up but also fallow land and barren land contributed significantly in some places, i.e. South and South-West Delhi. Besides, urban green space and green crop field reduced the LST sufficiently in some areas, i.e. Najafgarh and New Delhi. Again, this study could help to understand UHI in Delhi at sub-district level.
A hierarchical analysis of the relationship between urban impervious surfaces and land surface temperatures: Spatial scale dependence, temporal variations, and bioclimatic modulation
DOI:10.1007/s10980-016-0356-z URL [本文引用: 1]
Examining the relationship between spatial configurations of urban impervious surfaces and land surface temperature
DOI:10.1007/s11769-019-1055-x URL [本文引用: 1]
Spatial relationship of greenspace landscape pattern with land surface temperature in three cities of southern Fujian
闽南三市绿地景观格局与地表温度的空间关系
Spatial and temporal changes of urban thermal landscape pattern in rapid urbanization areas: Taking Tangshan urban built-up area as examples
快速城镇化地区热岛景观动态变化研究: 以唐山市建成区为例
