查良松 , 邓国徽
, 邓国徽
ZHA Liangsong, DENG Guohui
收稿日期: 2015-07-27
修回日期: 2015-08-25
网络出版日期: 2015-11-20
版权声明: 2015 《地理学报》编辑部 本文是开放获取期刊文献,在以下情况下可以自由使用:学术研究、学术交流、科研教学等,但不允许用于商业目的.
基金资助:
作者简介:
作者简介:查良松(1953-), 男, 安徽铜陵人, 教授, 中国地理学会会员(S110000074M), 主要研究方向为环境变化与GIS应用等。E-mail:chaliangs@sina.com
展开
摘要
基于GIS和RS技术,利用修正的通用土壤流失方程(RUSLE)模型,结合遥感影像、DEM数据、土壤类型数据及相关统计确定了模型中参数因子,计算出巢湖流域1992-2013年土壤侵蚀模数,分析了土壤侵蚀强度的时空动态变化特征。结果表明:巢湖流域土壤侵蚀区域主要呈东北至西南方向分布。微度、轻度、中度、强度、极强和剧烈侵蚀占土壤侵蚀总面积百分比分别是93.46%、6.25%、0.68%、0.19%、0.01%、0.01%。1992-2006年土壤侵蚀模数由510.70 t/(km2·a)减少到129.79 t/(km2·a),降幅为74.59%,同时植被覆盖率由37.0%增至47.80%,土壤侵蚀的面积比例变化明显,轻度、中度、强度、极强和剧烈侵蚀由8.93%、2.33%、1.32%、0.09%、0.05%分别减少为4.74%、1.39%、0.28%、0.02%、0.01%,微度侵蚀由87.88%增加到94.16%。但2013年土壤微度侵蚀又减少为93.46%,土壤微度侵蚀有向高一级转换趋势。2006-2013年土壤侵蚀模数也由129.79 t/(km2·a)增加到149.44 t/(km2·a),增幅为15.14%。
关键词:
Abstract
With the help of GIS and RS technology, and based on remote sensing image data, DEM data, soil type data and relevant statistical data, we use the modified universal soil loss equation (RUSLE) as the evaluation model to determine the relevant parameters of the model, to calculate the soil erosion modulus in Chaohu Watershed from 1992 to 2013, and to analyze the spatial and temporal dynamic changes of soil erosion intensity in this region. The soil erosion area in Chaohu basin is mainly distributed in the NE-SW direction. Slight, mild, moderate, intense, strong and severe erosion accounted for 93.46%, 6.25%, 0.68%, 0.19%, 0.01% and 0.01% of the total watershed area respectively. The largest erosion area was paddy field, accounting for 64.42% of the total watershed, followed by woodland (20.98%) and urban and industrial land (10.36%), which was based on micro erosion and mild erosion mentioned above. From 1992 to 2006, the soil erosion modulus decreased from 510.70 t/(km2·a) to 129.79 t/(km2·a), falling by 74.59%, while the vegetation cover increased from 37% to 47.80%. The change of soil erosion area was obvious: mild (8.93%), moderate (2.33%), intense (1.32%), extreme (0.09%) and severe erosion (0.05%) were reduced to 4.74%, 1.39%, 0.28%, 0.02% and 0.01%, respectively, while slight erosion increased from 87.88% to 94.16%. However, the slight erosion reduced to 93.46%, and the slight erosion had a worsening trend in 2013. From 1992 to 2013, the soil erosion modulus increased from 129.79 t/(km2·a) to 149.44 t/(km2·a), an increase of 15.14%, meanwhile the vegetation cover rate decreased from 47.80% to 45.15%.
Keywords:
日益严重的土壤侵蚀对农业生产、水质、水文系统等构成威胁,是制约人类可持续发展的严重问题[1]。中国是世界上土壤侵蚀最严重的国家之一 [2],据2001年第二次全国土壤侵蚀遥感调查,全国水蚀和风蚀面积为356.9万 km2,占国土面积的约37%[3]。无论山区、丘陵区、风沙区,还是农村、城市,都存在不同程度的土壤侵蚀问题[4]。因此,明晰土壤侵蚀的时空动态变化对评价水土治理、以及更深入指导水土保持建设有着重要意义。
运用模型的方法开展定量测度是土壤侵蚀研究的常用手段。根据模型建立的方法和模拟过程,可以分为经验模型、物理过程模型和分布式模型[5]。20世纪60年代,美国学者Wischmeier等最早建立了通用土壤流失方程(USLE)[6]。随着农业开发的需要,1985年美国学者对USLE局限性进行修正,研发了RUSLE模型[7]。鉴于RUSLE模型应用性及参数选择,国内外学者进行了大量的研究,Prasannakumar V等[8]将RUSLE模型与地理信息系统(GIS)技术相结合对印度的Siruvani流域进行了土壤侵蚀风险评估,De Asis等[9]将RUSLE模型与线性光谱混合分析(LSMA)方法相结合对菲律宾拉梅萨流域进行了土壤侵蚀评估,卜兆宏[10]基于RUSLE模型的结构,引入遥感数据开发出与RUSLE模型相媲美的水土流失定量遥感方法,刘宝元等[11]以USLE/RUSLE为基础,通过研究坡面侵蚀量预报经验模型后,建立适用于全中国土壤流失预报方程(CSLE),江忠善等[12]将沟间地与沟谷地区别对待,分别建立了侵蚀模型。20世纪90年代相继出现了很多基于土壤侵蚀过程的物理模型,其中以美国的WEPP[13]模型最具代表性,分布式模型以SHE[14]最为典型,由于土壤侵蚀过程的物理模型和分布式模型需要众多参数,实用性有所限制,因此以USLE/RUSLE模型应用最为广泛。
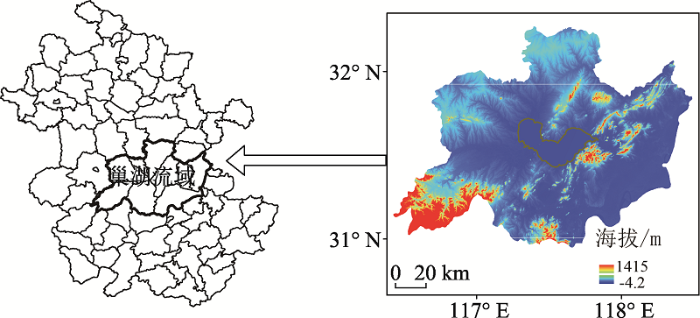
巢湖流域总面积约13486 km2,巢湖闸以上集水面积约9130 km2。流域内以丘陵、平原为主。本文采用RUSLE模型研究巢湖流域近20年来的土壤侵蚀的时空变化特征,旨在为巢湖流域水土保护措施的制定以及皖江城市带环境建设提供理论依据和科学参考。
巢湖流域位于安徽省中部,116°24′30″~118°0′00″E,30°58′40″~32°6′00″N(图1),巢湖主要支流有杭埠河、南淝河、派河、赵河、十五里河、塘西河、白石天河、双桥河、柘皋河等,湖泊蓄水后由裕溪河注入长江。巢湖闸下涵盖无为县、和县和含山县。巢湖流域属亚热带和暖温带过渡性的副热带季风气候,年平均气温15~16 ℃,年平均降水量约1100 mm,局部特大暴雨基本两年发生一次。土壤类型主要是水稻土、黄褐土,紫色土,棕壤,石灰土等。
数据主要包括:1:5万地形图;SRTM 90 m DEM数据(来源于中国科学院计算机网络信息中心国际科学数据镜像网站http://www.gscloud.cn);1992年、2000年、2006年、2013年4期共8景TM/ETM+/Landsat8遥感影像(来源于中国科学院对地观测与数字地球科学中心和中国科学院科学数据中心国际科学数据服务平台,表1),为便于数据比较,尽量选择同一时相的影像,对每期影像拼接,结合1:5万地形图选择控制点进行几何精校正,确保各个时相的遥感影像几何误差在一个像元之内。并以校正后的2006年Landsat ETM+影像为参考标准;配合遥感影像识别的野外调查数据;安徽省土壤类型分布图(来源于全国第二次土壤普查的成果图);1983-2013年流域内及周边六安、合肥、巢湖、寿县、蚌埠、滁州、霍山、桐城等13个市县气象站点年、月平均降水量数据(来源于中国气象科学数据共享服务网http://cdc.nmic.cn/home.do)。
表1 卫星影像数据及其特征
Tab. 1 Satellite image data and its characteristics
| 影像数据 | 成像时间 | 条带号 | 地面分辨率(m) |
|---|---|---|---|
| Landsat TM | 1992-07-23 | 121/38 | 30 |
| Landsat TM | 1991-08-31 | 120/38 | 30, 15 |
| Landsat ETM+ | 2000-07-05 | 121/38 | 30, 15 |
| Landsat ETM+ | 2000-06-12 | 120/38 | 30, 15 |
| Landsat ETM+ | 2006-07-30 | 121/38 | 30, 15 |
| Landsat ETM+ | 2006-07-31 | 120/38 | 30, 15 |
| Landsat 8 OLI_TIRS | 2013-05-13 | 121/38 | 30, 15 |
基于GIS平台,采用土壤侵蚀模型计算分析土壤侵蚀量及模型各因子空间分布,并与安徽省水土保持监测公告结果比较,同时以转换矩阵方式分析1992-2013年的土壤侵蚀强度的空间动态变化。其修正的通用土壤侵蚀模型(RUSLE)[15]为:
式中:A为预测土壤侵蚀量[t/(hm2·a)];R为降水侵蚀力因子[(MJ
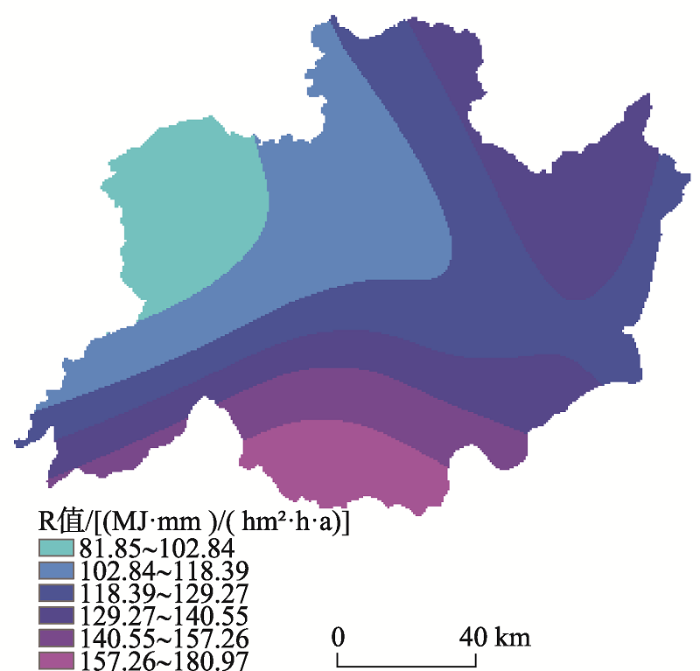
2.4.1 降水侵蚀力因子R R反映降水产生的径流对土壤造成侵蚀的动力指标,它受降水量、降水强度等综合影响,是降水特性的函数[16]。为了便于资料的获取与计算,目前中国估算年R值的方法多数采用年降水量和月降水量因子,王万忠等[17]在分析中国降水侵蚀力R值区域分布特征的基础上,进行了计算误差对比。作者根据前期分析安徽省降水侵蚀力的工作,采用Wischmeier提出并经Arnoldus[18]修正的直接利用年水量和月降水量来推求R值的经验公式:
式中:
图2 巢湖流域降水侵蚀力空间分布
Fig. 2 The rainfall erosivity spatial distribution of Chaohu Watershed
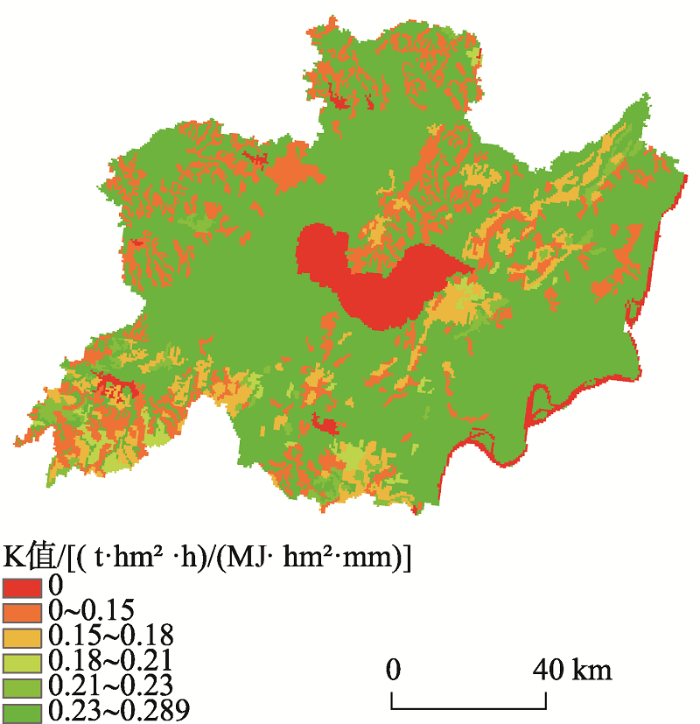
2.4.2 土壤可蚀性因子K K是土壤性质中的一个重要因子,它可评价土壤是否易受侵蚀营力破坏,也可反映土壤对侵蚀营力分离和搬运作用的敏感性[19]。RUSLE模型中土壤可蚀性因子K值是经过试验获得的定量数值,通常以标准小区单位降水侵蚀力所造成的土壤流失量获得,因此计算K值的最好方法是通过天然小区直接测定。在该流域大规模布设天然小区很难做到,所以本研究利用Williams等[20]在EPIC模型中土壤可蚀性因子K的计算方法,该方法由蔡崇法等[21]在小流域进行应用研究,利用公式(3)计算K值与实测值基本无差异,且此方法简便。其公式:
式中:Wd为砂粒含量(%);Wi为粉粒含量(%);Wt为黏粒含量(%);Wc为有机碳含量(%);其中:
通过公式(3)、(4)计算各土壤类型的K值,其单位为国际制(t·hm2·h)/(MJ·hm2·mm),如表2所示:黄褐土0.299,潮土0.253,黄棕壤0.362等,然后将K值赋于土壤类型图的属性值,进行数据转换成30 m栅格大小的Grid格式,得到土壤可蚀性K值的空间分布图(图3)
表2 巢湖流域不同土壤类型的理化性质及K值
Tab. 2 Different types of soil physical and chemical properties of Chaohu Watershed and its K value
| 土类名称 | 亚类名称 | 土属名称 | PH值 | 全氮(g/kg) | 全磷(g/kg) | 全钾(g/kg) | k值 |
|---|---|---|---|---|---|---|---|
| 潮土 | 灰潮土 | 石灰性砂泥土 | 8.55 | 0.098 | 0.063 | 1.91 | 0.253 |
| 水稻土 | 潴育水稻土 | 马肝田 | 6.92 | 0.210 | 0.066 | 1.96 | 0.282 |
| 紫色土 | 石灰性紫色 | 石灰性紫色土 | 7.40 | 0.074 | 0.023 | 1.91 | 0.000 |
| 黄褐土 | 粘盘黄褐土 | 马肝土 | 6.98 | 0.061 | 0.026 | 1.96 | 0.299 |
| 水稻土 | 渗育水稻土 | 渗泥质田 | 6.02 | 0.208 | 0.042 | 2.36 | 0.249 |
| 水稻土 | 潜育水稻土 | 青泥田 | 6.07 | 0.085 | 0.022 | 1.86 | 0.248 |
| 水稻土 | 淹育水稻土 | 浅马肝田 | 7.35 | 0.057 | 0.020 | 1.67 | 0.249 |
| 黄棕壤 | 黄棕壤 | 铁质黄棕壤 | 6.89 | 0.071 | 0.323 | 1.44 | 0.362 |
| 粗骨土 | 酸性粗骨土 | 硅铁质砂砾土 | 5.10 | 0.102 | 0.137 | 2.24 | 0.000 |
| 水稻土 | 漂洗水稻土 | 澄白土田 | 7.44 | 0.012 | 0.030 | 1.35 | 0.250 |
| 石质土 | 酸性石质土 | 硅质岩砾质土 | 4.90 | 0.088 | 0.018 | 1.13 | 0.000 |
| 水稻土 | 脱潜水稻土 | 脱青潮砂泥田 | 6.32 | 0.083 | 0.019 | 2.02 | 0.254 |
| 石灰岩土 | 棕色石灰土 | 棕色石灰土 | 6.70 | 0.144 | 0.052 | 1.67 | 0.384 |
| 石灰岩土 | 黑色石灰土 | 黑色石灰土 | 7.57 | 0.341 | 0.111 | 1.32 | 0.384 |
| 紫色土 | 酸性紫色土 | 酸性紫色土 | 4.43 | 0.083 | 0.028 | 1.79 | 0.000 |
| 潮土 | 潮土 | 两合土 | 8.27 | 0.065 | 0.051 | 1.75 | 0.253 |
| 紫色土 | 中性紫色土 | 中性紫色土 | 6.60 | 0.072 | 0.027 | 2.04 | 0.000 |
| 黄棕壤 | 黄棕壤性土 | 黄棕壤性土 | 4.87 | 0.104 | 0.021 | 1.24 | 0.362 |
| 红壤 | 黄红壤 | 铁质黄红壤 | 4.79 | 0.087 | 0.041 | 1.73 | 0.217 |
| 棕壤 | 酸性棕壤 | 硅铝质暗棕土 | 5.34 | 0.056 | 0.100 | 1.83 | 0.314 |
| 黄棕壤 | 暗黄棕壤 | 硅铝质暗黄棕壤 | 5.19 | 0.150 | 0.030 | 2.56 | 0.362 |
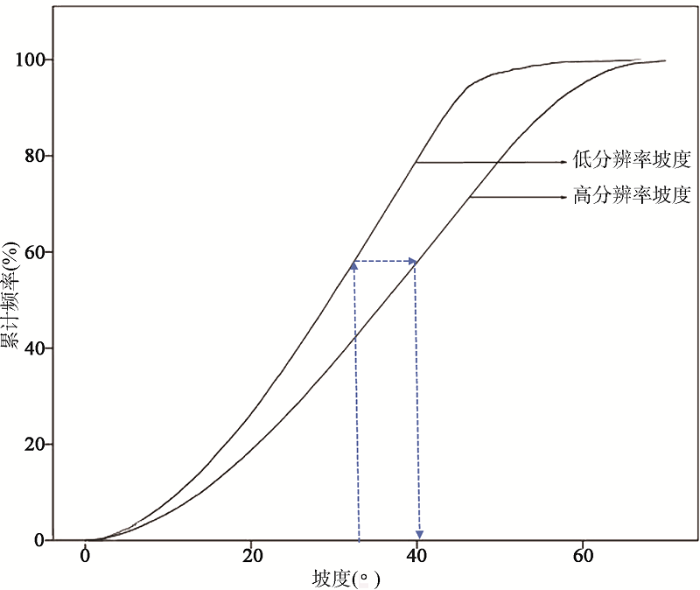
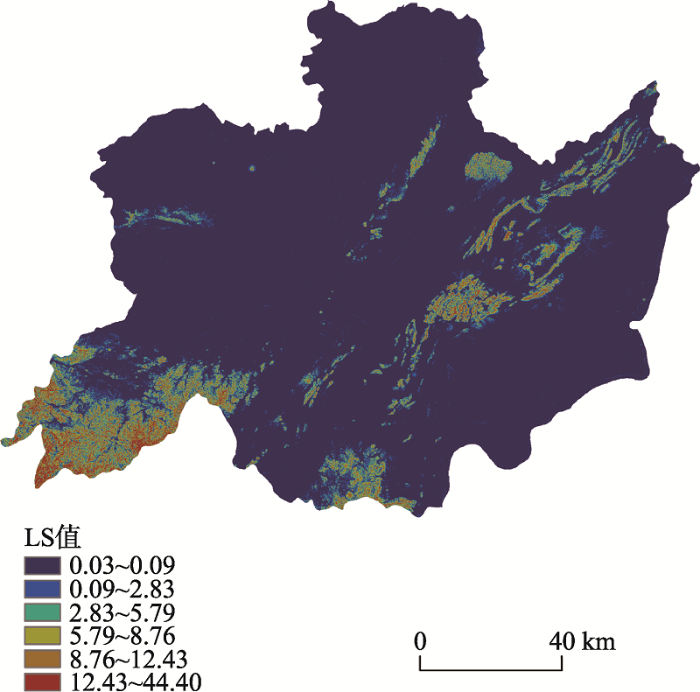
2.4.3 坡度坡长因子LS 地形地貌对土壤侵蚀有着重要的影响,RUSLE模式中斜坡长度因子(L),坡度因子(S)在不同的区域有变化。小流域尺度上LS可以用实测数据得到,在本流域尺度上LS因子以DEM进行提取,采用中低分辨率DEM进行LS的计算。已有研究表明,使用中低分辨率的DEM不能正确得到实际地的坡度坡长,且坡度减少,坡长增加[22-23],从而影响土壤侵蚀评价的精度。所以,本研究利用直方图匹配获得高分辨率的坡度值[24],方法如下:首先,将由高分辨率DEM(25 m)和低分辨率DEM(90 m)生成坡度值图,进行频率和累积频率的统计,然后对坡度进行改正(图4),即参考两种分辨率的坡度累积频率曲线,找到相同累积频率对应的坡度,将其作为坡度的改正值。如果值在两者之间不能准确对应的,则用差分的方法计算得到对应的坡度值,再将低分辨率的坡度值和坡度改正值曲线进行回归统计分析,得到拟合不同的回归函数,通过模型检验得到一个最佳回归函数(公式5)。最后将低分辨率坡度X带入公式5,利用ArcGIS地图代数功能,进行坡度的尺度变换。
式中:Y为改正后坡度;X为低分辨率坡度。
同时采用Moore等[25]提出的方法进行LS因子计算,该方法基于水流功率理论和物理过程,充分考虑了径流和水文过程的影响,在水系发达的巢湖流域更为适用。其公式为:
式中:Flow Accum为汇水累计量;Cell Size为栅格像元大小;slope为坡度。利用研究区的DEM和ArcGIS提取出汇水累积量以及坡度,结合上述公式即可得到研究区的LS分布图(图5)。
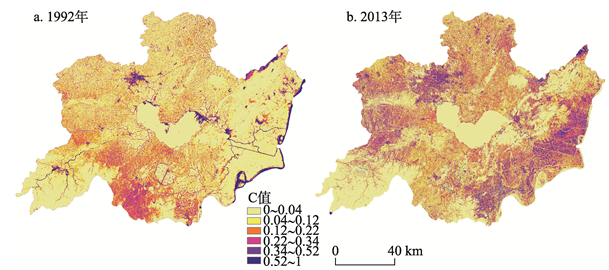
2.4.4 植被覆盖和管理因子C C为一定植被覆盖和管理措施下土壤流失量与同等条件下适时翻耕、连续休闲对照地上土壤流失量之比。它是土壤侵蚀力的抑制因子,起着水土保持的作用。对C值的确定,目前主要有三种方法:人工赋值法、小区实验法、基于植被覆盖度的遥感数据定量估算法。而NDVI是计算C因子的一个最普遍的数据[26]。本文基于植被覆盖度的遥感数据定量估算法确定C值,该方法适用广泛,但无法反映地表枯落叶信息[27]。根据Van der Knijff M[28-29]提出的利用NDVI确定C因子。C因子与NDVI的关系为:
式中:
图6 1992年和2013年巢湖流域C值分布图
Fig. 6 The C-value distribution of Chaohu Watershed in 1992 and 2013
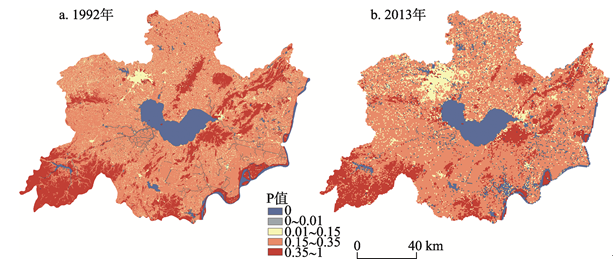
2.4.5 水土保持措施因子P 指在有一定水土保护措施的作用下,土壤流失面积与标准状况下土壤流失面积之比。水土保护措施有:等高耕作、等高带状种植、梯田、调整水流形态、斜坡坡度和表面流的汇流方向、减少径流量、降低径流速率用来减轻土壤侵蚀等方式。其值在0~1之间,0值代表根本不发生土壤侵蚀,1值表明水土保持措施完全失效。对于P值的确定,目前主要通过布设天然小区试验得来,考虑到物力财力等综合因素在流域尺度上更难布设大规模的天然径流小区,所以本研究结合以往作者研究成果和安徽省土地利用及农事活动情况,依据表3[30]中P值对安徽省土地利用现状图进行数字化处理,将P因子值赋予相应的土地利用类型中,得到安徽省P因子图层,生成水土保持因子分布图(图7)。从图看出:水土保持措施因子P值2013年比1992年小,尤其在该流域北侧,即合肥市以北地区更为突出,说明水土保持措施成效明显。
图7 1992年和2013年巢湖流域P值分布图
Fig. 7 The P-value distribution of Chaohu Watershed in 1992 and 2013
表3 不同土地利用类型的P值
Tab. 3 The P value of different land use types
| 土地利用类型 | 水田 | 旱地 | 林地 | 疏林地 | 草地 | 水域 | 居民地 | 裸岩 |
|---|---|---|---|---|---|---|---|---|
| P值 | 0.15 | 0.35 | 1.0 | 1.0 | 1.0 | 0.0 | 0.0 | 0.0 |
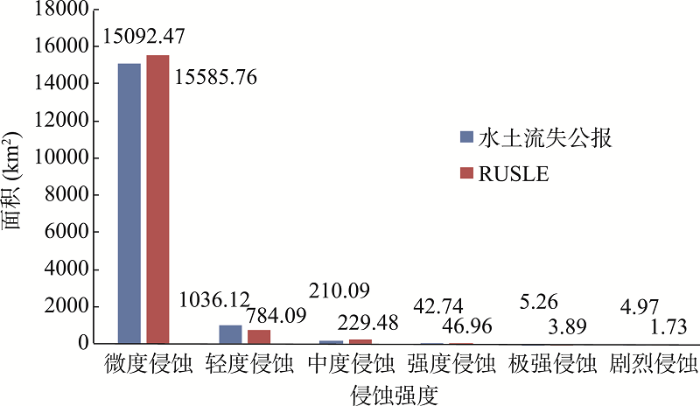
根据安徽省水利厅提供的六安市椿树岗坡面径流观测场水土保持监测点的径流小区实测资料,2013年径流小区实测的侵蚀模数为25.71 t/(km2·a),用RUSLE模型计算的侵蚀模数为21.49 t/(km2·a),计算与实测比83.59%,并把RUSLE计算的侵蚀面积与安徽省水土保持监测公报(2005年)结果进行比较(图8)。从图8可知模型计算土壤侵蚀区域与水土保持监测公报的结果比:土壤轻度侵蚀到剧烈侵蚀的计算结果(1060.6)与监测结果(1299.2)的比是81.6%,土壤微度侵蚀的计算结果(15585.8)与监测结果(15092.5)比是103%,整体的计算结果与监测结果基本一致,说明在巢湖流域用RUSLE模型计算的土壤侵蚀模数与侵蚀面积值得进一步分析。
图8 RUSLE模型与安徽省水土保持监测公告结果比较
Fig. 8 Comparison of RUSLE result and Anhui bulletin about soil and water conservation
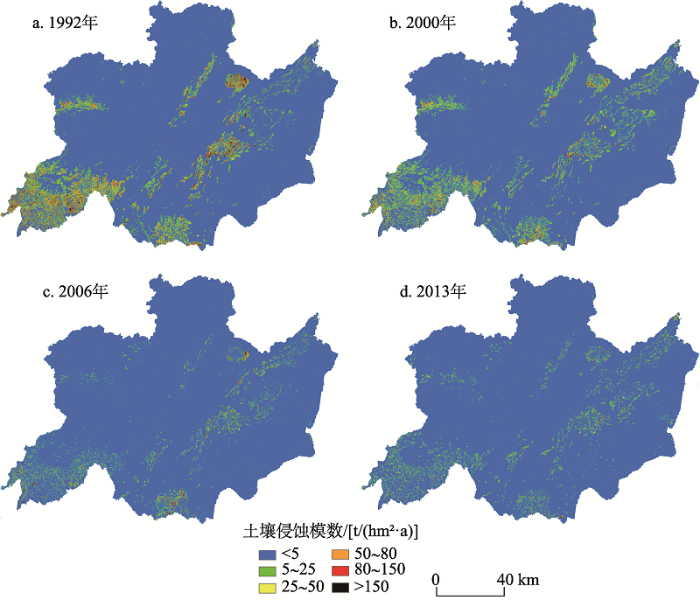
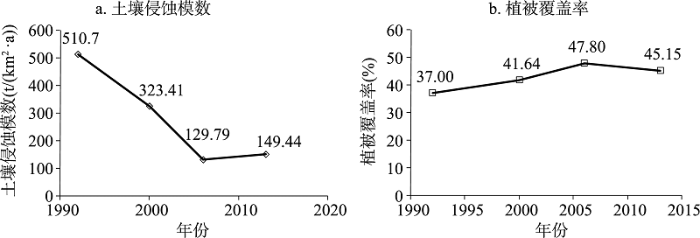
将所得的降水侵蚀力因子图、土壤可蚀性因子图、坡度坡长因子图、植被覆盖和管理因子图与水土保持措施因子图转化统一分辨率(30 m)后,在ArcGIS中相乘,得到1992-2013年巢湖流域土壤侵蚀模数(图9)和流域内土壤侵蚀模数平均数值(图10a)。结果表明:1992-2013年巢湖流域年平均土壤侵蚀模数减 少趋势明显,降幅为70.74%。1992年土壤侵蚀模数为510.70 t/(km2·a),2006年为129.79 t/(km2·a),1992-2006年降幅为74.59%,但2006-2013侵蚀模数稍有增加,增幅为15.14%,这主要与植被覆盖率减少有关(图10b)。
图9 1992-2013年巢湖流域土壤侵蚀模数
Fig. 9 The soil erosion modulus in Chaohu Watershed from 1992 to 2013
图10 1992-2013年巢湖流域土壤侵蚀模数(a)和植被覆盖率(b)
Fig. 10 Variations of soil erosion modulus (a) and the vegetation coverage rate (b) in Chaohu Watershed from 1992 to 2013
根据水利部颁布的《(SL190-2007)土壤侵蚀分类分级标准》[31],得到巢湖流域土壤侵蚀分级指标图,总共分为6个级别,微度侵蚀、轻度侵蚀、中度侵蚀、强度侵蚀、极强侵蚀、剧烈侵蚀,各侵蚀强度所占整个流域的侵蚀面积百分比(表4)。从表中可知,1992-2013年,轻度侵蚀、中度侵蚀、强度侵蚀、极强侵蚀、剧烈侵蚀分别降幅30.0%、70.81%、85.60%、88.89%、80%;微度侵蚀增幅6.3%,总趋势轻度侵蚀到剧烈侵蚀强度所占面积向土壤侵蚀的低级别转移。但2006-2013年,土壤微度侵蚀减少了0.74%。意味着土壤微度侵蚀有向高一级别的侵蚀转移。
表4 1992-2013年巢湖流域不同土壤侵蚀强度面积的百分比变化(%)
Tab. 4 The variation of the area ratio of each soil erosion intensity in Chaohu Watershed from 1992 to 2013
| 侵蚀强度 | 微度 | 轻度 | 中度 | 强度 | 极强 | 剧烈 |
|---|---|---|---|---|---|---|
| 1992年 | 87.88 | 8.93 | 2.33 | 1.32 | 0.09 | 0.05 |
| 2000年 | 90.63 | 6.84 | 1.75 | 1.24 | 0.09 | 0.05 |
| 2006年 | 94.16 | 4.74 | 1.39 | 0.28 | 0.02 | 0.01 |
| 2013年 | 93.46 | 6.25 | 0.68 | 0.19 | 0.01 | 0.01 |
由NDVI计算的图10b可知,尽管是通过一次TM影像数据得到,但基本都是夏季同期数据,可客观反映一些问题。1992-2006年,植被覆盖率微弱增加,这与安徽省启动退耕还林、退耕还湖等政策有关,同时,土壤侵蚀模数明显下降;2006年至2013年植被覆盖率有下降趋势,这可能与交通、居民点等基本建设时间长,不能即时恢复植被有关,同时,土壤侵蚀模数有敏感上升趋势。由统计年鉴得知,从2006-2013年巢湖流域城市化率由35.32%增加到45.86%,城市规模显著扩大,迅速城市化造成环境的压力在增加[32],因此,必须要科学地协调基本建设与环境保护的关系。
巢湖流域1992年、2000年、2006年、2013年的土壤侵蚀分布格局基本一致,流域内的侵蚀区域主要呈流域东北至西南对角线方向分布,其中,微度侵蚀区域主要分布在沿南淝河、杭埠河、天河等河流的中下游冲积平原区以及一些植被覆盖较好的低山丘陵区。轻度、中度、强度、极强和剧烈侵蚀区域主要分布在杭埠河、丰乐河、天河、黄泥河、裕溪河、滁河中上游以及流域四周的丘陵区。极强和剧烈侵蚀区域主要分布在杭埠河上游河棚镇、大别山北部以及含山县内。剧烈侵蚀主要分布在舒城县龙河口水库低山丘陵区以及郭公河、西河附近的无为县牛埠镇昆山乡附近区域。特别是中部龙河口水库四周的低山丘陵地带,由于人口密集,大量的陡坡垦荒,造成水库淤积,土壤侵蚀严重。
对不同侵蚀等级的面积数据进行统计,得到不同年份间土壤侵蚀强度的转移矩阵(表5)。由表可知:1992年向2000年土壤侵蚀在轻度、中度和强度侵蚀等级上转化明显。轻度侵蚀中38.86%转化为微度侵蚀,中度侵蚀中34.08%转化为轻度侵蚀,强度侵蚀中却有32.97%转化为中度侵蚀。2000年向2006年土壤侵蚀在轻度、中度、强度、极强侵蚀等级上转化明显。轻度侵蚀中60.77%转化为微度侵蚀,中度侵蚀中57.69%转化为轻度侵蚀,强度侵蚀中75.21%转化为中度侵蚀,极度侵蚀中60.41%转化为强度侵蚀,而剧烈侵蚀中只有3.67%转化为极强侵蚀。2006年向2013年土壤侵蚀在中度和强度侵蚀等级上转化明显。中度侵蚀中89.35%转化成轻度侵蚀,强度侵蚀中76.03%转化成中度侵蚀。
表5 1992-2013年巢湖流域土壤侵蚀强度转移矩阵
Tab. 5 The diverting matrix of soil erosion intensity in Chaohu Watershed from 1992 to 2013
| 微度 | 轻度 | 中度 | 强度 | 极强 | 剧烈 | 总计 | |
|---|---|---|---|---|---|---|---|
| 1992年 | → 2000年 | ||||||
| 微度 | 14299.66 | 201.12 | 29.65 | 14.58 | 0 | 0 | 14545.01 |
| 轻度 | 574.24 | 798.62 | 85.17 | 19.63 | 0 | 0 | 1477.65 |
| 中度 | 128.27 | 131.68 | 98.67 | 27.02 | 0.60 | 0.09 | 386.33 |
| 强度 | 0.01 | 1.90 | 72.23 | 137.89 | 6.93 | 0.11 | 219.07 |
| 极强 | 0 | 0 | 2.34 | 2.59 | 5.18 | 5.33 | 15.44 |
| 剧烈 | 0 | 0 | 1.74 | 3.31 | 1.57 | 1.81 | 8.43 |
| 总计 | 15002.17 | 1133.32 | 289.79 | 205.02 | 14.27 | 7.35 | |
| 2000年 | → 2006年 | ||||||
| 微度 | 14791.57 | 166.92 | 30.28 | 13.40 | 0 | 0 | 15002.17 |
| 轻度 | 688.68 | 415.51 | 21.26 | 7.87 | 0 | 0 | 1133.32 |
| 中度 | 95.46 | 167.18 | 20.99 | 5.67 | 0.39 | 0.11 | 289.79 |
| 强度 | 10.06 | 34.48 | 154.20 | 5.80 | 0.37 | 0.11 | 205.02 |
| 极强 | 0 | 0 | 2.61 | 8.62 | 2.86 | 0.17 | 14.27 |
| 剧烈 | 0 | 0 | 0.14 | 5.60 | 0.27 | 1.33 | 7.35 |
| 总计 | 15585.76 | 784.09 | 229.48 | 46.96 | 3.89 | 1.73 | |
| 2006年 | → 2013年 | ||||||
| 微度 | 15246.95 | 279.02 | 43.95 | 15.85 | 0 | 0 | 15585.76 |
| 轻度 | 212.97 | 543.66 | 21.61 | 5.85 | 0 | 0 | 784.09 |
| 中度 | 8.61 | 205.06 | 10.64 | 4.22 | 0.89 | 0.07 | 229.49 |
| 强度 | 0.64 | 6.77 | 35.71 | 3.01 | 0.75 | 0.08 | 46.96 |
| 极强 | 0 | 0 | 0.63 | 1.88 | 0.62 | 0.76 | 3.89 |
| 剧烈 | 0 | 0 | 0.73 | 0.75 | 0.19 | 0.07 | 1.73 |
| 总计 | 15469.16 | 1034.51 | 113.27 | 31.56 | 2.45 | 0.98 | |
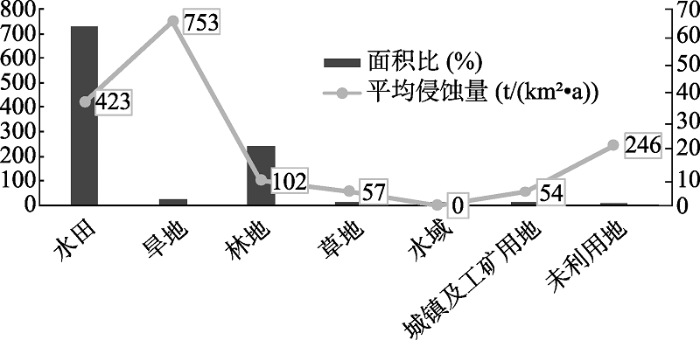
选取2013年土壤侵蚀图与2013年土地利用图(通过目视判定并结合野外实地考察收集的实测资料进行精度评价,总体精度达85.67%,可满足实际应用要求)进行叠加分析,可以得到不同土地利用类型的土壤侵蚀强度分布情况(图11,表6)。在各土地利用类型中,侵蚀面积最大的是水田,占流域侵蚀总面积64.42%;其次是林地20.98%、城镇及工矿用地10.36%;旱地,水域和其他土地利用类型侵蚀面积较小,仅占流域侵蚀总面积的4.25%。由此可知,微度侵蚀和轻度侵蚀主要分布在水田、林地、旱地和城镇及工矿用地。水田的土壤侵蚀量最大,虽然旱地的侵蚀面积占流域总侵蚀面积很小,但侵蚀模数高达753 t/(km2·a),这说明巢湖流域对旱地的开发强度很大,侵蚀比较严重。
图11 巢湖流域不同土地利用类型的土壤侵蚀面积比及平均侵蚀量
Fig. 11 The percentage of the area of soil erosion and average soil erosion modulus under different land use types in Chaohu Watershed
表6 巢湖流域不同土地利用类型的土壤侵蚀面积百分比(%)
Tab. 6 The percentage of the area of soil erosion under different land use types in Chaohu Watershed
| 侵蚀强度 | 水田 | 旱地 | 林地 | 草地 | 水域 | 城镇及工矿用地 | 未利用地 |
|---|---|---|---|---|---|---|---|
| 微度 | 63.62 | 1.92 | 20.63 | 0.88 | 1.32 | 10.26 | 0.01 |
| 轻度 | 0.66 | 0.02 | 0.30 | 0.02 | 0.04 | 0.08 | 0.00 |
| 中度 | 0.08 | 0.00 | 0.03 | 0.00 | 0.01 | 0.01 | 0.00 |
| 强度 | 0.03 | 0.00 | 0.01 | 0.00 | 0.00 | 0.00 | 0.00 |
| 极强 | 0.02 | 0.00 | 0.01 | 0.00 | 0.00 | 0.00 | 0.00 |
| 剧烈 | 0.01 | 0.01 | 0.00 | 0.00 | 0.00 | 0.01 | 0.00 |
| 合计 | 64.42 | 1.95 | 20.98 | 0.91 | 1.38 | 10.36 | 0.01 |
(1)1992-2013年巢湖流域年平均土壤侵蚀模数减少趋势明显,1992年为510.70 t/(km2·a),2006年减少到129.79 t/(km2·a),降幅为74.59%,但2006-2013年期间,由于城市规模扩大,交通、建筑施工等,不注意环境保护,使土壤侵蚀模数增加到149.44 t/(km2·a),增幅为15.14%,植被覆盖率下降5.5%。
(2)土壤侵蚀主要呈巢湖流域东北—西南分布,微度侵蚀区域在巢湖沿岸以及河流的中下游的冲积平原区域,轻度、中度、强度、极度和剧烈侵蚀区域主要分布在低山丘陵和山区,极强侵蚀和剧烈侵蚀主要出现在舒城县等部分旱地和城镇及工矿用地中。
(3)在各土地利用类型中,土壤微度侵蚀占流域侵蚀总面积96%以上,其中侵蚀面积最大的是水田,占流域侵蚀总面积64.42%,其次林地20.63%,城镇及工矿用地10.36%,旱地,水域及其他土地利用类型侵蚀面积较小,仅占流域侵蚀总面积的4.25%。虽然旱地的侵蚀面积所占流域总侵蚀面积很小,但侵蚀模数高达753 t/(km2·a),土壤剧烈侵蚀占自身侵蚀总面积5.1%。
(4)1992-2013年,巢湖流域大部分地区土壤侵蚀强度向低一级转移。土壤侵蚀面积分布比例变化明显,轻度侵蚀、中度侵蚀、强度侵蚀、极度侵蚀和剧烈侵蚀由8.93%、2.33%、1.32%、0.09%、0.05%分别减少为6.25%、0.68%、0.19%、0.01%、0.01%,微度侵蚀由87.88%增加到93.46%。但土壤微度侵蚀2013年比2006年减少0.7%,轻度侵蚀面积增加1.51%,土壤侵蚀面积分布有向高一级转换趋势。同时植被覆盖率下降。
(5)巢湖流域土地类型结构调整、退耕还林、退耕还湖等措施形成了土壤侵蚀以微度、轻度为主,使生态环境有了改善。
致谢:感谢安徽省水利厅史志刚博士的咨询帮助!
The authors have declared that no competing interests exist.
| [1] |
Soil erosion impact on agronomic productivity and environment quality. https://doi.org/10.1080/07352689891304249 URL [本文引用: 1] 摘要
Mg of roots and tubers. The actual loss may depend on weather conditions during the growing season, farming systems, soil management, and soil ameliorative input used. Erosion-caused losses of food production are most severe in Asia, Sub-Saharan Africa, and elsewhere in the tropics rather than in other regions.
|
| [2] |
The retrospection and prospect on soil erosion research in China.
本文回顾了我国土壤侵蚀科学研究的历史,基于对我国土壤侵蚀科学研究面临的机遇与挑战求分析,提出了今后我国土壤侵蚀研究应加强的研究领域,包括土壤侵蚀过程与机理,土壤侵蚀预报模型,土壤侵蚀环境效应评价,侵蚀灾害预警,重大工程及全球变化对侵蚀环境影响和土壤侵蚀研究新技术与方法等。
我国土壤侵蚀科学研究回顾和展望 .
本文回顾了我国土壤侵蚀科学研究的历史,基于对我国土壤侵蚀科学研究面临的机遇与挑战求分析,提出了今后我国土壤侵蚀研究应加强的研究领域,包括土壤侵蚀过程与机理,土壤侵蚀预报模型,土壤侵蚀环境效应评价,侵蚀灾害预警,重大工程及全球变化对侵蚀环境影响和土壤侵蚀研究新技术与方法等。
|
| [3] |
Current status and developing trend of soil erosion in China.
利用第3次水土流失普查数据,分析我国目前水土流失总体状况,水蚀、风蚀和冻融侵蚀等不同类型水土流失状况以及东部、东北、中部和西部地区4大经济区域水土流失状况,并对水蚀区侵蚀危险度现状进行了评价。结合水利部开展的第1、2次全国水土流失普查数据,分析15年来水土流失的动态变化情况,以及我国主要江河流域多年来土壤流失量变化的状况。
我国水土流失状况与发展趋势研究 .
利用第3次水土流失普查数据,分析我国目前水土流失总体状况,水蚀、风蚀和冻融侵蚀等不同类型水土流失状况以及东部、东北、中部和西部地区4大经济区域水土流失状况,并对水蚀区侵蚀危险度现状进行了评价。结合水利部开展的第1、2次全国水土流失普查数据,分析15年来水土流失的动态变化情况,以及我国主要江河流域多年来土壤流失量变化的状况。
|
| [4] |
From the current situation as Ecology soil erosion and water conservation and the main task of strategic layout .https://doi.org/10.3969/j.issn.1000-0941.2002.06.002 URL [本文引用: 1] 摘要
全国第二次水土流失遥感调查成果表明,全国现有水土流失面积356万km2,其中轻度水蚀区绝大部分分布在东中部,中度水蚀区绝大部分在中西部,强度及其以上的水蚀区主要在西部地区,风蚀区基本分布在西部地区.全国防治水土流失的基本格局是,东部地区以预防保护为主,中部地区要防治兼顾、综合治理、综合开发,西部地区治理难度大,应坚持综合防治.当前面上治理的重点应放在55万km2中度水蚀区和25万km2中度风蚀区,国家重点治理区是27万km2强度以上水蚀区.
从我国水土流失现状看水土保持生态建设战略布局及主要任务 .https://doi.org/10.3969/j.issn.1000-0941.2002.06.002 URL [本文引用: 1] 摘要
全国第二次水土流失遥感调查成果表明,全国现有水土流失面积356万km2,其中轻度水蚀区绝大部分分布在东中部,中度水蚀区绝大部分在中西部,强度及其以上的水蚀区主要在西部地区,风蚀区基本分布在西部地区.全国防治水土流失的基本格局是,东部地区以预防保护为主,中部地区要防治兼顾、综合治理、综合开发,西部地区治理难度大,应坚持综合防治.当前面上治理的重点应放在55万km2中度水蚀区和25万km2中度风蚀区,国家重点治理区是27万km2强度以上水蚀区.
|
| [5] |
Overview on soil erosion model research .
近年来,人们对土壤水蚀形成过程及其模拟进行了广泛研究,并针对不同研究对象与目的,建立了土壤水蚀的经验预报模型、物理过程模型和分布式模型。在对国内外一些主要的土壤水蚀模型进行评述的基础上,讨论土壤侵蚀模型研究与GIS技术和BP神经网络理论结合的发展趋势,同时结合土壤水蚀模型的开发和应用情况,提出了土壤侵蚀预报模型研究亟待解决的一些问题和我国土壤侵蚀预报模型研究的设想。
土壤侵蚀模型研究综述 .
近年来,人们对土壤水蚀形成过程及其模拟进行了广泛研究,并针对不同研究对象与目的,建立了土壤水蚀的经验预报模型、物理过程模型和分布式模型。在对国内外一些主要的土壤水蚀模型进行评述的基础上,讨论土壤侵蚀模型研究与GIS技术和BP神经网络理论结合的发展趋势,同时结合土壤水蚀模型的开发和应用情况,提出了土壤侵蚀预报模型研究亟待解决的一些问题和我国土壤侵蚀预报模型研究的设想。
|
| [6] |
Predicting rainfall erosion losses a guide to conservation planning Agricultural Handbook.
Scientific planning for soil and water conservation requires knowledge of the relations between those factors that cause loss of soil and water and those that help to reduce such losses. The soil loss prediction procedure presented in this handbook provides specific guidelines which are needed for selecting the control practices best suited to the particular needs of each site. The procedure is...
|
| [7] |
RUSLE a guide to conservation planning with the revised universal soil loss equation. |
| [8] |
Spatial prediction of soil erosion risk by remote sensing, GIS and RUSLE approach. |
| [9] |
Estimation of vegetation parameter for modeling soil erosion using linear spectral mixture analysis of Landsat ETM data. https://doi.org/10.1016/j.isprsjprs.2007.05.013 URL [本文引用: 1] 摘要
Soil conservation planning often requires estimates of soil erosion at a catchment or regional scale. Predictive models such as Universal Soil Loss Equation (USLE) and its subsequent Revised Universal Soil Loss Equation (RUSLE) are useful tools to generate the quantitative estimates necessary for designing sound conservation measures. However, large-scale soil erosion model- factor parameterization and quantification is difficult due to the costs, labor and time involved. Among the soil erosion parameters, the vegetative cover or C factor has been one of the most difficult to estimate over broad geographic areas. The C factor represents the effects of vegetation canopy and ground covers in reducing soil loss. Traditional methods for the extraction of vegetation information from remote sensing data such as classification techniques and vegetation indices were found to be inaccurate. Thus, this study presents a new approach based on Spectral Mixture Analysis (SMA) of Landsat ETM data to map the C factor for use in the modeling of soil erosion. A desirable feature of SMA is that it estimates the fractional abundance of ground cover and bare soils simultaneously, which is appropriate for soil erosion analysis. Hence, we estimated the C factor by utilizing the results of SMA on a pixel-by-pixel basis. We specifically used a linear SMA (LSMA) model and performed a minimum noise fraction (MNF) transformation and pixel purity index (PPI) on Landsat ETM image to derive the proportion of ground cover (vegetation and non- photosynthetic materials) and bare soil within a pixel. The end-members were selected based on the purest pixels found using PPI with reference to very high-resolution QuickBird image and
|
| [10] |
Research progress on quantitative remote sensing of soil loss and its application.
本文介绍了水土流失定量遥感方法,应用实验和结果,并讨论了它的实质和应用前景等。该法的监测模型虽有与USLE和RUSLE相同的表达形式,但其因子琥式算法系由我国实测资料所建,故有更人合我国实际的应用效果,尤其它适用于遥感和GIS数据的微机处理。
水土流失定量遥感方法及其应用的研究 .
本文介绍了水土流失定量遥感方法,应用实验和结果,并讨论了它的实质和应用前景等。该法的监测模型虽有与USLE和RUSLE相同的表达形式,但其因子琥式算法系由我国实测资料所建,故有更人合我国实际的应用效果,尤其它适用于遥感和GIS数据的微机处理。
|
| [11] |
Soil erosion prediction model for Chinese studies //中国土壤侵蚀预报模型研究 // |
| [12] |
Quantitative study on spatial variation of soil erosion in a small watershed in the loess hilly region.
以陕西北黄土丘陵区安塞县纸坊沟流域内小流域为研究实例,在分析野外小区观测资料建立土壤侵 蚀模型的基础上,应用由ARC/INFO地理信息软件系统支持建立的空间信息数据库系统和土壤侵蚀模型相结合的方法,进行了小流域次降雨土壤侵蚀空间化的 定量计算,进而研究了流域内侵蚀强度的空间变化规律及其与地貌和土地利用的关系,经实测资料的检验表明,建立的预报方法,具有较高的计算精度。
黄土丘陵区小流域土壤侵蚀空间变化定量研究 .
以陕西北黄土丘陵区安塞县纸坊沟流域内小流域为研究实例,在分析野外小区观测资料建立土壤侵 蚀模型的基础上,应用由ARC/INFO地理信息软件系统支持建立的空间信息数据库系统和土壤侵蚀模型相结合的方法,进行了小流域次降雨土壤侵蚀空间化的 定量计算,进而研究了流域内侵蚀强度的空间变化规律及其与地貌和土地利用的关系,经实测资料的检验表明,建立的预报方法,具有较高的计算精度。
|
| [13] |
WEPP a new of erosion generation prediction technology. https://doi.org/10.1061/(ASCE)0733-9437(1991)117:1(150.2) URL [本文引用: 1] 摘要
ABSTRACT WEPP represents a departure from factor-based erosion prediction technology to a new process-based technology. As new studies are conducted and more computer power becomes available, WEPP will provide a basis for inserting improved process descriptions and parameter values that will provide improved technology for prediction of soil erosion. The WEPP effort is serving as a guide in developing other technology in the natural resource area for action agencies and other users of prediction technology in the natural resource area. -from Authors
|
| [14] |
Impact of GLIGEN parameters on predicted WEPP predicted average soil loss. |
| [15] |
RUSLE model description and database sensitivity. https://doi.org/10.2134/jeq1993.00472425002200030009x URL [本文引用: 1] 摘要
ABSTRACT Water quality modeling generally requires estimates of the amount of eroded material entering water courses. This information is necessary because sediment often transports adsorbed chemicals. Numerous models have been developed to assist with assessment of this problem. These models often contain some modification of the Universal Soil Loss Equation (USLE). A recently initiated effort to improve USLE technology has produced a computer-based model, RUSLE (Revised USLE), which employs new relationships to estimate values of the six factors in the equation. Three input databases are required: climatic data, crop data, and field operations data. Although numerous specific entries for these data are contained in the program, in many cases users must supplement or modify the supplied data. Results of a sensitivity analysis help users tailoring the databases to specific conditions.
|
| [16] |
Soil Conservation . |
| [17] |
Study on Rainfall Erosivity in China (I) .
对中国降雨侵蚀力R值的计算与 分布进行了系统研究。主要内容包括R指标的确定;次降雨R值、年R值以及多年平均R值的简易计算方法;我国不同地区年R值的月分布、次分布、频率分布和年 际变化特征,以及R值的雨量、雨强分布特征;对我国140多个重点站的R值进行了计算;在分析我国降雨侵蚀力R值区域分布特征的基础上,编制了中国降雨侵 蚀力等值线图,进行了降雨侵蚀力分区。
中国降雨侵蚀力R值的计算与分布(I) .
对中国降雨侵蚀力R值的计算与 分布进行了系统研究。主要内容包括R指标的确定;次降雨R值、年R值以及多年平均R值的简易计算方法;我国不同地区年R值的月分布、次分布、频率分布和年 际变化特征,以及R值的雨量、雨强分布特征;对我国140多个重点站的R值进行了计算;在分析我国降雨侵蚀力R值区域分布特征的基础上,编制了中国降雨侵 蚀力等值线图,进行了降雨侵蚀力分区。
|
| [18] |
An approximation of the rainfall factor in the universal soil loss equation //
The SIGMA 12p2/p-index, in which p is monthly rainfall and P is annual rainfall, provides a rapid way of approximating the rainfall factor value, although a minimum number of stations still need to be treated in greater detail.
|
| [19] |
The clay ratio as a criterion of susceptibility of soils to erosion.
The Sand + Silt/Clay ratio in soils is suggested in this paper as a possible criterion of judging the relative susceptibility of soils to erosion. This ratio is designated as the clay ratio. It was compared with the erosion ratio by using the same soils and the same mechanical analyses of these soils as reported by the U. S. Bureau of Chemistry and Soils. The comparison shows that with few exceptions the two ratios agree fairly well in indicating the general susceptibility of soils to erosion.
|
| [20] |
Using soil erosion models for global change studies. https://doi.org/10.2307/4002933 URL [本文引用: 1] 摘要
Future changes in climate and atmospheric carbon dioxide concentration will change the hydrologic cycle, affecting important soil-plant-water interactions, which in turn affect soil erosion rates. This report describes major soil erosion models which include Environmental Policy Integrated Climate (EPIC); Water Erosion Prediction Project (WEPP); Wind Erosion Prediction System (WEPS); and the Climate g
|
| [21] |
Study of applying USLE and geographical information system IDRISI to predict soil erosion in small watershed .https://doi.org/10.3321/j.issn:1009-2242.2000.02.005 URL [本文引用: 1] 摘要
依据实地调查资料 ,建立了典型小流域地理数据库 ;应用径流小区观测结果 ,确定了定量计算通用土壤流失方程 USL E因子指标的方法。在地理信息系统 IDRISI支持下 ,根据USLE土壤侵蚀预测模型对数据库实施运算操作 ,预测了小流域土壤侵蚀量。结果表明 ,占流域面积 6 7%的区域土壤侵蚀微弱或轻度 ,这一区域对流域土壤侵蚀量的贡献率仅为 3% ,而流域 80 %的泥沙来自于占流域面积仅 2 0 %的极强度和剧烈侵蚀区域
应用USLE模型与地理信息系统IDRISI预测小流域土壤侵蚀量的研究 .https://doi.org/10.3321/j.issn:1009-2242.2000.02.005 URL [本文引用: 1] 摘要
依据实地调查资料 ,建立了典型小流域地理数据库 ;应用径流小区观测结果 ,确定了定量计算通用土壤流失方程 USL E因子指标的方法。在地理信息系统 IDRISI支持下 ,根据USLE土壤侵蚀预测模型对数据库实施运算操作 ,预测了小流域土壤侵蚀量。结果表明 ,占流域面积 6 7%的区域土壤侵蚀微弱或轻度 ,这一区域对流域土壤侵蚀量的贡献率仅为 3% ,而流域 80 %的泥沙来自于占流域面积仅 2 0 %的极强度和剧烈侵蚀区域
|
| [22] |
Differences in topographic characteristics computed fern 100 m and 1000 m resolution digital elevation model data. https://doi.org/10.1002/(SICI)1099-1085(20000430)14:6<987::AID-HYP980>3.0.CO;2-A URL [本文引用: 1] 摘要
Abstract Topographic characteristics computed from 100- and 1000-m resolution digital elevation model (DEM) data are compared for 50 locations representing varied terrain in the conterminous USA. The topographic characteristics are three parameters used extensively in hydrological research and modelling—slope ( S ), specific catchment area ( A s ) and a wetness index computed as the logarithm of the specific catchment area divided by slope [ln( A s / S )]. Slope values computed from 1000-m DEMs are smaller than those computed from 100-m DEMs; specific catchment area and the wetness index are larger for the 1000-m DEMs compared with the 100-m DEMs. Most of the differences between the 100- and 1000-m resolution DEMs can be attributed to terrain-discretization effects in the computation of the topographic characteristics and are not the result of smoothing or loss of terrain detail in the coarse data. In general, the terrain-discretization effects are greatest on flat terrain with long length-scale features, and the smoothing effects are greatest on steep terrain with short length-scale features. For the most part, the differences in the average values of the topographic characteristics computed from 100- and 1000-m resolution DEMs are predictable; that is, biases in the mean values for the characteristics computed from a 1000-m DEM can be corrected with simple linear equations. Copyright 漏 2000 John Wiley & Sons, Ltd.
|
| [23] |
Modeling slope uncertainty derived from DEMs in Loess Plateau.
<p>选择陕北黄土高原6个典型地貌类型区为试验样区,采用野外实测及高精度的1:1万比例尺DEM为基准数据,研究栅格分辨率及地形粗糙度对DEM所提取地面平均坡度精度的影响。结果显示,对于1:1万比例尺DEM,5 m是保证该地区地形描述精度的理想分辨率尺度;多要素逐步回归模拟的方法进一步揭示了DEM所提取的地面平均坡度误差E与栅格分辨率X以及地形起伏的代表性因子—沟壑密度S之间存在的量化关系为E = (0.0015S2+0.031S-0.0325)X-0.0045S2-0.155S+0.1625,该结果也为确定适用的DEM分辨率提供了理论依据。</p>
DEM提取黄土高原地而坡度的不确定性 .
<p>选择陕北黄土高原6个典型地貌类型区为试验样区,采用野外实测及高精度的1:1万比例尺DEM为基准数据,研究栅格分辨率及地形粗糙度对DEM所提取地面平均坡度精度的影响。结果显示,对于1:1万比例尺DEM,5 m是保证该地区地形描述精度的理想分辨率尺度;多要素逐步回归模拟的方法进一步揭示了DEM所提取的地面平均坡度误差E与栅格分辨率X以及地形起伏的代表性因子—沟壑密度S之间存在的量化关系为E = (0.0015S2+0.031S-0.0325)X-0.0045S2-0.155S+0.1625,该结果也为确定适用的DEM分辨率提供了理论依据。</p>
|
| [24] |
Rescaling lower resolution slopes by histogram matching //https://doi.org/10.1007/978-3-540-77800-4_11 URL [本文引用: 1] 摘要
Slope is a key parameter for regional scale hydrology, soil erosion, and relevant land surface process modelling. Slope information is usually extracted from moderate and lower resolution DEMs because of time and financial limitations. But research has shown that the slope will become flatter as the resolution of the DEMs becomes coarser. That is, slope reduction (SR) has occurred. Due to the reduction of slope as the DEM resolution becomes coarser, the slopes from coarser DEMs have to be re-scaled, firstly in order to represent terrain accurately and secondly to directly support the environmental modelling mentioned above. A transform approach by slope histogram matching is suggested in this chapter. A case study in a loess hill area shows that a coarser resolution slope histogram (derived from a 1:250,000 topographic based DEM), can be successfully re-scaled into the slope histogram at a finer resolution (using a 1:100,000 topographic based DEM). The transformed slope surface has been improved as an estimate of the finer resolution DEM slope in comparison with the coarser resolution DEM, the statistical results are similar to those from the finer resolution DEM in the loess hill area, and little new distortion has been introduced
|
| [25] |
Physical basis of the length-slope factor in the uninversal soil loss equation. |
| [26] |
Estimation of vegetation parameter for modeling soil erosion using linear spectral mixture analysis of Landsat ETM data. https://doi.org/10.1016/j.isprsjprs.2007.05.013 URL [本文引用: 1] 摘要
Soil conservation planning often requires estimates of soil erosion at a catchment or regional scale. Predictive models such as Universal Soil Loss Equation (USLE) and its subsequent Revised Universal Soil Loss Equation (RUSLE) are useful tools to generate the quantitative estimates necessary for designing sound conservation measures. However, large-scale soil erosion model- factor parameterization and quantification is difficult due to the costs, labor and time involved. Among the soil erosion parameters, the vegetative cover or C factor has been one of the most difficult to estimate over broad geographic areas. The C factor represents the effects of vegetation canopy and ground covers in reducing soil loss. Traditional methods for the extraction of vegetation information from remote sensing data such as classification techniques and vegetation indices were found to be inaccurate. Thus, this study presents a new approach based on Spectral Mixture Analysis (SMA) of Landsat ETM data to map the C factor for use in the modeling of soil erosion. A desirable feature of SMA is that it estimates the fractional abundance of ground cover and bare soils simultaneously, which is appropriate for soil erosion analysis. Hence, we estimated the C factor by utilizing the results of SMA on a pixel-by-pixel basis. We specifically used a linear SMA (LSMA) model and performed a minimum noise fraction (MNF) transformation and pixel purity index (PPI) on Landsat ETM image to derive the proportion of ground cover (vegetation and non- photosynthetic materials) and bare soil within a pixel. The end-members were selected based on the purest pixels found using PPI with reference to very high-resolution QuickBird image and
|
| [27] |
The study on cover-management factor in USLE and RUSLE:a review. https://doi.org/10.5846/stxb201306151710 URL [本文引用: 1] 摘要
通用土壤流失方程(USLE)及修正通用土壤流失方程(RUSLE)是世界范围内应用最广泛 的土壤侵蚀预报模型,模型中C因子表示植被覆盖和管理措施对土壤侵蚀的作用,是人为控制土壤侵蚀的重要因子。回溯了C因子发展演变历程,依据国内外最新研 究成果,系统阐述了不同尺度C因子估算方法。在小区、坡面、小流域尺度上,C因子确定主要依赖于野外实验观测,研究条件的一致性尤其是标准小区的统一是C 因子值可比性的前提。流域、区域尺度C因子确定通常需要利用遥感影像,遥感技术的发展促进了流域、区域尺度C因子估算方法的进步,使提取的c因子图更加精 细、准确,但是使用遥感数据全面刻画c因子含义仍然是一大挑战,因此仍需加强C因子相关研究。共归纳了10种确定C因子的方法,介绍了不同方法的优缺点及 适用条件.提出了我国C因子研究应加强工作,希望为相关领域研究者提供参考。
USLE/RUSLE中植被覆盖与管理因子研究进展 .https://doi.org/10.5846/stxb201306151710 URL [本文引用: 1] 摘要
通用土壤流失方程(USLE)及修正通用土壤流失方程(RUSLE)是世界范围内应用最广泛 的土壤侵蚀预报模型,模型中C因子表示植被覆盖和管理措施对土壤侵蚀的作用,是人为控制土壤侵蚀的重要因子。回溯了C因子发展演变历程,依据国内外最新研 究成果,系统阐述了不同尺度C因子估算方法。在小区、坡面、小流域尺度上,C因子确定主要依赖于野外实验观测,研究条件的一致性尤其是标准小区的统一是C 因子值可比性的前提。流域、区域尺度C因子确定通常需要利用遥感影像,遥感技术的发展促进了流域、区域尺度C因子估算方法的进步,使提取的c因子图更加精 细、准确,但是使用遥感数据全面刻画c因子含义仍然是一大挑战,因此仍需加强C因子相关研究。共归纳了10种确定C因子的方法,介绍了不同方法的优缺点及 适用条件.提出了我国C因子研究应加强工作,希望为相关领域研究者提供参考。
|
| [28] |
Soil erosion risk in Italy. EUR19022 EN . |
| [29] |
Soil erosion risk assessment in Europe. EUR 19044 EN .
Soil erosion by water is a widespread problem throughout Europe. A report for the Council of Europe, using revised GLASOD data (Oldeman et al., 1991; Van Lynden, 1995), provides an overview of the extent of soil degradation in Europe. Some of the findings are shown in the
|
| [30] |
Spatial distribution of soil erosion and its relationship to environment factors in Anhui Province.
<p>基于USLE和GIS空间分析技术,对安徽省土壤侵蚀空间分布进行了定量研究,分析了土壤侵蚀空间分布与地形、土壤类型、土地利用方式的关系。结果表明:安徽省2002年平均土壤侵蚀模数为249.5t/km<sup>2</sup>·a,土壤侵蚀总量为33599148t/a。土壤侵蚀空间分布呈块状分布特征。淮北平原地区土壤侵蚀较弱,皖南丘陵山区和皖西大别山区土壤侵蚀较严重。在不同高程带上,200~500m高程带土壤侵蚀最强;不同坡度等级中,15°~25°坡度上的土壤侵蚀最强,>35°坡地上则较弱;不同坡向中,东南坡土壤侵蚀最强,其次是东坡;不同用地类型的土壤侵蚀程度不同,草地的土壤侵蚀最为严重,其次是林地;在各种土壤类型中,紫色土和黄褐土的土壤侵蚀最为突出,棕壤的土壤侵蚀微弱。</p>
安徽省土壤侵蚀空间分布及其与环境因子的关系 .
<p>基于USLE和GIS空间分析技术,对安徽省土壤侵蚀空间分布进行了定量研究,分析了土壤侵蚀空间分布与地形、土壤类型、土地利用方式的关系。结果表明:安徽省2002年平均土壤侵蚀模数为249.5t/km<sup>2</sup>·a,土壤侵蚀总量为33599148t/a。土壤侵蚀空间分布呈块状分布特征。淮北平原地区土壤侵蚀较弱,皖南丘陵山区和皖西大别山区土壤侵蚀较严重。在不同高程带上,200~500m高程带土壤侵蚀最强;不同坡度等级中,15°~25°坡度上的土壤侵蚀最强,>35°坡地上则较弱;不同坡向中,东南坡土壤侵蚀最强,其次是东坡;不同用地类型的土壤侵蚀程度不同,草地的土壤侵蚀最为严重,其次是林地;在各种土壤类型中,紫色土和黄褐土的土壤侵蚀最为突出,棕壤的土壤侵蚀微弱。</p>
|
| [31] |
|
| [32] |
The comprehensive evaluation of China's urbanization and effects on resources and environment. https://doi.org/10.1007/s11442-010-0017-0 URL Magsci [本文引用: 1] 摘要
<a name="Abs1"></a>This paper constructs a comprehensive evaluation index system for the urbanization level in China in terms of four aspects of urbanization connotation: population, economy, society, and land. A comprehensive measurement is carried out for the Chinese urbanization between 1981 and 2006 based on the Entropy method. The results show that the comprehensive level of urbanization in China has a continuous increase with the major features of economic growth and a rapid evolution of the geographical landscape, followed by population urbanization and then social urbanization of health care standard; the distinguished evolutional characteristics can also be found in each of the subsystems. The integrated evolution of urbanization has a profound effect on the resources, energy and the environment, making the land resources and energy security situation under severe pressure. The environment pressure is also increased further.
|

/
| 〈 |
|
〉 |