环境变化与农业发展

局地气候分区与人口密度的复合作用对城市热岛效应的影响

  • 杨俊 , 1, 2 ,
  • 辛佳兴 1 ,
  • 任嘉义 1 ,
  • 于文博 1
展开
  • 1.东北大学文法学院,沈阳 110169
  • 2.东北大学江河建筑学院,沈阳 110169

杨俊(1978-), 男, 湖北孝昌人, 教授, 博士生导师, 主要从事城市气候与人居环境研究。E-mail:

收稿日期: 2024-12-26

  修回日期: 2025-04-12

  网络出版日期: 2025-05-23

基金资助

兴辽英才计划科技领军人才项目(XLYC2202024)

辽宁省教育厅基础科学研究项目(LJ212410165084)

Dual drivers of the urban heat island effect: The compound effect of local climate zones and population density

  • YANG Jun , 1, 2 ,
  • XIN Jiaxing 1 ,
  • REN Jiayi 1 ,
  • YU Wenbo 1
Expand
  • 1. School of Humanities and Law, Northeastern University, Shenyang 110169, China
  • 2. Jangho Architecture College, Northeastern University, Shenyang 110169, China

Received date: 2024-12-26

  Revised date: 2025-04-12

  Online published: 2025-05-23

Supported by

Liaoning Revitalization Talents Program(XLYC2202024)

Basic Scientific Research Project of the Education Department of Liaoning Province(Key Project)(LJ212410165084)

摘要

深入探讨全国城市热岛效应及其成因差异,对各城市切实减缓热岛效应具有重要意义。本文基于Landsat 8地表温度和局地气候分区(LCZs)数据,计算了全国超大、特大城市的地表城市热岛强度(SUHII),并运用地理探测器分析了LCZs和人口密度(PD)对SUHII的复合影响。结果表明:① 城市等级、发展水平和建筑密度提升会加剧SUHII,且山地和丘陵地区内部差异显著高于平原地区,山地和丘陵地区SUHII标准差在0.25以上,而沈阳等平原地区在0.10左右。② 多数城市呈现出茂密森林(LCZA)的SUHII最低,比建筑型LCZs的SUHII低0.5~1.0 ℃。③ PD与LCZs的复合作用强于单一作用,建筑型LCZs与自然型LCZs比值达0.60后,LCZs对SUHII贡献率增速放缓,建筑型LCZs占比达50%时趋于饱和。未来城市热岛强度将继续加剧,本文深入探讨了热岛强度差异的影响因素,为精准制定热岛效应缓解的城市规划方案提供了重要参考。

本文引用格式

杨俊 , 辛佳兴 , 任嘉义 , 于文博 . 局地气候分区与人口密度的复合作用对城市热岛效应的影响[J]. 地理学报, 2025 , 80(5) : 1370 -1385 . DOI: 10.11821/dlxb202505014

Abstract

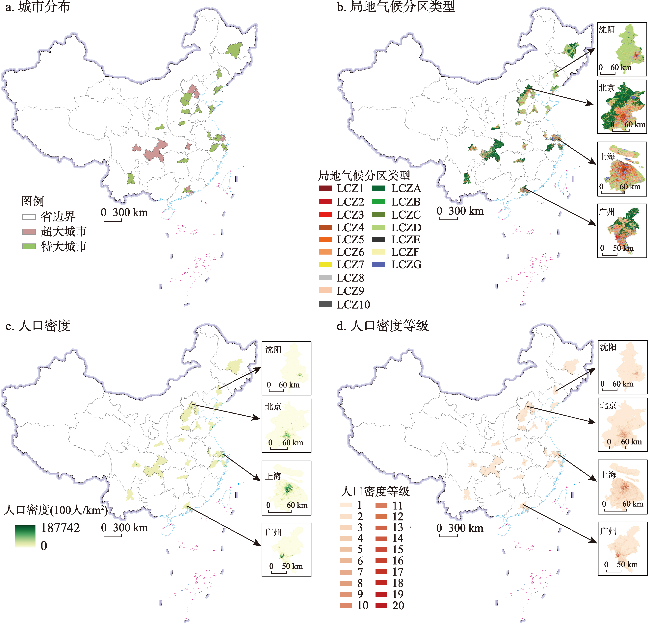
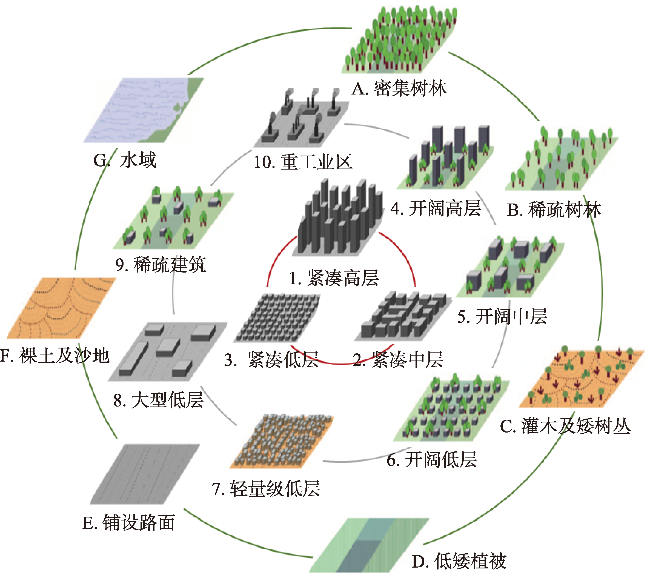
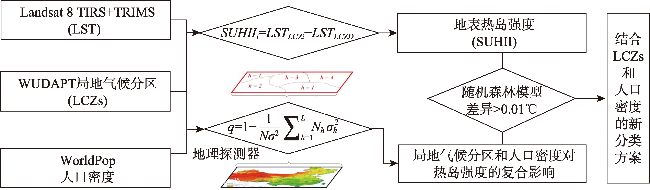
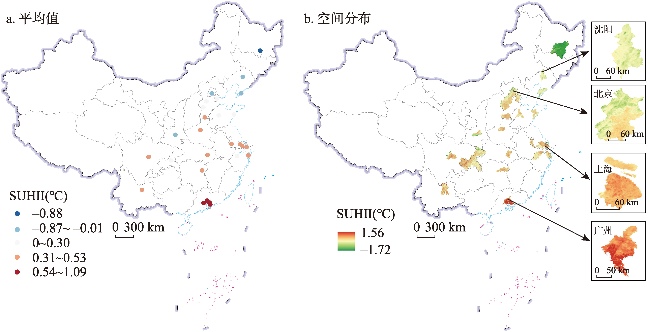
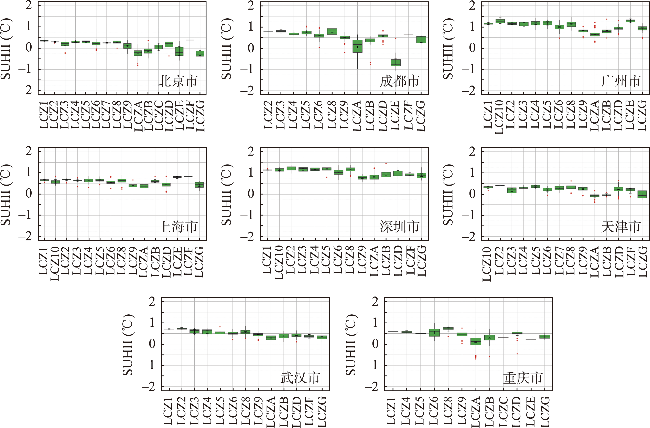
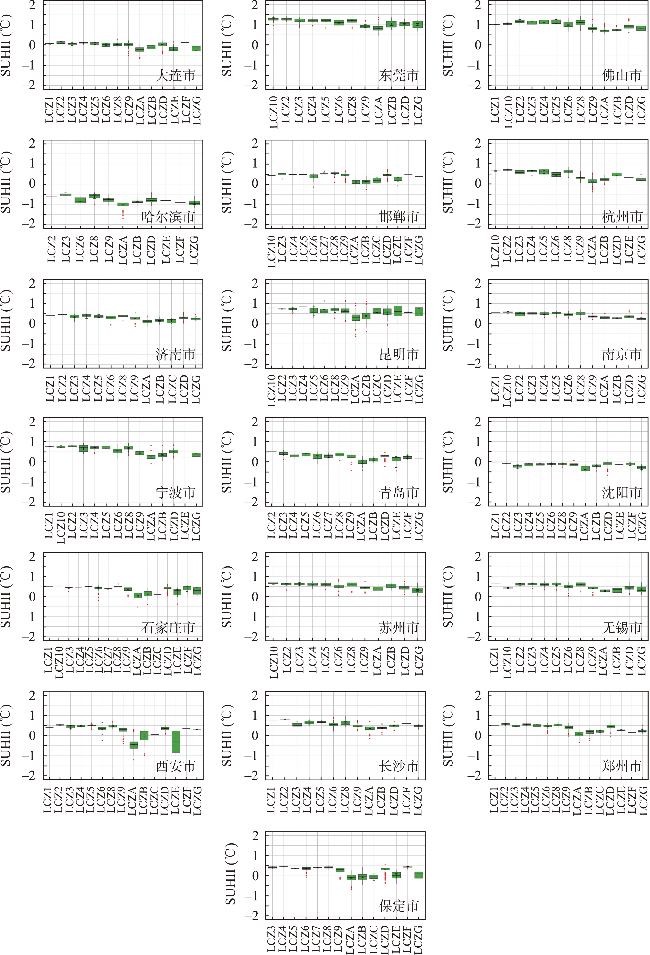
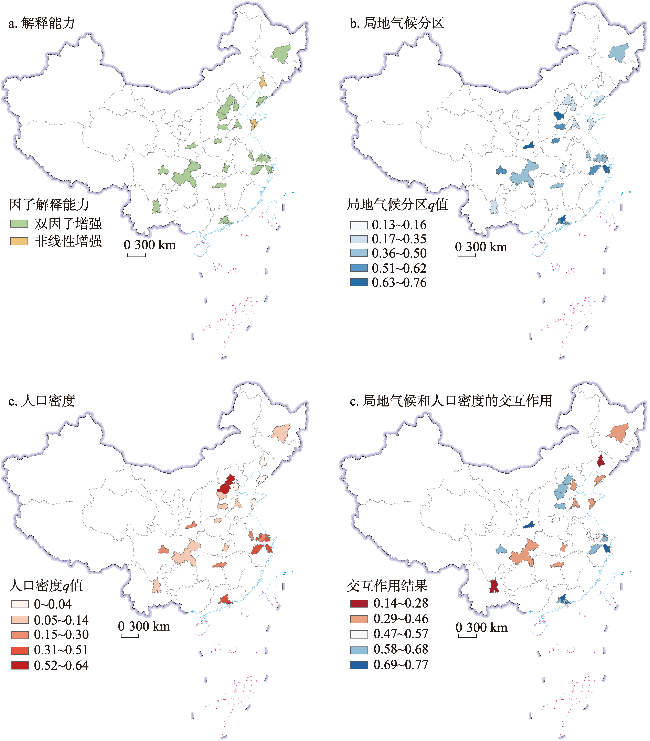
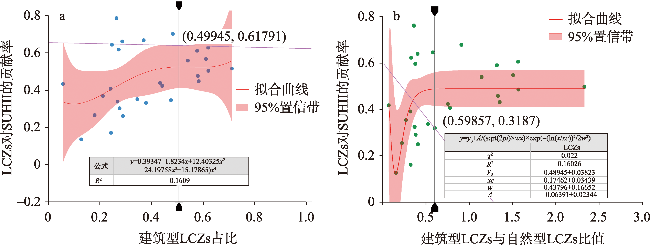
An in-depth investigation of urban heat island effect and its influencing factors differences is crucial for effectively mitigating this phenomenon in cities. In this study, we calculated the surface urban heat island intensity (SUHII) for China's super- and mega-cities, based on Landsat 8 land surface temperature and Local Climate Zones (LCZs) data. We then analyzed the compound effects of LCZs and population density (PD) on SUHII using geodetector. The results showed that: (1) Urban size, development level, and building density all exacerbate SUHII, with internal variation significantly higher in mountainous and hilly regions than in plains. The standard deviation of SUHII in mountainous and hilly areas exceeds 0.25, while in plain areas, such as Shenyang, it is around 0.1. (2) In most cities, the lowest SUHII is found in dense trees (LCZA), which is approximately 0.5-1 ℃ lower than in built-up LCZs. (3) The compound effect of PD and LCZs is more significant than either factor alone. Once the ratio of built-up LCZs to nature LCZs exceeds 0.60, the contribution of LCZs to SUHII shows a decelerating growth rate, and becomes saturated when LCZs account for approximately 50% of the built-up area. Looking ahead, the intensity of urban heat islands is expected to continue increasing. This study discussed deeply the influencing factors of the differences in urban heat island intensity, offering an important reference for the development of targeted urban planning strategies aimed at mitigating urban heat island effects.

1 引言

自21世纪以来,全球气候变暖已成为人类面临的重大挑战之一[1]。日益严重的极端天气事件、气温上升以及城市热岛效应等问题,对人类健康和生命安全构成了巨大威胁[2-5]。根据2023年联合国政府间气候变化专门委员会发布的第六次评估报告,全球地表温度在2011—2020年比1850—1900年上升了1.1 ℃,气候变化的长期影响预计是目前观测到的数倍[6-8]。城市热岛效应,即城市温度高于郊区[9-12],已受到国内外学者的广泛关注,且据观察全球诸多城市的热岛效应正在增强[13-15],使得与高温相关的死亡率不断攀升[16-19]。因此,科学有效评估热岛效应的驱动机制,对于建设气候适应型城市具有重要意义。
城市热岛效应的评估方法经历了多样化的发展,从最初的城乡二分法、平均标准差法,到后来的正规化和归一化方法[20-23],但这些方法都会在一定程度上忽略城市内部建成环境的差异,实际上,城市建成区才是热岛效应的集聚区[24-25]。局地气候分区(Local Climate Zones, LCZs)的引入有效解决了这一问题。LCZs框架由Stewart和Oke学者提出[26-27],包括10个建筑类型和7个自然类型,能更好地区分城市内部建成环境的差异,目前已广泛应用于热岛效应的研究中[28-31]。同时,Oke也对热岛强度的计算给出了很好的解决方案,将其他类型LCZs与低矮植被(LCZD)的地表温度之差作为热岛强度,避免了城乡边界模糊不确定的问题。
城市热岛效应受到多种驱动因素作用,已有学者对其进行深入分析,如耿树丰等[32]分析了不同类型LCZs之间的热岛强度差异,结果发现建筑型LCZs的热岛强度高于自然型LCZs。熊鹰等[33]则从建筑形态、景观格局、社会经济等指标角度定量刻画其对热岛强度的贡献,研究发现,建筑密度和高度对热岛效应有显著的正向影响,说明随着建筑密度和高度的增加,热岛效应的强度也随之增强。Manoli等[34]则从人口特征及背景气候因素入手,探讨了热岛强度的驱动机制,认为城乡蒸散与对流效率是关键影响因素。然而,当前学者对于热岛强度驱动机制的研究常常将LCZs类型差异与人口因素割裂开来,较少综合分析人口密度及LCZs类型的复合影响[35-37]。因此,本文将人口及LCZs类型对热岛效应的复合影响应用于全国超大、特大城市研究中,旨在分析全国超大、特大城市热岛效应的异质性及其驱动因素差异。
为此,本文结合地表温度、局地气候分区及人口密度等多源数据,借助GIS空间统计分析方法计算地表城市热岛强度(Surface Urban Heat Island Intensity, SUHII),分析不同城市SUHII的空间差异及各局地气候分区类型的SUHII差异,借助地理探测器分析LCZs和人口对城市热岛强度的复合影响,以期更好地分析热岛效应的驱动机制及其在全国不同城市的差异,为城市规划、气候适应型城市建设提供参考建议。

2 研究区概况与研究方法

2.1 研究区概况

全球都在经历不断加剧的热岛效应,城市规模越大其热岛强度越大,根据全球化与世界城市研究小组(Globalization & World Cities, GaWC)发布的《世界城市名册2024》,其中一二线城市中国占22个(香港、澳门、台湾除外),覆盖中国70%的超大、特大城市,揭示了超大、特大城市在全球城市网络中作为关键节点的重要性。因此,对于全国超大、特大城市的研究十分必要。本文依据国务院2014年《关于调整城市规模标准的通知》标准,将全国城市分为5类7档[38],以第七次人口普查结果作为依据(虽然选取的时间年份为2018年,但其更接近第七次人口普查结果,因此未选择第六次人口普查结果作为分类依据),选择超大(城区人口数量≥1000万)、特大城市(城区人口数量500万~1000万)作为研究区域,具体城市及地理位置见图1a
图1 中国超大、特大城市的空间分布及其内部局地气候分区、人口密度及人口密度的空间分布

注:全文地图均基于自然资源部标准地图服务网站审图号为GS(2023)2763号的标准地图制作,底图边界无修改。

Fig. 1 Spatial distribution of urban sizes, types of local climate zones, population density and population density classes of China's super- and mega-cities

2.2 数据来源

本文所采用的研究数据包括局地气候分区、地表温度(Landsat Surface Temperature, LST)、人口及统计年鉴数据。具体来源及描述见表1。其中,局地气候分区(图1b)共包括17种类别(10种建筑类型+7种自然类型),其中LCZ1~10分别代表:紧凑高层、紧凑中层、紧凑低层、开阔高层、开阔中层、开阔低层、轻量级低层、大型低层、稀疏建筑和重工业区,LCZA~G分别代表:密集树林、稀疏树林、灌木及矮树丛、低矮植被、铺设路面、裸土及沙地和水域,具体分类标准见文献(图2[27]
表1 数据描述及处理

Tab. 1 Data descriptions and processing

数据类型 年份 分辨率 来源 处理
局地气候分区 2018 100 m Bochum Urban Climate Lab[39] 通过GEE平台下载、裁剪及掩膜
地表温度
Landsat 8 TIRS
2018 30 m - 通过GEE平台重采样、下载及裁剪
地表温度
TRIMS数据集
2018 1 km 国家青藏高原数据中心[40]
https://dx.doi.org/10.11888/Meteoro.tpdc.271252
数据下载、重采样及裁剪
人口密度 2018 100 m WorldPop 数据下载、重采样及裁剪
统计年鉴
第七次人口普查结果
2020 - 中国经济社会大数据研究平台 下载及整理,筛选出超大及特大城市名单
图2 局地气候分区分类标准及示意图

Fig. 2 Criteria and diagrams for classification of local climate zones

2.3 研究方法

2.3.1 热岛强度计算

首先利用中国陆域及周边逐日1 km全天候地表温度数据集(TRIMS LST,重采样至100 m),对Landsat 8 TIRS LST数据进行缺失值填充。其次本文通过分区统计工具计算全国不同LCZs类型的LST平均值,以LCZD的平均值为基础,计算得到热岛强度值。
S U H I I i = L S T L C Z i - L S T L C Z D
式中:SUHIIi为第i个像元的SUHII值;LSTLCZi为第i个像元LST值;LSTLCZD为全国LCZD(低矮植被)的平均LST值。

2.3.2 地理探测器

地理探测器是一种用于分析空间差异及其驱动因素的统计方法,能够识别关键影响因素并揭示它们之间的交互关系,是探究地理因素影响机制的有力手段[41],利用王劲峰教授团队共享的地理探测器软件分析SUHII与LCZs和人口密度之间的关系[42]。具体计算公式如下:
q = 1 - 1 N σ 2 h = 1 L N h σ h 2
式中:q表示LCZs和人口密度(Population Density, PD)对城市热岛强度的解释程度,数值越大说明自变量的解释力越强,且将交互作用结果分为6类:非线性减弱、单因子非线性减弱、双因子增强、独立、非线性增强(由于本文结果主要为非线性增强和双因子增强,因此仅对二者进行解释,影响因子交互作用的解释力均大于各单一因子的解释力为双因子增强,影响因子交互作用的解释力大于各自单独作用时的解释力之和为非线性增强);Nσ分别表示研究区整体的单元数和方差;在探测变量间的交互作用时,首先空间叠加多个解释变量以生成新的交互变量,然后评估这些变量是增加还是减少因变量的影响力度;L表示因变量Y或自变量X的分层;Nhσh分别表示层h内的单元数量和方差。本文通过ArcGIS Pro创建随机点工具对每个城市各创建1000个随机点,通过多值提取至点和相交等工具提取SUHII、PD以及LCZs值,最后通过地理探测器分析PD及LCZs对SUHII的作用,其中为将人口数据转换为分类数据,本文采用自然间断点法将PD分为20类,从小到大依次为1~20(图1d),具体分类标准见表2。最后,尝试对研究区(这里以北京和上海为例)创建100 m×100 m格网,与人口密度(以自然间断点法从低到高分成20级)、局地气候分区(LCZs)和热岛强度(SUHII)进行空间连接,然后利用随机森林模型进行训练(训练∶测试=4∶1),目标是使热岛强度差值能在0.01 ℃以上,以期对当前的LCZ分类标准进行优化。本文的技术流程图见图3
表2 人口密度等级分类标准

Tab. 2 Criteria for classification of population density

人口密度(100人/km2) 人口密度等级 人口密度(100人/km2) 人口密度等级
0~733 1 55002~62336 11
733~ 667 2 62336~68936 12
3667~8800 3 68936~74803 13
8800~14667 4 74803~81404 14
14667~21268 5 81404~90937 15
21268~27868 6 90937~99004 16
27868~34468 7 99004~109272 17
34468~41068 8 109272~124672 18
41068~47669 9 124672~154007 19
47669~55002 10 154007~187742 20
图3 技术流程图

Fig. 3 Technical flowchart

3 结果分析

3.1 城市热岛强度空间分布特征

全国超大、特大城市SUHII范围在-1.72~1.56 ℃之间(图4b)、平均值范围在-0.88~1.09 ℃之间(图4a)。研究表明,随着纬度的升高SUHII值呈现降低趋势,如SUHII平均值呈现出广州(0.85 ℃)>上海(0.53 ℃)>北京(-0.01 ℃)>沈阳(-0.12 ℃)。对于纬度接近的不同城市来说,城市等级越高SUHII越高,如成都(0.38 ℃)>重庆(0.22 ℃),武汉(0.42 ℃)>宁波(0.40 ℃)。对于城市内部而言,中心城区(即建筑密集聚集地区)SUHII值更高,而周围郊区(即植被密集覆被地区)SUHII较低。
图4 2018年全国超大、特大城市SUHII空间分布

Fig. 4 Spatial distribution of SUHII in China's super- and mega-cities in 2018

对于广州等低纬度地区,区域整体SUHII值均较高,这不仅与研究区所处地理位置相关(所处亚热带地区、地表温度常年较高),还与其建成环境密集、高层建筑占比较大有很大关系。此外,成都、重庆、昆明和西安等城市的SUHII值范围区间更大,均在2 ℃以上(表3),标准差也均在0.25以上,说明这些城市SUHII内部差异更大,反观济南和沈阳等城市,其SUHII值范围区间均在1 ℃以下,标准差也在0.10左右,说明这些城市内部差异较小,这主要是由于重庆、成都等丘陵、山地面积占比较多,均超过60%,森林分布较广,因此其LST较低,造成了内部SUHII的巨大差异,而反观沈阳和济南等城市,主要位于平原或者丘陵地区,其主要自然类型LCZs为LCZD,其又是计算SUHII的基准LCZs,因此其SUHII内部差异性较小,可见山地比平原SUHII差异更大。同时,这与城市发展水平和空间布局具有很大联系。
表3 2018年全国超大、特大城市SUHII的统计特征

Tab. 3 Mean, maximum, minimum, range and standard deviation of SUHII for China's super- and mega-cities in 2018

城市等级 城市名称 平均值 最小值 最大值 极差 标准差
超大城市 北京市 -0.01 -0.97 0.54 1.51 0.27
成都市 0.38 -1.65 1.19 2.84 0.38
广州市 0.85 0.28 1.56 1.28 0.22
上海市 0.53 -0.04 0.97 1.02 0.14
深圳市 1.01 0.50 1.45 0.96 0.21
天津市 0.21 -0.44 0.64 1.07 0.16
武汉市 0.42 0.02 1.05 1.02 0.13
重庆市 0.22 -0.86 1.34 2.20 0.27
特大城市 保定市 0.20 -0.84 0.61 1.45 0.23
大连市 -0.03 -0.69 0.33 1.01 0.15
东莞市 1.09 0.44 1.43 0.99 0.19
佛山市 0.95 0.46 1.47 1.01 0.20
哈尔滨市 -0.88 -1.72 -0.29 1.43 0.17
邯郸市 0.41 -0.34 0.73 1.07 0.16
杭州市 0.24 -0.39 1.00 1.39 0.19
济南市 0.28 -0.26 0.60 0.85 0.12
昆明市 0.41 -0.70 1.38 2.08 0.26
南京市 0.37 -0.06 0.74 0.80 0.11
宁波市 0.40 -0.08 1.06 1.15 0.21
青岛市 0.28 -0.46 0.60 1.06 0.12
沈阳市 -0.12 -0.81 0.13 0.94 0.11
石家庄市 0.30 -0.84 0.66 1.50 0.20
苏州市 0.37 -0.08 0.90 0.98 0.24
无锡市 0.41 -0.09 0.82 0.91 0.21
西安市 -0.07 -1.32 0.78 2.11 0.45
长沙市 0.43 -0.23 1.03 1.26 0.14
郑州市 0.40 -0.35 0.75 1.10 0.16

3.2 不同LCZs类型的城市热岛强度差异

为探究不同城市不同LCZs类型的SUHII差异,本文进一步对每个城市不同LCZs类型所对应的SUHII值进行统计分析。结果发现,不同城市不同LCZs类型的SUHII值存在差异(图5图6)。各城市均呈现出SUHII(建筑类型LCZs)> SUHII(自然类型LCZs)的趋势。
图5 全国超大城市各LCZs类型的SUHII差异

Fig. 5 Differences in SUHII across LCZs types in China's super-cities

图6 全国特大城市各LCZs类型的SUHII差异

Fig. 6 Differences in SUHII across LCZs types in China's mega-cities

各城市自然类型LCZs的SUHII值均存在显著差异,但在不同城市自然类型LCZs的SUHII值却存在差异。其中89%的城市(北京、上海、广州、深圳、天津、武汉、重庆、保定、东莞、佛山、大连、哈尔滨、邯郸、杭州、济南、昆明、宁波、青岛、沈阳、石家庄、无锡、西安、长沙、郑州)均呈现出LCZA的SUHII值最低,而成都市则是LCZE的SUHII值最低,苏州和南京是LCZG的SUHII值最低。
反观建筑型LCZs,发现并不是所有城市的每一种建筑类型LCZs的SUHII均存在明显差异,对于超大城市(北京、广州、上海、深圳、天津和武汉)来说,可以明显观察到,不同建筑型LCZs之间的SUHII差异相对较小。如北京LCZ1、LCZ2、LCZ4、LCZ5和LCZ8类型的SUHII平均值相差在0.03℃以内,广州LCZ4和LCZ6,LCZ3和LCZ7类型的SUHII平均值差值0.02 ℃,上海LCZ3和LCZ5,LCZ4和LCZ7类型的SUHII平均值差值在0.04 ℃以内,深圳LCZ2、LCZ3和LCZ5类型的SUHII平均值差值在0.01℃以内,武汉LCZ3、LCZ4和LCZ5类型的SUHII平均值差值在0.02 ℃以内。可见其仅仅依靠LCZ类型并不能显著区分热岛效应的差异,尤其是建筑密集区域。

3.3 不同城市热岛强度的驱动因素差异

进一步分析不同人口密度(PD)和局地气候分区(LCZs)对热岛强度(SUHII)的复合影响发现,全国超特大城市PD和LCZs对SUHII的复合影响均呈现出增强作用,除青岛和沈阳为非线性增强外,其余城市均为双因子增强,这可能是由于沈阳和青岛的人口密度和局地气候分区类型布局有关,二者人口密度在27个超大、特大城市中居中,且其主要LCZs类型为LCZD,森林和水体等占比较小,且建筑型LCZs占比也低于自然型。不同城市受到二者的影响强度却存在差异(表4图7)。
表4 全国及各超大、特大城市SUHII因子探测结果

Tab. 4 Factor detection results of SUHII for China's super-and mega-cities

LCZs PD LCZs∩PD 解释能力
全国 0.25 0.26 0.34 双因子增强
保定 0.16 0.59 0.61 双因子增强
北京 0.34 0.64 0.68 双因子增强
成都 0.59 0.19 0.62 双因子增强
大连 0.35 0.04 0.38 双因子增强
东莞 0.50 0.45 0.62 双因子增强
佛山 0.55 0.50 0.63 双因子增强
广州 0.68 0.51 0.74 双因子增强
哈尔滨 0.42 0.07 0.44 双因子增强
邯郸 0.60 0.07 0.62 双因子增强
杭州 0.62 0.42 0.66 双因子增强
济南 0.32 0.11 0.38 双因子增强
昆明 0.25 0.08 0.28 双因子增强
南京 0.43 0.30 0.52 双因子增强
宁波 0.65 0.46 0.71 双因子增强
青岛 0.32 0.03 0.35 非线性增强
上海 0.49 0.45 0.59 双因子增强
深圳 0.61 0.60 0.73 双因子增强
沈阳 0.13 0.00 0.14 非线性增强
石家庄 0.64 0.12 0.66 双因子增强
苏州 0.42 0.20 0.50 双因子增强
天津 0.29 0.04 0.32 双因子增强
无锡 0.46 0.37 0.57 双因子增强
武汉 0.33 0.14 0.38 双因子增强
西安 0.76 0.28 0.77 双因子增强
长沙 0.41 0.23 0.46 双因子增强
郑州 0.54 0.13 0.56 双因子增强
重庆 0.39 0.09 0.40 双因子增强
图7 中国超大、特大城市热岛强度的因子探测结果

Fig. 7 Factor detection results of urban heat island intensity in China's super- and mega-cities

具体来说,对于双因子结果,西安LCZs及PD对SUHII的贡献最大(0.77),其次是广州(0.74)、深圳(0.73)及宁波(0.71),贡献率均在0.7以上,而最小的是沈阳(0.14)和昆明(0.28),贡献率在0.3以下。对于单因子结果,可以发现几乎所有城市(北京、保定除外)都是LCZs对SUHII的贡献强于PD,说明这些城市更容易受到城市空间结构的作用。北京作为中国首都,其城区人口达到1775万人,且其内部建筑型LCZs占比不如自然型LCZs多,因此PD的贡献更大,反观上海,虽然其城区人口达到1987万人、高于北京,但其建筑型LCZs占比较大、自然类型主要以LCZD为主且占比较少,因此其LCZs贡献更大。此外,对于建筑较密集区域(例如广州、深圳、上海、佛山、东莞等城市,建筑型LCZs占比高于自然型LCZs),虽然呈现出LCZs对SUHII的作用强于PD,但是二者贡献率相近,可见对于人口密度和建筑都高度密集城市来说,二者对于SUHII的贡献势均力敌。
为此,分别对建筑型LCZs占比、建筑自然类型LCZs比值与LCZs对SUHII贡献率进行多项式及非线性拟合(图8),结果发现拟合R2均为0.16。且发现建筑类型LCZs的占比越大,LCZs对SUHII的贡献率越高,但该趋势存在两个拐点,一是建筑型LCZs与自然型LCZs比值达到0.60(即建筑类型LCZs占比达到38%)时,LCZs对SUHII的贡献率的增长速度开始变缓,二是当建筑型LCZs占比达到50%时,LCZs对SUHII的贡献率几乎不增长,即LCZs对SUHII的贡献率达到极限(取95%置信区间结果)。
图8 建筑型LCZs占比、建筑自然类型LCZs比值与LCZs对SUHII贡献率的多项式拟合结果

Fig. 8 Polynomial fitting results for the percentage of built LCZs, the ratio of built-natural LCZs and the contribution of LCZs to SUHII

4 讨论

4.1 局地气候分区和人口密度对热岛强度的贡献

国内外学者对于不同局地气候分区类型的热岛强度差异及热岛强度的影响因素进行了大量研究,几乎在建筑型LCZs比自然型LCZs的热岛强度值高方面达成了共识[43-45]。但也发现当前研究大多基于单一LCZs或者人口密度对热岛强度的贡献[46-48],较少研究分析二者的复合影响,且对于全国的差异性研究较少。本文以全国超大城市、特大城市共27个城市为研究区域,利用地理探测器分析了这27个城市LCZs和人口密度对热岛强度的复合作用,结果发现,所有城市均呈现出二者的增强作用,且多数为双因子增强,尤其是北京、广州、杭州、宁波、深圳、石家庄和西安,二者的交互作用贡献率均在0.65以上,可见对于热岛强度缓解要综合考量土地覆被和人口因素的复合作用。

4.2 不同城市的热岛强度差异

不同城市的地表热岛强度值(SUHII)空间分布存在较大的内部异质性,尤其是对于自然型LCZs,可以发现LCZA~G的SUHII值差异较大,通常LCZA的SUHII为所有LCZs类型中最低的[49];建筑型LCZs的SUHII值也存在差异,尤其是中高层建筑(LCZ1、LCZ2、LCZ4和LCZ5)的SUHII明显高于低层建筑(LCZ3、LCZ6)[50],但值得注意的是,有多个城市中高层内部差异并不显著,SUHII平均值差值在0.01 ℃以内,例如北京、上海等城市发展水平较高地区,其内部差异较小[2],这可能是北京、上海等城市建筑密集、建筑类型LCZs类型聚集,会受到相互作用,导致差异较小。因此,若采用同样的分类标准较难反映出其内部差异性。为此本文利用随机森林模型尝试对北京和上海的人口密度(以自然间断点法从低到高分成20级)、局地气候分区(LCZs)和热岛强度(SUHII)进行训练,以期对当前的LCZ分类标准进行优化,结果显示均方根误差(MSE)分别为0.020和0.008,R2分别为0.68和0.58(表5)。LCZ1、LCZ4、LCZ5和LCZ8原始SUHII平均值差异很小,均在0.01 ℃以下,有的甚至在0.002 ℃左右,但当加入人口密度指标后,显著提高了热岛强度值的差异,可以发现更新后的SUHII差异均在0.01 ℃以上,结果再一次印证了人口密度对SUHII的作用不容忽视。同时,加入人口之后可以显著分析出造成热岛强度内部差异的具体阈值,有助于城市规划者制定更精确的缓解策略和方案。
表5 北京市、上海市局地气候分区与人口密度结合的热岛强度前后变化

Tab. 5 Before-and-after changes of surface urban heat island intensity in combination of local climate zones and population density in Beijing and Shanghai

LCZs 人口密度
(100人/km2)
北京 上海
原始SUHII(℃) 更新SUHII(℃) 原始SUHII(℃) 更新SUHII(℃)
LCZ1 41068~62336 0.306 0.338 0.644 0.651
LCZ2 41069~62336 0.328 0.341 0.674 0.676
LCZ3 41070~62336 0.250 0.369 0.633 0.698
LCZ4 3667~14667 0.302 0.299 0.649 0.674
LCZ5 0~3666 0.298 0.261 0.658 0.571
LCZ6 0~3666 0.204 0.189 0.554 0.514
LCZ7 0~8800 0.183 0.184 0.507 0.537
LCZ8 3667~21268 0.297 0.314 0.636 0.685
LCZ9 0~733 0.105 0.088 0.405 0.393
LCZ10 3667~21268 0.287 0.286 0.667 0.684
LCZA 0~733 -0.231 -0.235 0.396 0.361
LCZB 0~733 -0.105 -0.118 0.553 0.448
LCZC 0~733 0.064 0.054 - -
LCZD 0~733 0.183 0.167 0.453 0.406
LCZE 0~733 -0.095 -0.122 0.749 0.699
LCZF 0~733 0.274 0.285 0.701 0.628
LCZG 0~733 -0.211 -0.288 0.404 0.259

注:上海市没有LCZC类型,因此其SUHII值为空。

因此,未来对于建筑类型LCZs占比高的城市,如上海、广州,可以通过增加绿地、人工湖等措施来提高自然型LCZs占比以降低热岛效应,对于人口密集但建筑型LCZs占比高于自然型LCZs的城市中,如北京,参考《关于“十四五”时期深化推进“疏解整治促提升”专项行动的实施意见》,可以考虑优化产业布局,加强北京与周围城市之间的人口流动,缓解中心城市压力[51]。同时,城市群的构建被视为优化城市规模与结构的关键策略,对于长三角和珠三角城市群的发展,可以考虑以上海、广州等城市为核心,带动周围城市协调发展,避免城市群发展不均衡和两极分化现象[52],既能减轻超大城市人口和热环境负担,也能推动周边中小城市的发展。

4.3 局限性

本文仍有一些不足之处,虽然尝试将人口密度纳入到局地气候分区分类体系中,但是受限于人口密度数据分级标准的限制,本文只是得到了大致范围,未找到精确的范围阈值,后续还需要深入研究。此外,本文只是提供了分类的思路,也并未对全国城市进行验证,后续仍然需要更加精确的分类标准以更好地理解热岛强度的内部差异,为缓解热岛强度提供参考依据。

5 结论

本文以中国27个超大、特大城市为研究对象,定量刻画了2018年地表城市热岛强度(SUHII)的空间分布,同时分析局地气候分区(LCZs)和人口密度(PD)对SUHII的复合影响及其在各城市之间的差异,主要结论如下:
(1)当两个城市纬度范围接近时,即背景气候相似,城市等级越高SUHII越高。同时,城市发展水平越高、建筑越密集,SUHII越高,且山地和丘陵地区的SUHII内部差异性高于平原。
(2)建筑类型LCZs的SUHII值高于自然类型LCZs,且多数城市均呈现出茂密森林(LCZA)的SUHII值最低。此外,对于超大城市北京、广州、上海、深圳、天津和武汉市来说,可以非常明显地的看到各建筑型LCZs之间的SUHII差异并不大,SUHII平均值相差均在0.04 ℃以内。
(3)全国27个超大、特大城市均呈现出人口密度和局地气候分区的复合作用要强于二者的单一作用,当人口密度和建筑类型LCZs占比均较大时,二者对SUHII的贡献率相当,但当建筑类型LCZs占比远低于自然型LCZs且人口密度较高时,人口密度贡献率更大。
城市化进程的加速和地表温度的升高,预计将导致未来城市热岛效应的加剧,进而对人类健康构成严重威胁。本文深入研究了不同城市及不同局地气候分区类型的热岛强度差异及其影响因素,这些发现对于理解城市等级、土地覆被类型和人口与热岛效应的关系具有重要意义,并为未来城市规划提供了重要参考。
[1]
Rizwan A M, Dennis L Y C, Liu C. A review on the generation, determination and mitigation of urban heat island. Journal of Environmental Sciences, 2008, 20(1): 120-128.

DOI PMID

[2]
Liu Chenxuan, Wang Liqun, Xu Xing, et al. The impact of vegetation cover on summer urban heat island effect in China from 2001 to 2021. Acta Ecologica Sinica, 2024, 44(24): 1-15.

[刘宸瑄, 王丽群, 许行, 等. 2001—2021年中国植被覆盖对夏季城市热岛效应的影响. 生态学报, 2024, 44(24): 1-15.]

[3]
Chen Y, Yang J, Yang R X, et al. Contribution of urban functional zones to the spatial distribution of urban thermal environment. Building and Environment, 2022, 216: 109000. DOI: 10.1016/j.buildenv.2022.109000.

[4]
Wu Jiansheng, He Haishan, Hu Tian. Analysis of factors influencing the "source-sink" landscape contribution of land surface temperature. Acta Geographica Sinica, 2022, 77(1): 51-65.

DOI

[吴健生, 何海珊, 胡甜. 地表温度“源—汇”景观贡献度的影响因素分析. 地理学报, 2022, 77(1): 51-65.]

DOI

[5]
Ren J Y, Yang J, Yu W B, et al. Mapping of local climate zones and heat hazard assessment from a historical-future perspective. IEEE Journal of Selected Topics in Applied Earth Observations and Remote Sensing, 2024, 17: 12622-12636.

[6]
IPCC. Climate change 2023:Synthesis report. Geneva, 2023: 35-115.

[7]
Priya A K, Muruganandam M, Rajamanickam S, et al. Impact of climate change and anthropogenic activities on aquatic ecosystem: A review. Environmental Research, 2023, 238: 117233. DOI: 10.1016/j.envres.2023.117233.

[8]
Nourani V, Ghareh T A H, Khodkar K, et al. Assessing long-term climate change impact on spatiotemporal changes of groundwater level using autoregressive-based and ensemble machine learning models. Journal of Environmental Management, 2023, 336: 117653. DOI: 10.1016/j.jenvman.2023.117653.

[9]
Oke T R. The energetic basis of the urban heat island. Quarterly Journal of the Royal Meteorological Society, 1982, 108: 455. DOI: 10.1002/qj.49710845502.

[10]
Aboelata A, Sodoudi S. Evaluating urban vegetation scenarios to mitigate urban heat island and reduce buildings' energy in dense built-up areas in Cairo. Building and Environment, 2019, 166: 106407. DOI: 10.1016/j.buildenv.2019.106407.

[11]
Zhang Q M, Yang J, Ma X Y, et al. Influence of 2D/3D urban morphology on diurnal land surface temperature from the perspective of functional zones. IEEE Journal of Selected Topics in Applied Earth Observations and Remote Sensing, 2024, 17: 17036-17051.

[12]
Yu W B, Yang J, Ren J Y, et al. Identifying localized heat zones in urban heat islands from a hill and saddle perspective. Sustainable Cities and Society, 2025, 118: 106028. DOI: 10.1016/j.scs.2024.106028.

[13]
Jin Yan, Yan Hongming, He Yuqin, et al. Change of urban precipitation characteristics and the possible influence of urban heat island effect in Kunming. Geographical Science, 2024, 44(11): 2039-2050.

[金燕, 晏红明, 何雨芩, 等. 昆明城市降雨特性变化及城市热岛效应的可能影响. 地理科学, 2024, 44(11): 2039-2050.]

DOI

[14]
Meng Q Y, Zhang L L, Sun Z H, et al. Characterizing spatial and temporal trends of surface urban heat island effect in an urban main built-up area: A 12-year case study in Beijing, China. Remote Sensing of Environment, 2018, 204: 826-837.

[15]
Sejati A W, Buchori I, Rudiarto I. The spatio-temporal trends of urban growth and surface urban heat islands over two decades in the Semarang Metropolitan Region. Sustainable Cities and Society, 2019, 46: 101432. DOI: 10.1016/j.scs.2019.101432.

[16]
Xiang X Y, Zhai Z H, Fan C L, et al. Modelling future land use land cover changes and their impacts on urban heat island intensity in Guangzhou, China. Journal of Environmental Management, 2024, 366: 121787. DOI: 10.1016/j.jenvman.2024.121787.

[17]
Renc A, Łupikasza E. Changes in the surface urban heat island between 1986 and 2021 in the polycentric Górnośląsko-Zagłębiowska Metropolis, southern Poland. Building and Environment, 2024, 247: 110997. DOI: 10.1016/j.buildenv.2023.110997.

[18]
Nie G G, Yang J, Zhang Y Q, et al. Duration of exposure to compound daytime-nighttime high temperatures and changes in population exposure in China under global warming. Humanities and Social Sciences Communications, 2024, 11(1): 1065. DOI: 10.1057/s41599-024-03586-1.

[19]
Huang Y, Li C, Liu D L, et al. Projection of temperature-related mortality among the elderly under advanced aging and climate change scenario. NPJ Climate and Atmospheric Science, 2023, 6(1): 153. DOI: 10.1038/s41612-023-00487-z.

[20]
Zhang Junzhi, Liang Yanan, Wang Ji, et al. Temporal and spatial characteristics of urban heat island effect and its influencing factors in Beijing from 1981 to 2020. Transactions of Atmospheric Sciences, 2024, 47(4): 581-591.

[张君枝, 梁雅楠, 王冀, 等. 1981—2020年北京城市热岛效应时空特征及其影响因素分析. 大气科学学报, 2024, 47(4): 581-591.]

[21]
Zhou D C, Zhao S Q, Liu S G, et al. Surface urban heat island in China's 32 major cities: Spatial patterns and drivers. Remote Sensing of Environment, 2014, 152: 51-61.

[22]
Yang M, Ren C, Wang H R, et al. Mitigating urban heat island through neighboring rural land cover. Nature Cities, 2024, 1(8): 522-532.

[23]
Debbage N, Shepherd J M. The urban heat island effect and city contiguity. Computers, Environment and Urban Systems, 2015, 54: 181-194.

[24]
Zeng P, Zong C, Duan Z C, et al. Exploring the spatial interplay between built-up environments and surface urban heat island phenomena in the main urban area of Shanghai. Energy and Buildings, 2023, 301: 113739. DOI: 10.1016/j.enbuild.2023.113739.

[25]
Ezimand K, Aghighi H, Ashourloo D, et al. The analysis of the spatio-temporal changes and prediction of built-up lands and urban heat islands using multi-temporal satellite imagery. Sustainable Cities and Society, 2024, 103: 105231. DOI: 10.1016/j.scs.2024.105231.

[26]
Stewart I D, Oke T R, Krayenhoff E S. Evaluation of the "local climate zone" scheme using temperature observations and model simulations. International Journal of Climatology, 2014, 34(4): 1062-1080.

[27]
Stewart Iain D, Oke T R. Local climate zones for urban temperature studies. Bulletin of the American Meteorological Society, 2012, 93(12): 1879-1900.

[28]
Shan Baoyan, Zhang Qiao, Ren Qixin, et al. Spatial differentiation of urban thermal environment and its influencing factors based on local climate zones in Jinan. Journal of Geo-Information Science, 2022, 24(4): 711-722.

[单宝艳, 张巧, 任启新, 等. 基于局地气候分区的济南市热环境空间分异及其影响因素. 地球信息科学学报, 2022, 24(4): 711-722.]

DOI

[29]
Yang J, Xin J X, Zhang Y Q, et al. Contributions of sea-land breeze and local climate zones to daytime and nighttime heat island intensity. NPJ Urban Sustainability, 2022, 2(1): 12. DOI: 10.1038/s42949-022-00055-z.

[30]
Kotharkar R, Bagade A. Evaluating urban heat island in the critical local climate zones of an Indian city. Landscape and Urban Planning, 2018, 169: 92-104.

[31]
Yu W B, Yang J, Sun D Q, et al. How urban heat island magnifies hot day exposure: Global unevenness derived from differences in built landscape. Science of the Total Environment, 2024, 945: 174043. DOI: 10.1016/j.scitotenv.2024.174043.

[32]
Geng Shufeng, Ren Jiayi, Yang Jun, et al. Exploration of urban thermal environment based on local climate zone. Acta Ecologica Sinica, 2022, 42(6): 2221-2227.

[耿树丰, 任嘉义, 杨俊, 等. 局地气候区视角下的城市热环境研究. 生态学报, 2022, 42(6): 2221-2227.]

[33]
Xiong Ying, Zhang Fang. Thermal environment effects of urban human settlements and influencing factors based on multi-source data:A case study of Changsha city. Acta Geographica Sinica, 2020, 75(11): 2443-2458.

[熊鹰, 章芳. 基于多源数据的长沙市人居热环境效应及其影响因素分析. 地理学报, 2020, 75(11): 2443-2458.]

DOI

[34]
Manoli G, Fatichi S, Schläpfer M, et al. Magnitude of urban heat islands largely explained by climate and population. Nature, 2019, 573(7772): 55-60.

[35]
Li Y F, Schubert S, Kropp J P, et al. On the influence of density and morphology on the urban heat island intensity. Nature Communications, 2020, 11(1): 2647. DOI: 10.1038/s41467-020-16461-9.

[36]
Ramírez-Aguilar E A, Lucas Souza L C. Urban form and population density: Influences on urban heat island intensities in Bogotá, Colombia. Urban Climate, 2019, 29: 100497. DOI: 10.1016/j.uclim.2019.100497.

[37]
Zhang R, Yang J, Ma X Y, et al. Optimal allocation of local climate zones based on heat vulnerability perspective. Sustainable Cities and Society, 2023, 99: 104981. DOI: 10.1016/j.scs.2023.104981.

[38]
Qi Wei, Liu Shenghe, Jin Haoran. Applicability of the new standard of city-size classification in China. Progress in Geography, 2016, 35(1): 47-56.

DOI

[戚伟, 刘盛和, 金浩然. 中国城市规模划分新标准的适用性研究. 地理科学进展, 2016, 35(1): 47-56.]

[39]
Demuzere M, Kittner J, Martilli A, et al. A global map of local climate zones to support earth system modelling and urban-scale environmental science. Earth System Science Data, 2022, 14(8): 3835-3873.

[40]
Zhang Xiaodong, Ding Lirong. Daily 1 km all-weather land surface temperature dataset for the China's landmass and its surrounding areas (TRIMS LST; 2000-2022). Beijing: National Tibetan Plateau Data Center, 2023.

[张晓东, 丁利荣. 中国陆域及周边逐日1 km全天候地表温度数据集(TRIMS LST, 2000—2022). 北京: 国家青藏高原科学数据中心, 2023.]

[41]
Wang Jinfeng, Xu Chengdong. Geodetector: Principle and prospective. Acta Geographica Sinica, 2017, 72(1): 116-134.

DOI

[王劲峰, 徐成东. 地理探测器: 原理与展望. 地理学报, 2017, 72(1): 116-134.]

DOI

[42]
Wang J F, Haining R, Zhang T L, et al. Statistical modeling of spatially stratified heterogeneous data. Annals of the American Association of Geographers, 2024, 114(3): 499-519.

[43]
Yang J, Ren J Y, Sun D Q, et al. Understanding land surface temperature impact factors based on local climate zones. Sustainable Cities and Society, 2021, 69: 102818. DOI: 10.1016/j.scs.2021.102818.

[44]
Yang J, Jin S H, Xiao X M, et al. Local climate zone ventilation and urban land surface temperatures: Towards a performance-based and wind-sensitive planning proposal in megacities. Sustainable Cities and Society, 2019, 47: 101487. DOI: 10.1016/j.scs.2019.101487.

[45]
Chen Yaping, Zheng Bohong, Xie Yanghui, et al. Characteristics of urban heat island and related mitigation strategies under the local climate zone framework: A case study of Chenzhou. City Planning Review, 2023, 47(12): 106-116.

[陈亚萍, 郑伯红, 谢杨辉, 等. 局地气候区框架下的城市热岛特征及缓解策略: 以郴州市为例. 城市规划, 2023, 47(12): 106-116.]

[46]
Hu Nanlin, Ren Zhibin, Dong Yulin, et al. Spatio-temporal evolution of heat island effect and its driving factors in urban agglomerations of China. Geographical Science, 2022, 42(9): 1534-1545.

[胡楠林, 任志彬, 董禹麟, 等. 中国城市群热岛效应时空演变及其影响因素分析. 地理科学, 2022, 42(9): 1534-1545.]

DOI

[47]
Yao R, Wang L C, Huang X, et al. Interannual variations in surface urban heat island intensity and associated drivers in China. Journal of Environmental Management, 2018, 222: 86-94.

DOI PMID

[48]
Zhang Weiwei, Jia Ruoyu, Tian Ming, et al. Exploring diurnal dynamic variations of inter-and intra-LCZ urban thermal environment with ECOSTRESS. Journal of Geo-information Science, 2024, 26(3): 679-692.

[张伟伟, 贾若愚, 田明, 等. 利用ECOSTRESS探究LCZ类间和类内城市热环境日动态变化. 地球信息科学学报, 2024, 26(3): 679-692.]

DOI

[49]
Zhou M S, Wang R, Guo Y Y. How urban spatial characteristics impact surface urban heat island in subtropical high-density cities based on LCZs: A case study of Macau. Sustainable Cities and Society, 2024, 112: 105587. DOI: 10.1016/j.scs.2024.105587.

[50]
Bechtel B, Demuzere M, Mills G, et al. SUHI analysis using local climate zones: A comparison of 50 cities. Urban Climate, 2019, 28: 100451. DOI: 10.1016/j.uclim.2019.01.005.

[51]
Beijing Municipal Government. Circular of Beijing Municipal Government on issuing the implementation opinions on deepening the special programs to improve the city's development by rectifying urban problems amid relocation of Non-capital functions during the 14th Five-Year Plan Period. Gazette of the People's Government of Beijing, 2021(6): 22-38.

[北京市人民政府. 北京市人民政府关于印发《关于“十四五”时期深化推进“疏解整治促提升”专项行动的实施意见》的通知. 北京市人民政府公报, 2021(6): 22-38.]

[52]
Hu Y N, Connor D S, Stuhlmacher M, et al. More urbanization, more polarization: Evidence from two decades of urban expansion in China. NPJ Urban Sustainability, 2024, 4(1): 33. DOI: 10.1038/s42949-024-00170-z.

文章导航

/