
街景精细尺度下城市经济发展预测及有效性评估
|
柳林(1971-), 女, 山东烟台人, 博士, 副教授, 硕士生导师, 研究方向为实景三维与GeoAI。E-mail: liulin2009@126.com |
收稿日期: 2023-05-08
修回日期: 2024-02-28
网络出版日期: 2024-08-06
基金资助
山东省自然科学基金项目(ZR2019MD034)
Prediction and effectiveness evaluation of urban economic development on fine scale of streetscape
Received date: 2023-05-08
Revised date: 2024-02-28
Online published: 2024-08-06
Supported by
Natural Science Foundation of Shandong Province(ZR2019MD034)
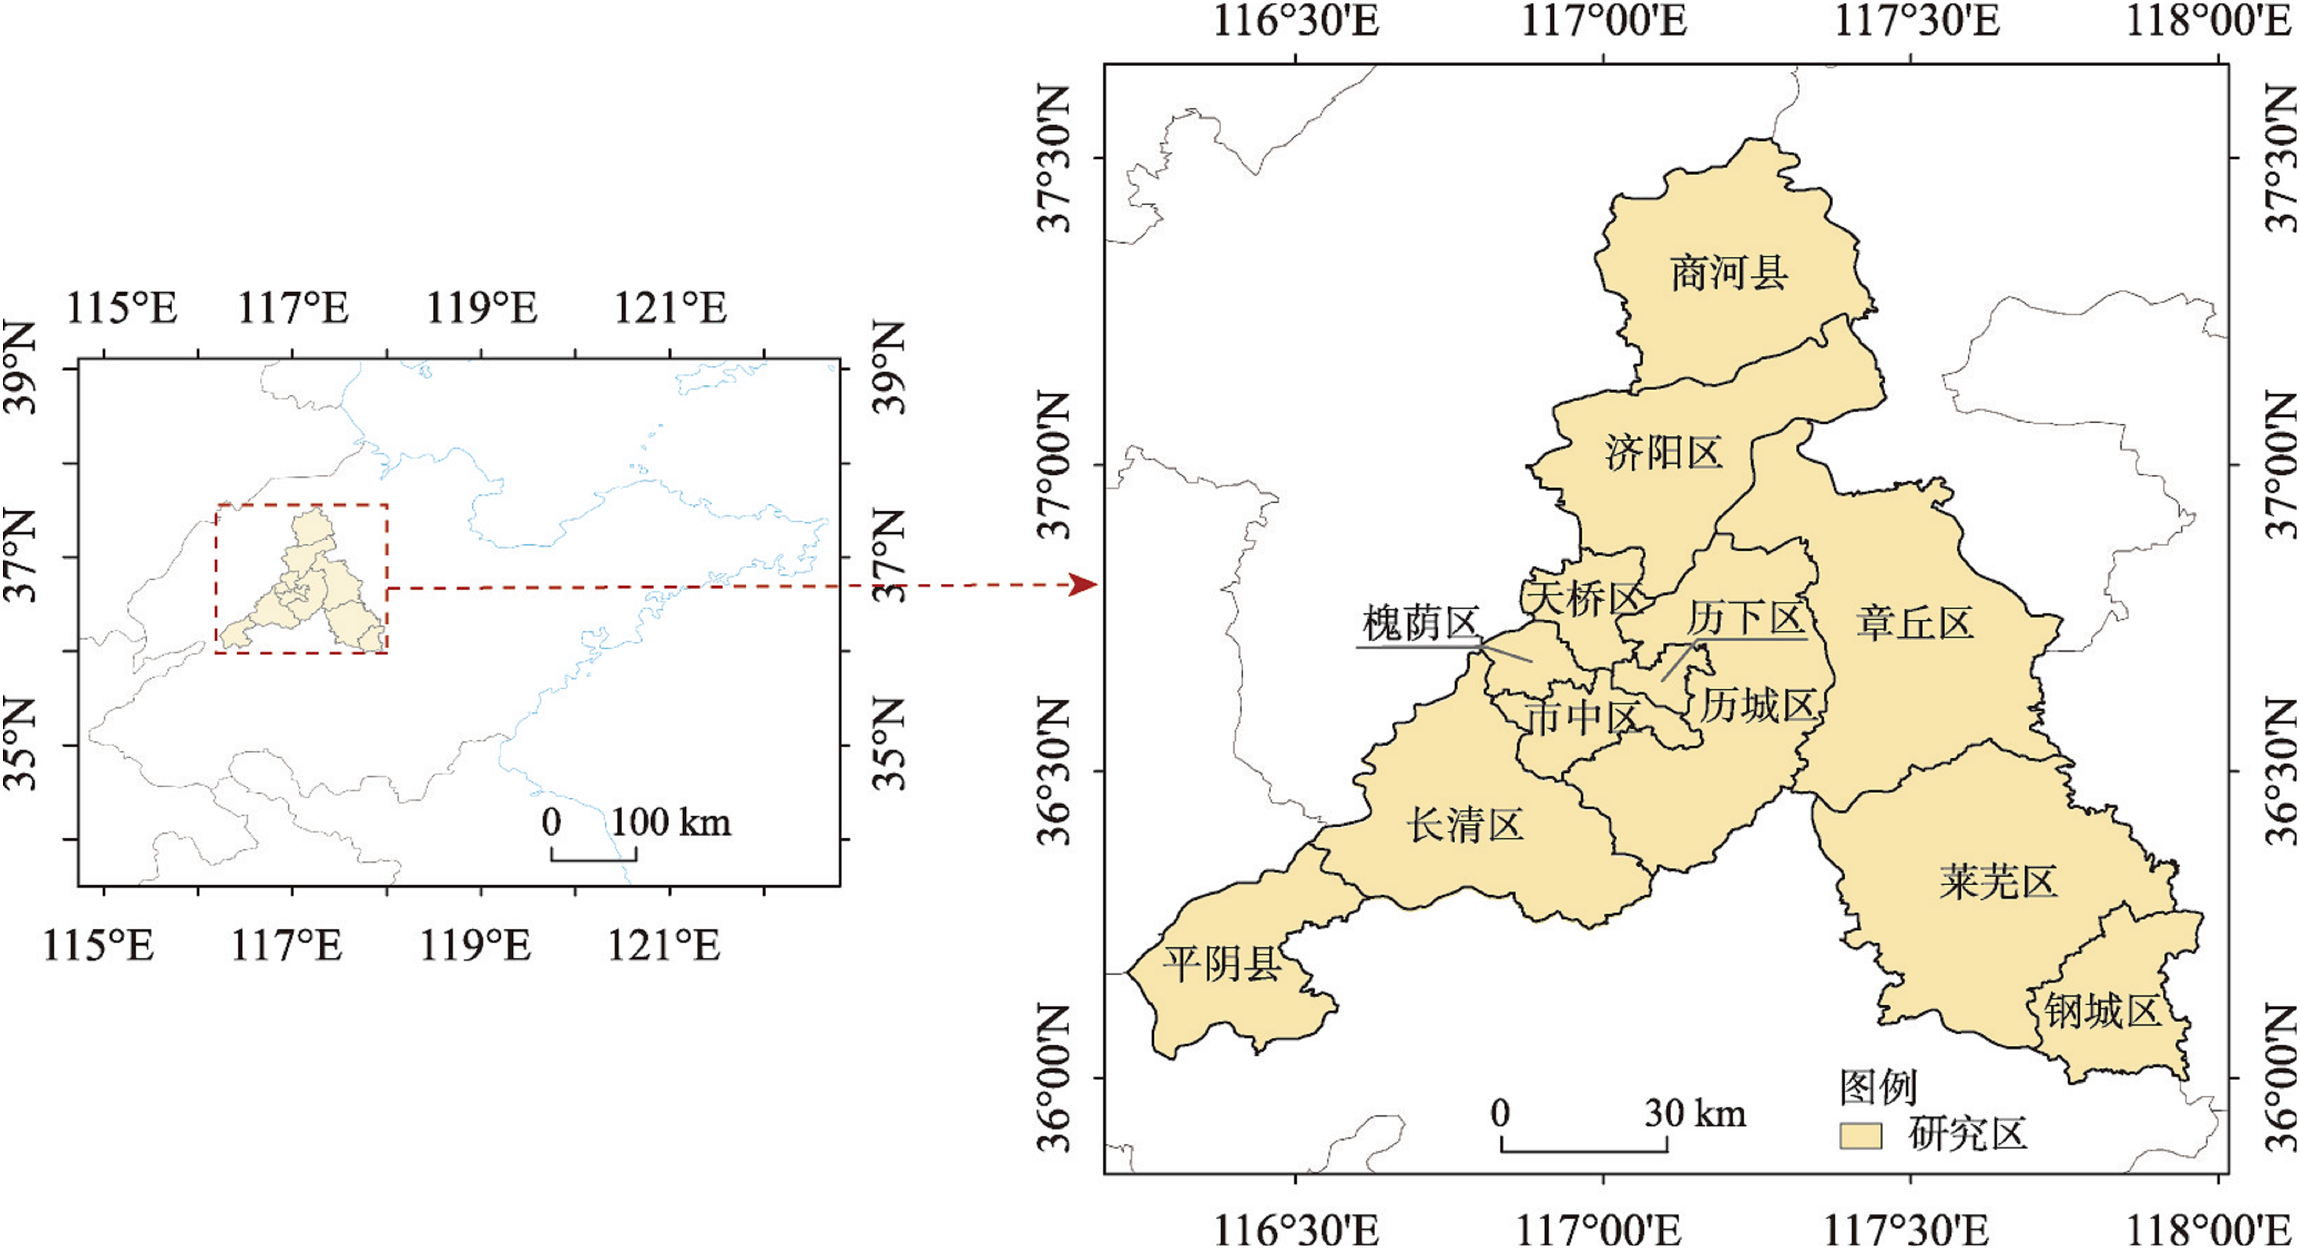
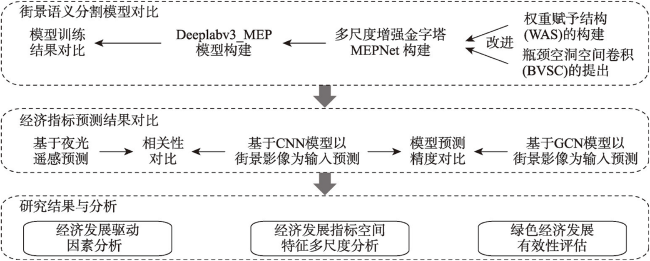
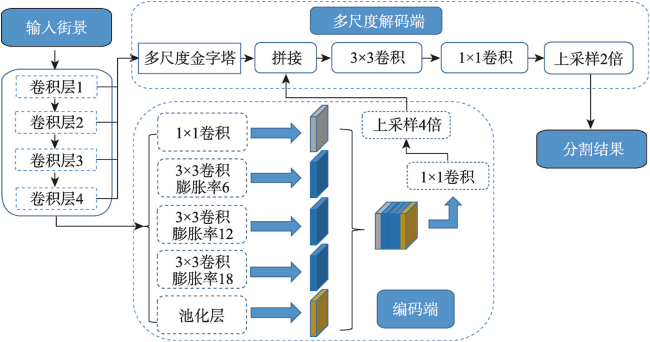
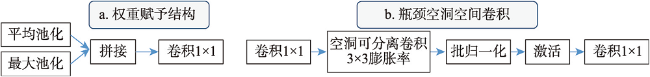
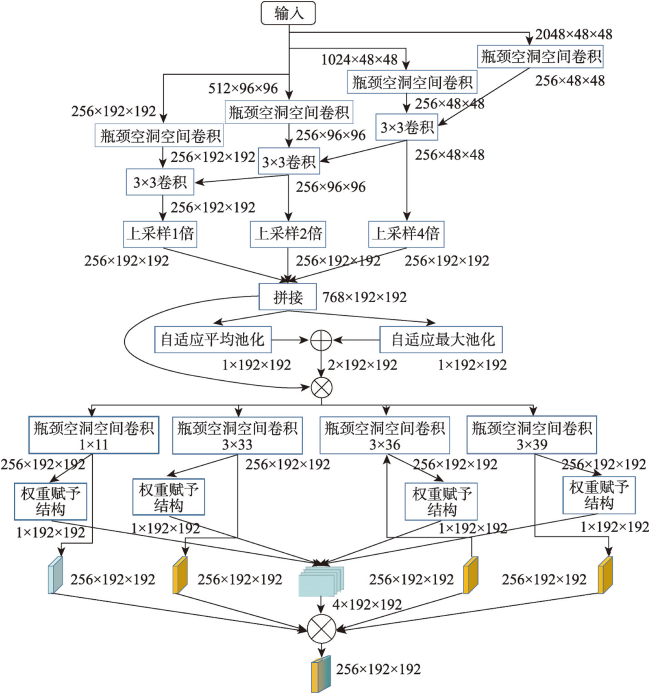
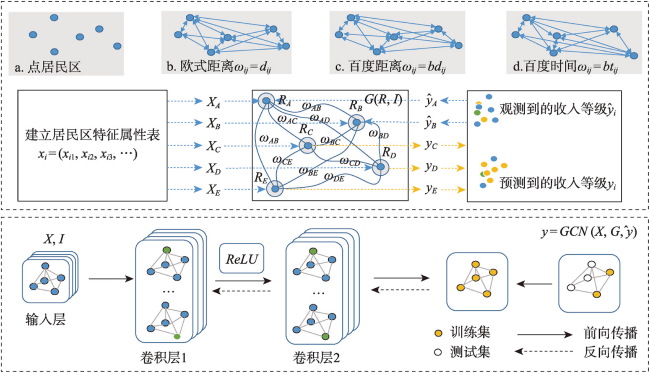
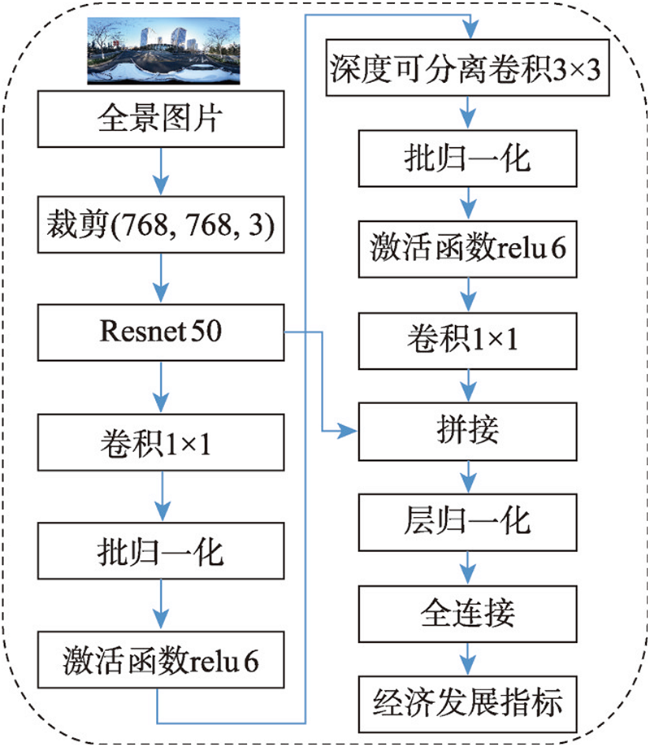
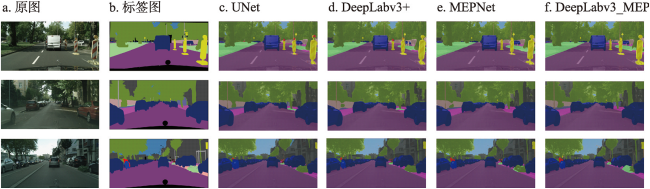
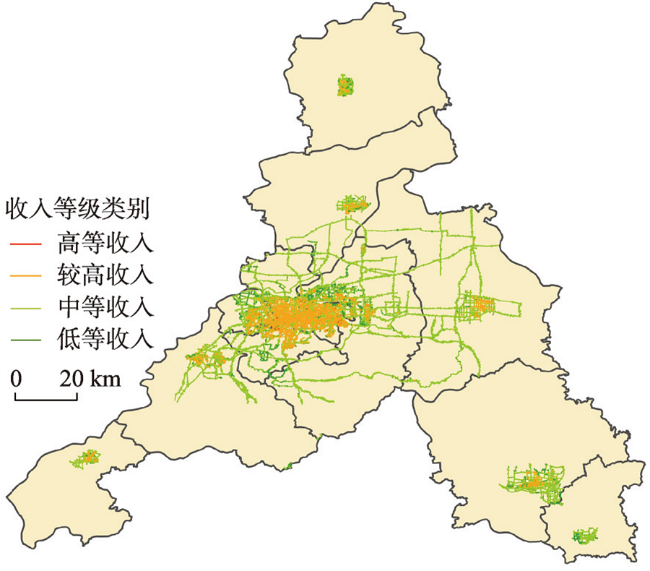
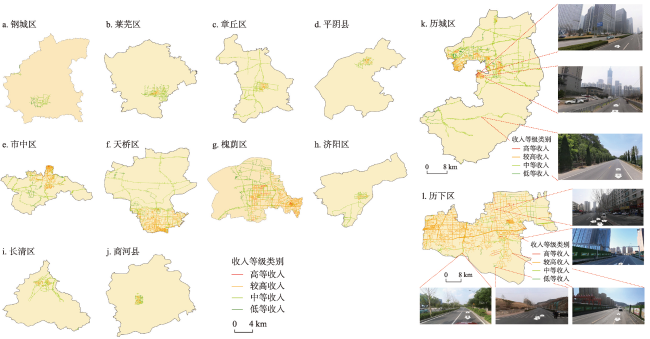
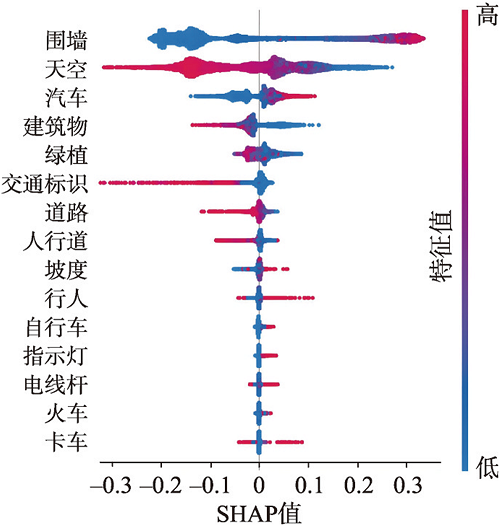
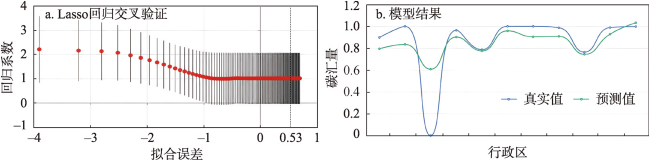
随着城市化进程加快,传统大尺度遥感影像数据和经济统计方法无法从精细尺度刻画城市经济发展动态。街景影像可以反映城市建成环境物质空间特征,基于此可以在更精细尺度上对经济发展指标预测。本文提出一种改进的Deeplabv3_MEP街景影像语义分割模型,提取街景要素占比,采用图神经网络与卷积神经网络分别以街景要素指标和街景影像作为输入,预测经济指标;并利用XGBoost模型分析经济指标驱动因素,计算碳汇并构建Lasso回归模型评估行政区绿色经济发展有效性。结果发现:① 在市级区划尺度上,济南市经济指标呈现向市中心高度集中、向外围逐渐降低趋势;② 在区级区划尺度上,历下区经济发展水平最高,东部零星地区发展水平极高,其余地区较低;③ 在街道级区划尺度上,越靠近区或县中心街道,居民平均收入水平越高,越靠近市中心街道,居民平均收入水平更高;④ 驱动因素方面,围墙、天空、道路、建筑与汽车等要素对经济发展指标贡献较大,电线杆、摩托车等要素对经济发展贡献较小,公交车要素最低;⑤ 济南市存在绿色经济发展指数与经济发展水平不匹配现象。本文的研究方法不仅为精细尺度城市经济发展预测提供了研究框架的借鉴,也为理解城市绿色经济发展效能提供了新视角,有助于城市规划和可持续发展政策的制定。
柳林 , 张振岩 , 项子诚 , 郭靖雯 . 街景精细尺度下城市经济发展预测及有效性评估[J]. 地理学报, 2024 , 79(8) : 1978 -1993 . DOI: 10.11821/dlxb202408006
With the acceleration of urbanization, traditional large-scale remote sensing image and economic statistical methods cannot accurately depict the dynamics of urban economic development from a fine scale. Streetscape images can reflect the material spatial features of the urban built environment. And based on this, economic development indicator (EDI) can be predicted at a finer scale. The study proposes an improved Deeplabv3_MEP semantic segmentation model for streetscape images to extract the percentage of streetscape elements. Then, graph neural network (GCN) and convolutional neural network (CNN) are used separately with streetscape factor index and streetscape images as inputs to predict EDI. And the XGBoost model is used to analyze the driving factors of EDI. The carbon sinks are calculated and a Lasso regression model is constructed to evaluate the effectiveness of green economic development in administrative regions. The results show that: (1) At the city-level division scale, the economic indicator of Jinan city shows a trend of high concentration towards the city center and a gradual decrease towards the outskirts. (2) At the district-level division scale, Lixia district has the highest level of economic development. And the development level in sporadic areas in the east is very high, while that in other areas is lower. (3) At the street-level division scale, the closer the street is to the district or county center, the higher the average income level of residents, and the closer the street is to the city center, the higher the average income level of residents. (4) Driving factors such as wall, sky, road, and car, contribute more to EDI, while factors such as pole and motorcycle contribute less, with bus being the lowest. (5) There is a phenomenon of mismatch between the green economic development index and the level of economic development.
表1 模型实验结果对比Tab. 1 Comparison of experimental results of models |
| 主干网络 | 模型 | 平均交并比(%) | 平均召回率(%) | 平均精确率(%) |
|---|---|---|---|---|
| ResNet 18 | ResNet 18 | 59.82 | 68.71 | 78.40 |
| DeepLabv3+ | 64.71 | 74.31 | 80.42 | |
| MEPNet (本文模型) | 65.47 | 74.62 | 81.37 | |
| DeepLabv3_MEP (本文模型) | 66.91 | 76.33 | 81.90 | |
| ResNet 34 | ResNet 34 | 63.42 | 72.74 | 79.80 |
| DeepLabv3+ | 66.50 | 75.94 | 81.17 | |
| MEPNet (本文模型) | 67.61 | 76.67 | 83.15 | |
| DeepLabv3_MEP (本文模型) | 69.24 | 78.70 | 82.92 | |
| Resnet 50 | Resnet 50 | 64.90 | 74.64 | 80.14 |
| FCN8S | 67.87 | 76.95 | 82.63 | |
| UNet | 68.03 | 76.70 | 83.18 | |
| PSPNet | 69.20 | 81.46 | 81.24 | |
| RefineNet | 70.68 | 79.56 | 84.89 | |
| DeepLabv3+ | 71.67 | 80.84 | 84.27 | |
| MEPNet (本文模型) | 72.26 | 81.31 | 86.62 | |
| DeepLabv3_MEP (本文模型) | 74.94 | 82.41 | 87.94 |
表2 模型精度对比(%)Tab. 2 Model accuracy comparison (%) |
| 模型 | 2分类 | 3分类 | 4分类 |
|---|---|---|---|
| BD-GCN | 80.01 | 78.06 | 74.19 |
| ED-GCN | 84.32 | 82.34 | 80.12 |
| BT-GCN | 86.42 | 84.22 | 81.26 |
| CNN | 89.35 | 89.35 | 89.35 |
表3 不同预测方法与GDP相关性对比Tab. 3 Comparison of different predicting methods and GDP correlations |
| 指标 | GDP归一化 | 灯光综合指数归一化 | 经济发展指标的归一化 |
|---|---|---|---|
| GDP归一化 | 1.00 | 0.78 | 0.83 |
| 灯光综合指数归一化 | 0.78 | 1.00 | 0.78 |
| 经济发展指标的归一化 | 0.83 | 0.78 | 1.00 |
| [1] |
[朱诚, 姜逢清, 吴立, 等. 对全球变化背景下长三角地区城镇化发展科学问题的思考. 地理学报, 2017, 72(4): 633-645.]
|
| [2] |
|
| [3] |
|
| [4] |
|
| [5] |
[刘权毅, 詹庆明, 李建松, 等. 珞珈一号夜间灯光影像在建设用地提取中的应用: 以武汉市为例. 武汉大学学报(信息科学版), 2021, 46(1): 30-39.]
|
| [6] |
[刘泠岑, 孙中孝, 吴锋, 等. 基于夜间灯光数据的中国县域发展活力与均衡性动态研究. 地理学报, 2023, 78(4): 811-823.]
|
| [7] |
[崔成, 赵璐, 任红艳, 等. 耦合GF-2遥感影像与街景影像的广州市城中村识别. 遥感学报, 2022, 26(9): 1802-1813.]
|
| [8] |
|
| [9] |
|
| [10] |
|
| [11] |
|
| [12] |
|
| [13] |
|
| [14] |
|
| [15] |
|
| [16] |
|
| [17] |
|
| [18] |
|
| [19] |
|
| [20] |
|
| [21] |
|
| [22] |
|
| [23] |
|
| [24] |
|
| [25] |
[杨灿灿, 许芳年, 江岭, 等. 基于街景影像的城市道路空间舒适度研究. 地球信息科学学报, 2021, 23(5): 785-801.]
|
| [26] |
|
| [27] |
|
| [28] |
|
| [29] |
[马蓓蓓, 李海玲, 魏也华, 等. 西安市贫困空间结构特征与发生机理. 地理学报, 2018, 73(6): 1018-1032.]
|
| [30] |
|
| [31] |
|
| [32] |
|
| [33] |
|
| [34] |
|
| [35] |
|
| [36] |
|
| [37] |
|
| [38] |
[李源清, 张晓东, 胡娜, 等. 基于统计数据郑州市全口径碳汇估算研究. 计量学报, 2022, 43(2): 281-286.]
|
| [39] |
|
| [40] |
|
| [41] |
[卓莉, 陈晋, 史培军, 等. 基于夜间灯光数据的中国人口密度模拟. 地理学报, 2005, 60(2): 266-276.]
|
| [42] |
|
/
| 〈 |
|
〉 |

