
人口流动分析范式及中国人口省际迁移流动分量辨识
|
丁金宏(1963-), 男, 江苏涟水人, 博士, 教授, 博士生导师, 研究方向为人口地理。E-mail: jhding@re.ecnu.edu.cn |
收稿日期: 2023-04-28
修回日期: 2023-09-24
网络出版日期: 2024-08-06
基金资助
国家社会科学基金重大项目(18ZDA132)
中央高校基本科研业务费专项资金(YBNLTS2023-038)
A new paradigm of the floating population analysis and the estimation of inter-provincial migration sub-flows in China
Received date: 2023-04-28
Revised date: 2023-09-24
Online published: 2024-08-06
Supported by
The Major Program of National Social Science Foundation of China(18ZDA132)
Fundamental Research Funds for the Central Universities(YBNLTS2023-038)
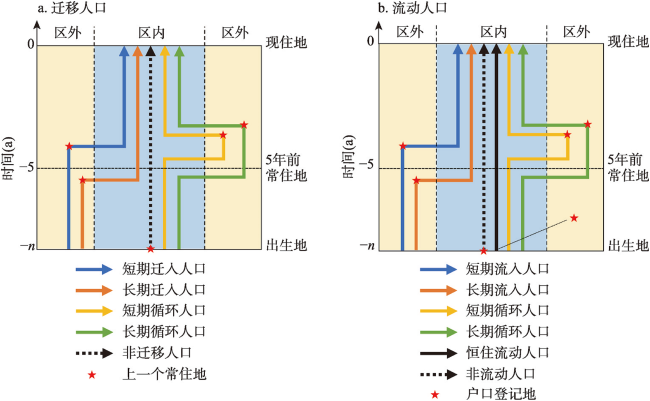
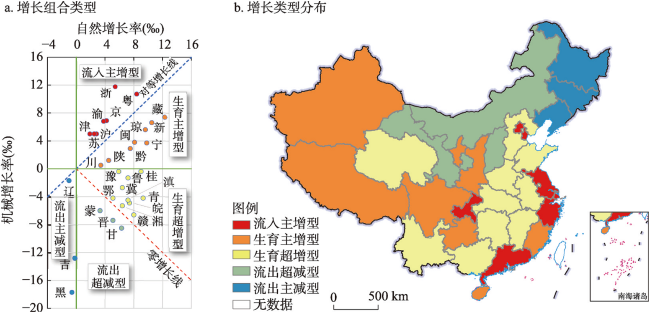
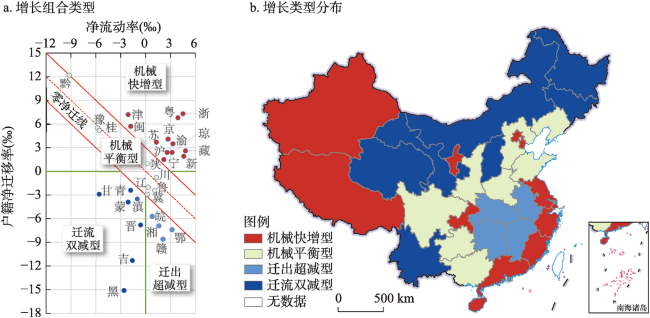
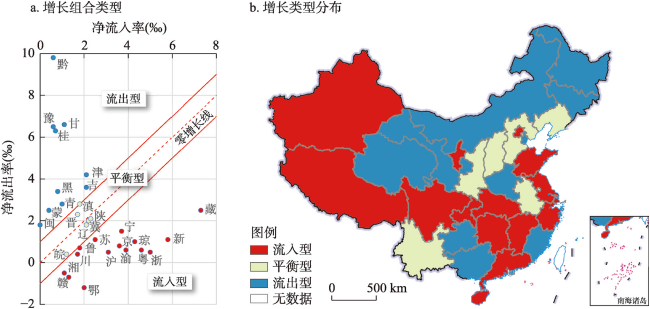
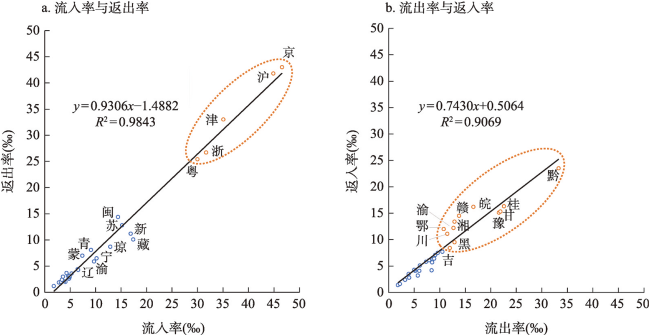
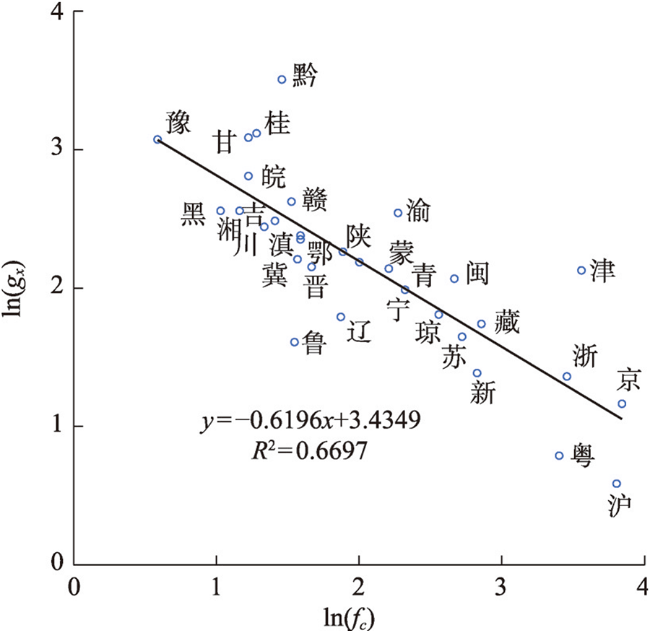
中国人口迁移流动的统计口径独特且多次变化,既困扰人口迁移研究,又削弱了国际可比性。通过对比分析联合国推荐的迁移口径,界定出内涵更为复杂的中国人口普查口径下的5类流动人口,由此建构中国人口流动分析新范式,指出流入与流出并不是直接的反流关系,而是各有自己的反流即流入—返出、流出—返入。借助普查间人口迁移队列,以留存率为基础构建辨识省际人口迁移流动分量模型,2010—2020年中国省际流动人口的年均留存率为88.7%,按此逐步模拟计算出中国分省份人口增长的全要素平衡表,分层分析人口增长的要素组合类型及其区域分布特征。人口总增长分为5种类型,其中流入主增型主要分布在直辖市和东部沿海,生育主增型和生育超增型主要是西部省份和中部农业大省,流出超减型和流出主减型分布在晋蒙甘和东北三省;人口机械增长分为快增、平衡、迁出超减和迁流双减等4种类型,以平衡型条带为对称轴全国自西北向东南形成“W”型剖面;人口流动分为流入、流出和平衡3种类型,流入和流出都存在高相关性的反向流,且流入率与流出率显著负相关。人口流动分析范式和模型可进一步推广至包括国际迁移在内的“求籍迁移”及包括升学、就业、结婚等身份变化在内的身份迁移的研究,以实现中外人口迁移话语体系的有效对接。

丁金宏 , 常亮 , 陈益豪 , 黄小丽 . 人口流动分析范式及中国人口省际迁移流动分量辨识[J]. 地理学报, 2024 , 79(8) : 1883 -1897 . DOI: 10.11821/dlxb202408001
The statistical definition of migration in China is attached with its unique household registration (hukou) system, the migrants so defined are also called the floating population. A new analytical paradigm is needed to deal with the complexity of sub-flows in the floating population. The paper classifies five types of the floating population in census context by referring the UN migration criteria, and constructs a new paradigm for analyzing the floating population in China. As a particular provincial-level region (hereafter province) is concerned, the inflow and outflow people belong to different hukou groups balanced by their own counter-flow, namely, inflow vs back-inflow (both have no hukou of the province), outflow vs back-outflow (both have hukou of the province). With the clue of inter-census migration cohort, a sub-flows model is constructed to identify the inter-provincial migration based on the retention rate. The annual retention rate of the inter-provincial migration cohort from 2010 to 2020 is 88.7%. Based on the provincial retention rates, an all-increment table of population change by province in China is made by modelling simulation. The paper surfaces new characteristics of population growth and inter-provincial migration: (1) Provincial population changes are divided into five types, among which the inflow-leading increase type is mainly found in municipalities and the eastern coastal areas, while the fertility-leading increase type and the fertility-overriding increase type are mainly in the western provinces and the agricultural provinces in the middle, and the outflow-overriding decrease type and the outflow-leading decrease type in Shanxi, Inner Mongolia, Gansu and the northeastern provinces. (2) The mechanical growth of population can be divided into four types: rapid increase, equilibrium, outflow-overriding decrease and dual decrease (both hukou and non-hukou migration are negative). A "W"-shaped mechanical growth rate profile from northwest to southeast is found with the equilibrium belt standing in its middle. (3) Population floating is divided into three types. The counter-flows are highly-correlated: inflow rate and outflow rate are negatively correlated while the inflow-back-inflow and outflow-back-outflow are significant positively correlated. The analytical paradigm and model of floating population in China can be further extended to the study of "citizenship seeking migration" including international migration, and even further to identity migration including migrations with status changing such as enrollment, employment and marriage.
表1 1953—2020年中国历次人口普查地理信息Tab. 1 The geographical information in China's censuses |
| 普查年份 | 现住地 | 上一个 常住地 | 户口 登记地 | 出生地 | 5年前 常住地 |
|---|---|---|---|---|---|
| 1953 | √ | ||||
| 1964 | √ | ||||
| 1982 | √ | √ | |||
| 1987 | √ | √ | √ | ||
| 1990 | √ | √ | √ | ||
| 1995 | √ | √ | √ | √ | |
| 2000 | √ | √ | √ | √ | √ |
| 2005 | √ | √ | √ | ||
| 2010 | √ | √ | √ | √ | |
| 2015 | √ | √ | √ | ||
| 2020 | √ | √ | √ | √ |
注:1987年、1995年、2005年、2015年为全国1%人口抽样调查。 |
表2 2010—2020年中国分省份人口增长全要素平衡表(‰)Tab. 2 The all-increment equilibrium table of population growth by province in China, 2010-2020 (‰) |
| 省份 | 增长率 | 自然增长率 | 机械增长率 | ||||||||||||
|---|---|---|---|---|---|---|---|---|---|---|---|---|---|---|---|
| 合计 | 户籍 人口 | 流动 人口 | 合计 | 流动率 | 户籍净 迁移率 | ||||||||||
| 净流 动率 | 流入 | 流出 | |||||||||||||
| 净流 入率 | 流入率 | 返出率 | 净流 出率 | 流出率 | 返入率 | ||||||||||
| (1) | (2) | (3) | (4) | (5) | (6)= (2)-(3) | (7)= (8)-(11) | (8)= (9)-(10) | (9) | (10) | (11)= (12)-(13) | (12) | (13) | (14)= (6)-(7) | ||
| 合计 | 5.6 | 5.6 | 5.3 | 12.9 | 0.0 | 0.0 | 1.9 | 10.5 | 8.5 | 1.9 | 10.5 | 8.5 | 0.0 | ||
| 北京 | 11.1 | 4.2 | 1.7 | 8.4 | 6.9 | 2.7 | 3.6 | 46.6 | 43.0 | 0.8 | 3.2 | 2.4 | 4.1 | ||
| 天津 | 6.9 | 1.9 | -0.2 | 8.4 | 5.0 | -2.1 | 2.1 | 35.1 | 33.0 | 4.2 | 8.4 | 4.2 | 7.2 | ||
| 河北 | 3.8 | 6.4 | 6.2 | 13.7 | -2.7 | 0.2 | 2.2 | 4.8 | 2.6 | 2.0 | 9.1 | 7.1 | -2.9 | ||
| 山西 | -2.3 | 5.1 | 4.9 | 10.1 | -7.4 | -0.6 | 1.7 | 5.3 | 3.6 | 2.3 | 8.6 | 6.3 | -6.8 | ||
| 内蒙古 | -2.7 | 3.3 | 2.8 | 9.7 | -6.0 | -2.1 | 0.4 | 7.4 | 7.0 | 2.5 | 8.9 | 6.4 | -3.9 | ||
| 辽宁 | -2.7 | -1.0 | -1.5 | 8.3 | -1.7 | 0.3 | 2.1 | 6.5 | 4.4 | 1.8 | 6.0 | 4.1 | -2.0 | ||
| 吉林 | -13.1 | -0.2 | -0.5 | 8.8 | -12.8 | -1.6 | 2.1 | 4.1 | 2.0 | 3.6 | 12.0 | 8.4 | -11.3 | ||
| 黑龙江 | -18.3 | -0.6 | -0.7 | 7.3 | -17.7 | -2.6 | 0.8 | 2.8 | 1.9 | 3.4 | 12.9 | 9.5 | -15.1 | ||
| 上海 | 7.8 | 2.8 | -0.9 | 8.1 | 5.0 | 2.6 | 3.1 | 44.9 | 41.8 | 0.5 | 1.8 | 1.4 | 2.4 | ||
| 江苏 | 7.5 | 2.5 | 1.4 | 11.3 | 5.0 | 1.3 | 2.5 | 15.2 | 12.8 | 1.1 | 5.2 | 4.1 | 3.7 | ||
| 浙江 | 17.2 | 5.4 | 3.8 | 10.8 | 11.8 | 4.5 | 5.0 | 31.7 | 26.7 | 0.5 | 3.9 | 3.5 | 7.3 | ||
| 安徽 | 2.5 | 7.4 | 7.3 | 15.9 | -4.9 | 0.8 | 1.2 | 3.4 | 2.2 | 0.4 | 16.6 | 16.2 | -5.7 | ||
| 福建 | 11.9 | 8.1 | 7.5 | 12.6 | 3.8 | -1.8 | 0.0 | 14.4 | 14.4 | 1.8 | 7.9 | 6.1 | 5.7 | ||
| 江西 | 1.4 | 8.0 | 7.8 | 14.6 | -6.6 | 2.1 | 1.3 | 4.6 | 3.2 | -0.7 | 13.8 | 14.5 | -8.6 | ||
| 山东 | 5.8 | 7.2 | 7.0 | 13.4 | -1.3 | 1.1 | 1.8 | 4.7 | 2.9 | 0.7 | 5.0 | 4.3 | -2.4 | ||
| 河南 | 5.5 | 5.9 | 5.8 | 13.7 | -0.4 | -5.8 | 0.6 | 1.8 | 1.2 | 6.5 | 21.6 | 15.1 | 5.5 | ||
| 湖北 | 0.9 | 5.1 | 4.9 | 13.6 | -4.2 | 3.2 | 2.0 | 4.9 | 2.9 | -1.2 | 10.8 | 12.0 | -7.4 | ||
| 湖南 | 1.1 | 6.4 | 6.2 | 15.0 | -5.3 | 1.6 | 1.1 | 3.2 | 2.0 | -0.5 | 12.9 | 13.4 | -6.9 | ||
| 广东 | 19.1 | 8.4 | 7.3 | 12.0 | 10.7 | 3.9 | 4.6 | 30.0 | 25.4 | 0.6 | 2.2 | 1.6 | 6.8 | ||
| 广西 | 8.6 | 9.0 | 8.8 | 18.9 | -0.4 | -5.6 | 0.7 | 3.6 | 3.0 | 6.3 | 22.6 | 16.3 | 5.2 | ||
| 海南 | 15.2 | 9.6 | 9.0 | 15.7 | 5.6 | 3.2 | 4.3 | 12.9 | 8.7 | 1.0 | 6.1 | 5.1 | 2.4 | ||
| 重庆 | 10.6 | 3.8 | 3.3 | 13.0 | 6.8 | 3.3 | 3.9 | 9.7 | 5.9 | 0.6 | 12.7 | 12.2 | 3.5 | ||
| 四川 | 4.0 | 3.4 | 3.2 | 12.0 | 0.5 | 1.3 | 1.7 | 3.8 | 2.1 | 0.4 | 11.5 | 11.1 | -0.8 | ||
| 贵州 | 10.5 | 7.5 | 7.2 | 18.9 | 2.9 | -9.2 | 0.6 | 4.3 | 3.7 | 9.8 | 33.3 | 23.5 | 12.2 | ||
| 云南 | 2.7 | 7.2 | 7.0 | 13.2 | -4.5 | -1.0 | 1.8 | 4.9 | 3.1 | 2.8 | 10.5 | 7.7 | -3.5 | ||
| 西藏 | 19.7 | 12.3 | 12.5 | 9.9 | 7.4 | 4.8 | 7.3 | 17.4 | 10.1 | 2.5 | 5.7 | 3.2 | 2.6 | ||
| 陕西 | 5.7 | 4.5 | 4.3 | 10.5 | 1.2 | 0.2 | 2.3 | 6.6 | 4.3 | 2.1 | 9.6 | 7.5 | 1.0 | ||
| 甘肃 | -2.2 | 6.3 | 6.1 | 13.9 | -8.5 | -5.6 | 1.1 | 3.4 | 2.4 | 6.6 | 21.9 | 15.3 | -2.9 | ||
| 青海 | 5.2 | 9.3 | 9.2 | 11.6 | -4.2 | -1.8 | 1.0 | 9.1 | 8.1 | 2.8 | 8.5 | 5.7 | -2.4 | ||
| 宁夏 | 13.5 | 9.8 | 9.4 | 14.5 | 3.7 | 2.2 | 3.7 | 10.2 | 6.5 | 1.5 | 7.3 | 5.8 | 1.5 | ||
| 新疆 | 17.1 | 10.5 | 10.3 | 12.7 | 6.6 | 4.6 | 5.8 | 16.9 | 11.2 | 1.1 | 4.0 | 2.8 | 1.9 | ||
注:根据《中国2010年人口普查资料》《中国人口普查年鉴2020》、国家统计局微观实验室2020年人口普查数据及《中国人口和就业统计年鉴》,运用本文设计的模型计算所得;暂未含港澳台地区数据。 |
| [1] |
|
| [2] |
Office of the Leading Group of the State Council for the Seventh National Population Census. China Population Census Yearbook-2020. Beijing: China Statistics Press, 2022.
[[国务院第七次全国人口普查领导小组办公室. 中国人口普查年鉴2020. 北京: 中国统计出版社, 2022.]
|
| [3] |
[段成荣, 孙玉晶. 我国流动人口统计口径的历史变动. 人口研究, 2006, 30(4): 70-76.]
|
| [4] |
[马忠东, 王建平. 区域竞争下流动人口的规模及分布. 人口研究, 2010, 34(3): 3-16.]
|
| [5] |
[戚伟, 赵美风, 刘盛和. 1982—2010年中国县市尺度流动人口核算及地域类型演化. 地理学报, 2017, 72(12): 2131-2146.]
|
| [6] |
[周皓. 中国迁移流动人口的统计定义: 人口普查视角下的分析. 中国人口科学, 2022(3): 17-30, 126.]
|
| [7] |
[朱宇, 林李月, 李亭亭, 等. 中国流动人口概念和数据的有效性与国际可比性. 地理学报, 2022, 77(12): 2991-3005.]
|
| [8] |
[王婧雯, 朱宇, 林李月, 等. 城—城流动人口统计口径的改进与新口径下的流动特征和影响因素. 地理科学进展, 2023, 42(3): 464-477.]
|
| [9] |
[周皓, 梁在. 中国的返迁人口: 基于五普数据的分析. 人口研究, 2006, 30(3): 61-69.]
|
| [10] |
[李贞, 陈晨. 省际人口返迁的新状况及返迁后的居住区位选择: 基于“固定时距”迁移数据的分析. 人口与发展, 2020, 26(4): 2-13.]
|
| [11] |
[吕利丹, 段成荣, 刘涛, 等. 对我国流动人口规模变动的分析和讨论. 南方人口, 2018, 33(1): 20-29.]
|
| [12] |
[刘嘉杰, 刘涛, 曹广忠. 中国人口户籍迁移与非户籍迁移的比较. 地理学报, 2022, 77(10): 2426-2438.]
|
| [13] |
Population Census Office under the State Council, Department of Population and Employment Statistics National Bureau of Statistics. Tabulation on the 2010 Population Census of the People's Republic of China. Beijing: China Statistics Press, 2012.
[[国务院人口普查办公室, 国家统计局人口和就业统计司. 中国2010年人口普查资料. 北京: 中国统计出版社, 2012.]
|
| [14] |
Department of Population and Employment Statistics National Bureau of Statistics. China Population and Employment Statistical Yearbook (2011-2020). Beijing: China Statistics Press, 2012-2021.
[国家统计局人口和就业统计司. 中国人口和就业统计年鉴(2011—2020). 北京: 中国统计出版社, 2012—2021.]
|
| [15] |
[丁金宏. 人口空间过程:胶东半岛的实证研究. 上海: 华东师范大学出版社, 1996: 111-143.]
|
| [16] |
[刘盛和, 邓羽, 胡章. 中国流动人口地域类型的划分方法及空间分布特征. 地理学报, 2010, 65(10): 1187-1197.]
|
| [17] |
[丁金宏, 刘振宇, 程丹明, 等. 中国人口迁移的区域差异与流场特征. 地理学报, 2005, 60(1): 106-114.]
|
| [18] |
[陆大道. 二○○○年我国工业生产力布局总图的科学基础. 地理科学, 1986, 6(2): 110-118.]
|
| [19] |
|
| [20] |
|
/
| 〈 |
|
〉 |
