
地方劳动力市场对FDI企业规模的影响——以环渤海地区日企为例
|
王茂军(1973-), 男, 山东临沂人, 教授, 博士生导师, 中国地理学会会员(S110005331M), 研究方向为城乡发展与区域规划。E-mail: maojunw@yeah.net |
收稿日期: 2022-08-29
修回日期: 2023-03-12
网络出版日期: 2023-10-18
基金资助
国家自然科学基金项目(41771183)
The effect of the local labor market on the scale of FDI enterprises:A case study of Japanese enterprises in the Bohai Sea Rim region
Received date: 2022-08-29
Revised date: 2023-03-12
Online published: 2023-10-18
Supported by
National Natural Science Foundation of China(41771183)
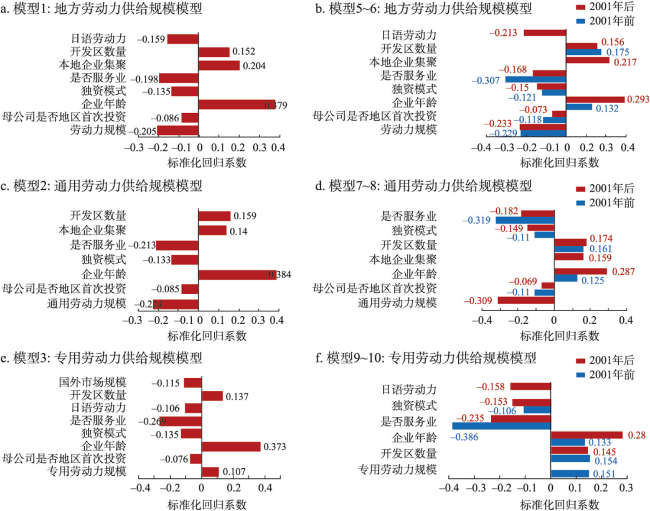
本文从企业内部规模经济、外部规模经济联合决定企业规模的视角出发,搭建了城市属性、企业属性在内的企业规模决定因素分析框架,基于地方劳动力市场规模与结构的认识,建立多元回归决定模型,以环渤海地区日企为对象,围绕通用劳动力、专用劳动力,分析了日企规模的决定因素及其时空变化。结果发现:① 环渤海地区地方劳动力规模、通用劳动力规模具有相同的日企规模抑制作用,专用劳动力规模具有日企规模扩张作用。② 2001年前后两阶段,地方劳动力供给规模的抑制效应始终稳健、显著。通用劳动力规模的抑制效应由不显著转向显著,专用劳动力规模的扩张效应由显著转为不显著。专用劳动力规模的扩张效应弱化、通用劳动力规模的抑制效应强化,导致了环渤海地区日企规模的收缩。③ 企业年龄对日企规模的扩张效应、独资进入及服务业的抑制效应显著且稳健,是最重要的企业属性。地方开发区数量的扩张效应明显,是最重要的地域属性。本地企业集聚的扩张效应在山东省最为明显,在环渤海地区专用劳动力模型中不显著,在劳动力规模及通用劳动力规模的模型中趋于强化。
王茂军 , 马慧汶 , 邵静 , 高宇斐 . 地方劳动力市场对FDI企业规模的影响——以环渤海地区日企为例[J]. 地理学报, 2023 , 78(10) : 2443 -2464 . DOI: 10.11821/dlxb202310005
The paper builds a framework for analyzing the determinants of the scale of enterprises, including city attributes and firm attributes, from the perspective of internal and external economies of scale jointly determining enterprise scale. Based on the understanding of the scale and structure of the local labor market, we take Japanese multinational enterprises (JMEs) in the Bohai Sea Rim region as the research object. This paper focuses on the shared labor force and dedicated labor force to establish multiple regression decision models, and to analyze the determinants of the scale of JMEs and its spatial and temporal changes. The results show that: (1)The scale of the local labor force and the shared labor force have an inhibiting effect on the scale of JMEs, and the scale of the dedicated labor force has an expansionary effect on the scale of the enterprise. (2) The scale of the local labor force has a significant and robust inhibition effect on the scale of JMEs during the studied period. The inhibition effect of the scale of the shared labor force on the scale of JMEs is only significant after 2001, while the expansion effect of the scale of the dedicated labor force on the scale of JMEs is significant before 2001. Over time, the weakening of the expansion effect of the dedicated labor force and the strengthening of the inhibition effect of the shared labor force have jointly affected the shrinking scale of JMEs. (3) Among the enterprise attributes, enterprise age has an expansion effect on the scale of JMEs, while sole proprietorship entry and service-oriented industry have a significant and robust inhibiting effect on the scale of JMEs. The number of local development zones is the most important city attribute and has a significant expansion effect on the scale of JMEs. The expansion effect of local enterprise agglomeration on JMEs is most pronounced in Shandong province, but insignificant in the model of the dedicated labor force, and tends to strengthen in the models of the local labor force and the general labor force in the Bohai Sea Rim region.
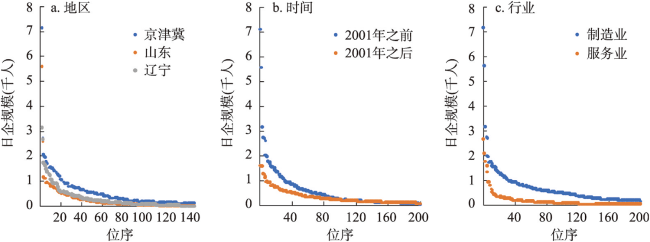
表1 环渤海地区日企的规模分布Tab. 1 Scale distribution of Japanese multinational enterprises in Bohai Sea Rim region |
| 帕累托指数β | 调整R2 | ||
|---|---|---|---|
| 地区 | 环渤海 | 0.505*** | 0.774 |
| 京津冀 | 0.505*** | 0.804 | |
| 山东 | 0.528*** | 0.762 | |
| 辽宁 | 0.471*** | 0.769 | |
| 时间 | 2001年之前 | 0.549*** | 0.755 |
| 2001年之后 | 0.531*** | 0.788 | |
| 行业 | 制造业 | 0.518*** | 0.746 |
| 服务业 | 0.541*** | 0.841 | |
注:***表示在1%水平上显著。 |
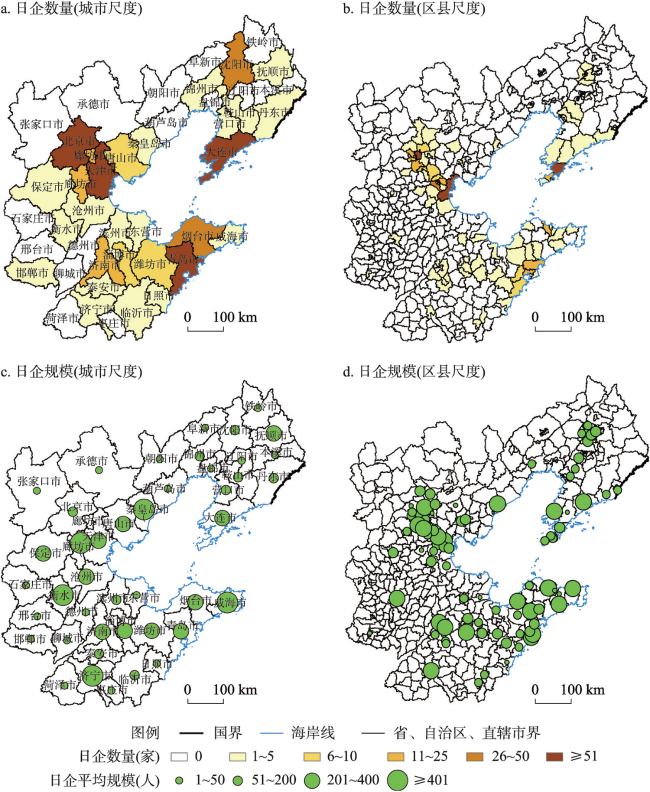
图5 2016年环渤海地区日企数量及平均员工规模的空间分异Fig. 5 Spatial distribution of the number of Japanese multinational enterprises and its average employee scale on municipal and county levels in Bohai Sea Rim region in 2016 |
表2 2016年环渤海地区的日企平均规模Tab. 2 Number of Japanese multinational enterprises and its average employee scale in Bohai Sea Rim region in 2016 |
| 地区 | 县市区数(个) | 日企数量(家) | 区县平均日企数(家) | 平均员工数(人) | 平均员工数标准差 |
|---|---|---|---|---|---|
| 中心城区 | 32 | 136 | 4.25 | 170 | 520.09 |
| 近郊区 | 30 | 387 | 12.9 | 272 | 519.76 |
| 远郊区 | 16 | 118 | 7.38 | 322 | 536.37 |
| 县及县级市 | 23 | 40 | 1.74 | 251 | 523 |
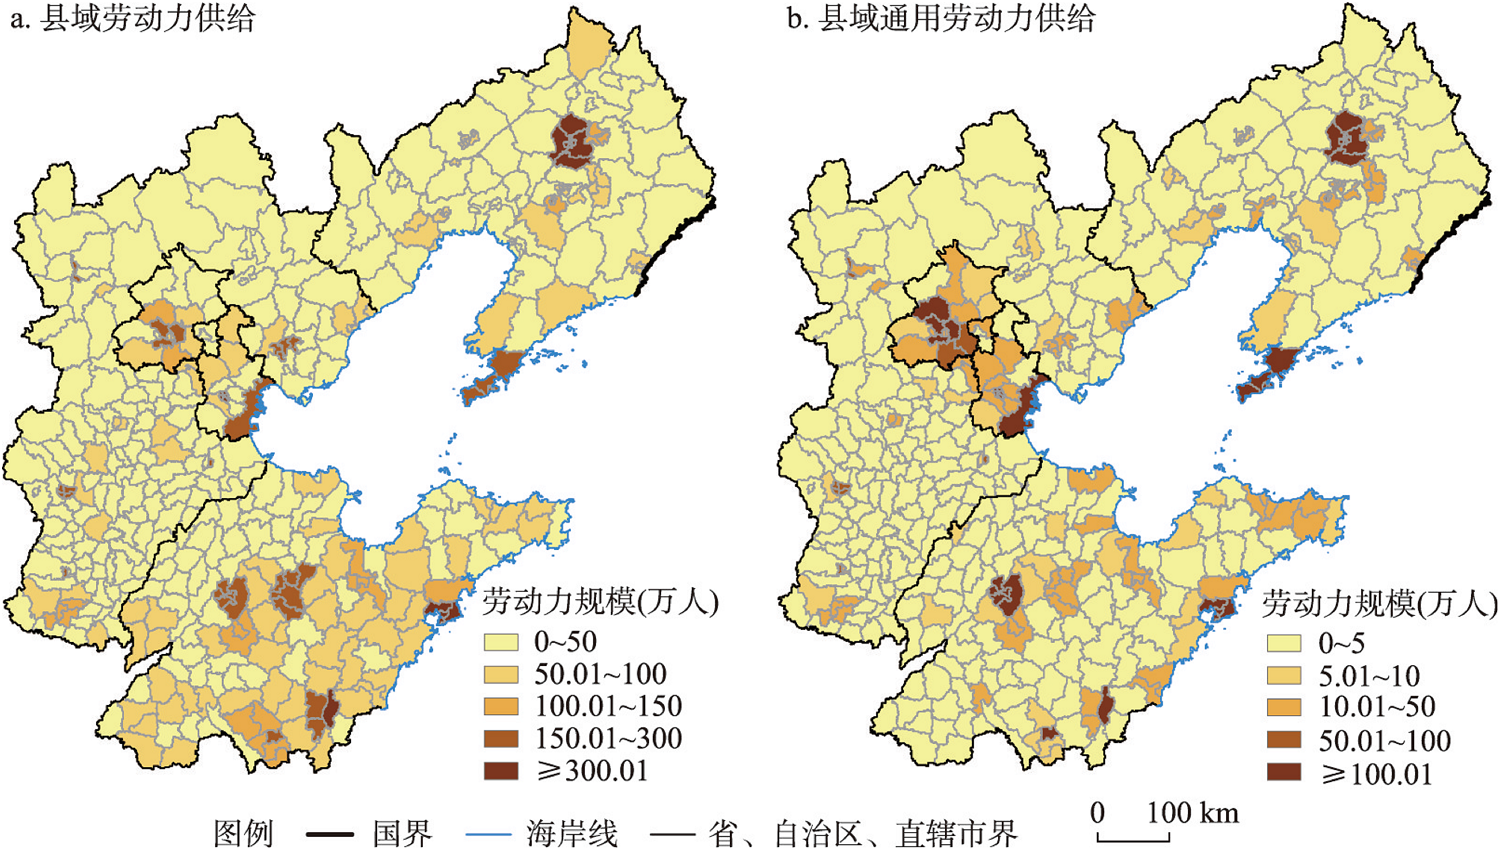
表3 2010年环渤海地区的劳动力、通用劳动力的规模分布Tab. 3 The distribution of labor force and shared labor force in Bohai Sea Rim region in 2010 |
| 空间 尺度 | 区域 | 单位数量(家) | 劳动力规模 | 通用劳动力规模 | |||||
|---|---|---|---|---|---|---|---|---|---|
| 中位数(百万人) | 变异系数 | 帕累托指数 | 中位数(万人) | 变异系数 | 帕累托指数 | ||||
| 城市 尺度 | 环渤海 | 44 | 295.06 | 0.70 | 1.24 | 24.52 | 2.16 | 0.80 | |
| 京津冀 | 13 | 478.61 | 0.64 | 1.26 | 40.69 | 1.93 | 0.59 | ||
| 辽宁省 | 14 | 171.32 | 0.64 | 1.52 | 18.82 | 1.41 | 0.81 | ||
| 山东省 | 17 | 382.53 | 0.46 | 1.11 | 29.49 | 1.10 | 0.75 | ||
| 区县 尺度 | 环渤海 | 444 | 32.44 | 0.72 | 1.38 | 1.76 | 2.53 | 0.60 | |
| 京津冀 | 204 | 28.14 | 0.92 | 1.42 | 1.11 | 2.81 | 0.53 | ||
| 辽宁省 | 100 | 27.88 | 0.59 | 1.25 | 2.80 | 1.60 | 0.76 | ||
| 山东省 | 140 | 43.92 | 0.45 | 1.66 | 1.89 | 1.36 | 0.61 | ||
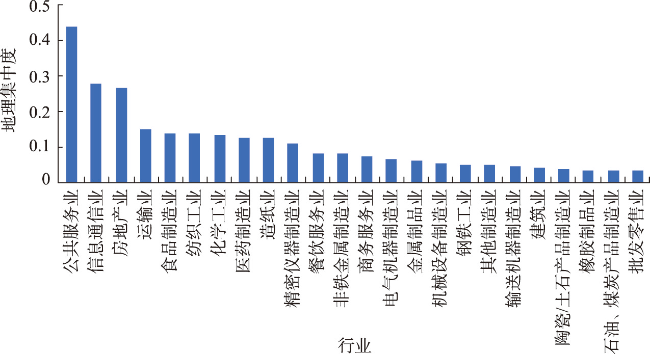
图7 2013年环渤海地区部分主要行业的地理集中度Fig. 7 Geographical concentration degree of different industries in Bohai Sea Rim region in 2013 |
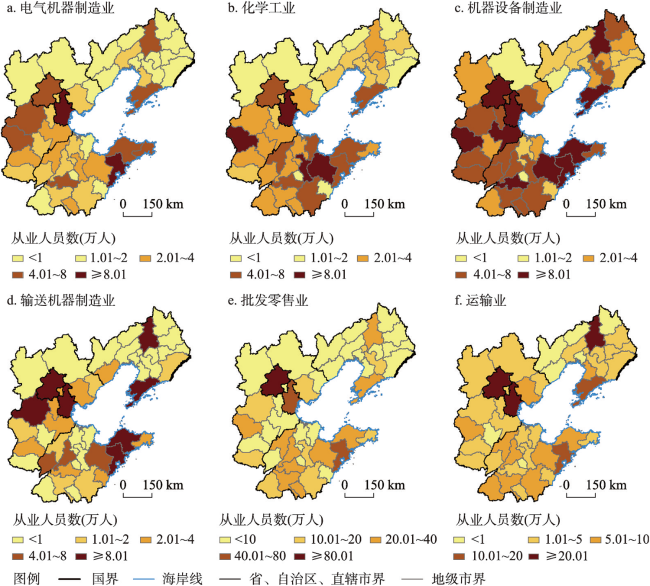
图8 2013年环渤海地区部分行业专用劳动力规模的空间分布Fig. 8 Spatial distribution of dedicated labor force in specific industries in Bohai Sea Rim region in 2013 |
表4 2013年环渤海地区专用劳动力的分布特征Tab. 4 Distribution characteristics of the dedicated labor force in Bohai Sea Rim region in 2013 |
| 地区 | 样本(家) | 全距 | 最小值 | 最大值 | 平均值 | 标准差 |
|---|---|---|---|---|---|---|
| 京津冀 | 353 | 8.03 | 6.18 | 14.21 | 12.30 | 1.34 |
| 山东 | 138 | 5.05 | 8.21 | 13.26 | 11.58 | 1.25 |
| 辽宁 | 190 | 5.56 | 7.70 | 13.26 | 11.50 | 1.22 |
表5 变量定义及描述Tab. 5 Definition and description of variables |
| 变量 | 变量定义 | 符号预期 | |||
|---|---|---|---|---|---|
| 因变量 | 日企员工规模 | 日企从业人员数(取对数) | |||
| 自变量 | 劳动力变量 | 劳动力供给规模 | 区县劳动力能力人口数量(取对数) | - | |
| 专用劳动力规模 | 城市拥有日企行业的从业人员数 (取对数) | + | |||
| 通用劳动力规模 | 区县外来人口(取对数) | - | |||
| 控制变量 | 企业变量 | 母公司属性 | 母公司是否上市 | 上市=1, 非上市=0 | - |
| 是否本地首次投资 | 首次投资=1, 非首次投资=0 | - | |||
| 子公司属性 | 企业年龄 | 截至2016年的存续年数 | + | ||
| 是否独资进入 | 独资=1, 合资=0 | +/- | |||
| 是否服务业 | 服务业=1, 制造业=0 | - | |||
| 城市变量 | 市场结构 | 本地市场面向 | 城市社会消费零售额(取对数) | +/- | |
| 国外市场面向 | 区县出口额(取对数) | +/- | |||
| 空间集聚 | 本地企业集聚 | 区县规模以上企业数(取对数) | +/- | ||
| 日企尾随集聚 | 区县日企累计数量 | +/- | |||
| 文化因素 | 日语劳动力供给 | 城市开设日语专业高等院校数量 | + | ||
| 区位因素 | 开发区数量 | 区县拥有省级及以上开发区数量 | + | ||
| 是否中心城区 | 中心城区=1, 非中心城区=0 | - | |||
注:各区县日企累计数量来源于总览,根据各日企进入年份统计;日语专业高等院校数据为研究者搜集,截止年份为2016年;其余地域属性数据均使用2016年。 |
表6 环渤海地区日企规模回归方程检验及变量显著性Tab. 6 Regression analysis of the scale of Japanese multinational enterprises in Bohai Sea Rim region and the significance of variables |
| 变量 | 模型1 | 模型2 | 模型3 | 模型4 | 模型52001年前 | 模型6 2001年后 | 模型7 2001年前 | 模型8 2001年后 | 模型9 2001年前 | 模型10 2001年后 | 模型11 2001年前 | 模型12 2001年后 | ||||||||||||||
|---|---|---|---|---|---|---|---|---|---|---|---|---|---|---|---|---|---|---|---|---|---|---|---|---|---|---|
| 自变量 | 劳动力规模 | -0.205*** (-2.546) | -0.229* (-1.887) | -0.233*** (-2.677) | ||||||||||||||||||||||
| 通用劳动力 | -0.224*** (-3.554) | -0.211*** (-3.347) | -0.077 (-0.603) | -0.309*** (-3.818) | -0.054 (-0.428) | -0.301*** (-3.706) | ||||||||||||||||||||
| 专用劳动力 | 0.107*** (2.502) | 0.094** (2.204) | 0.151** (2.004) | 0.086 (1.438) | 0.148* (1.953) | 0.066 (1.128) | ||||||||||||||||||||
| 企业属性 | 母公司是否上市 | 0.038 1.164) | 0.039 (1.217) | 0.033 (1.01) | 0.041 (1.274) | 0.057 (0.896) | 0.035 (0.824) | 0.052 (0.81) | 0.037 (0.888) | 0.057 (1.308) | 0.026 (0.618) | 0.059 (0.930) | 0.037 (0.901) | |||||||||||||
| 母公司是否地区首次投资 | -0.086*** (-2.663) | -0.085*** (-2.642) | -0.076** (-2.341) | -0.080** (-2.471) | -0.118* (-1.788) | -0.073* (-1.746) | -0.110* (-1.654) | -0.069* (-1.656) | -0.101 (-1.541) | -0.064 (-1.502) | -0.105 (-1.583) | -0.064 (-1.517) | ||||||||||||||
| 企业年龄 | 0.379*** (10.02) | 0.384*** (10.173) | 0.373*** (9.859) | 0.383*** (10.16) | 0.132* (1.839) | 0.293*** (6.530) | 0.125* (1.729) | 0.287*** (6.468) | 0.133* (1.857) | 0.280*** (6.22) | 0.135* (1.874) | 0.285*** (6.420) | ||||||||||||||
| 独资模式 | -0.135*** (-4.203) | -0.133*** (-4.136) | -0.135*** (-4.174) | -0.135*** (-4.207) | -0.121* (-1.963) | -0.150*** (-3.514) | -0.110* (-1.777) | -0.149** (-3.513) | -0.106* (-1.735) | -0.153*** (-3.560) | -0.108* (-1.756) | -0.152*** (-3.576) | ||||||||||||||
| 是否服务业 | -0.198*** (-5.83) | -0.213*** (-6.376) | -0.269*** (-6.843) | -0.258*** (-6.603) | -0.307** (-4.568) | -0.168*** (-3.780) | -0.319*** (-4.737) | -0.182** (-4.236) | -0.386*** (-5.155) | -0.235*** (-4.531) | -0.385*** (-5.136) | -0.214*** (-4.160) | ||||||||||||||
| 地域属性 | 本地市场规模 | 0.056 (0.781) | 0.061 (0.855) | -0.023 (-0.306) | 0.017 (0.233) | -0.010 (-0.070) | 0.093 (0.950) | -0.026 (-0.181) | 0.111 (1.145) | -0.091 (-0.622) | 0.017 (0.165) | -0.083 (-0.566) | 0.081 (0.799) | |||||||||||||
| 国外市场规模 | -0.045 (-0.759) | -0.048 (-0.821) | -0.115** (-2.058) | -0.055 (-0.941) | -0.034 (-0.308) | -0.037 (-0.459) | -0.081 (-0.717) | -0.031 (-0.393) | -0.122 (-1.154) | -0.120 (-1.563) | -0.106 (-0.942) | -0.035 (-0.443) | ||||||||||||||
| 本地企业集聚 | 0.204*** (2.788) | 0.140** (2.225) | 0.072 (1.197) | 0.136** (2.180) | 0.218 (1.445) | 0.217** (2.291) | 0.074 (0.572) | 0.159* (1.957) | 0.072 (0.597) | 0.071 (0.890) | 0.092 (0.711) | 0.152* (1.858) | ||||||||||||||
| 日企尾随集聚 | -0.046 (-0.974) | -0.033 (-0.688) | -0.058 (-1.223) | -0.035 (-0.725) | -0.061 (-0.689) | -0.042 (-0.644) | -0.063 (-0.696) | -0.014 (-0.214) | -0.056 (-0.631) | -0.054 (-0.818) | -0.055 (-0.618) | -0.013 (-0.202) | ||||||||||||||
| 开发区数量 | 0.152*** (3.385) | 0.159*** (3.549) | 0.137*** (3.073) | 0.157*** (3.513) | 0.175** (1.968) | 0.156*** (2.683) | 0.161* (1.794) | 0.174*** (2.992) | 0.154* (1.744) | 0.145** (2.479) | 0.160* (1.786) | 0.172 (2.964) | ||||||||||||||
| 日语劳动力 | -0.159** (-2.497) | -0.079 (-1.254) | -0.106*** (-1.703) | -0.073 (-1.158) | -0.097 (-0.758) | -0.213** (-2.462) | -0.028 (-0.219) | -0.119 (-1.407) | -0.035 (-0.277) | -0.158** (-1.859) | -0.025 (-0.195) | -0.116* (-1.363) | ||||||||||||||
| 是否为主城区 | -0.036 (-0.818) | -0.054 (-1.220) | -0.047 (-1.059) | -0.048 (-1.096) | -0.015 (-0.156) | -0.046 (-0.815) | -0.045 (-0.486) | -0.06 (-1.085) | -0.023 (-0.248) | -0.059 (-1.054) | -0.025 (-0.265) | -0.059 (-1.056) | ||||||||||||||
| N | 681 | 681 | 681 | 681 | 229 | 452 | 229 | 452 | 229 | 452 | 229 | 452 | ||||||||||||||
| 调正R2 | 0.333 | 0.335 | 0.329 | 0.339 | 0.172 | 0.252 | 0.160 | 0.264 | 0.174 | 0.243 | 0.170 | 0.265 | ||||||||||||||
| F | 27.067 | 27.370 | 26.633 | 25.909 | 4.639 | 12.690 | 4.329 | 13.462 | 4.683 | 12.158 | 4.345 | 12.599 | ||||||||||||||
| Sig. | 0.000 | 0.000 | 0.000 | 0.000 | 0.000 | 0.000 | 0.000 | 0.000 | 0.000 | 0.000 | 0.000 | 0.000 | ||||||||||||||
| 变量 | 模型13 京津冀 | 模型14 山东 | 模型15 辽宁 | 模型16 京津冀 | 模型17 山东 | 模型18 辽宁 | 模型19 京津冀 | 模型20 山东 | 模型21 辽宁 | 模型22 京津冀 | 模型23 山东 | 模型24 辽宁 | ||||||||||||||
| 自变量 | 劳动力规模 | -0.538*** (-4.839) | 0.065 (0.594) | 0.145 (1.137) | ||||||||||||||||||||||
| 通用劳动力 | -0.521*** (-4.162) | -0.026 (0.252) | 0.016 (0.128) | -0.491*** (-3.914) | -0.029 (-0.284) | 0.015 (0.119) | ||||||||||||||||||||
| 专用劳动力 | 0.178** (2.544) | 0.065 (0.643) | -0.009 (-0.139) | 0.148** (2.135) | 0.066 (0.654) | -0.008 (-0.131) | ||||||||||||||||||||
| 企业属性 | 母公司是否上市 | 0.071 (1.599) | 0.018 (0.235) | 0.005 (0.083) | 0.060 (1.308) | 0.025 (0.322) | 0.010 (0.163) | 0.072 (1.598) | 0.021 (0.275) | 0.009 (0.145) | 0.076* (1.687) | 0.024 (0.312) | 0.010 (0.148) | |||||||||||||
| 母公司是否地区首次投资 | -0.070 (-1.591) | -0.067 (-0.892) | -0.124* (-1.941) | -0.053 (-1.154) | -0.069 (-0.920) | -0.119* (-1.846) | -0.063 (-1.417) | -0.070 (-0.929) | -0.119* (-1.846) | -0.052 (-1.155) | -0.070 (-0.931) | -0.119* (-1.845) | ||||||||||||||
| 企业年龄 | 0.402*** (7.004) | 0.397*** (4.043) | 0.343*** (3.875) | -0.359*** (6.200) | 0.382*** (3.842) | 0.329*** (3.732) | 0.409*** (6.983) | 0.402*** (3.864) | 0.329*** (3.736) | 0.411*** (7.054) | 0.392*** (3.714) | 0.329*** (3.721) | ||||||||||||||
| 独资模式 | -0.149*** (-3.295) | -0.135** (-4.207) | -0.043 (-0.705) | -0.151*** (-3.246) | -0.177** (-2.254) | -0.050 (-0.814) | -0.147*** (-3.220) | -0.170** (-2.179) | -0.049 (-0.796) | -0.146*** (-3.211) | -0.176** (-2.238) | -0.049 (-0.797) | ||||||||||||||
| 是否服务业 | -0.100** (-2.128) | -0.192** (-2.213) | -0.378*** (-6.059) | -0.240*** (-3.720) | -0.215** (-2.176) | -0.359*** (-5.627) | -0.124*** (-2.628) | -0.187** (-2.149) | -0.363*** (-5.785) | -0.215*** (-3.391) | -0.220** (-2.184) | -0.361*** (-5.456) | ||||||||||||||
| 地域属性 | 本地市场规模 | -0.235 (-1.023) | -0.238 (1.373) | -0.016 (-0.206) | -0.012 (-0.051) | 0.206 (1.130) | -0.029 (-0.366) | -0.201 (-0.867) | 0.231 (1.291) | -0.033 (-0.413) | -0.219 (-0.949) | 0.193 (1.021) | -0.032 (-0.384) | |||||||||||||
| 国外市场规模 | 0.199 (1.590) | -0.120 (-1.159) | -0.053 (-0.345) | -0.083 (-0.733) | -0.112 (-1.111) | -0.098 (-0.657) | 0.210 (1.590) | -0.101 (-0.996) | -0.100 (-0.667) | 0.197 (1.495) | -0.108 (-1.052) | -0.099 (-0.658) | ||||||||||||||
| 本地企业集聚 | 0.295** (2.564) | 0.218* (1.565) | -0.003 (-0.011) | -0.032 (-0.329) | 0.247* (1.898) | 0.149 (0.578) | 0.084 (0.853) | 0.244* (1.860) | 0.139 (0.497) | 0.076 (0.780) | 0.242* (1.844) | 0.136 (0.479) | ||||||||||||||
| 日企尾随集聚 | -0.004 (-0.058) | -0.062 (-0.578) | -0.071 (-0.591) | -0.080 (-1.066) | -0.073 (-0.679) | -0.086 (-0.72) | 0.003 (0.043) | -0.055 (-0.451) | -0.086 (-0.716) | -0.007 (-0.097) | -0.057 (-0.473) | -0.087 (-0.721) | ||||||||||||||
| 开发区数量 | 0.104 (1.406) | 0.049 (0.490) | 0.107 (0.534) | 0.101 (1.330) | 0.056 (0.578) | 0.130 (0.646) | 0.094 (3.513) | 0.067 (0.650) | 0.129 (0.641) | 0.087 (1.167) | 0.066 (0.637) | 0.157 (3.513) | ||||||||||||||
| 日语劳动力 | 0.048 (0.230) | -0.221 (-1.306) | -0.022 (-0.167) | -0.108 (-0.504) | -0.169 (-1.007) | 0.021 (0.169) | 0.184 (0.838) | -0.184 (-1.099) | 0.017 (0.132) | 0.150 (0.687) | -0.157 (-0.908) | 0.017 (0.130) | ||||||||||||||
| 是否为主城区 | -0.027 (-0.424) | 0.035 (0.250) | -0.017 (-0.102) | -0.090 (-1.407) | 0.078 (0.592) | 0.002 (0.014) | -0.139** (-2.173) | 0.069 (0.527) | 0.003 (0.016) | -0.137** (-2.145) | 0.083 (0.621) | 0.000 (0.002) | ||||||||||||||
| N | 353 | 138 | 190 | 353 | 138 | 190 | 353 | 138 | 190 | 353 | 138 | 190 | ||||||||||||||
| 调正R2 | 0.354 | 0.292 | 0.349 | 0.322 | 0.293 | 0.344 | 0.343 | 0.291 | 0.344 | 0.349 | 0.287 | 0.340 | ||||||||||||||
| F | 15.814 | 5.353 | 8.785 | 13.855 | 5.359 | 8.625 | 15.110 | 5.317 | 8.624 | 14.503 | 4.945 | 7.965 | ||||||||||||||
| Sig. | 0.000 | 0.000 | 0.000 | 0.000 | 0.000 | 0.000 | 0.000 | 0.000 | 0.000 | 0.000 | 0.000 | 0.000 | ||||||||||||||
注:单元格内数值为对应解释变量的参数估计值;*、**、***分别表示在10%、5%、1%水平上显著;括号内的数值为t检验值。 |
| [1] |
[李洪亚, 史学贵, 张银杰. 融资约束与中国企业规模分布研究: 基于中国制造业上市公司数据的分析. 当代经济科学, 2014, 36(2): 95-109, 127-128.]
|
| [2] |
[石建中. 中国企业规模分布的形态及特征分析. 华东经济管理, 2010, 24(12): 51-55.]
|
| [3] |
[罗长远, 司春晓. 外商撤资的影响因素: 基于中国工业企业数据的研究. 世界经济, 2020, 43(8): 26-53.]
|
| [4] |
|
| [5] |
|
| [6] |
|
| [7] |
|
| [8] |
|
| [9] |
|
| [10] |
|
| [11] |
|
| [12] |
|
| [13] |
[刘晓宁. 企业对外直接投资区位选择: 东道国因素与企业异质性因素的共同考察. 经济经纬, 2018, 35(3): 59-66.]
|
| [14] |
|
| [15] |
|
| [16] |
|
| [17] |
|
| [18] |
|
| [19] |
|
| [20] |
|
| [21] |
|
| [22] |
|
| [23] |
|
| [24] |
|
| [25] |
|
| [26] |
[方明月, 聂辉华. 中国工业企业规模分布的特征事实: 齐夫定律的视角. 产业经济评论, 2010, 9(2): 1-17.]
|
| [27] |
[杨其静, 李小斌, 方明月. 市场、政府与企业规模分布: 一个经验研究. 世界经济文汇, 2010(1): 1-15.]
|
| [28] |
|
| [29] |
|
| [30] |
|
| [31] |
[王永进, 盛丹, 李坤望. 中国企业成长中的规模分布: 基于大企业的研究. 中国社会科学, 2017(3): 27- 48, 204-205.]
|
| [32] |
[章韬, 孙楚仁. 贸易开放、生产率形态与企业规模. 世界经济, 2012, 35(8): 40-67.]
|
| [33] |
[盛斌, 毛其淋. 贸易自由化、企业成长和规模分布. 世界经济, 2015, 38(2): 3-30.]
|
| [34] |
[史修松, 刘军. 大企业规模、空间分布与区域经济增长: 基于中国企业500强的研究. 上海经济研究, 2014, 26(9): 88-99.]
|
| [35] |
[张廷龙, 孙慧. 工业企业规模、分布与区域经济增长. 新疆大学学报(自然科学版), 2016, 33(1): 25-32.]
|
| [36] |
[魏良益. 我国企业规模与制约因素分析: 基于中国上市公司的实证[D]. 成都: 西南交通大学, 2006.]
|
| [37] |
|
| [38] |
[邵传林, 裴志强. 制度环境对企业规模非线性影响效应的测度: 来自中国工业企业的证据. 产经评论, 2015, 6(1): 34-47.]
|
| [39] |
|
| [40] |
|
| [41] |
[陈平, 欧燕. 我国劳动力成本上升对FDI地区转移的影响: 来自工业企业数据和FDI空间效应的证据. 中山大学学报(社会科学版), 2011, 51(2): 185-191.]
|
| [42] |
[冯伟, 邵军, 徐康宁. 市场规模、劳动力成本与外商直接投资: 基于我国1990—2009年省级面板数据的研究. 南开经济研究, 2011(6): 3-20.]
|
| [43] |
[宋维佳. 工资水平与外商直接投资区位变动研究. 财经问题研究, 2013(10): 48-54.]
|
| [44] |
[蔡佳林. 劳动力成本、市场规模与FDI吸引力研究: 基于中国省级空间面板数据. 现代商贸工业, 2015, 36(1): 104-107.]
|
| [45] |
[褚智. 外商直接投资区位选择影响因素的实证分析. 生产力研究, 2016(10): 21-23.]
|
| [46] |
|
| [47] |
[韦燕生, 敖荣军. 外商直接投资区位选择的劳动力质量因素研究. 地理与地理信息科学, 2008, 24(5): 57-60, 83.]
|
| [48] |
[李红岩. 人力资本视角下的外商对华投资问题研究[D]. 济南: 山东师范大学, 2014. ]
|
| [49] |
|
| [50] |
|
| [51] |
|
| [52] |
|
| [53] |
|
| [54] |
[何玉梅, 刘修岩, 李锐. 基于连续距离的制造业空间集聚演变及其驱动因素研究. 财经研究, 2012, 38(10): 36-46.]
|
| [55] |
[宋子睿. 湖北省县域产业集聚的影响因素及区域效应研究[D]. 武汉: 华中师范大学, 2016.]
|
| [56] |
[千慧雄, 刘晓燕. 农民工集聚的劳动力池效应研究. 经济经纬, 2011, 28(1): 115-119.]
|
| [57] |
[张慧慧, 徐力恒. 高技能劳动力对服务业企业增加值的影响: 基于技能偏向型生产函数的异质性分析. 技术经济. 2021, 40(8): 63-75.]
|
| [58] |
[梁文泉, 陆铭. 城市人力资本的分化: 探索不同技能劳动者的互补和空间集聚. 经济社会体制比较, 2015(3): 185-197.]
|
| [59] |
[刘晨阳, 曹以伦. 外资企业技术授权与劳动力技能结构升级: 来自世界银行中国企业调查数据的经验证据. 经济与管理研究. 2021, 42(11): 74-92.]
|
| [60] |
[胡兆量, 王恩涌, 韩茂莉. 中国人才地理特征. 经济地理, 1998, 18(1): 8-14.]
|
| [61] |
[刘晔, 王若宇, 薛德升, 等. 中国高技能劳动力与一般劳动力的空间分布格局及其影响因素. 地理研究, 2019, 38(8): 1949-1964.]
|
| [62] |
[罗守贵, 王爱民, 高汝熹. 高级人才空间流动因素分析及建立反区域筛选机制的意义. 地理科学, 2009, 29(6): 779-786.]
|
| [63] |
|
| [64] |
|
| [65] |
|
| [66] |
[柴生田晴四. 海外进出企业总览(国别编). 东京: 东洋经济新报社, 2019.]
|
| [67] |
|
| [68] |
|
| [69] |
|
| [70] |
|
| [71] |
|
| [72] |
|
| [73] |
[王茂军, 马慧汶, 邵静, 等. 空间集聚对在京日企就业规模的影响研究. 地理研究, 2022, 41(7): 1845-1863.]
|
| [74] |
[黄泰岩, 王检贵. 企业规模是如何决定的. 中国经济问题, 2000(4): 12-19.]
|
| [75] |
[聂辉华, 李文彬. 什么决定了企业的最佳规模? 关于企业规模的研究述评. 河南社会科学, 2006, 14(4): 31-34.]
|
| [76] |
[刘玉潇, 王茂军. 中国城市日企的同业与同源效应: 以京、沪、广、深为例. 地理科学进展, 2020, 39(11): 1845-1859.]
|
| [77] |
|
| [78] |
[周军, 隋吉原. 论在华日资企业发展变化对从业者日语能力的影响. 江苏技术师范学院学报, 2012, 18(1): 34-36.]
|
/
| 〈 |
|
〉 |
