
区域双核结构对省域经济发展的影响研究——基于空间杜宾模型的实证分析
|
戴宏伟(1967-), 男, 河北定州人, 博士, 教授, 博士生导师, 研究方向为城市创新与区域发展。E-mail: daihw@163.com |
收稿日期: 2022-08-22
修回日期: 2023-04-13
网络出版日期: 2023-10-18
基金资助
北京市社会科学基金重大项目(20ZDA31)
The influence of regional dual-nuclei structure on provincial economic development in China:An empirical study based on spatial Dubin model
Received date: 2022-08-22
Revised date: 2023-04-13
Online published: 2023-10-18
Supported by
Major Project of Beijing Social Science Foundation(20ZDA31)
目前从全国层面对区域双核结构的实证分析还较为鲜见,如何界定双核结构特征的省份并分析其影响,也需要进一步实证探讨。本文基于2009—2019年中国259个地级市数据,采用空间杜宾模型分析了中国区域双核结构的分布特征及其对省域经济发展的影响。实证结果表明:中国11个省域呈现双核结构特征;区域双核结构对于所在省域经济发展具有显著的促进作用,但南北地区表现出较大差异;区域双核结构对于省域产业集聚具有促进作用,且有助于促进当地科技创新水平的提高。总体来看,与部分省会城市规模不大、辐射带动力不强的单核结构省份相比,区域双核结构可以凭借中心城市数量及空间分布等优势在一定程度上弥补这些短板,相对来说更有助于带动当地经济发展及科技创新。
戴宏伟 , 胡喜飞 . 区域双核结构对省域经济发展的影响研究——基于空间杜宾模型的实证分析[J]. 地理学报, 2023 , 78(10) : 2375 -2391 . DOI: 10.11821/dlxb202310001
At present, the empirical analysis of regional dual-nuclei structures at the national level is still relatively rare. How to define the provinces with the characteristics of dual-nuclei structures and analyze their impact needs further empirical discussion. In this paper, the spatial Dubin model and the data of 259 prefecture-level cities are used to analyze the distribution characteristics of regional dual-nuclei structure in China and its influence on provincial development. The empirical results show that 11 provincial-level regions (hereafter provinces) in China show the characteristics of dual-nuclei structure. The regional dual-nuclei structure plays a significant role in promoting the economic development of the province, but the northern and southern regions show great differences. The regional dual-nuclei structure has a promoting effect on provincial industrial agglomeration and helps to promote the improvement of local scientific and technological innovation. In general, compared with some single-core provinces with small scale and weak radiation driving force in some provincial capitals, the regional dual-nuclei structure can make up for these shortcomings to a certain extent by virtue of the number of central cities and spatial distribution, which is more conducive to driving local economic development and scientific and technological innovation.
表1 中心性和门户性指标体系Tab. 1 Centralized and portal indicator system |
| 系统层 | 子系统层 | 指标层 |
|---|---|---|
| 中心性 | 中心规模(0.2) | 地区生产总值(亿元)(0.5)、年末总人口(万人)(0.5) |
| 中心经济发展水平(0.3) | 二产产值(亿元)(0.3)、三产产值(亿元)(0.32)、固定资产投资(亿元)(0.22)、职工平均工资(万元/人)(0.16) | |
| 中心社会发展水平(0.2) | 地方一般公共预算支出(亿元)(0.52)、社会消费品零售总额(亿元)(0.48) | |
| 中心交通通达水平(0.15) | 区内可达性(h)(1) | |
| 中心行政等级(0.15) | 省、市政府驻地(1) | |
| 门户性 | 门户规模(0.2) | 地区生产总值(亿元)(0.5)、城市常住人口(万人)(0.5) |
| 门户设施水平(0.3) | 口岸等级(0.4)、货运总量(万t)(0.17)、机场等级(0.28)、火车站等级(0.15) | |
| 门户便捷性(0.25) | 区域可达性(1) | |
| 门户对外依存度(0.25) | 进出口总额/GDP总额(%)(0.6)、实际利用外资/固定资产投资(%)(0.4) |
表2 中国各省份地级市中心性和门户性指标数据Tab. 2 Prefecture-level urban center and portal indicator data in the provincial-level regions of China |
| 省份 | 城市 | 2001年 | 2006年 | 2009年 | 2014年 | 2019年 | |||||||||
|---|---|---|---|---|---|---|---|---|---|---|---|---|---|---|---|
| 中心性 | 门户性 | 中心性 | 门户性 | 中心性 | 门户性 | 中心性 | 门户性 | 中心性 | 门户性 | ||||||
| 广东 | 广州 | 0.9469 | 0.6198 | 0.7875 | 0.6884 | 0.7820 | 0.6553 | 0.7627 | 0.6774 | 0.6917 | 0.7361 | ||||
| 深圳 | 0.7587 | 0.5320 | 0.7301 | 0.7453 | 0.7065 | 0.6612 | 0.7000 | 0.7541 | 0.7480 | 0.7782 | |||||
| 四川 | 成都 | 0.6341 | 0.5213 | 0.5470 | 0.5360 | 0.5827 | 0.5330 | 0.5834 | 0.5674 | 0.6142 | 0.6541 | ||||
| 重庆 | 0.6860 | 0.6161 | 0.6744 | 0.6153 | 0.7365 | 0.6473 | 0.7746 | 0.6919 | 0.8040 | 0.7542 | |||||
| 江苏 | 南京 | 0.5155 | 0.5412 | 0.4967 | 0.5900 | 0.5072 | 0.5662 | 0.4855 | 0.5775 | 0.4948 | 0.5970 | ||||
| 苏州 | 0.5581 | 0.3567 | 0.6127 | 0.5074 | 0.6286 | 0.4334 | 0.5825 | 0.4498 | 0.5636 | 0.4755 | |||||
| 浙江 | 杭州 | 0.5473 | 0.5308 | 0.5117 | 0.6011 | 0.5174 | 0.5817 | 0.4819 | 0.5844 | 0.4964 | 0.6177 | ||||
| 宁波 | 0.5048 | 0.4462 | 0.4726 | 0.5248 | 0.4705 | 0.4843 | 0.4313 | 0.5229 | 0.4322 | 0.5212 | |||||
| 山东 | 济南 | 0.5063 | 0.5157 | 0.4427 | 0.5217 | 0.4567 | 0.5161 | 0.4187 | 0.5089 | 0.4395 | 0.5434 | ||||
| 青岛 | 0.4772 | 0.5271 | 0.4822 | 0.5972 | 0.4883 | 0.4970 | 0.4681 | 0.5299 | 0.4465 | 0.5404 | |||||
| 湖北 | 武汉 | 0.5553 | 0.5748 | 0.4899 | 0.6069 | 0.5280 | 0.6000 | 0.5468 | 0.6117 | 0.5507 | 0.6884 | ||||
| 襄阳 | 0.3005 | 0.3289 | 0.2551 | 0.3315 | 0.2735 | 0.3330 | 0.2985 | 0.3404 | 0.2967 | 0.3550 | |||||
| 辽宁 | 沈阳 | 0.5087 | 0.4465 | 0.4800 | 0.4690 | 0.5077 | 0.4644 | 0.4533 | 0.4270 | 0.3555 | 0.4873 | ||||
| 大连 | 0.4957 | 0.4696 | 0.4534 | 0.5057 | 0.4842 | 0.4946 | 0.4465 | 0.5202 | 0.3493 | 0.4741 | |||||
| 湖南 | 长沙 | 0.4307 | 0.4986 | 0.4112 | 0.5338 | 0.4629 | 0.5394 | 0.4696 | 0.5865 | 0.4608 | 0.5905 | ||||
| 岳阳 | 0.3296 | 0.4005 | 0.2762 | 0.4030 | 0.2940 | 0.4170 | 0.2929 | 0.4095 | 0.2911 | 0.4472 | |||||
| 黑龙江 | 哈尔滨 | 0.4231 | 0.3706 | 0.3811 | 0.3700 | 0.3947 | 0.3621 | 0.3650 | 0.3696 | 0.3231 | 0.3388 | ||||
| 大庆 | 0.3650 | 0.1555 | 0.2851 | 0.1445 | 0.3038 | 0.1773 | 0.2709 | 0.1986 | 0.2163 | 0.1746 | |||||
| 河北 | 石家庄 | 0.4306 | 0.5018 | 0.3849 | 0.5023 | 0.3987 | 0.4903 | 0.3763 | 0.5008 | 0.3427 | 0.5279 | ||||
| 唐山 | 0.3676 | 0.3827 | 0.3682 | 0.3901 | 0.4028 | 0.3857 | 0.3628 | 0.4247 | 0.3231 | 0.4242 | |||||
| 河南 | 郑州 | 0.4974 | 0.5287 | 0.4549 | 0.5488 | 0.4793 | 0.5589 | 0.4942 | 0.5971 | 0.5085 | 0.6236 | ||||
| 洛阳 | 0.3431 | 0.4365 | 0.3316 | 0.4514 | 0.3448 | 0.4629 | 0.3221 | 0.4655 | 0.3262 | 0.4866 | |||||
| 陕西 | 西安 | 0.4262 | 0.4762 | 0.3821 | 0.5036 | 0.4249 | 0.5053 | 0.4187 | 0.5292 | 0.4294 | 0.5878 | ||||
| 咸阳 | 0.2886 | 0.3004 | 0.2513 | 0.3017 | 0.2721 | 0.3011 | 0.2725 | 0.3065 | 0.2550 | 0.3049 | |||||
| 吉林 | 长春 | 0.3879 | 0.3966 | 0.3524 | 0.4164 | 0.3784 | 0.3743 | 0.3542 | 0.4198 | 0.3159 | 0.3684 | ||||
| 吉林 | 0.2839 | 0.1277 | 0.2607 | 0.1307 | 0.2901 | 0.1288 | 0.2575 | 0.1323 | 0.2155 | 0.1283 | |||||
| 福建 | 福州 | 0.4297 | 0.4683 | 0.3560 | 0.4800 | 0.3763 | 0.4506 | 0.3777 | 0.4668 | 0.3883 | 0.4566 | ||||
| 厦门 | 0.3767 | 0.4190 | 0.3204 | 0.5229 | 0.3309 | 0.4878 | 0.3066 | 0.5673 | 0.3192 | 0.5072 | |||||
| 云南 | 昆明 | 0.3499 | 0.3184 | 0.3039 | 0.3286 | 0.3226 | 0.3231 | 0.3082 | 0.4394 | 0.3133 | 0.4216 | ||||
| 曲靖 | 0.2595 | 0.1713 | 0.2378 | 0.1818 | 0.2549 | 0.1755 | 0.2372 | 0.1715 | 0.2437 | 0.1825 | |||||
| 安徽 | 合肥 | 0.3854 | 0.3996 | 0.3532 | 0.4374 | 0.4016 | 0.4216 | 0.4122 | 0.5296 | 0.4374 | 0.5577 | ||||
| 芜湖 | 0.3660 | 0.3861 | 0.2976 | 0.4310 | 0.3270 | 0.4164 | 0.3311 | 0.4431 | 0.3315 | 0.4528 | |||||
| 江西 | 南昌 | 0.3294 | 0.4700 | 0.3126 | 0.5132 | 0.3325 | 0.4988 | 0.3379 | 0.5076 | 0.3282 | 0.5208 | ||||
| 九江 | 0.2827 | 0.4224 | 0.2508 | 0.4561 | 0.2642 | 0.4480 | 0.2717 | 0.4628 | 0.2739 | 0.4841 | |||||
| 山西 | 太原 | 0.3446 | 0.4566 | 0.3173 | 0.5062 | 0.3306 | 0.4565 | 0.3005 | 0.4770 | 0.2961 | 0.4465 | ||||
| 长治 | 0.3034 | 0.2838 | 0.2654 | 0.2904 | 0.2821 | 0.2870 | 0.2631 | 0.2883 | 0.2519 | 0.3135 | |||||
| 广西 | 南宁 | 0.3916 | 0.3970 | 0.3148 | 0.4263 | 0.3430 | 0.4303 | 0.3353 | 0.4370 | 0.3282 | 0.4466 | ||||
| 桂林 | 0.3061 | 0.4233 | 0.2611 | 0.4241 | 0.2794 | 0.4258 | 0.2674 | 0.4224 | 0.2559 | 0.4186 | |||||
| 内蒙古 | 呼和浩特 | 0.2373 | 0.3743 | 0.2551 | 0.4114 | 0.2812 | 0.4166 | 0.2500 | 0.4021 | 0.2217 | 0.3884 | ||||
| 包头 | 0.2318 | 0.3439 | 0.2654 | 0.3817 | 0.3107 | 0.3729 | 0.2736 | 0.3636 | 0.2293 | 0.3470 | |||||
| 贵州 | 贵阳 | 0.2654 | 0.4018 | 0.2417 | 0.4076 | 0.2556 | 0.4042 | 0.2562 | 0.4338 | 0.2624 | 0.4642 | ||||
| 遵义 | 0.2486 | 0.2067 | 0.2302 | 0.2043 | 0.2501 | 0.2073 | 0.2460 | 0.2194 | 0.2568 | 0.2976 | |||||
| 甘肃 | 兰州 | 0.2982 | 0.3653 | 0.2519 | 0.3716 | 0.2638 | 0.3625 | 0.2524 | 0.3752 | 0.2478 | 0.3671 | ||||
| 天水 | 0.2406 | 0.2027 | 0.2093 | 0.1981 | 0.2210 | 0.2156 | 0.2097 | 0.2166 | 0.2074 | 0.2162 | |||||
| 新疆 | 乌鲁木齐 | 0.2357 | 0.2595 | 0.2142 | 0.2776 | 0.2444 | 0.2703 | 0.2323 | 0.2766 | 0.2227 | 0.2703 | ||||
| 克拉玛依 | 0.2088 | 0.0071 | 0.1883 | 0.0594 | 0.2002 | 0.0839 | 0.1726 | 0.0862 | 0.1677 | 0.0827 | |||||
| 宁夏 | 银川 | 0.2527 | 0.2208 | 0.2271 | 0.2368 | 0.2538 | 0.2583 | 0.2371 | 0.2771 | 0.2319 | 0.2677 | ||||
| 吴忠 | 0.2416 | 0.1558 | 0.1984 | 0.1558 | 0.2167 | 0.1516 | 0.1992 | 0.1523 | 0.1972 | 0.1519 | |||||
表3 中国各省份空间结构情况Tab. 3 Spatial structure of provincial-level regions in China |
| 类型 | 省份 |
|---|---|
| 单核结构 | 湖北 湖南 黑龙江 吉林 云南 江西 陕西 山西 贵州 甘肃 新疆 宁夏 广西 |
| 双核结构 | 广东 四川 江苏 浙江 山东 辽宁 河南 河北 福建 内蒙古 安徽 |
表4 各变量描述性统计Tab. 4 Descriptive statistics for each variable |
| 变量 | 观测量 | 平均值 | 标准差 | 最小值 | 最大值 |
|---|---|---|---|---|---|
| pgdp | 264 | 10.626 | 0.439 | 9.303 | 11.725 |
| inv | 264 | 0.836 | 0.232 | 0.279 | 1.447 |
| con | 264 | 0.37 | 0.057 | 0.239 | 0.511 |
| afc | 264 | 0.02 | 0.015 | 0 | 0.099 |
| gov | 264 | 0.237 | 0.086 | 0.096 | 0.457 |
| col | 264 | 0.018 | 0.004 | 0.008 | 0.029 |
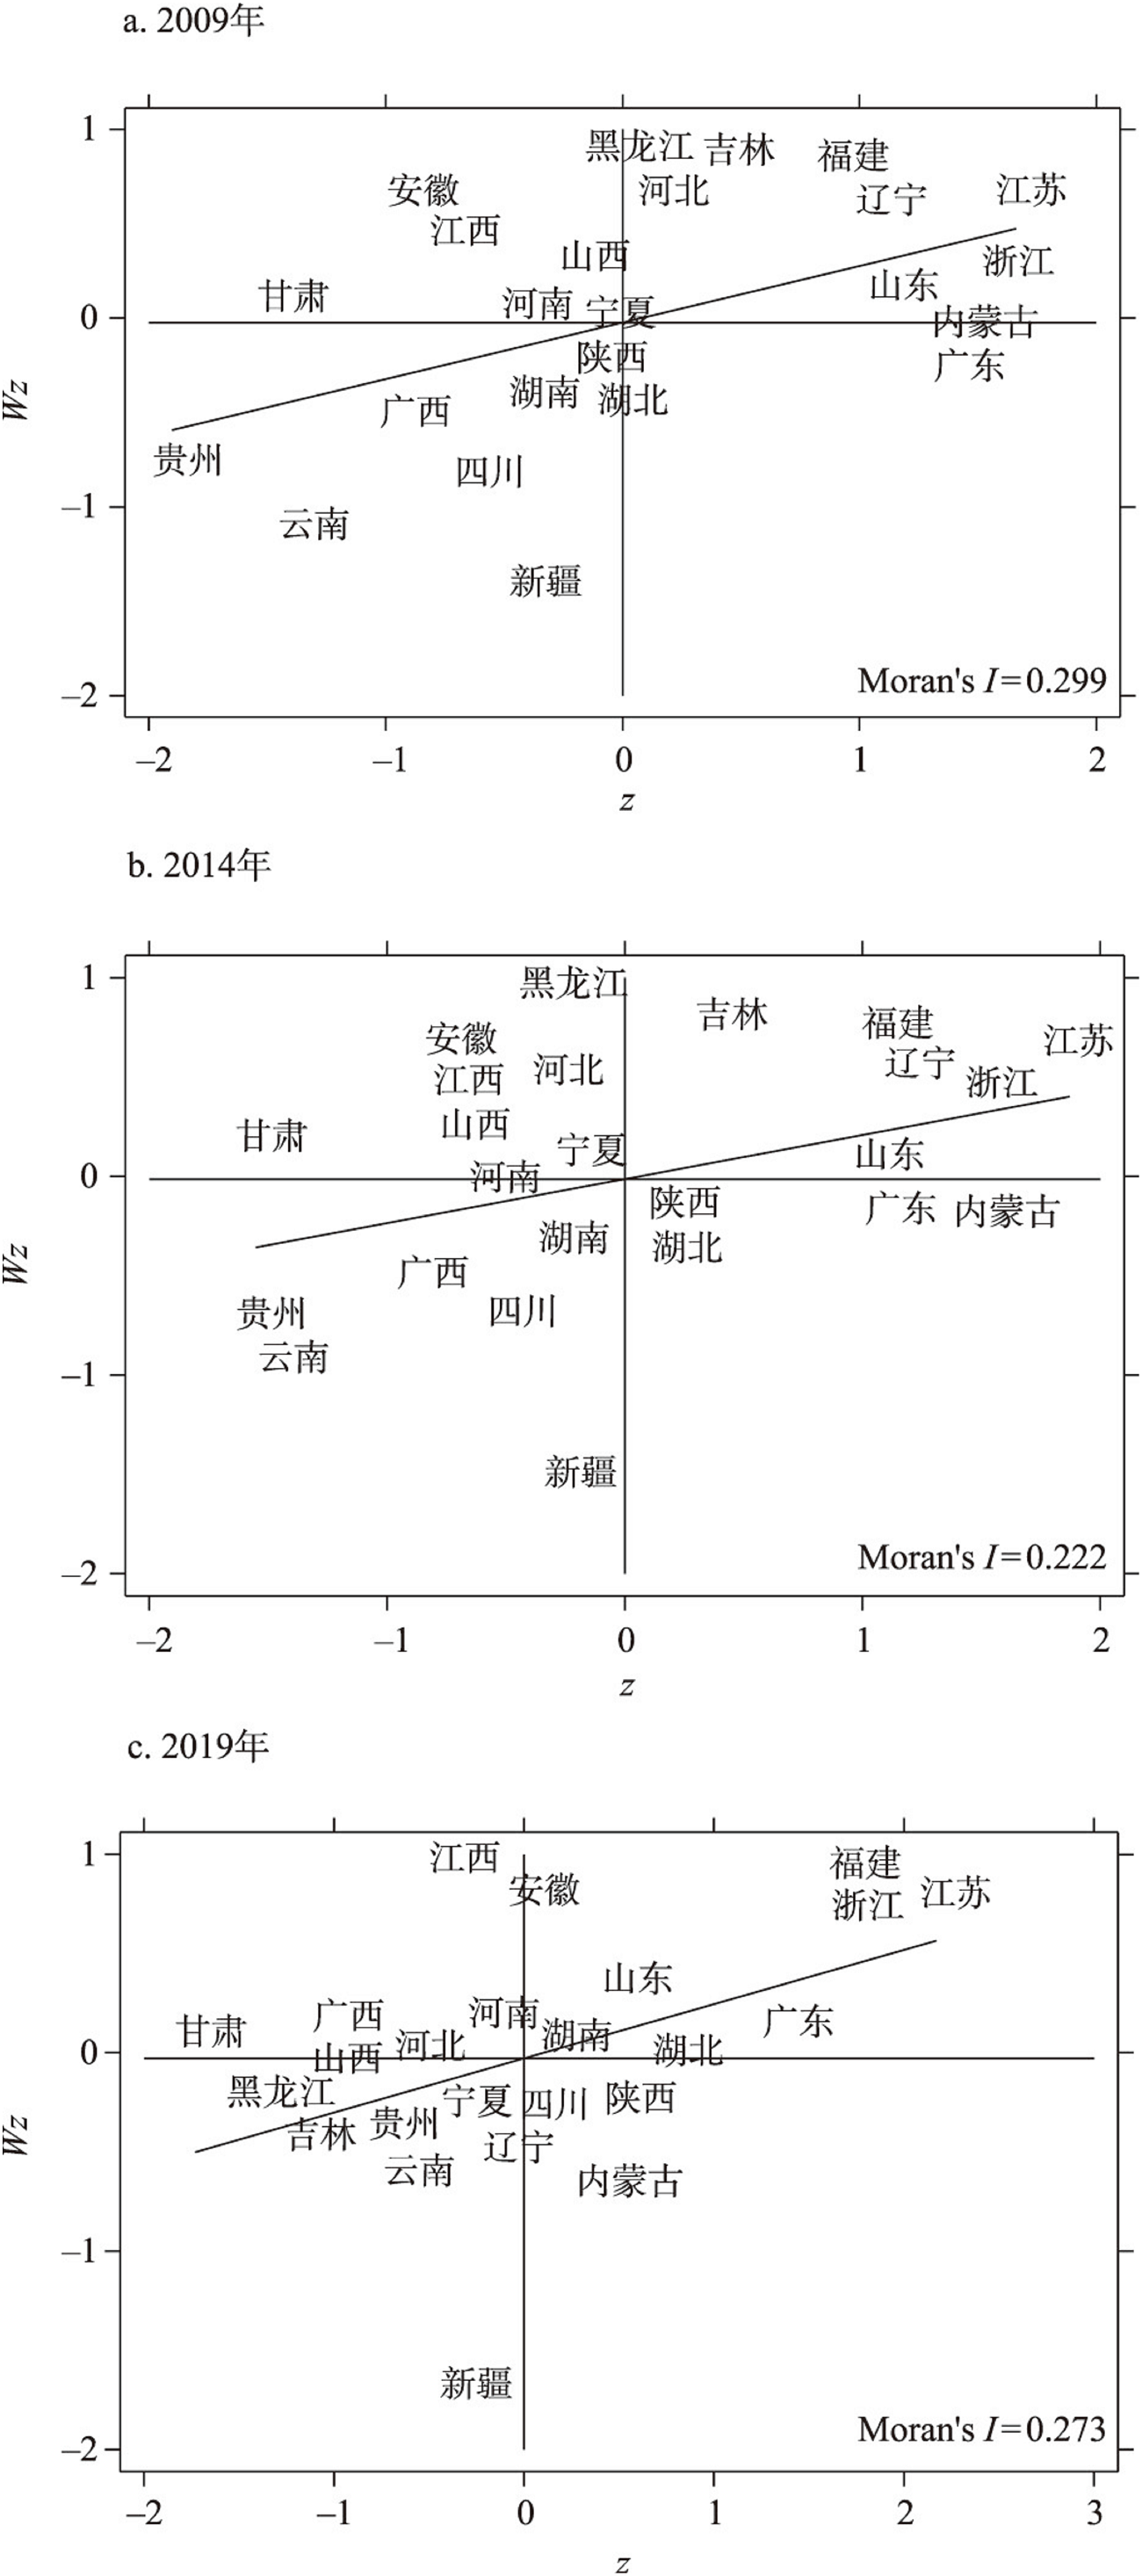
表5 中国各省份人均GDP全局Moran's I和Geary's C指数Tab. 5 Global Moran's I and Geary's C index of GDP per capita in provincial-level regions of China |
| Moran's I | 变量 | I | E(I) | sd(I) | z | P值 |
|---|---|---|---|---|---|---|
| pgdp | 0.558 | -0.004 | 0.043 | 12.937 | < 0.001 | |
| Geary's C | 变量 | c | E(c) | sd(c) | z | P值 |
| pgdp | 0.453 | 1.000 | 0.047 | -11.515 | < 0.001 |
表6 LR检验和Wald检验回归结果Tab. 6 LR test and Wald test regression results |
| 检验形式 | 检验值 | P值 |
|---|---|---|
| LR检验 | 空间自回归模型检验: 113.45 | < 0.001 |
| 空间误差模型检验: 19.49 | 0.0002 | |
| Wald检验 | 空间自回归模型检验: 139.01 | < 0.001 |
| 空间误差模型检验: 8.13 | 0.0435 |
表7 空间杜宾模型回归结果Tab. 7 Spatial Dubin model regression results |
| 变量 | (1) sdm Main | (2) Wx | (3) Spatial | (4) Variance | (5) LR_Direct | (6) LR_Indirect | (7) LR_Total |
|---|---|---|---|---|---|---|---|
| dualcore | 0.239**(0.100) | 0.397**(0.167) | 1.998**(0.927) | 2.395**(1.084) | |||
| inv | 0.205***(0.027) | -0.135***(0.034) | 0.236***(0.038) | 0.410(0.272) | 0.645**(0.301) | ||
| con | -1.153***(0.148) | 1.086***(0.232) | -1.085***(0.233) | 0.685(2.083) | -0.400(2.274) | ||
| afc | 1.398***(0.401) | 2.308***(0.687) | 11.796***(4.548) | 14.104***(5.186) | |||
| gov | -1.521***(0.199) | 1.918***(0.323) | -1.152***(0.282) | 4.795*(2.536) | 3.642(2.748) | ||
| col | 11.041***(2.404) | 18.165***(3.455) | 90.731***(20.007) | 108.896***(22.620) | |||
| rho | 0.897***(0.018) | ||||||
| 样本量 | 24 | 24 | 24 | 24 | 24 | 24 | 24 |
注:*、**、***分别表示在10%、5%、1%的水平下显著;括号内数值为标准误差。 |
表8 地理距离矩阵下Moran's I指数检验Tab. 8 Moran index test under geographic distance matrix |
| Moran's I | 变量 | I | E(I) | sd(I) | z | P值 |
|---|---|---|---|---|---|---|
| pgdp | 0.419 | -0.004 | 0.021 | 19.758 | < 0.001 | |
| Geary's C | 变量 | c | E(c) | sd(c) | z | P值 |
| pgdp | 0.575 | 1.000 | 0.024 | -17.821 | < 0.001 |
表9 地理距离矩阵的回归结果Tab. 9 Regression results with geographic distance matrix |
| 变量 | (1) sdm Main | (2) Wx | (3) Spatial | (4) Variance | (5) LR_Direct | (6) LR_Indirect | (7) LR_Total |
|---|---|---|---|---|---|---|---|
| dualcore | 0.251***(0.095) | 0.371***(0.144) | 2.803**(1.376) | 3.173**(1.505) | |||
| inv | 0.220***(0.025) | 0.321***(0.046) | 2.438***(0.847) | 2.759***(0.887) | |||
| con | -1.501***(0.163) | 0.710**(0.331) | -1.824***(0.260) | -8.155*(4.635) | -9.980**(4.845) | ||
| afc | 2.303***(0.414) | 3.389***(0.746) | 25.988**(10.466) | 29.377***(11.137) | |||
| gov | -1.896***(0.184) | 2.861***(0.653) | -1.371***(0.335) | 12.742*(6.905) | 11.372(7.190) | ||
| col | 9.054***(2.556) | 13.431***(3.758) | 101.247**(41.729) | 114.677**(44.864) | |||
| rho | 0.916***(0.020) | ||||||
| 样本量 | 24 | 24 | 24 | 24 | 24 | 24 | 24 |
注:*、**、***分别表示在10%、5%、1%的水平下显著;括号内数值为标准误差。 |
表10 更换被解释变量的回归结果Tab. 10 Regression results for the explanatory variable |
| 变量 | lngdp | lnincome | lnwage | ||||||||
|---|---|---|---|---|---|---|---|---|---|---|---|
| (1) LR_Direct | (2) LR_Indirect | (3) LR_Total | (4) LR_Direct | (5) LR_Indirect | (6) LR_Total | (7) LR_Direct | (8) LR_Indirect | (9) LR_Total | |||
| dualcore | 1.256*** (0.419) | 8.427** (3.411) | 9.683** (3.795) | 0.324*** (0.084) | 1.813*** (0.530) | 2.137*** (0.606) | 0.155** (0.064) | 0.636** (0.280) | 0.791** (0.342) | ||
| inv | 0.119*** (0.028) | 0.332 (0.257) | 0.451 (0.281) | 0.050** (0.022) | 0.509*** (0.158) | 0.559*** (0.174) | 0.075*** (0.022) | 0.309*** (0.102) | 0.384*** (0.123) | ||
| con | -1.765*** (0.179) | 2.182 (1.973) | 0.417 (2.129) | -0.085 (0.133) | -0.495 (0.772) | -0.580 (0.904) | -0.117 (0.132) | -0.496 (0.571) | -0.612 (0.702) | ||
| afc | 1.854*** (0.528) | 12.574** (5.173) | 14.428** (5.659) | -0.157 (0.393) | -0.825 (2.224) | -0.983 (2.613) | -1.344*** (0.471) | -17.423*** (4.387) | -18.767*** (4.776) | ||
| gov | -1.091*** (0.236) | -1.106 (2.812) | -2.197 (3.018) | 0.606*** (0.156) | 7.818*** (1.330) | 8.424*** (1.437) | 0.337** (0.164) | 1.368** (0.677) | 1.705** (0.835) | ||
| col | 11.973*** (2.370) | 156.116*** (24.377) | 168.089*** (25.696) | 8.950*** (2.283) | 49.363*** (11.736) | 58.313*** (13.762) | 10.589*** (2.148) | 132.125*** (11.120) | 142.714*** (11.823) | ||
| 观测量 | 264 | 264 | 264 | 264 | 264 | 264 | 264 | 264 | 264 | ||
| R2 | 0.415 | 0.415 | 0.415 | 0.526 | 0.526 | 0.526 | 0.765 | 0.765 | 0.765 | ||
| 样本量 | 24 | 24 | 24 | 24 | 24 | 24 | 24 | 24 | 24 | ||
注:*、**、***分别表示在10%、5%、1%的水平下显著;括号内数值为标准误差。 |
表11 去掉部分省份的回归结果Tab. 11 Regression results for removing some provincial-level regions |
| 变量 | (1) sdm Main | (2) Wx | (3) Spatial | (4) Variance | (5) LR_Direct | (6) LR_Indirect | (7) LR_Total |
|---|---|---|---|---|---|---|---|
| dualcore | 0.303**(0.146) | 0.555**(0.271) | 2.380*(1.265) | 2.935*(1.527) | |||
| inv | 0.303***(0.028) | -0.176***(0.034) | 0.384***(0.049) | 0.782***(0.298) | 1.166***(0.340) | ||
| con | -2.169***(0.204) | 1.839***(0.236) | -2.222***(0.293) | -0.728(1.795) | -2.950(2.024) | ||
| afc | 0.539(0.405) | 0.988(0.731) | 4.300(3.365) | 5.288(4.082) | |||
| gov | -1.047***(0.283) | 1.828***(0.419) | -0.284(0.425) | 7.385**(2.967) | 7.101**(3.304) | ||
| col | 10.463***(2.682) | 18.993***(4.499) | 80.770***(21.904) | 99.763***(25.858) | |||
| rho | 0.893***(0.018) | ||||||
| 样本量 | 18 | 18 | 18 | 18 | 18 | 18 | 18 |
注:*、**、***分别表示在10%、5%、1%的水平下显著;括号内数值为标准误差。 |
表12 南、北方两地区的回归结果Tab. 12 Regression results of the North and South China regions |
| spro | npro | ||||||
|---|---|---|---|---|---|---|---|
| 变量 | (1) LR_Direct | (2) LR_Indirect | (3) LR_Total | (4) LR_Direct | (5) LR_Indirect | (6) LR_Total | |
| dualcore | 0.683** (0.276) | 2.503** (1.112) | 3.185** (1.374) | 0.366* (0.212) | 1.059 (0.656) | 1.426* (0.859) | |
| inv | 0.508*** (0.112) | 2.733*** (0.739) | 3.241*** (0.837) | 0.238*** (0.043) | 0.375** (0.172) | 0.613*** (0.204) | |
| con | -3.052*** (0.503) | -11.339*** (3.232) | -14.391*** (3.693) | -0.849*** (0.294) | -2.505** (1.092) | -3.354** (1.363) | |
| afc | 0.497 (1.080) | 2.060 (4.287) | 2.557 (5.354) | 2.516*** (0.832) | 7.454** (3.179) | 9.971** (3.949) | |
| gov | -0.107 (0.512) | 15.326*** (3.400) | 15.218*** (3.837) | -0.688** (0.329) | 5.815*** (1.615) | 5.127*** (1.834) | |
| col | 4.972 (6.137) | 16.927 (22.435) | 21.899 (28.487) | 29.629*** (6.555) | 86.137*** (25.208) | 115.766*** (30.519) | |
| 观测量 | 132 | 132 | 132 | ||||
| R2 | 0.681 | 0.681 | 0.681 | 0.728 | 0.728 | 0.728 | |
| 样本量 | 12 | 12 | 12 | 12 | 12 | 12 | |
注:*、**、***分别表示在10%、5%、1%的水平下显著;括号内数值为标准误差。 |
表13 双核结构对产业集聚度影响的回归结果Tab. 13 Regression results of the influence of dual-nuclei structure on industrial agglomeration |
| 变量 | (1) sdm Main | (2) Wx | (3) Spatial | (4) Variance | (5) LR_Direct | (6) LR_Indirect | (7) LR_Total |
|---|---|---|---|---|---|---|---|
| dualcore | 0.015(0.015) | 0.048*0.026) | 0.014(0.016) | 0.037(0.023) | 0.051**(0.020) | ||
| inv | -0.009(0.006) | -0.010(0.006) | 0.002(0.001) | -0.008(0.005) | |||
| con | -0.035(0.038) | 0.167***(0.049) | -0.040(0.037) | 0.153***(0.045) | 0.113***(0.041) | ||
| afc | 0.205**(0.104) | 0.208**(0.103) | -0.037(0.025) | 0.171**(0.087) | |||
| gov | -0.132***(0.042) | -0.134***(0.042) | 0.024*(0.013) | -0.110***(0.035) | |||
| col | -0.448(0.779) | 1.695*(1.007) | -0.488(0.824) | 1.502(0.986) | 1.014*(0.535) | ||
| rho | -0.212**(0.095) | ||||||
| 样本量 | 24 | 24 | 24 | 24 | 24 | 24 | 24 |
注:*、**、***分别表示在10%、5%、1%的水平下显著;括号内数值为标准误差。 |
表14 双核结构对科技创新水平影响的回归结果Tab. 14 Regression results of the influence of dual-nuclei structure on the level of scientific and technological innovation |
| 变量 | (1) sdm Main | (2) Wx | (3) Spatial | (4) Variance | (5) LR_Direct | (6) LR_Indirect | (7) LR_Total |
|---|---|---|---|---|---|---|---|
| dualcore | 1.216***(0.314) | 1.352***(0.353) | 1.425***(0.429) | 2.778***(0.752) | |||
| aggrd | 0.458*(0.247) | 0.493*(0.262) | 0.517*(0.283) | 1.011*(0.539) | |||
| aggrdper | 0.790***(0.214) | 0.895***(0.229) | 0.950***(0.295) | 1.845***(0.507) | |||
| inv | 0.210*(0.119) | 0.229*(0.124) | 0.238*(0.130) | 0.467*(0.251) | |||
| con | -0.485(0.701) | -0.529(0.728) | -0.570(0.787) | -1.098(1.509) | |||
| afc | 1.522(1.949) | 1.774(2.121) | 1.950(2.338) | 3.724(4.435) | |||
| gov | 2.380**(0.963) | 4.082***(1.375) | 3.390***(0.956) | 11.400***(2.221) | 14.789***(2.381) | ||
| col | 91.881***(11.563) | 100.714***(11.427) | 105.725***(15.595) | 206.439***(22.486) | |||
| rho | 0.558***(0.045) | ||||||
| 样本量 | 24 | 24 | 24 | 24 | 24 | 24 | 24 |
注:*、**、***分别表示在10%、5%、1%的水平下显著;括号内数值为标准误差。 |
| [1] |
[陆玉麒. 双核型空间结构模式的探讨. 地域研究与开发, 1998, 17(4): 45-49.]
|
| [2] |
[陈朋亲, 毛艳华, 荣健欣. 城市群“双城”联动的理论逻辑与实践策略: 以粤港澳大湾区广州、深圳为例. 城市发展研究, 2021, 28(12): 110-117.]
|
| [3] |
[陆玉麒. 双核型空间结构模式的应用前景. 地域研究与开发, 1999, 18(3): 10-13.]
|
| [4] |
[陆玉麒, 董平. 双核结构模式与河北区域发展战略探讨. 地理学与国土研究, 2000, 16(1): 14-16.]
|
| [5] |
[陆玉麒, 俞勇军. 区域双核结构模式的数学推导. 地理学报, 2003, 58(3): 406-414.]
|
| [6] |
[陆玉麒. 双核结构的形成类型. 理论导报, 2013(8): 6-7.]
|
| [7] |
[陆玉麒. 双核结构的空间耦合机理. 理论导报, 2013(8): 4-5.]
|
| [8] |
[陆玉麒. 中国空间格局的规律认知与理论提炼. 地理学报, 2021, 76(12): 2885-2897.]
|
| [9] |
[桑义明, 肖玲. 广州的双核结构演变及其城市发展定位分析. 华南师范大学学报(自然科学版), 2003, 35(4): 121-126.]
|
| [10] |
[盛科荣, 孙威. 规模经济、对外贸易与区域双核结构模式探讨: 以山东半岛济南—青岛双核结构为例. 地理科学进展, 2012, 31(12): 1636-1644.]
|
| [11] |
[王海飞. 双核结构视角下的区域空间联动模式研究: 以兰州—西宁经济区为例. 城市发展研究, 2013, 20(3): 80-85.]
|
| [12] |
[甘霖, 曹广忠, 冯长春. 基于引力模型的城市区位潜力测度与区域双核结构刻画: 以山东省济—青双核结构为例. 地域研究与开发, 2016, 35(5): 60-66.]
|
| [13] |
[马颖忆, 陆玉麒, 王大伟, 等. 基于双核理论的云南省中心—门户识别与对外开放布局研究. 南京师大学报(自然科学版), 2020, 43(4): 38-44.]
|
| [14] |
[刘秉镰, 朱俊丰, 周玉龙. 中国区域经济理论演进与未来展望. 管理世界, 2020, 36(2): 182-194, 226.]
|
| [15] |
[王毅, 陈娱, 陆玉麒, 等. 城市门户性与中国门户群研究. 地理科学, 2017, 37(3): 331-338.]
|
| [16] |
[陈强. 高级计量经济学及Stata应用. 北京: 高等教育出版社, 2014.]
|
| [17] |
[高金龙, 包菁薇, 刘彦随, 等. 中国县域土地城镇化的区域差异及其影响因素. 地理学报, 2018, 73(12): 2329-2344.]
|
| [18] |
Krugman. Increasing returns and economic geography. Journal of Political Economy, 1991, 99(3): 483-499.
[克鲁格曼. 回报增加与经济地理. 政治经济学, 1991, 99(3): 483-499.]
|
| [19] |
[范剑勇, 刘念, 刘莹莹. 地理距离、投入产出关系与产业集聚. 经济研究, 2021, 56(10): 138-154.]
|
| [20] |
Marshall. Principles of Economics. Zhu Zhitai, Chen Liangbi, trans trans. Beijing. The Commercial Press, 1987.
[马歇尔. 经济学原理. 朱志泰, 陈良璧, 译. 北京: 商务印书馆,1987.]
|
| [21] |
[王峤, 刘修岩, 李迎成. 空间结构、城市规模与中国城市的创新绩效. 中国工业经济, 2021(5): 114-132.]
|
/
| 〈 |
|
〉 |
