
中国省际城乡流动人口空间格局演变及与区域经济发展的关系
|
柯文前(1988-), 男, 福建晋江人, 博士, 副研究员, 主要从事人口迁移流动与城乡发展研究。E-mail: wqke2005@163.com |
收稿日期: 2022-05-16
修回日期: 2023-04-28
网络出版日期: 2023-08-15
基金资助
国家自然科学基金项目(41971180)
国家自然科学基金项目(41971168)
福建省自然科学基金项目(2021J01145)
Interprovincial urban and rural floating population evolution of China and its relationship with regional economic development
Received date: 2022-05-16
Revised date: 2023-04-28
Online published: 2023-08-15
Supported by
National Natural Science Foundation of China(41971180)
National Natural Science Foundation of China(41971168)
Natural Science Foundation of Fujian Province(2021J01145)
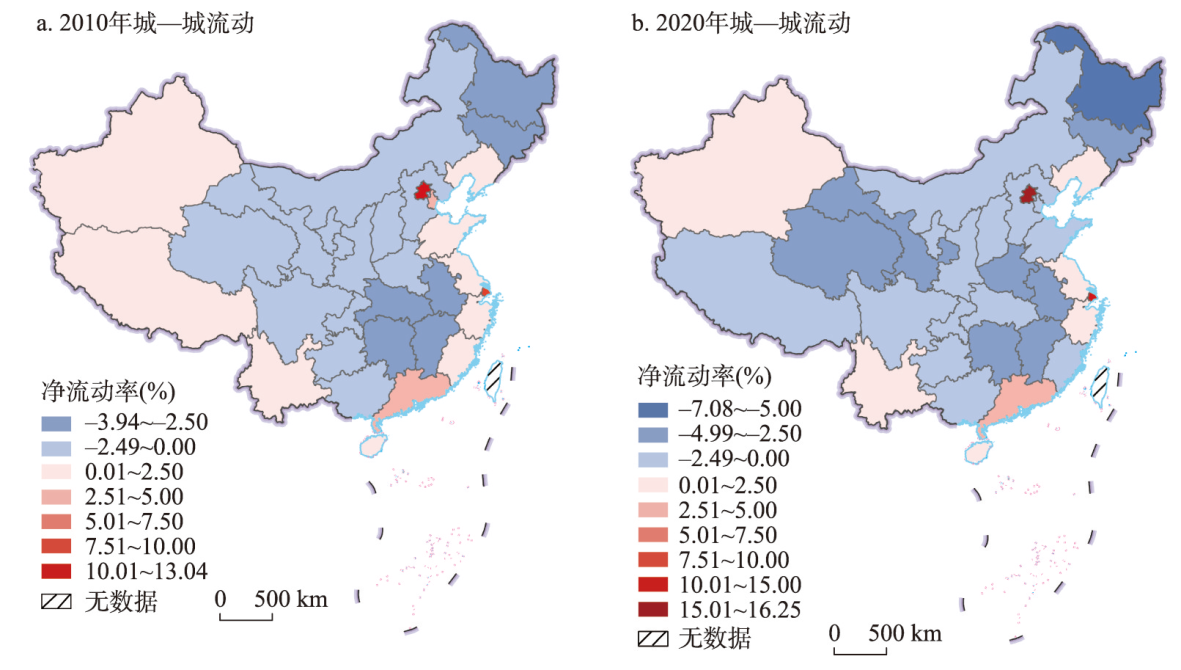
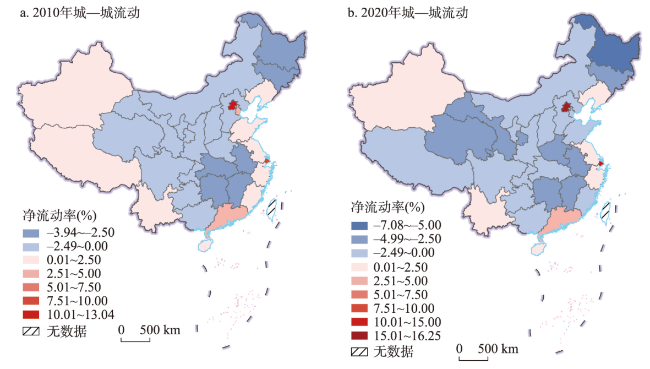
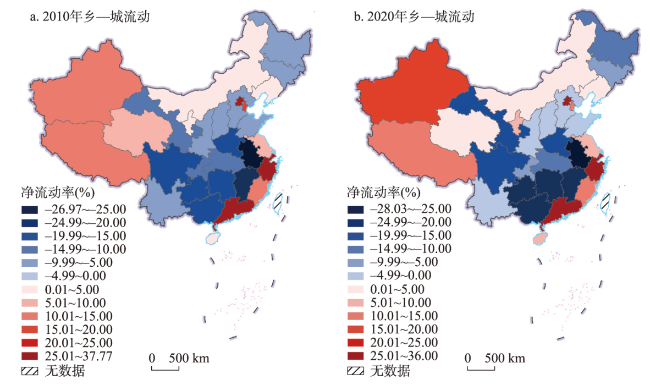
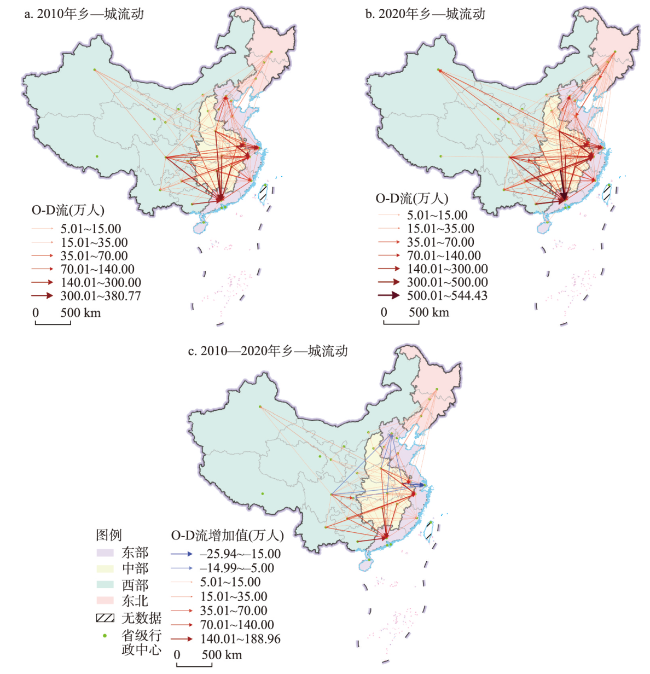
城镇化中后期,中国人口流动的城乡结构出现重要转变,将对人口再分布和城镇化及区域发展产生重大影响。基于2010年和2020年全国人口普查数据划分了省际城—城、乡—城、城—乡和乡—乡4类流动人口,在识别其主流类型的基础上,通过流动率指标和计量模型考察了10年间流动人口主流类型的空间格局演变及与区域经济发展的关系。研究发现:① 省际城乡流动人口规模大、增长快速的同时,乡—城流动占主导、城—城流动快速上升,这两类人口已成为中国城乡流动人口的主流类型。② 城—城净流动格局中净流入区进一步向沿海三大中心集中,辽宁、新疆和云南也维持一定的净流入率,而绝大多数省份都属净流出区的结果塑造了沿海各具特色的三大流动圈以及东北、西北和西南地区内部联系的增强;乡—城净流动格局表现出沿海不同净流入区的“此消彼长”,以及新疆、辽宁净流入率上升引发其邻近省份净流出率下降的特征,该变化刻画了沿海流动圈连绵成带与变动各异的双重特性以及新疆、辽宁流动圈的发育。③ 区域经济发展对城—城和乡—城人口流动的影响都显著为正的作用随着时间的推移在增强,当加入流动存量后其对两类人口流动的促进作用出现分异;城—城和乡—城人口流动对全国经济发展、净流入对流入地经济发展有正向作用。
柯文前 , 肖宝玉 , 林李月 , 朱宇 , 王焱 . 中国省际城乡流动人口空间格局演变及与区域经济发展的关系[J]. 地理学报, 2023 , 78(8) : 2041 -2057 . DOI: 10.11821/dlxb202308012
There are important changes in urban-rural structure of population mobility at the late-intermediate stage of urbanization in China, which will have a significant impact on population redistribution, urbanization and regional development. This paper divides the interprovincial urban and rural floating population into four mobility types by using the 2010 and 2020 censuses data, and on the basis of identifying the mainstream types, their spatial patterns evolution and the relationship with regional economic development are investigated through the mobility ratio indexes and regression models. The study results can be summarized as follows. (1) The urban and rural floating population is large and grows rapidly. Meanwhile, rural-urban mobility keeps the dominant position, and urban-urban mobility rises rapidly, these two population mobility types have become the mainstream ones of interprovincial urban and rural floating population in China. (2) In terms of the net mobility pattern of urban-urban floating population, the net-inflow areas are further concentrated in the three major coastal centers of Beijing, Shanghai and Guangdong, and Liaoning, Xinjiang and Yunnan are also maintained at a certain net-inflow rate, but most of the provincial-level regions are in the net-outflow areas. The major changes of the net mobility pattern of urban-urban floating population have shaped a spatial connection network. The main features of this network can be described as three cross-regional flow circles of Beijing-Tianjin-Hebei, Yangtze River Delta, and Pearl River Delta in coastal China. At the same time, the space connections within the regions are strengthening in northeast China, northwest China and southwest China. (3) The net mobility pattern of rural-urban floating population shows that in coastal areas, the net-inflow rate rises or decreases during the study period, while in inland areas, the increase in the net-inflow rate of Liaoning and Xinjiang leads to the decline in the net-outflow rate of their neighboring provinces. The changes of the net mobility pattern of rural-urban floating population depict the dual characteristics of continuous formation and different changes of the coastal flow circle, and the development of the inland flow circle in Xinjiang and Liaoning. (4) There is a mutual relationship between urban-urban and rural-urban population mobility and regional economic development. For regional economic development of both population mobility types, the impact is significantly positive and has been increasing. When we add the floating stock into the models, the positive effect of this variable has decreased in urban-urban mobility's model, while it still plays the first-place positive effect in rural-urban mobility's model. The two population mobility types have a positive effect on the national economic development and the inflow areas' economic development.
表1 2010年和2020年中国省际城乡流动人口的规模和份额Tab. 1 The scale and percentage of China's interprovincial urban and rural floating population in 2010 and 2020 |
| 指标 流动类型 | 流动规模(万人) | 流动份额(%) | |||
|---|---|---|---|---|---|
| 2010年 | 2020年 | 2010年 | 2020年 | ||
| 城—城流动 | 1346.45 | 2338.32 | 16.98 | 19.54 | |
| 乡—城流动 | 5315.36 | 8085.03 | 67.04 | 67.55 | |
| 城—乡流动 | 110.92 | 160.52 | 1.40 | 1.34 | |
| 乡—乡流动 | 1156.21 | 1385.71 | 14.58 | 11.58 | |
| 合计 | 7928.94 | 11969.58 | 100.00 | 100.00 | |
表2 中国省际城—城和乡—城流动人口的流动率指标Tab. 2 Mobility ratio indexes of China's interprovincial urban and rural floating population |
| 指标 | 公式 | |
|---|---|---|
| 城—城 流动 | 城—城流入率( ) | |
| 城—城流出率( ) | ||
| 城—城净流动率( ) | ||
| 两地间城—城流动率( ) | ||
| 乡—城 流动 | 乡—城流入率( ) | |
| 乡—城流出率( ) | ||
| 乡—城净流动率( ) | ||
| 两地间乡—城流动率( ) |
表3 区域经济发展对城—城和乡—城流动人口影响的回归分析结果Tab. 3 The results of the influence of regional economic development on urban-urban and rural-urban floating population |
| 城—城流动 | 2010年模型(lnMRijUr_Ur) | 2020年模型(lnMRijUr_Ur) | ||||||||
|---|---|---|---|---|---|---|---|---|---|---|
| 变量标签 | 模型1 | 模型2 | 模型3 | 模型4 | 模型1 | 模型2 | 模型3 | 模型4 | 模型5 | |
| lnDij | -0.52*** | -0.52*** | -0.53*** | -0.53*** | -0.52*** | -0.52*** | -0.53*** | -0.53*** | -0.19*** | |
| lnRpcgdpji | 0.32*** | 0.21*** | 0.42*** | 0.34*** | 0.14*** | |||||
| lnRjoblessji | -0.19*** | -0.14*** | -0.15*** | -0.11*** | -0.06*** | |||||
| lnRgrowthji | -0.13*** | -0.13*** | 0.03 | 0.01 | 0.13*** | |||||
| lnRstuteaji | -0.20*** | -0.07** | -0.24*** | -0.15*** | -0.08*** | |||||
| lnRtemji | 0.27*** | 0.20*** | 0.33*** | 0.16*** | -0.06** | |||||
| Midij | -0.12*** | -0.12*** | -0.12*** | -0.12*** | 0.01 | |||||
| Westij | -0.04 | -0.04 | -0.07** | -0.07** | -0.03 | |||||
| NorEastij | 0.05** | 0.05** | 0.02 | 0.02 | 0.04** | |||||
| Eastij | 0.07*** | 0.07*** | 0.05 | 0.05* | -0.07*** | |||||
| lnTRij | 0.73*** | |||||||||
| 调整R2 | 0.269 | 0.373 | 0.446 | 0.473 | 0.269 | 0.443 | 0.375 | 0.468 | 0.764 | |
| 乡—城流动 | 2010年模型(lnMRijRu_Ur) | 2020年模型(lnMRijRu_Ur) | ||||||||
| 变量标签 | 模型1 | 模型2 | 模型3 | 模型4 | 模型1 | 模型2 | 模型3 | 模型4 | 模型5 | |
| lnDij | -0.44*** | -0.44*** | -0.46*** | -0.46*** | -0.44*** | -0.44*** | -0.45*** | -0.44*** | -0.29*** | |
| lnRpcgdpji | 0.57*** | 0.47*** | 0.58*** | 0.56*** | 0.46*** | |||||
| lnRjoblessji | -0.23*** | -0.12*** | -0.27*** | -0.20*** | -0.18*** | |||||
| lnRgrowthji | -0.17*** | -0.16*** | -0.01 | -0.03 | 0.03 | |||||
| lnRstuteaji | -0.34*** | -0.06** | -0.35*** | -0.19*** | -0.19*** | |||||
| lnRtemji | 0.16*** | 0.02 | 0.31*** | 0.03 | -0.12*** | |||||
| Midij | -0.07*** | -0.07*** | -0.08** | -0.08*** | -0.003 | |||||
| Westij | -0.06** | -0.06*** | -0.07** | -0.07*** | -0.02 | |||||
| NorEastij | 0.01 | 0.05** | -0.002 | -0.002 | -0.01 | |||||
| Eastij | -0.001 | -0.001 | -0.03 | -0.03 | -0.11*** | |||||
| lnTRij | 0.44*** | |||||||||
| 调整R2 | 0.190 | 0.515 | 0.430 | 0.571 | 0.189 | 0.528 | 0.322 | 0.568 | 0.686 | |
注:***、**、*分别表示回归参数在1%、5%、10%显著性水平显著;模型的回归系数均为标准化后的系数。 |
表4 城—城和乡—城流动人口对区域经济发展影响的回归分析结果Tab. 4 The results of the influence of urban-urban and rural-urban floating population on regional economic development |
| 城—城 流动 | 全国模型(lnpcgdp) | 流入地区域模型(lnpcgdp) | 流出地区域模型(lnpcgdp) | |||||||||||||||||
|---|---|---|---|---|---|---|---|---|---|---|---|---|---|---|---|---|---|---|---|---|
| 2010年 | 2020年 | 2010年 | 2020年 | 2010年 | 2020年 | |||||||||||||||
| 变量标签 | 模型1 | 模型2 | 模型3 | 模型1 | 模型2 | 模型3 | 模型1 | 模型2 | 模型3 | 模型1 | 模型2 | 模型3 | 模型1 | 模型2 | 模型3 | 模型1 | 模型2 | 模型3 | ||
| lnInRUr_Ur (lnNetUr_Ur) | 0.45*** | 0.10 | 0.58*** | 0.39*** | (0.28) | (0.08) | (0.66*) | (0.27) | 0.07 | -0.12 | 0.13 | 0.10 | ||||||||
| lnOutUr_Ur | -0.23 | -0.02 | -0.29** | -0.09 | 0.13 | -0.07 | -0.15 | 0.04 | ||||||||||||
| lninvest | 0.44*** | 0.45*** | 0.21** | 0.24*** | 0.21** | 0.26** | 0.23 | 0.22 | 0.82*** | 0.85*** | 0.50*** | 0.46** | ||||||||
| lnindus | 0.23** | 0.19* | 0.49*** | 0.30*** | 0.01 | 0.03 | 0.19 | 0.23 | 0.12 | 0.15 | 0.38** | 0.40** | ||||||||
| lntrade | 0.44*** | 0.37*** | 0.32** | 0.15 | 0.35*** | 0.36*** | -0.20 | -0.03 | 0.05 | 0.02 | 0.20 | 0.23 | ||||||||
| lnR&D | 0.08 | 0.11 | 0.20 | 0.32** | 0.56** | 0.48** | 0.92* | 0.61 | 0.03 | 0.03 | 0.20 | 0.20 | ||||||||
| 调整R2 | 0.260 | 0.881 | 0.878 | 0.440 | 0.713 | 0.847 | 0.076 | 0.966 | 0.969 | 0.341 | 0.761 | 0.806 | 0.020 | 0.790 | 0.778 | 0.037 | 0.635 | 0.594 | ||
| 乡—城 流动 | 全国模型(lnpcgdp) | 流入地区域模型(lnpcgdp) | 流出地区域模型(lnpcgdp) | |||||||||||||||||
| 2010年 | 2020年 | 2010年 | 2020年 | 2010年 | 2020年 | |||||||||||||||
| 变量标签 | 模型1 | 模型2 | 模型3 | 模型1 | 模型2 | 模型3 | 模型1 | 模型2 | 模型3 | 模型1 | 模型2 | 模型3 | 模型1 | 模型2 | 模型3 | 模型1 | 模型2 | 模型3 | ||
| lnInRUr_Ur (lnNetUr_Ur) | 0.65*** | 0.15 | 1.05*** | 0.49*** | (0.43) | (0.21**) | (0.57*) | (0.22) | -0.22 | -0.17 | 0.32 | 0.18 | ||||||||
| lnOutUr_Ur | 0.11 | -0.03 | 0.46** | 0.04 | -0.41 | -0.15 | 0.20 | 0.10 | ||||||||||||
| lninvest | 0.44*** | 0.47*** | 0.21** | 0.17** | 0.21** | 0.38*** | 0.23 | 0.21 | 0.82*** | 0.81*** | 0.50*** | 0.45** | ||||||||
| lnindus | 0.23** | 0.10 | 0.49*** | 0.17 | 0.01 | -0.18 | 0.19 | -0.01 | 0.12 | 0.13 | 0.38** | 0.33 | ||||||||
| lntrade | 0.44*** | 0.31*** | 0.32** | 0.10 | 0.35*** | 0.35*** | -0.20 | -0.31 | 0.05 | 0.01 | 0.20 | 0.21 | ||||||||
| lnR&D | 0.08 | 0.20 | 0.20 | 0.46*** | 0.56** | 0.52*** | 0.92* | 1.07* | 0.03 | 0.02 | 0.20 | 0.26 | ||||||||
| 调整R2 | 0.282 | 0.881 | 0.885 | 0.487 | 0.713 | 0.828 | 0.093 | 0.966 | 0.984 | 0.246 | 0.761 | 0.771 | 0.099 | 0.790 | 0.781 | 0.056 | 0.635 | 0.597 | ||
注:***、**、*分别表示回归参数在1%、5%、10%显著性水平显著;流入地区域模型中,城乡流动的自变量考虑的是净流入率对区域经济发展的影响作用;回归系数用括号内的数值表示;模型的回归系数均为标准化后的系数。 |
| [1] |
[刘彦随. 中国新时代城乡融合与乡村振兴. 地理学报, 2018, 74(4): 637-650.]
|
| [2] |
[柯文前, 朱宇, 陈晨, 等. 1995—2015年中国人口迁移的时空变化特征. 地理学报, 2022, 77(2): 411-425.]
|
| [3] |
[段成荣, 谢东虹, 吕利丹. 中国人口的迁移转变. 人口研究, 2019, 43(2): 12-20.]
|
| [4] |
[马小红, 段成荣, 郭静. 四类流动人口的比较研究. 中国人口科学, 2014(5): 36-48.]
|
| [5] |
[豆晓,
|
| [6] |
[林李月, 朱宇, 柯文前. 城镇化中后期中国人口迁移流动形式的转变及政策应对. 地理科学进展, 2020, 39(12): 2054-2067.]
|
| [7] |
[沈诗杰, 沈冠辰. 中国省际人口流动的空间结构特征研究. 人口学刊, 2020, 42(4): 103-112.]
|
| [8] |
[马荷花, 王小军. 中国省际城乡人口流动成因的研究: 基于第六次人口普查数据. 人口与发展, 2017, 23(3): 25-36.]
|
| [9] |
[陆希刚, 张立. 区域差异和城乡梯度双重视角下的中国流动人口迁移空间模式. 城市规划学刊, 2021(5): 66-73.]
|
| [10] |
|
| [11] |
|
| [12] |
|
| [13] |
|
| [14] |
[严善平. 中国省际人口流动的机制研究. 中国人口科学, 2007(1): 71-77.]
|
| [15] |
[王桂新, 潘泽瀚, 陆燕秋. 中国省际人口迁移区域模式变化及其影响因素: 基于2000和2010年人口普查资料的分析. 中国人口科学, 2012(5): 2-13, 111.]
|
| [16] |
[马志飞, 尹上岗, 张宇, 等. 中国城城流动人口的空间分布、流动规律及其形成机制. 地理研究, 2019, 38(4): 926-936.]
|
| [17] |
[王桂新, 魏星, 沈建法. 中国省际人口迁移对区域经济发展作用关系之研究. 复旦学报(社会科学版), 2005(3): 148-161.]
|
| [18] |
[杜小敏, 陈建宝. 人口迁移与流动对我国各地区经济影响的实证分析. 人口研究, 2010, 34(3): 77-88.]
|
| [19] |
[毛新雅, 翟振武. 中国人口流迁与区域经济增长收敛性研究. 中国人口科学, 2016(3): 12-23.]
|
| [20] |
[阮荣平, 刘力, 郑风田. 人口流动对输出地人力资本影响研究. 中国人口科学, 2011(1): 83-92.]
|
| [21] |
[杨雪, 龚凯林. 中部地区省际人口流出对流出地经济影响的实证分析. 人口学刊, 2017, 39(5): 36-47.]
|
| [22] |
[许召元, 李善同. 区域间劳动力迁移对经济增长和地区差距的影响. 数量经济技术经济研究, 2008(2): 38-52.]
|
| [23] |
[戚伟, 赵美风, 刘盛和. 1982—2010年中国县市尺度流动人口核算及地域类型演化. 地理学报, 2017, 72(12): 2131-2146.]
|
| [24] |
[柯文前, 陆玉麒, 俞肇元, 等. 多变量驱动的江苏县域经济空间格局演化. 地理学报, 2013, 68(6): 802-812.]
|
/
| 〈 |
|
〉 |

