
不同收入群体的城市安全感地图及其环境影响因素
|
廖伊彤(1996-), 女, 广东汕头人, 博士生, 研究方向为健康地理、环境感知和城乡规划。E-mail: liaoyt6@mail2.sysu.edu.cn |
收稿日期: 2021-09-27
修回日期: 2023-02-28
网络出版日期: 2023-06-21
基金资助
国家自然科学基金项目(41871148)
国家自然科学基金项目(42271234)
国家自然科学基金项目(42001171)
The map of urban safety perception and its environmental impact: Income-based contrasts
Received date: 2021-09-27
Revised date: 2023-02-28
Online published: 2023-06-21
Supported by
National Natural Science Foundation of China(41871148)
National Natural Science Foundation of China(42271234)
National Natural Science Foundation of China(42001171)
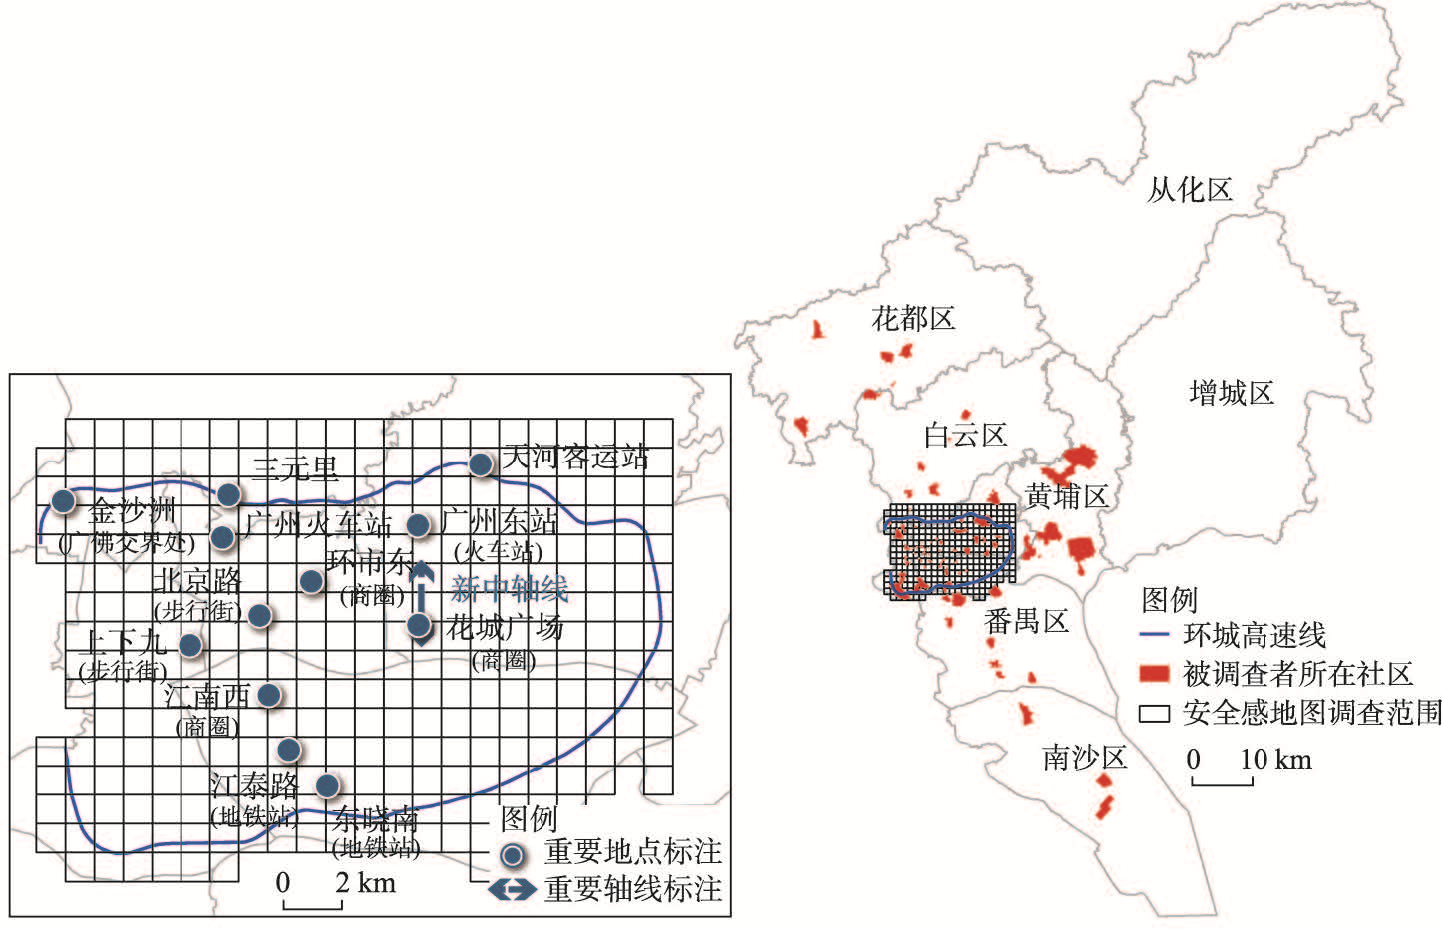
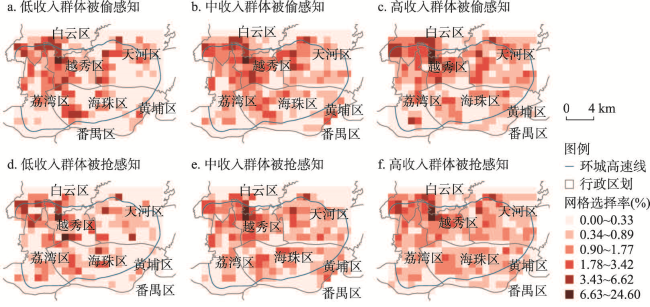
随着人们需求从物质向精神层次的提升,城市安全感的营造对社会的健全发展日益重要。同时,作为环境感知的一种,安全感存在一定的群体差异,了解这种差异及其环境影响因素有助于在城市规划中尊重并满足不同群体的感知需求。以往相关研究大多关注居住社区的安全感问题,针对居住区以外安全感知空间分布及其影响因素的研究较少,同时缺乏环境影响的群体差异视角。因此,本文基于在广州市采集的1149份有效问卷调查数据,获取被调查者对中心城区最担心被偷及被抢(缺乏安全感)的地区,分别按高、中、低3个收入群体汇聚形成安全感地图,并使用负二项回归模型从建成环境、社会与经济环境、环境失序3个维度讨论环境因素对不同收入群体安全感地图格局的影响及其差异。研究发现:① 火车站、客运站等对外交通设施所在地,广佛城市交界地带以及老城区商圈在3个群体的感知中均为高风险区;② 3个收入群体对中心城区的安全感知空间分布存在一定的差异,其中低收入群体的感知空间与中、高收入群体的差异较显著;③ 对3个群体的安全感均有显著影响的环境因素为重要交通设施分布、蓝色空间、土地利用多样性与道路交叉口密度;④ 环境密度要素如娱乐设施、商务楼宇的密度对中、低收入群体的安全感更有影响,环境设计要素如天空开敞度、绿色空间占比对中、高收入群体的安全感更有影响,社会经济水平以及警务设施、活动人流不稳定性等环境失序要素的影响效果则存在较高的群体差异性。本文可为城市安全环境营造、安全意象建立、城市人本化和精细化规划管理提供理论参考依据。
廖伊彤 , 周素红 , 肖露子 . 不同收入群体的城市安全感地图及其环境影响因素[J]. 地理学报, 2023 , 78(6) : 1467 -1483 . DOI: 10.11821/dlxb0202306009
As people's needs shift from the material level to the spiritual level, the safety perception of city is increasingly important to the sound development of society. In the meanwhile, there are group differences in the spatial distribution of safety perception, and understanding these differences and their environmental influences can help to respect and meet diverse needs during the process of urban planning and management. Previous research mainly focused on safety perception of residents in their home area, while few studies have investigated the safety perception of different groups outside their residential area. Besides, how environmental factors affect the group differences of their safety perception maps is unclear. Based on current deficiencies, a survey including 1149 participants was carried out in central area of Guangzhou to collect different safety perception maps of three income groups. Negative binomial regression models were used to test the environmental impact on the spatial distribution of safety perception of different income groups, with the environmental factors selected from three aspects: built environment, socioeconomic environment and environmental disorganization. The results show that: (1) long-distance transport facilities such as railway station and coach station, the junction area of Guangzhou-Foshan, and business districts in old city are all marked as high-risk perception area among three income groups. (2) There are certain differences in the spatial distribution of safety perception of the three income groups, among which the safety perception map of the low-income group is significantly different compared to two other groups. (3) Environmental factors such as the distribution of important transport facilities, blue space, land use diversity and intersection density have significant influence on the safety perception map of all income groups. (4) Density factors such as density of entertainment facilities and commercial buildings have a greater impact on the sense of safety of low- and medium-income groups. Design factors like sky openness and green space proportion have more impact on the median- and high-income groups. The impact of socioeconomic level and environmental disorganization factors (e.g., density of police station and instability of passenger flow) present great differences among three income groups. The study can provide theoretical reference for the construction of urban safety environment, establishment of safety image, as well as for humanistic and detailed urban planning and management in the future.
图1 被调查者所在社区及安全感地图调查范围Fig. 1 Spatial distribution of investigated communities and mapping area of safety perception |
表1 样本结构与广州人口结构对比Tab. 1 Demographic structure of samples and Guangzhou City |
| 问卷数据 | 2010年人口普查数据 | 2020年人口普查数据 | |||||
|---|---|---|---|---|---|---|---|
| 人数(人) | 占比(%) | 占比(%) | 占比(%) | ||||
| 性别 | 男性 | 661 | 57.53 | 52.29 | 52.84 | ||
| 女性 | 488 | 42.47 | 47.71 | 47.16 | |||
| 年龄(岁) | 19~30 | 442 | 39.64 | (20~29) | 32.71 | 31.16 | |
| 31~55 | 596 | 53.45 | (30~54) | 49.90 | 50.37 | ||
| 56~65 | 72 | 6.46 | (55~64) | 9.25 | 9.99 | ||
| ≥ 66 | 5 | 0.45 | (≥ 65) | 8.14 | 8.48 | ||
| 受教育程度 | 初中及以下 | 350 | 30.46 | 53.03 | 47.63 | ||
| 高中 | 397 | 34.55 | 21.21 | 23.40 | |||
| 本科及以上 | 402 | 34.99 | 25.76 | 28.96 | |||
| 户口类型 | 本市 | 584 | 50.83 | 54.19 | 46.83 | ||
| 外地 | 565 | 49.17 | 45.81 | 53.17 | |||
注:由于抽样样本不含增城区和从化区,因此普查数据也采用减去了这两个区后的人数进行对比;由于两次普查在年龄段划分上有差异,因此采用相近的年龄段人数进行对比,并在表格中特别标注出实际年龄段划分。 |
表2 安全感地图选择率直接标准化示例Tab. 2 Example of direct standardization of selection rate of safety perception map |
| 标准总人次 | 示例网格:225号 | ||||
|---|---|---|---|---|---|
| 总人数(人) | 实际选择数(人) | 实际选择率(‰) | 期望选择数(人次) | ||
| 在此活动 | a1 = 6863 | 15 | 4 | b1 = 266.667 | 1830 = a1×b1 |
| 不在此活动 | a2 = 360861 | 123 | 7 | b2 = 56.911 | 20537 = a2×b2 |
| 总计 | 367724 | 138 | 11 | 79.710 | 22367 = a1×b1+a2×b2 |
表3 3组人群安全感地图Friedman检验显著性Tab. 3 Friedman test of safety perception maps of three income groups |
| 被偷风险感知地图 | 被抢风险感知地图 | ||||
|---|---|---|---|---|---|
| 未校正 | 校正 | 未校正 | 校正 | ||
| 3组比较 | 0.000 | 0.000 | 0.001 | 0.000 | |
| 低收入—中收入比较 | 0.000 | 0.000 | 0.011 | 0.001 | |
| 低收入—高收入比较 | 0.012 | 0.002 | 0.002 | 0.001 | |
| 中收入—高收入比较 | 0.030 | 0.037 | 0.595 | 0.937 | |
表4 环境要素对不同收入群体被害风险感知的影响结果Tab. 4 Environmental impact on risk perception of three income groups |
| 低收入群体感知 | 中收入群体感知 | 高收入群体感知 | |||||||
|---|---|---|---|---|---|---|---|---|---|
| 被偷 | 被抢 | 被偷 | 被抢 | 被偷 | 被抢 | ||||
| 环境密度 | 娱乐设施密度 | 0.046** | 0.016 | 0.028** | 0.019 | 0.009 | 0.013 | ||
| 商务楼宇密度 | -0.020 | -0.022 | -0.018** | -0.020** | -0.013 | -0.014 | |||
| 购物中心与街市密度 | 0.005 | 0.000 | 0.004 | 0.011 | 0.013 | 0.008 | |||
| 重要交通设施分布 | 0.463** | 0.494*** | 0.397*** | 0.412*** | 0.334** | 0.401*** | |||
| 环境多样性 | 土地利用多样性 | 1.125*** | 1.036*** | 0.665*** | 0.712*** | 0.252 | 0.580*** | ||
| 环境设计 | 道路交叉口密度 | 0.008*** | 0.006** | 0.002* | 0.003** | 0.002 | 0.002* | ||
| 建筑基底面积占比 | -0.017 | 0.008 | -0.007 | 0.000 | 0.021* | 0.005 | |||
| 平均建筑楼层数 | 0.053 | 0.137*** | 0.013 | 0.031 | 0.067* | 0.056* | |||
| 天空开敞度 | 3.638 | 2.407 | 2.694** | 3.733*** | 3.820** | 2.685* | |||
| 绿色空间占比 | -0.001 | -0.001 | -0.009** | -0.008** | -0.008* | -0.005 | |||
| 蓝色空间占比 | -0.026*** | -0.024*** | -0.017*** | -0.016*** | -0.018*** | -0.014** | |||
| 社会与经济环境 | 社会经济水平 | -0.027 | -0.097 | 0.027 | 0.049 | 0.119** | 0.047 | ||
| 环境失序 | 街道垃圾 | -0.068 | 0.751 | 0.053 | -0.343 | 1.568 | 1.622 | ||
| 分小时人流标准差 | 0.000 | 0.001 | 0.001*** | 0.000* | 0.001** | 0.000 | |||
| 人口混合程度 | -0.381 | -0.804 | -0.085 | -0.101 | 0.323 | 0.279 | |||
| 警务设施密度 | -0.034** | -0.026 | 0.005 | 0.007 | 0.007 | 0.001 | |||
| 控制变量 | 空间滞后项 | 0.393*** | 0.224** | 0.074*** | 0.074*** | 0.229*** | 0.209*** | ||
| AIC | 771.201 | 769.420 | 1651.329 | 1596.701 | 1158.831 | 1122.68 | |||
注:*:p < 0.1,**:p < 0.05,***:p < 0.01;N=322。 |
:感谢柳林教授、宋广文博士以及龙冬平博士在本文数据采集中提供的支持。
| [1] |
[ 安莉娟, 丛中. 安全感研究述评. 中国行为医学科学, 2003, 12(6): 698-699.]
|
| [2] |
[ 丛中, 安莉娟. 安全感量表的初步编制及信度、效度检验. 中国心理卫生杂志, 2004, 18(2): 97-99.]
|
| [3] |
|
| [4] |
|
| [5] |
|
| [6] |
|
| [7] |
[ 刘晓霞, 肖鸿元, 王兴中, 等. 地理学的安全感研究: 基于地点的综合理解、应用及展望. 人文地理, 2018, 33(5): 38-45.]
|
| [8] |
|
| [9] |
|
| [10] |
|
| [11] |
|
| [12] |
|
| [13] |
|
| [14] |
|
| [15] |
|
| [16] |
|
| [17] |
|
| [18] |
|
| [19] |
|
| [20] |
|
| [21] |
|
| [22] |
|
| [23] |
|
| [24] |
[ 陈平雁, 郭祖超, 胡琳. 比较两种诊断试验的统计方法. 中国卫生统计, 1990, 7(2): 22-25.]
|
| [25] |
Guangzhou Statistical Bureau, Survey Office of the National Bureau of Statistics in Guangzhou. Guangzhou Statistical Yearbook 2020. Beijing: China Statistics Press, 2020.
[ 广州市统计局, 国家统计局广州调查队. 2020广州统计年鉴. 北京: 中国统计出版社, 2020.]
|
| [26] |
Guangzhou Statistical Bureau, Survey Office of the National Bureau of Statistics in Guangzhou. Guangzhou Statistical Yearbook 2010. Beijing: China Statistics Press, 2010.
[ 广州市统计局, 国家统计局广州调查队. 2010广州统计年鉴. 北京: 中国统计出版社, 2010.]
|
| [27] |
Canton Public Opinion Research Center. Latest report of Canton Public Opinion Research Center shows that Guangzhou social security satisfaction has hit a record high. 2020. http://gaj.gz.gov.cn/gaxw/sjfb/content/post_7096172.html.
[ 广州社情民意研究中心. 广州社情民意研究中心最新民调报告显示: 2019年度广州社会治安满意度创历史新高. 2020. http://gaj.gz.gov.cn/gaxw/sjfb/content/post_7096172.html.
|
| [28] |
[ 金红. 2018年全国时间利用调查公报解读. 中国统计, 2019(2): 7-9.]
|
| [29] |
|
| [30] |
[ 宋广文, 肖露子, 周素红, 等. 居民日常活动对扒窃警情时空格局的影响. 地理学报, 2017, 72(2): 356-367.]
|
| [31] |
[ 徐冲, 柳林, 周素红, 等. 微观空间因素对街头抢劫影响的空间异质性: 以DP半岛为例. 地理研究, 2017, 36(12): 2492-2504.]
|
| [32] |
|
| [33] |
|
| [34] |
[ 凯文·林奇. 城市意象. 北京: 华夏出版社, 2001: 2-5.]
|
| [35] |
|
| [36] |
|
| [37] |
|
| [38] |
|
| [39] |
|
| [40] |
|
| [41] |
|
| [42] |
|
| [43] |
|
| [44] |
|
| [45] |
|
| [46] |
|
| [47] |
|
| [48] |
[ 简·雅各布斯. 美国大城市的死与生. 南京: 译林出版社, 2006.]
|
| [49] |
[ 张延吉, 秦波, 唐杰. 城市建成环境对居住安全感的影响: 基于全国278个城市社区的实证分析. 地理科学, 2017, 37(9): 1318-1325.]
|
| [50] |
|
| [51] |
|
| [52] |
|
| [53] |
|
| [54] |
|
| [55] |
|
| [56] |
|
| [57] |
|
| [58] |
|
| [59] |
|
| [60] |
|
| [61] |
|
| [62] |
|
| [63] |
|
| [64] |
|
| [65] |
[ 李志刚, 薛德升, 杜枫, 等. 全球化下“跨国移民社会空间”的地方响应: 以广州小北黑人区为例. 地理研究, 2009, 28(4): 920-932.]
|
| [66] |
[ 蒋丽. 广州制造业空间布局及其形成原因. 热带地理, 2014, 34(6): 850-858.]
|
| [67] |
Research Group of Guangzhou University. Path selection of comprehensive public security governance: Practice of Guangzhou railway station its enlightenment. Chinese Public Administration, 2007(7): 40-43.
[ 广州大学课题组. 城市治安综合治理的路径选择: 广州火车站地区治安综合治理的实践及其启示. 中国行政管理, 2007(7): 40-43.]
|
| [68] |
|
| [69] |
[ 曾敏玲, 毛媛媛. 上海市浦东新区城市街道“两抢一盗”犯罪的时空规律. 热带地理, 2014, 34(5): 606-617.]
|
| [70] |
|
| [71] |
[ 王建国, 高源, 胡明星. 基于高层建筑管控的南京老城空间形态优化. 城市规划, 2005, 29(1): 45-51, 97.]
|
| [72] |
|
| [73] |
|
| [74] |
[ 杨俊宴, 吴浩, 郑屹. 基于多源大数据的城市街道可步行性空间特征及优化策略研究: 以南京市中心城区为例. 国际城市规划, 2019, 34(5): 33-42.]
|
| [75] |
[ 司睿, 林姚宇, 肖作鹏, 等. 基于街景数据的建成环境与街道活力时空分析: 以深圳福田区为例. 地理科学, 2021, 41(9): 1536-1545.]
|
| [76] |
[ 张丽英, 裴韬, 陈宜金, 等. 基于街景图像的城市环境评价研究综述. 地球信息科学学报, 2019, 21(1): 46-58.]
|
| [77] |
|
/
| 〈 |
|
〉 |