
多维距离对流动人口回流意愿的影响及群体异质性
|
殷江滨(1985-), 男, 江西湖口人, 博士, 教授, 博士生导师, 中国地理学会会员(S110009620M), 主要从事城市地理与经济地理研究。E-mail: yjbin401@163.com |
收稿日期: 2022-01-18
修回日期: 2022-11-07
网络出版日期: 2022-12-29
基金资助
国家自然科学基金项目(42071213)
国家自然科学基金项目(41971194)
国家社会科学基金重大项目(20ZDA037)
中国博士后科学基金项目(2022M711325)
Return migration intention: Heterogeneous effects from multidimensional distances over space
Received date: 2022-01-18
Revised date: 2022-11-07
Online published: 2022-12-29
Supported by
National Natural Science Foundation of China(42071213)
National Natural Science Foundation of China(41971194)
Major Program of National Social Science Foundation of China(20ZDA037)
China Postdoctoral Science Foundation(2022M711325)
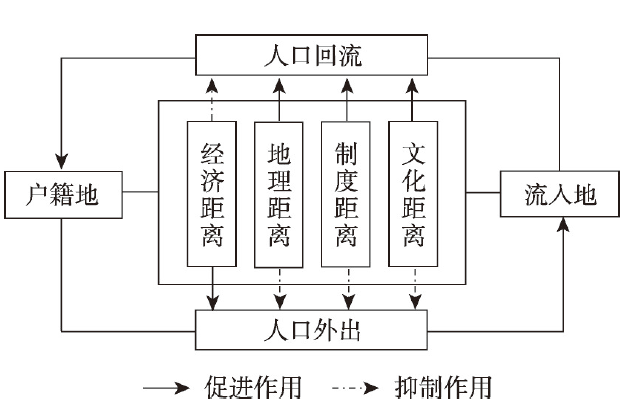
人口回流正成为中国人口流动的重要趋势,并将深刻影响中西部及沿海地区的发展前景。本文从地理学的“距离”视角切入,在传统人口迁移理论的基础上,将两个非经济因素的距离维度,即制度距离和文化距离引入人口回流研究,构建了多维距离影响流动人口回流意愿的理论框架,并运用全国层面的流动人口调查数据进行实证分析。结果发现:与理论预测一致,流入地与户籍地间的多维距离对流动人口的回流意愿具有显著的影响。经济距离抑制了流动人口的回流,而地理距离、制度距离和文化距离均对人口回流产生促进作用。在考虑了解释变量可能存在的测量误差后,这一发现依然稳健。此外,多维距离对回流意愿的影响因流动人口个体及所在城市特征的差异而不同。个体异质性方面,随着流动人口年龄的增长和文化水平的提高,经济距离对回流意愿的影响不断增强,而地理距离的影响则逐渐减弱。城市异质性方面,随着城市人口规模的增加,制度距离对回流意愿的促进作用不断减弱;城市经济水平的提高则弱化了地理距离对回流意愿的正向效应。

殷江滨 , 张倩倩 , 武文杰 , 黄晓燕 , 翟婧彤 , 祁琪 . 多维距离对流动人口回流意愿的影响及群体异质性[J]. 地理学报, 2022 , 77(12) : 3146 -3161 . DOI: 10.11821/dlxb202212013
Decades of urbanization and economic growth in central, western and coastal regions of China have transformed the increasing flow of return migration across places, which exerted a profound impact on regional development prospects. Thus, elaborating the return motivation of internal migrants is of great theoretical and practical significance. From the perspective of "distance" in geography, this paper introduces two additional non-economic dimensions of distance, namely, cultural and administrative distances, between places of destination and origin into the study on migrants' return-to-hometown intention, and focuses on the effects from cultural, administrative and economic borders on return intention. Our measurement combines dialect, geographical and socio-economic datasets with a theoretical framework of multidimensional distances that influence return migration intention. We conduct an empirical analysis using data from the 2017 China Migrants Dynamic Survey and the method of logistic regression modeling. The results show that multidimensional distances between places of destination and origin exert a significant impact on the return intention of migrants, which is consistent with the theoretical predictions. Economic distance restrains return migration intention, while geographic, administrative, and cultural distances promote the intention of migrants to return. This finding remains robust after accounting for possible measurement errors in explanatory variables. The estimated effects of multidimensional distances on return intention vary with the characteristics of individual migrants and destination cities. In terms of individual heterogeneity, the negative effect of economic distance on return migration intention increases, whereas the positive influence of geographic distance gradually decreases with increases in the age and level of education of migrants. In terms of urban heterogeneity, the promoting effect of administrative distance on return intention tends to decrease, and the improvement of urban economic level decreases the positive effect of geographic distance on return intention with the increase of urban population size. This study strengthens the understanding of the phenomenon of return migration under "human-environment" interactions, and helps to enrich the study of migration in geography.
Key words: return migration; return intention; multidimensional distances; China
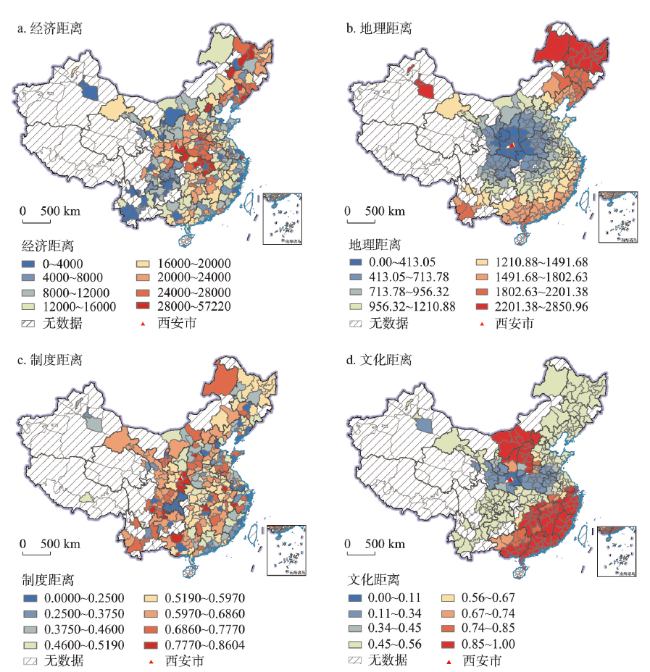
图2 西安市与中国其他城市之间的多维距离注:基于自然资源部标准地图服务网站审图号为GS(2019)1827号标准地图制作,底图边界无修改。 Fig. 2 Multidimensional distances between Xi'an and other cities in China |
表1 变量定义与描述性统计Tab. 1 Definitions and descriptive statistics of variables |
| 变量 | 定义及计量单位 | 均值 | 标准差 | |
|---|---|---|---|---|
| 被解释变量 | 回流意愿 | 打算返乡=1,其他=0 | 0.02 | 0.13 |
| 核心解释变量 | 经济距离 | 流入地与户籍地的职工平均工资的差值(万元) | 2.08 | 2.38 |
| 地理距离 | 流入地与户籍地的公路最短距离(km) | 715.0 | 683.8 | |
| 制度距离 | 流入地与户籍地户籍门槛指数的差值 | 0.41 | 0.34 | |
| 文化距离 | 流入地与户籍地之间的语言距离 | 0.60 | 0.33 | |
| 个体控制变量 | 年龄 | 单位:岁 | 37.21 | 10.79 |
| 性别 | 男性=1,女性=0 | 0.52 | 0.50 | |
| 高文化程度 | 大学专科及以上=1,高中/中专及以下=0 | 0.19 | 0.39 | |
| 平均月收入 | 单位:元 | 4577.7 | 3928.2 | |
| 流动时长 | 单位:年 | 10.80 | 7.69 | |
| 家乡土地拥有 | 老家既有承包地,又有宅基地=2,有承包地或宅基地=1,既无承包地,也无宅基地=0 | 1.03 | 0.01 | |
| 城市控制变量 | 城市人口密度差异 | 流入地与户籍地人口密度的差值(人/km2) | 254.2 | 564.8 |
| 城市公共服务差异 | 流入地与户籍地公共服务指数a的差值 | 0.44 | 1.26 | |
| 城市空气质量差异 | 流入地与户籍地PM2.5浓度的差值(μg/m³) | -3.58 | 15.09 | |
注:a:公共服务指数根据城市每万人小学生、中学生拥有的教师数、学校数,每万人拥有的医院数、医院床位数、医师数进行主成分分析得到。 |
表2 多维距离对回流意愿影响的总样本分析结果Tab. 2 Total sample econometric results of multidimensional distances influencing return intention |
| 变量 | 模型1 | 模型2 | 模型3 | 模型4 | ||||||||||
|---|---|---|---|---|---|---|---|---|---|---|---|---|---|---|
| Coef | Z | Coef | Z | Coef | Z | Coef | Z | |||||||
| 经济距离 | -0.090*** | -6.08 | -0.099*** | -6.07 | -0.100*** | -6.10 | -0.109*** | -5.93 | ||||||
| 地理距离 | 0.222*** | 7.20 | 0.221*** | 7.08 | 0.231*** | 6.67 | 0.233*** | 6.61 | ||||||
| 制度距离 | 0.228** | 1.99 | 0.205* | 1.66 | 0.482*** | 3.72 | 0.438*** | 3.12 | ||||||
| 文化距离 | 0.320*** | 3.41 | 0.336*** | 3.46 | 0.327*** | 3.10 | 0.338*** | 3.10 | ||||||
| 年龄 | 0.041*** | 13.81 | 0.041*** | 13.85 | ||||||||||
| 男性 | -0.122** | -2.11 | -0.121** | -2.10 | ||||||||||
| 个人月收入 | -0.606*** | -5.06 | -0.606*** | -5.06 | ||||||||||
| 流动时长 | -0.018*** | -4.77 | -0.018*** | -4.81 | ||||||||||
| 高文化程度 | -0.291*** | -2.91 | -0.287*** | -2.86 | ||||||||||
| 家乡土地拥有 | 0.176*** | 5.08 | 0.176*** | 5.05 | ||||||||||
| 人口密度差异 | -0.068 | -0.11 | 0.204 | 0.29 | ||||||||||
| 公共服务差异 | 0.061*** | 2.59 | 0.046* | 1.74 | ||||||||||
| 空气质量差异 | 9.745 | 0.52 | 15.647 | 0.75 | ||||||||||
| 流入地固定效应 | 0.007*** | 2.62 | 0.007** | 2.50 | 0.006* | 1.91 | 0.006* | 1.74 | ||||||
| 户籍地固定效应 | 0.006* | 1.85 | 0.007** | 2.11 | 0.002 | 0.68 | 0.003 | 0.90 | ||||||
| 常数项 | -5.765*** | -31.66 | -5.773*** | -31.51 | -7.101*** | -29.75 | -7.117*** | -29.70 | ||||||
| LR chi2 | 176.90 | 183.95 | 502.79 | 506.07 | ||||||||||
| Prob > chi2 | 0.0000 | 0.0000 | 0.0000 | 0.0000 | ||||||||||
| Log likelihood | -8338.38 | -8334.85 | -6615.72 | -6614.08 | ||||||||||
注:***: p < 0.01,**: p < 0.05,*: p < 0.1。 |
表3 多维距离对回流意愿影响的个体异质性分析结果Tab. 3 Individual heterogeneity results of multidimensional distances influencing return intention |
| 变量 | 模型5:年龄异质性 | 模型6:文化程度异质性 | |||||||
|---|---|---|---|---|---|---|---|---|---|
| 经济距离 | 地理距离 | 制度距离 | 文化距离 | 经济距离 | 地理距离 | 制度距离 | 文化距离 | ||
| 经济距离 | -0.066*** | -0.084*** | |||||||
| 地理距离 | 0.305*** | 0.262*** | |||||||
| 制度距离 | 0.100 | 0.127 | |||||||
| 文化距离 | 0.819*** | 0.747*** | |||||||
| 距离×年龄 | -0.004*** | -0.007*** | 0.003 | -0.014 | |||||
| 距离×文化程度 | -0.069* | -0.226*** | 0.263 | -0.256 | |||||
| 个体变量 | 是 | 是 | 是 | 是 | 是 | 是 | 是 | 是 | |
| 城市变量 | 是 | 是 | 是 | 是 | 是 | 是 | 是 | 是 | |
| 固定效应 | 是 | 是 | 是 | 是 | 是 | 是 | 是 | 是 | |
| 常数项 | -3.957*** | -3.881*** | -3.893*** | -3.854*** | -5.533*** | -5.405*** | -5.450*** | -5.454*** | |
| LR chi2 | 424.40 | 502.40 | 359.22 | 471.14 | 418.28 | 501.76 | 359.96 | 468.69 | |
| Prob > chi2 | 0.0000 | 0.0000 | 0.0000 | 0.0000 | 0.0000 | 0.0000 | 0.0000 | 0.0000 | |
| Log likelihood | -7175.31 | -7136.31 | -6779.13 | -7056.01 | -7178.37 | -7136.63 | -6778.76 | -7057.23 | |
注:***: p < 0.01,**: p < 0.05,*: p < 0.1。 |
表4 多维距离对回流意愿影响的城市异质性分析结果Tab. 4 Urban heterogeneity results of multidimensional distances influencing return intention |
| 变量 | 模型7:城市人口规模异质性 | 模型8:城市经济水平异质性 | |||||||
|---|---|---|---|---|---|---|---|---|---|
| 经济距离 | 地理距离 | 制度距离 | 文化距离 | 经济距离 | 地理距离 | 制度距离 | 文化距离 | ||
| 经济距离 | -0.079*** | -0.093** | |||||||
| 地理距离 | 0.278*** | 0.273*** | |||||||
| 制度距离 | 0.236* | 0.099 | |||||||
| 文化距离 | 0.757*** | 0.764*** | |||||||
| 距离×人口规模 | 0.009 | -0.008 | -0.177** | -0.010 | |||||
| 距离×经济水平 | 0.001 | -0.016** | 0.033 | -0.022 | |||||
| 个体变量 | 是 | 是 | 是 | 是 | 是 | 是 | 是 | 是 | |
| 城市变量 | 是 | 是 | 是 | 是 | 是 | 是 | 是 | 是 | |
| 固定效应 | 是 | 是 | 是 | 是 | 是 | 是 | 是 | 是 | |
| 常数项 | -5.466*** | -5.353*** | -5.337*** | -5.415*** | -5.475*** | -5.324*** | -5.358*** | -5.393*** | |
| LR chi2 | 415.86 | 499.02 | 400.97 | 472.69 | 419.17 | 498.83 | 390.68 | 469.26 | |
| Prob > chi2 | 0.0000 | 0.0000 | 0.0000 | 0.0000 | 0.0000 | 0.0000 | 0.0000 | 0.0000 | |
| Log likelihood | -7179.58 | -7138.00 | -7187.03 | -7055.23 | -7177.93 | -7138.10 | -7192.18 | -7056.95 | |
注:***: p < 0.01,**: p < 0.05,*: p < 0.1。 |
表5 稳健性检验结果Tab. 5 Results of robustness test |
| 变量 | 模型9 | 模型10 | 模型11 | 模型12 | ||||||||||
|---|---|---|---|---|---|---|---|---|---|---|---|---|---|---|
| Coef | Z | Coef | Z | Coef | Z | Coef | Z | |||||||
| 经济距离 | -0.017*** | -7.08 | -0.024*** | -7.30 | -0.014*** | -5.08 | -0.021*** | -5.71 | ||||||
| 地理距离 | 0.265*** | 7.18 | 0.272*** | 7.32 | 0.291*** | 6.94 | 0.300*** | 7.11 | ||||||
| 制度距离 | 0.132* | 1.77 | 0.139* | 1.86 | 0.203** | 2.42 | 0.207** | 2.46 | ||||||
| 文化距离 | 0.331*** | 2.87 | 0.307** | 2.59 | 0.350*** | 2.70 | 0.321** | 2.41 | ||||||
| 年龄 | 0.040*** | 13.97 | 0.040*** | 14.04 | ||||||||||
| 男性 | -0.139** | -2.48 | -0.135** | -2.42 | ||||||||||
| 个人月收入 | -0.652*** | -5.53 | -0.665*** | -5.61 | ||||||||||
| 流动时长 | -0.017*** | -4.65 | -0.018*** | -4.72 | ||||||||||
| 高文化程度 | -0.276*** | -2.86 | -0.274*** | -2.83 | ||||||||||
| 家乡土地拥有 | 0.148*** | 4.42 | 0.151*** | 4.48 | ||||||||||
| 人口密度差异 | 1.313** | 2.20 | 1.643** | 2.41 | ||||||||||
| 公共服务差异 | 0.058*** | 2.62 | 0.040* | 1.73 | ||||||||||
| 环境质量差异 | 9.021 | 1.08 | 25.091 | 1.28 | ||||||||||
| 流入地固定效应 | 0.006** | 2.32 | 0.006** | 2.15 | 0.004 | 1.43 | 0.004 | 1.21 | ||||||
| 户籍地固定效应 | 0.006* | 1.93 | 0.007** | 2.07 | 0.003 | 0.76 | 0.003 | 0.81 | ||||||
| 常数项 | -6.004*** | -29.31 | -6.039*** | -29.38 | -7.315*** | -28.02 | -7.356*** | -28.15 | ||||||
| LR chi2 | 198.55 | 210.34 | 534.54 | 546.05 | ||||||||||
| Prob > chi2 | 0.0000 | 0.0000 | 0.0000 | 0.0000 | ||||||||||
| Log likelihood | -8855.57 | -8849.68 | -7024.31 | -7018.55 | ||||||||||
注:***: p < 0.01,**: p < 0.05,*: p < 0.1。 |
| [1] |
|
| [2] |
National Bureau of Statistics of China. Bulletin of the Seventh National Census (No.7). http://www.stats.gov.cn/tjsj/tjgb/rkpcgb/qgrkpcgb/202106/t20210628_1818826.html, 2021-05-21.
[国家统计局. 第七次全国人口普查公报(第七号). http://www.stats.gov.cn/tjsj/tjgb/rkpcgb/qgrkpcgb/202106/t20210628_1818826.html, 2021-05-21.]
|
| [3] |
[ 白南生, 何宇鹏. 回乡, 还是外出? 安徽四川二省农村外出劳动力回流研究. 社会学研究, 2002, 17(3): 64-78.]
|
| [4] |
[ 李郇, 殷江滨. 劳动力回流: 小城镇发展的新动力. 城市规划学刊, 2012(2): 47-53.]
|
| [5] |
|
| [6] |
|
| [7] |
|
| [8] |
|
| [9] |
|
| [10] |
|
| [11] |
|
| [12] |
|
| [13] |
|
| [14] |
[ 刘达, 郭炎, 栾晓帆, 等. 中部大城市流动人口的回流意愿及其影响因素: 以武汉市为例. 地理研究, 2021, 40(8): 2220-2234.]
|
| [15] |
|
| [16] |
|
| [17] |
[ 刘涛, 卓云霞, 王洁晶. 邻近性对人口再流动目的地选择的影响. 地理学报, 2020, 75(12): 2716-2729.]
|
| [18] |
|
| [19] |
|
| [20] |
|
| [21] |
|
| [22] |
|
| [23] |
[ 黄鑫楠, 孙斌栋, 张婷麟. 地理距离对互联网社会中网络信息传播的影响. 地理学报, 2020, 75(4): 722-735.]
|
| [24] |
|
| [25] |
|
| [26] |
|
| [27] |
[ 张子昂, 保继刚. 多重距离对中国入境与出境旅游流的影响:基于组态的视角. 地理科学, 2021, 41(1): 13-21.]
|
| [28] |
|
| [29] |
|
| [30] |
|
| [31] |
[ 张华, 刘哲达, 殷小冰. 中国跨省流动人口回流意愿的空间差异及影响因素. 地理科学进展, 2021, 40(1): 73-84.]
|
| [32] |
|
| [33] |
|
| [34] |
|
| [35] |
[ 古恒宇, 沈体雁, 刘子亮, 等. 基于空间滤波方法的中国省际人口迁移驱动因素. 地理学报, 2019, 74(2): 222-237.]
|
| [36] |
|
| [37] |
|
| [38] |
|
| [39] |
|
| [40] |
[ 张吉鹏, 黄金, 王军辉, 等. 城市落户门槛与劳动力回流. 经济研究, 2020, 55(7): 175-190.]
|
| [41] |
|
| [42] |
[ 李楠. 文化因素对人口流动的长期影响: 基于中国历史经验的实证分析. 社会, 2015, 35(4): 159-176.]
|
| [43] |
[ 刘毓芸, 徐现祥, 肖泽凯. 劳动力跨方言流动的倒U型模式. 经济研究, 2015, 50(10): 134-146, 162.]
|
| [44] |
|
| [45] |
[ 刘传江, 龙颖桢, 李雪. 城乡统筹背景下农民工迁移范围与行为决策. 南方人口, 2020, 35(6): 66-78.]
|
| [46] |
[ 李帆, 冯虹, 艾小青. 乡村振兴背景下土地资源禀赋对农业转移人口返乡意愿的影响. 人口与经济, 2020(6): 35-47.]
|
| [47] |
[ 曹广忠, 陈思创, 刘涛. 中国五大城市群人口流入的空间模式及变动趋势. 地理学报, 2021, 76(6): 1334-1349.]
|
| [48] |
[ 王西玉, 崔传义, 赵阳. 打工与回乡: 就业转变和农村发展: 关于部分进城民工回乡创业的研究. 管理世界, 2003(7): 99-109, 155.]
|
| [49] |
|
| [50] |
[ 张吉鹏, 卢冲. 户籍制度改革与城市落户门槛的量化分析. 经济学(季刊), 2019, 18(4): 1509-1530.]
|
| [51] |
|
| [52] |
|
| [53] |
[ 林建浩, 赵子乐. 均衡发展的隐形壁垒: 方言、制度与技术扩散. 经济研究, 2017, 52(9): 182-197.]
|
| [54] |
|
| [55] |
|
| [56] |
|
| [57] |
[ 戚伟, 赵美风, 刘盛和. 1982—2010年中国县市尺度流动人口核算及地域类型演化. 地理学报, 2017, 72(12): 2131-2146.]
|
| [58] |
|
| [59] |
|
| [60] |
[ 殷江滨. 我国中西部地区人口空间演变、回流与就业增长. 北京: 人民出版社, 2021.]
|
| [61] |
[ 李强. 影响中国城乡流动人口的推力与拉力因素分析. 中国社会科学, 2003(1): 125-136, 207.]
|
| [62] |
[ 方创琳. 中国城市群地图集. 北京: 科学出版社, 2020.]
|
/
| 〈 |
|
〉 |