
2000—2020年中国省际人口迁移格局的演化特征及影响因素
|
古恒宇(1994-), 男, 广东广州人, 博士, 副研究员, 研究方向为人口迁移与区域发展、城市计算与城市空间治理。E-mail: henry.gu@pku.edu.cn |
收稿日期: 2021-12-09
修回日期: 2022-09-26
网络出版日期: 2022-12-29
基金资助
国家自然科学基金项目(72174219)
国家自然科学基金项目(42101226)
第七次全国人口普查研究课题(RKPCZB06)
中国人口福利基金会青年学者资助计划
Spatiotemporal patterns and determinants of interprovincial migration in China between 2000 and 2020
Received date: 2021-12-09
Revised date: 2022-09-26
Online published: 2022-12-29
Supported by
National Natural Science Foundation of China(72174219)
National Natural Science Foundation of China(42101226)
The Seventh National Population Census Project(RKPCZB06)
China Merchants Foundation and China Population Welfare Foundation
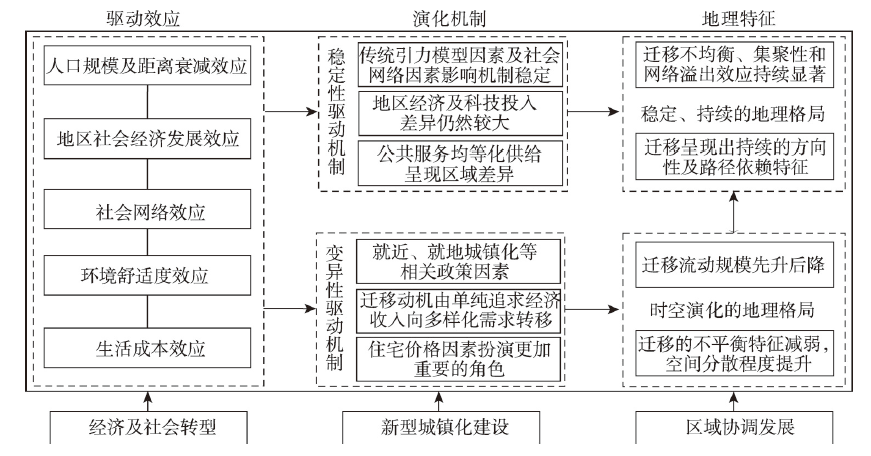
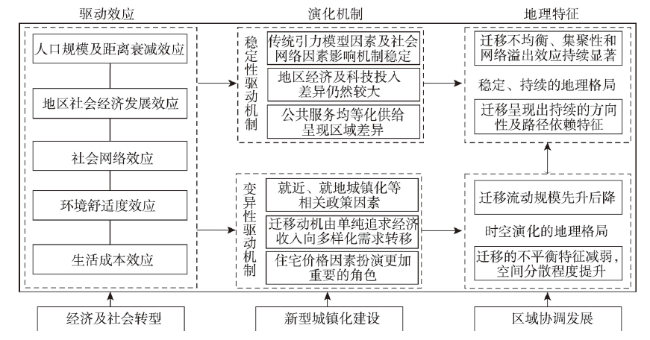
准确认识和把握21世纪前20年中国人口迁移的地理格局和影响因素,是推动新型城镇化建设及区域均衡发展的关键科学问题。借助特征向量空间滤波泊松伪最大似然估计(ESF PPML)引力模型,基于第六次和第七次全国人口普查数据、2005年和2015年全国1%人口抽样调查数据,研究了2000—2020年中国省际人口迁移的时空演化特征及影响因素。主要结论为:① 2000—2020年间人口迁移格局总体稳定,具有较强的不平衡性和网络溢出效应,大量人口从中部、西部、东北地区迁移至东部地区;② 人口迁移格局稳中有变,不平衡程度和空间集聚程度逐渐减弱,人口迁移和人口分布显现出南北分异趋势,东北地区人口迁出强度不断增强; ③ 传统引力模型因素(人口规模、地理距离)、地区社会经济发展因素(工资差异、科技教育投入占比、医疗水平)、社会网络因素、环境舒适度(PM2.5浓度)以及生活成本(住宅价格占比)共同影响人口迁移格局;④ 区域经济差异对省际人口迁移的影响作用逐步弱化,人口迁移逐渐转变为对工资收入、高质量公共服务、环境舒适度等多因素考虑的决策过程,生活成本逐渐对人口迁移产生显著影响。
关键词: 省际人口迁移; 2000—2020年; 第七次全国人口普查; 时空演化格局; 影响因素
古恒宇 , 劳昕 , 温锋华 , 赵志浩 . 2000—2020年中国省际人口迁移格局的演化特征及影响因素[J]. 地理学报, 2022 , 77(12) : 3041 -3054 . DOI: 10.11821/dlxb202212007
Understanding the geographical pattern and driving factors of China's population migration in the first 20 years of the 21st century has become a pivotal issue in promoting the construction of the new-type urbanization and interaction development between regions during the 14th Five-Year Plan period (2021-2025). Supported by the data of the sixth and seventh national population censuses and 2005 and 2015 national 1% population sample surveys, this paper aims to investigate the spatiotemporal evolution characteristics and influencing factors of interprovincial migration in China from 2000 to 2020. Relevant population geospatial analysis and the eigenvector spatial filtering Poisson pseudo-maximum likelihood estimation (ESF PPML) gravity model are employed. The following conclusions are drawn: (1) China's population migration patterns were generally stable from 2000 to 2020, where notable imbalance and network spillover effects were also detected. A large number of migrants from central, western and northeast parts of China tended to move to the eastern region. (2) The overall migration patterns between 2000 and 2020 revealed several changing characteristics. The degree of imbalance and spatial agglomeration of migration patterns gradually weakened. Yet, a north-south differentiation emerged. It is also found that the out-migration trend of the northeast region increased with the elaspe of time. (3) The ESF PPML model indicated that gravity factors (population scale, geographical distance), regional socio-economic factors (wage disparity, proportion of investment in science and technology and education, medical care), social network factors, environmental comfort (PM2.5 concentration) and living costs (proportion of housing price) drove the interprovincial migration pattern between 2000 and 2020. (4) The influence of regional economic differences on interprovincial migration reflected a weakening trend. The pattern of population migration gradually turned into the decision-making of diversified demands for the economy, public services and urban amenities, while the living cost factor represented by housing price had played a gradually significant part. The conclusion of this paper provides policy references for the construction of the new-type urbanization and coordinated development between regions during the 14th Five-Year Plan period in China.
表1 变量解释及描述性统计Tab. 1 Descriptive statistical analysis of variables |
| 变量类型 | 变量 | 描述 | 均值 | 最小值 | 最大值 |
|---|---|---|---|---|---|
| 被解释变量 | Mij | 2000—2005年、2005—2010年、2010—2015年、2015—2020年按现住地i和5年前常住地j统计的跨省迁移人口流量(人) | 57447.210 | 0 | 3066511 |
| 传统引力模型变量 | POPi /POPj | 2000年、2005年、2010年、2015年各省普查时点常住人口规模(万人,自然对数) | 8.147 | 6.210 | 9.292 |
| DISTij | 2000年、2005年、2010年、2015年各省会城市之间铁路最短旅行时间(h) | 21.875 | 0.300 | 89.100 | |
| 地区社会经济发展水平 | WAGEi /WAGEj | 2000年、2005年、2010年、2015年各省城镇单位在岗职工年平均工资(元,自然对数) | 10.077 | 8.842 | 11.621 |
| GDPGi /GDPGj | 1995—2000年、2000—2005年、2005—2010年、2010—2015年各省GDP平均增长率(%) | 12.864 | 2.380 | 24.165 | |
| HTECi /HTECj | 2000年、2005年、2010年、2015年各省科技及教育发展支出占当年财政总支出比重(%) | 17.353 | 11.511 | 23.153 | |
| DOCi /DOCj | 2000年、2005年、2010年、2015年各省平均每个医院拥有执业医师数量(人,自然对数) | 4.531 | 3.747 | 5.181 | |
| 社会网络因素 | MSTOCKij | 1995—2000年、2000—2005年、2005—2010年、2015—2020年各省迁出人口在各迁出地的构成比(i省流向j省的迁移人数/ i省的总迁出人数,%) | 3.440 | 0.000 | 87.317 |
| 地区环境舒适度 | AIRi /AIRj | 2000年、2005年、2010年、2015年各省人口加权PM2.5浓度(μg/m³,自然对数) | 3.776 | 2.734 | 4.725 |
| TEMPi /TEMPj | 1995—2000年、2000—2005年、2005—2010年、2015—2020年各省1月与7月平均温差(℃) | 25.869 | 10.360 | 42.680 | |
| 地区生活成本 | HPi /HPj | 2000年、2005年、2010年、2015年各省住宅销售价格占当年居民可支配收入的比重(%) | 25.615 | 14.748 | 58.993 |
表2 2000—2020年中国省际人口迁移特征统计Tab. 2 Characteristics of China's interprovincial migration during 2000-2020 |
| 2000—2005年 | 2005—2010年 | 2010—2015年 | 2015—2020年 | 总时段 | |
|---|---|---|---|---|---|
| 跨省迁移人口总量(万人) | 3804 | 5756 | 5328 | 5168 | 20056 |
| 莫兰指数(MI) | 0.323*** | 0.346*** | 0.350*** | 0.352*** | 0.343*** |
| 变异系数(CV) | 3.642 | 3.213 | 2.558 | 2.236 | 2.917 |
| 基尼系数(GI) | 0.817 | 0.777 | 0.712 | 0.684 | 0.751 |
注:莫兰指数(Moran's I)的公式为 ,其中 为观测向量的转置, 指代网络权重矩阵;变异系数(CV)的公式为 ;基尼系数(GI)的公式为 ,其中 是第i个观测量, 为均值, 为观测样本量。 |
表3 2000—2020年中国各区域迁出率、迁入率和净迁移率Tab. 3 Out-migration ratio, in-migration ratio, and net-migration ratio of regions during 2000-2020 |
| 年份 | 2000—2005年 | 2005—2010 | 2010—2015年 | 2015—2020年 | |||||||||||
|---|---|---|---|---|---|---|---|---|---|---|---|---|---|---|---|
| 地区 | OMR(%) | IMR(%) | NMR(%) | OMR(%) | IMR(%) | NMR(%) | OMR(%) | IMR(%) | NMR(%) | OMR(%) | IMR(%) | NMR(%) | |||
| 全国 | 3.241 | 3.099 | 0.000 | 4.690 | 4.578 | 0.000 | 4.237 | 4.115 | 0.000 | 3.992 | 3.880 | 0.000 | |||
| 东部地区 | 1.898 | 6.765 | 5.131 | 2.638 | 9.256 | 7.046 | 3.039 | 7.418 | 4.551 | 3.206 | 6.094 | 3.223 | |||
| 北京 | 2.513 | 14.901 | 13.588 | 2.820 | 21.168 | 21.070 | 3.929 | 19.399 | 16.441 | 6.265 | 12.401 | 6.275 | |||
| 天津 | 1.127 | 8.939 | 8.166 | 2.197 | 12.558 | 11.870 | 2.662 | 18.403 | 17.552 | 2.796 | 7.077 | 3.730 | |||
| 河北 | 1.569 | 0.936 | -0.588 | 3.231 | 1.442 | -1.728 | 3.747 | 1.663 | -1.980 | 2.821 | 1.662 | -1.137 | |||
| 上海 | 2.356 | 17.333 | 15.882 | 2.405 | 23.077 | 23.738 | 3.703 | 15.270 | 11.941 | 5.584 | 14.428 | 9.224 | |||
| 江苏 | 1.895 | 4.546 | 2.756 | 2.738 | 6.834 | 4.256 | 2.845 | 6.730 | 3.944 | 3.094 | 5.334 | 2.517 | |||
| 浙江 | 2.384 | 10.749 | 8.860 | 2.977 | 16.855 | 14.859 | 3.414 | 10.723 | 7.408 | 4.077 | 11.045 | 8.143 | |||
| 福建 | 6.884 | 1.150 | -5.550 | 9.914 | 1.542 | -8.626 | 7.603 | 1.940 | -5.499 | 6.001 | 3.698 | -2.332 | |||
| 山东 | 1.315 | 1.043 | -0.229 | 2.382 | 1.545 | -0.795 | 2.454 | 1.405 | -0.997 | 1.904 | 1.807 | -0.056 | |||
| 广东 | 2.152 | 13.565 | 12.230 | 1.909 | 14.714 | 13.716 | 2.619 | 10.499 | 8.085 | 3.148 | 7.537 | 5.175 | |||
| 海南 | 2.246 | 2.432 | 0.441 | 3.148 | 4.382 | 1.339 | 3.612 | 4.001 | 0.566 | 3.263 | 4.242 | 1.399 | |||
| 中部地区 | 4.937 | 0.794 | -4.071 | 7.382 | 1.249 | -6.152 | 5.974 | 1.784 | -4.079 | 4.974 | 2.259 | -2.710 | |||
| 山西 | 1.139 | 0.652 | -0.432 | 2.579 | 1.539 | -0.936 | 3.820 | 1.228 | -2.516 | 3.276 | 1.585 | -1.819 | |||
| 安徽 | 6.884 | 1.150 | -5.550 | 9.914 | 1.542 | -8.626 | 7.603 | 1.940 | -5.499 | 6.001 | 3.698 | -2.332 | |||
| 江西 | 6.576 | 1.241 | -5.077 | 9.067 | 1.778 | -7.169 | 6.511 | 2.100 | -4.248 | 5.542 | 2.895 | -2.667 | |||
| 河南 | 3.994 | 0.314 | -3.605 | 6.386 | 0.517 | -5.951 | 5.654 | 0.965 | -4.621 | 5.290 | 0.821 | -4.320 | |||
| 湖北 | 4.758 | 0.909 | -3.947 | 7.225 | 1.627 | -5.667 | 5.605 | 2.794 | -2.734 | 4.340 | 3.311 | -1.063 | |||
| 湖南 | 5.539 | 0.833 | -4.702 | 7.988 | 1.171 | -6.715 | 6.103 | 1.998 | -3.952 | 4.703 | 2.083 | -2.680 | |||
| 西部地区 | 3.668 | 1.201 | -2.355 | 5.242 | 2.093 | -3.181 | 4.678 | 2.523 | -2.039 | 4.377 | 2.698 | -1.575 | |||
| 内蒙古 | 1.884 | 1.710 | -0.102 | 2.942 | 3.673 | 0.808 | 2.681 | 2.822 | 0.188 | 2.679 | 2.720 | -0.074 | |||
| 广西 | 5.171 | 0.908 | -4.069 | 6.745 | 1.472 | -5.393 | 6.170 | 1.941 | -4.062 | 4.876 | 1.916 | -2.792 | |||
| 重庆 | 5.002 | 1.588 | -3.632 | 7.176 | 2.822 | -4.283 | 5.416 | 3.440 | -1.739 | 4.827 | 4.389 | -0.166 | |||
| 四川 | 5.086 | 0.973 | -4.076 | 6.656 | 1.447 | -5.329 | 4.823 | 2.073 | -2.653 | 4.243 | 2.744 | -1.442 | |||
| 贵州 | 5.514 | 1.519 | -3.686 | 8.026 | 1.918 | -6.500 | 7.726 | 3.040 | -4.592 | 7.422 | 2.441 | -4.595 | |||
| 云南 | 1.542 | 1.124 | -0.327 | 2.731 | 1.510 | -1.156 | 3.395 | 1.779 | -1.526 | 3.748 | 1.975 | -1.802 | |||
| 西藏 | 1.326 | 0.991 | -0.242 | 2.548 | 3.493 | 1.159 | 2.276 | 3.305 | 1.283 | 3.558 | 5.153 | 2.041 | |||
| 陕西 | 2.465 | 0.709 | -1.647 | 3.926 | 2.163 | -1.797 | 3.862 | 3.145 | -0.686 | 3.472 | 2.265 | -1.095 | |||
| 甘肃 | 2.103 | 0.475 | -1.560 | 4.425 | 1.126 | -3.364 | 5.132 | 1.572 | -3.497 | 5.588 | 1.525 | -4.246 | |||
| 青海 | 1.917 | 1.439 | -0.246 | 3.069 | 3.634 | 0.657 | 3.237 | 3.709 | 0.638 | 3.598 | 3.072 | -0.516 | |||
| 宁夏 | 1.346 | 1.336 | 0.128 | 2.825 | 4.252 | 1.613 | 3.553 | 3.022 | -0.340 | 3.265 | 3.801 | 0.796 | |||
| 新疆 | 1.062 | 3.050 | 2.195 | 1.585 | 4.340 | 2.955 | 2.107 | 4.044 | 2.141 | 2.546 | 4.635 | 2.536 | |||
| 东北地区 | 1.959 | 1.041 | -0.861 | 3.010 | 1.817 | -1.167 | 2.784 | 1.476 | -1.293 | 3.215 | 1.828 | -1.654 | |||
| 辽宁 | 1.039 | 1.644 | 0.635 | 1.750 | 2.906 | 1.224 | 1.915 | 1.844 | -0.063 | 2.255 | 2.148 | -0.172 | |||
| 吉林 | 2.069 | 0.827 | -1.208 | 3.394 | 1.343 | -2.047 | 3.096 | 1.182 | -1.893 | 3.161 | 2.124 | -1.390 | |||
| 黑龙江 | 2.938 | 0.527 | -2.298 | 4.133 | 0.912 | -3.229 | 3.554 | 1.269 | -2.270 | 4.347 | 1.182 | -3.664 | |||
注:IMR、OMR、NMR分别指代各区域人口迁入率、人口迁出率及人口净迁移率。 |
表4 2000—2020年中国南、北方地区人口迁移格局和空间分布Tab. 4 Interprovincial migration and population distribution of North China and South China during 2000-2020 |
| 年份 | 2000—2005年 | 2005—2010年 | 2010—2015年 | 2015—2020年 | |||||||
|---|---|---|---|---|---|---|---|---|---|---|---|
| 区域 | 北方地区 | 南方地区 | 北方地区 | 南方地区 | 北方地区 | 南方地区 | 北方地区 | 南方地区 | |||
| OMR(%) | 2.586 | 3.818 | 4.182 | 5.139 | 3.969 | 4.471 | 3.707 | 4.240 | |||
| IMR(%) | 1.462 | 4.549 | 2.546 | 6.351 | 2.753 | 5.303 | 2.497 | 5.012 | |||
| NMR(%) | -1.026 | 0.906 | -1.582 | 1.390 | -1.115 | 0.973 | -1.233 | 1.041 | |||
| 人口占比(%) | 46.963 | 53.037 | 46.580 | 53.410 | 46.612 | 53.388 | 44.985 | 55.015 | |||
注:南方地区与北方地区划分标准为秦岭—淮河线与青藏高原边缘线(南方地区包括:江苏、浙江、上海、湖北、湖南、四川、重庆、云南、贵州、广西、江西、福建、广东、海南、西藏;北方地区包括:北京、天津、内蒙古、新疆、河北、甘肃、宁夏、山西、陕西、青海、山东、河南、安徽、辽宁、吉林、黑龙江);IMR、OMR、NMR分别指代各区域人口迁入率、人口迁出率、人口净迁移率;人口比重以期末5岁及以上人口占全国5岁及以上人口比重计算而得。 |
表5 中国省际人口迁移ESF PPML分时段回归结果Tab. 5 Modeling results of ESF PPML regressions on China's interprovincial migration by period |
| 变量 | 模型1(2000—2020年) | 模型2(2000—2005年) | 模型3(2005—2010年) | 模型4(2010—2015年) | 模型5(2015—2020年) |
|---|---|---|---|---|---|
| Mij | Mij | Mij | Mij | Mij | |
| POPi | 0.866*** (0.057) | 0.906*** (0.064) | 0.981*** (0.065) | 0.873*** (0.083) | 1.199*** (0.073) |
| POPj | 0.438*** (0.054) | 0.299*** (0.077) | 0.513*** (0.076) | 0.353*** (0.083) | 0.475*** (0.063) |
| DISTij | -0.027*** (0.003) | -0.025*** (0.003) | -0.028*** (0.005) | -0.032*** (0.004) | -0.046*** (0.006) |
| WAGEi | -0.832*** (0.174) | -0.914*** (0.209) | -0.179 (0.292) | -0.977*** (0.252) | -0.021 (0.227) |
| WAGEj | 1.822*** (0.148) | 1.645*** (0.266) | 2.177*** (0.233) | 1.670*** (0.304) | 1.749*** (0.206) |
| GDPGi | -0.014* (0.008) | -0.004 (0.026) | -0.074** (0.031) | -0.034* (0.017) | 0.043*** (0.012) |
| GDPGj | 0.007 (0.006) | -0.018 (0.034) | 0.023 (0.019) | 0.008 (0.016) | -0.021 (0.013) |
| HTECi | -0.033*** (0.011) | -0.088*** (0.019) | 0.014 (0.018) | -0.039*** (0.015) | -0.051*** (0.015) |
| HTECj | 0.058** (0.012) | 0.078*** (0.023) | 0.079*** (0.015) | 0.108*** (0.016) | 0.044*** (0.013) |
| DOCi | -0.118 (0.089) | 0.078 (0.163) | -0.655*** (0.200) | -0.352** (0.145) | -0.332*** (0.105) |
| DOCj | 0.374*** (0.103) | 0.650** (0.291) | 0.334* (0.182) | 0.416*** (0.156) | 0.435*** (0.098) |
| MSTOCKij | 0.054*** (0.003) | 0.047*** (0.003) | 0.038*** (0.003) | 0.049*** (0.003) | 0.058*** (0.003) |
| AIRi | 0.397*** (0.075) | 0.570*** (0.078) | 0.345*** (0.121) | 0.373*** (0.086) | -0.303*** (0.096) |
| AIRj | -0.222*** (0.066) | -0.296** (0.126) | -0.472*** (0.105) | -0.225** (0.102) | -0.363*** (0.105) |
| TEMPi | -0.003 (0.005) | -0.015** (0.007) | 0.000 (0.006) | -0.010** (0.005) | 0.034*** (0.005) |
| TEMPj | 0.001 (0.005) | -0.018*** (0.006) | -0.006 (0.006) | -0.009 (0.006) | -0.003 (0.007) |
| HPi | 0.014*** (0.004) | -0.002 (0.008) | -0.022** (0.011) | 0.023*** (0.006) | 0.056*** (0.007) |
| HPj | -0.011*** (0.003) | 0.005 (0.007) | 0.027** (0.012) | -0.015*** (0.005) | -0.013* (0.007) |
| Constant | -12.533*** (2.264) | -9.699*** (3.156) | -19.896*** (3.410) | -7.927** (3.953) | -22.302*** (3.048) |
| 观测量 | 3480 | 870 | 870 | 870 | 870 |
| 时间固定效应 | Yes | Yes | Yes | Yes | Yes |
| 滤波算子数量 | 19 | 16 | 10 | 10 | 15 |
| 残差莫兰指数 | 0.063*** | -0.005 | 0.051*** | 0.096*** | 0.054*** |
| Pseudo R2 | 0.908 | 0.927 | 0.909 | 0.908 | 0.904 |
| AIC | 47909617.91 | 9383046 | 15326732.10 | 11026554.64 | 9888289 |
| BIC | 47909851.79 | 9383213 | 15326870.39 | 11026692.93 | 9888451 |
注:*** p < 0.01,** p < 0.05,* p < 0.1;括号中为聚类到地区对的稳健标准误。 |
| [1] |
|
| [2] |
[ 曹广忠, 陈思创, 刘涛. 中国五大城市群人口流入的空间模式及变动趋势. 地理学报, 2021, 76(6): 1334-1349.]
|
| [3] |
[ 古恒宇, 沈体雁, 刘子亮, 等. 基于空间滤波方法的中国省际人口迁移驱动因素. 地理学报, 2019, 74(2): 222-237.]
|
| [4] |
|
| [5] |
|
| [6] |
|
| [7] |
[ 蒲英霞, 韩洪凌, 葛莹, 等. 中国省际人口迁移的多边效应机制分析. 地理学报, 2016, 71(2): 205-216.]
|
| [8] |
|
| [9] |
|
| [10] |
|
| [11] |
|
| [12] |
|
| [13] |
|
| [14] |
|
| [15] |
|
| [16] |
|
| [17] |
|
| [18] |
[ 杨开忠. 新经济地理学研究. 北京: 北京大学出版社, 2021.]
|
| [19] |
|
| [20] |
|
| [21] |
|
| [22] |
|
| [23] |
|
| [24] |
|
| [25] |
|
| [26] |
|
| [27] |
|
| [28] |
|
| [29] |
|
| [30] |
|
| [31] |
|
| [32] |
[ 杨传开, 宁越敏. 中国省际人口迁移格局演变及其对城镇化发展的影响. 地理研究, 2015, 34(8): 1492-1506.]
|
| [33] |
[ 李扬, 刘慧, 汤青. 1985—2010年中国省际人口迁移时空格局特征. 地理研究, 2015, 34(6): 1135-1148.]
|
| [34] |
[ 刘晏伶, 冯健. 中国人口迁移特征及其影响因素: 基于第六次人口普查数据的分析. 人文地理, 2014, 29(2): 129-137.]
|
| [35] |
[ 王桂新, 潘泽瀚, 陆燕秋. 中国省际人口迁移区域模式变化及其影响因素: 基于2000和2010年人口普查资料的分析. 中国人口科学, 2012(5): 2-13.]
|
| [36] |
[ 段成荣. 省际人口迁移迁入地选择的影响因素分析. 人口研究, 2001, 25(1): 56-61.]
|
| [37] |
|
| [38] |
[ 古恒宇, 沈体雁. 1995—2015年中国省际人口迁移网络的演化特征: 基于异质性劳动力视角. 地理研究, 2021, 40(6): 1823-1839.]
|
| [39] |
[ 刘望保, 汪丽娜, 陈忠暖. 中国省际人口迁移流场及其空间差异. 经济地理, 2012, 32(2): 8-13.]
|
| [40] |
Population Statistics Department of National Bureau of Statistics. China's 2005 1% Population Sample Survey Data. Beijing: China Statistics Press, 2006.
[国家统计局人口和就业统计司. 2005年全国1%人口抽样调查资料. 北京: 中国统计出版社, 2006.]
|
| [41] |
Population Census Office under the State Council, Department of Population and Employment Statistics under the National Bureau of Statistics. Major Figures on 2010 Population Census of China. Beijing: China Statistics Press, 2011.
[国务院人口普查办公室, 国家统计局人口和就业统计司. 2010年第六次全国人口普查主要数据. 北京: 中国统计出版社, 2011.]
|
| [42] |
Population Statistics Department of National Bureau of Statistics. China's 2015 1% Population Sample Survey Data. Beijing: China Statistics Press, 2016.
[国家统计局人口和就业统计司. 2015年全国1%人口抽样调查资料. 北京: 中国统计出版社, 2016.]
|
| [43] |
National Bureau of Statistics. China Statistical Yearbook (1996-2016). Beijing: China Statistics Press, 1996-2016.
[国家统计局. 中国统计年鉴(1996—2016). 北京: 中国统计出版社, 1996-2016.]
|
| [44] |
Transportation Bureau of China Railway Corporation. National Railway Passenger Train Timetable. Beijing: China Railway Press, 2000, 2005, 2010, 2015.
[中国铁路总公司运输局. 全国铁路旅客列车时刻表. 北京: 中国铁路出版社, 2000, 2005, 2010, 2015.]
|
| [45] |
[ 朱宇, 林李月, 柯文前. 国内人口迁移流动的演变趋势: 国际经验及其对中国的启示. 人口研究, 2016, 40(5): 50-60.]
|
| [46] |
|
/
| 〈 |
|
〉 |