
基于“七普”的“胡焕庸线”两侧人口集疏新态势及影响因素
|
戚伟(1989-), 男, 江苏泰州人, 副研究员, 中国地理学会会员(S110007891A), 主要从事城市地理与人口地理研究。E-mail: qiwei@igsnrr.ac.cn |
收稿日期: 2022-03-03
修回日期: 2022-11-06
网络出版日期: 2022-12-29
基金资助
国家自然科学基金项目(42171237)
The novel pattern and driving factors of population spatial distribution on both sides of the "Hu Line" based on seventh census in China
Received date: 2022-03-03
Revised date: 2022-11-06
Online published: 2022-12-29
Supported by
National Natural Science Foundation of China(42171237)
随着新型城镇化建设的推进,“胡焕庸线”两侧人口发展出现了新态势。本文基于第七次人口普查数据,依据地级尺度划定的“准胡焕庸线”,分析2010—2020年“胡焕庸线”两侧人口集疏模式的新特征,并探讨影响因素。研究表明:① “胡焕庸线”依然稳定,2020年东南半壁与西北半壁的人口比为93.5∶6.5;② 西北半壁人口份额仍然微增,但是增幅较之前明显下降; ③ 2010—2020年西北半壁人口集中化指数由降转增,西北半壁和东南半壁的人口分布集中化程度均有所提升;④ 东南半壁人口集疏分化不断强化,2010—2020年人口负增长区的面积占比已达54.22%,超过人口正增长区;西北半壁人口集疏的马太效应特征愈发明显,人口负增长区占比也已升至26.15%;⑤ 省会首府人口增长优势愈发突出,且西北半壁比东南半壁更为明显;⑥ 经济发展水平、城区人口规模等级、行政区划等级等因素与区域人口变动显著相关;西北半壁行政区划等级对人口增长的影响效应尤为突出。综合来看,西北半壁已经出现与东南半壁相似的人口集疏过程,人口集疏模式已突破了“胡焕庸线”。中国即将迎来人口总量拐点,人口城镇化进程逐步减速,密切关注“胡焕庸线”两侧人口发展的新特征,对推动全国各区域协调发展具有重要的战略意义。

戚伟 , 刘盛和 , 刘振 . 基于“七普”的“胡焕庸线”两侧人口集疏新态势及影响因素[J]. 地理学报, 2022 , 77(12) : 3023 -3040 . DOI: 10.11821/dlxb202212006
The "Hu Line" is a geographical line connecting Heihe City and Tengchong City in China. It is densely populated on the southeast side of the "Hu Line" but sparsely populated on the northwest side. Since the implementation of New-type Urbanization strategy in 2014, the spatial pattern of population distribution on both sides of the "Hu Line" has changed a lot. We put forward the "Quasi-Hu Line" based on the boundaries of prefecture-level administrative divisions. According to the seventh population census data in 2020, this study focuses on the new characteristics of population spatial patterns and population growth patterns on both sides of the "Quasi Hu Line" from 2010 to 2020. We analyze the driving factors combined with the development of New-type Urbanization. The main conclusions are as follows: (1) The human-land relationship reflected by the "Hu Line" was still stable, and the overall distributions of densely populated and sparsely populated areas were also steady. In 2020, the population ratio of the southeast side to the northwest side was 93.5∶6.5. (2) The population share of the northwest side still increased slightly, but the increment was significantly lower than that before 2010. (3) The centralization index of the population on the northwest side turned from decline to increase after 2010, which indicated the concentration of spatial population distribution in the northwest half was similar to that in the southeast half. (4) The spatial differentiation of population growth on the southeast side has been strengthened. The negative population growth area accounted for 54.22% of the southeast side from 2010 to 2020, exceeding the positive population growth area. The population growth on the northwest side had also changed from the "relative balance" model to the "Matthew effect" model, with the negative population growth area accounting for 26.14% of the northwest side. (5) The relative population growth advantage of provincial capitals was becoming much more prominent. The spatial polarization process of population growth slowing down or negative growth was formed in the surrounding areas of provincial capitals. In addition, such a process on the northwest side was more significant than on the southeast side. (6) The driving factors, including the level of economic development, the scale of urban population size, and the level of administrative divisions, significantly impacted population growth. For the northwest side, the level of administrative divisions had a particularly significant impact on population growth, while the impact of urban agglomerations was not noticeable. In general, the northwest side had begun to present similar population spatial distribution patterns and driving factors with the southeast side. In the context of population migration and urbanization, the novel patterns of spatial population distribution reflected a kind of "breakthrough" of the "Hu Line". With China's total population turning to decline and urbanization entering the mid-late stages, more attention should be paid to the regional differences and coordination of demographical structures on both sides of the "Hu Line".
表1 地级尺度“准胡焕庸线”两侧空间范围表Tab. 1 The areas on both sides of the "Quasi Hu Line" at prefecture-level scale |
| 区域 | 空间范围 |
|---|---|
| 东南半壁 | 北京市、天津市、河北省、山西省、内蒙古自治区(仅包括赤峰市和通辽市)、辽宁省、吉林省、黑龙江省(不包括大兴安岭地区)、上海市、江苏省、浙江省、安徽省、福建省、江西省、山东省、河南省、湖北省、湖南省、广东省、广西壮族自治区、海南省、重庆市、四川省(不包括阿坝藏族羌族自治州和甘孜藏族自治州)、贵州省、云南省(不包括迪庆藏族自治州和怒江傈僳族自治州)、陕西省(不包括榆林市) |
| 西北半壁 | 内蒙古自治区(不包括赤峰市和通辽市)、黑龙江省(仅包括大兴安岭地区)、四川省(仅包括阿坝藏族羌族自治州和甘孜藏族自治州)、云南省(仅包括迪庆藏族自治州和怒江傈僳族自治州)、西藏自治区、陕西省(仅包括榆林市)、青海省、宁夏回族自治区、新疆维吾尔自治区 |
表2 1982—2020年“胡焕庸线”两侧人口变动统计Tab. 2 Population statistics on both sides of the "Hu Line" from 1982 to 2020 |
| 年份 | 人口规模(亿人) | 人口份额(%) | 人口密度(人/km2) | |||||
|---|---|---|---|---|---|---|---|---|
| 东南半壁 | 西北半壁 | 东南半壁 | 西北半壁 | 东南半壁 | 西北半壁 | |||
| 2020 | 13.18 | 0.92 | 93.50 | 6.50 | 321.87 | 17.23 | ||
| 2010 | 12.46 | 0.86 | 93.52 | 6.48 | 304.36 | 16.24 | ||
| 2000 | 11.64 | 0.79 | 93.67 | 6.33 | 284.23 | 14.78 | ||
| 1990 | 10.61 | 0.69 | 93.88 | 6.12 | 259.14 | 13.01 | ||
| 1982 | 9.45 | 0.60 | 93.99 | 6.01 | 230.69 | 11.35 | ||
注:① 依据地级尺度的“准胡焕庸线”,将中国划分为东南半壁和西北半壁;② 依据1982—2010年可对比的人口空间数据和2010—2020年可对比的人口空间数据库,开展数据核算,虽然两套数据库空间单元存在差异,但是核算出来的2010年胡焕庸线两侧人口数据一致。 |
表3 1982—2020年“胡焕庸线”两侧人口分布集中化指数及相关参数Tab. 3 Population Gini coefficients and the related parameters on both sides of the "Hu Line" from 1982 to 2020 |
| 年份 | 人口集中化指数 | 10%人口累计水平上的面积 累计百分比(%) | 50%人口累计水平上的面积 累计百分比(%) | ||||||||
|---|---|---|---|---|---|---|---|---|---|---|---|
| 全国 | 东南半壁 | 西北半壁 | 全国 | 东南半壁 | 西北半壁 | 全国 | 东南半壁 | 西北半壁 | |||
| 2020※ | 0.325 | 0.270 | 0.262 | 0.54 | 1.23 | 0.41 | 8.76 | 18.35 | 5.83 | ||
| 2010※ | 0.284 | 0.217 | 0.253 | 0.78 | 1.61 | 0.55 | 9.68 | 20.01 | 5.89 | ||
| 2010△ | 0.263 | 0.185 | 0.257 | 0.82 | 1.58 | 0.56 | 9.62 | 19.99 | 6.05 | ||
| 2000△ | 0.244 | 0.157 | 0.264 | 1.10 | 2.34 | 0.58 | 10.16 | 21.26 | 6.05 | ||
| 1990△ | 0.230 | 0.136 | 0.268 | 1.35 | 2.81 | 0.56 | 10.69 | 22.42 | 6.19 | ||
| 1982△ | 0.237 | 0.142 | 0.276 | 1.37 | 2.81 | 0.39 | 10.61 | 22.79 | 5.74 | ||
注:※采用的是2010—2020年可对比的人口空间数据库,共358个地级空间单元;△采用的1982—2010年可对比的人口空间数据库,共340个地级空间单元。 |
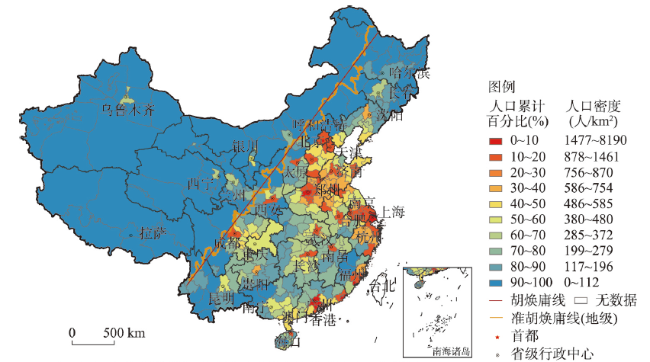
图1 2020年中国人口密度分布图(按照全国的人口累计百分比分级)注:基于自然资源部标准地图服务网站GS(2016)1570号标准地图制作,底图边界无修改。 Fig. 1 Spatial distribution of China's population density in 2020 based on cumulative population percentage at national level |
表4 2020年“胡焕庸线”两侧人口密度排序表(部分)Tab. 4 The ranking lists based on population density on both sides of the "Hu Line" in 2020 (Some prefectures) |
| 人口密度位序 | 全国 | 东南半壁 | 西北半壁 | |||||
|---|---|---|---|---|---|---|---|---|
| 地级单元名称 | 人口密度(人/km2) | 地级单元名称 | 人口密度(人/km2) | 地级单元名称 | 人口密度(人/km2) | |||
| 正1 | 深圳市 | 8190.34 | 深圳市 | 8190.34 | 银川市 | 415.15 | ||
| 正2 | 东莞市 | 4253.98 | 东莞市 | 4253.98 | 乌海市 | 336.64 | ||
| 正3 | 上海市 | 3114.34 | 上海市 | 3114.34 | 兰州市 | 330.26 | ||
| 正4 | 厦门市 | 2923.48 | 厦门市 | 2923.48 | 西宁市 | 324.88 | ||
| 正5 | 广州市 | 2524.13 | 广州市 | 2524.13 | 乌鲁木齐市 | 285.36 | ||
| 正6 | 佛山市 | 2500.79 | 佛山市 | 2500.79 | 临夏州 | 259.42 | ||
| 正7 | 中山市 | 2432.37 | 中山市 | 2432.37 | 嘉峪关市 | 255.29 | ||
| 正8 | 汕头市 | 2343.71 | 汕头市 | 2343.71 | 天水市 | 209.04 | ||
| 正9 | 郑州市 | 1676.47 | 郑州市 | 1676.47 | 呼和浩特市 | 200.63 | ||
| 正10 | 无锡市 | 1593.39 | 无锡市 | 1593.39 | 石嘴山市 | 184.17 | ||
| 正11 | 苏州市 | 1477.30 | 苏州市 | 1477.30 | 平凉市 | 166.20 | ||
| 正12 | 成都市 | 1460.63 | 成都市 | 1460.63 | 定西市 | 128.63 | ||
| 正13 | 武汉市 | 1437.49 | 武汉市 | 1437.49 | 固原市 | 108.49 | ||
| 正14 | 南京市 | 1413.87 | 南京市 | 1413.87 | 自治区直辖 | 107.36 | ||
| 正15 | 北京市 | 1334.38 | 北京市 | 1334.38 | 海东市 | 104.48 | ||
| 正16 | 珠海市 | 1247.95 | 珠海市 | 1247.95 | 包头市 | 98.17 | ||
| 正17 | 常州市 | 1208.25 | 常州市 | 1208.25 | 陇南市 | 86.33 | ||
| 正18 | 西安市 | 1204.35 | 西安市 | 1204.35 | 榆林市 | 84.43 | ||
| 正19 | 嘉兴市 | 1172.96 | 嘉兴市 | 1172.96 | 吴忠市 | 82.27 | ||
| 正20 | 海口市 | 1153.60 | 海口市 | 1153.60 | 庆阳市 | 80.41 | ||
| 正21 | 天津市 | 1146.53 | 天津市 | 1146.53 | 中卫市 | 78.25 | ||
| 正22 | 揭阳市 | 1052.61 | 揭阳市 | 1052.61 | 白银市 | 75.23 | ||
| 倒11 | 哈密市 | 4.91 | 白城市 | 60.22 | 哈密市 | 4.91 | ||
| 倒10 | 日喀则市 | 4.45 | 牡丹江市 | 58.99 | 日喀则市 | 4.45 | ||
| 倒9 | 大兴安岭地区 | 3.99 | 白山市 | 55.60 | 大兴安岭地区 | 3.99 | ||
| 倒8 | 巴州 | 3.42 | 普洱市 | 54.35 | 巴州 | 3.43 | ||
| 倒7 | 林芝市 | 3.04 | 双鸭山市 | 52.79 | 林芝市 | 3.04 | ||
| 倒6 | 果洛州 | 2.90 | 通辽市 | 48.79 | 果洛州 | 2.90 | ||
| 倒5 | 玉树州 | 2.22 | 赤峰市 | 46.43 | 玉树州 | 2.22 | ||
| 倒4 | 海西州 | 1.80 | 延边州 | 45.89 | 海西州 | 1.80 | ||
| 倒3 | 那曲市 | 1.24 | 伊春市 | 26.77 | 那曲市 | 1.24 | ||
| 倒2 | 阿拉善盟 | 1.10 | 神龙架林区 | 20.55 | 阿拉善盟 | 1.10 | ||
| 倒1 | 阿里地区 | 0.37 | 黑河市 | 19.23 | 阿里地区 | 0.37 | ||
注:① 巴州、果洛州、玉树州、海西州、延边州、临夏州和自治区直辖的全称分别为巴音郭楞蒙古自治州、果洛藏族自治州、玉树藏族自治州、海西蒙古族藏族自治州、延边朝鲜族自治州、临夏回族自治州和新疆维吾尔自治区的自治区直辖县级行政区划。② 全国列项中,正1至正22位序包含2020年所有常住人口密度超过1000人/km2的地级单元,倒1至倒11位序包含2020年所有常住人口密度低于5人/km2的地级单元。 |
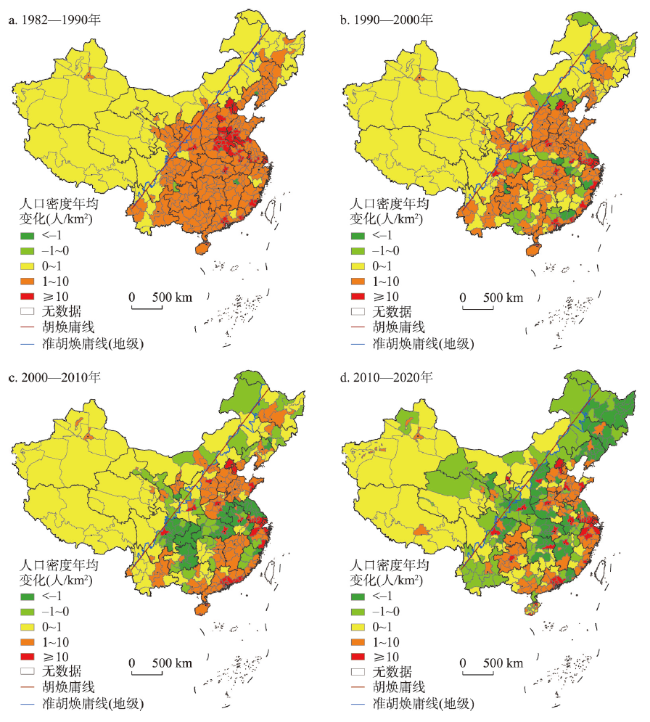
图2 1982—2020年中国人口密度年均变化注:基于自然资源部标准地图服务网站GS(2016)1585号标准地图制作,底图边界无修改。 Fig. 2 Spatial distributions of average annual changes of population density in China from 1982 to 2020 |
表5 1982—2020年“胡焕庸线”两侧人口密度年均变化统计表Tab. 5 Statistics of annual average changes of population density on both sides of the "Hu Line" from 1982 to 2020 |
| 年份 | 人口密度年均变化区间(人/km2) | 数量(个) | 面积占比(%) | |||||
|---|---|---|---|---|---|---|---|---|
| 全国 | 东南半壁 | 西北半壁 | 全国 | 东南半壁 | 西北半壁 | |||
| 2010—2020年 | < -1 | 86 | 83 | 3 | 12.84 | 28.09 | 1.09 | |
| -1~0 | 70 | 50 | 20 | 25.53 | 26.13 | 25.15 | ||
| 0~1 | 76 | 45 | 31 | 47.41 | 15.99 | 71.61 | ||
| 1~10 | 92 | 82 | 10 | 11.52 | 23.74 | 2.11 | ||
| ≥ 10 | 34 | 33 | 1 | 2.71 | 6.05 | 0.13 | ||
| 正增长合计 | 202 | 160 | 42 | 61.63 | 45.78 | 73.85 | ||
| 负增长合计 | 156 | 133 | 23 | 38.37 | 54.22 | 26.15 | ||
| 2000—2010年 | < -1 | 49 | 48 | 1 | 7.09 | 16.01 | 0.20 | |
| -1~0 | 45 | 35 | 10 | 13.87 | 17.00 | 11.46 | ||
| 0~1 | 86 | 46 | 40 | 60.66 | 28.24 | 85.69 | ||
| 1~10 | 127 | 114 | 13 | 16.09 | 33.49 | 2.65 | ||
| ≥ 10 | 33 | 33 | 0 | 2.29 | 5.26 | 0.00 | ||
| 正增长合计 | 246 | 193 | 53 | 79.04 | 66.99 | 88.35 | ||
| 负增长合计 | 94 | 83 | 11 | 20.96 | 33.01 | 11.65 | ||
| 1990—2000年 | < -1 | 9 | 9 | 0 | 1.18 | 2.71 | 0.00 | |
| -1~0 | 25 | 23 | 2 | 7.15 | 13.04 | 2.61 | ||
| 0~1 | 103 | 56 | 47 | 66.68 | 31.42 | 93.92 | ||
| 1~10 | 178 | 163 | 15 | 23.36 | 49.11 | 3.48 | ||
| ≥10 | 25 | 25 | 0 | 1.62 | 3.72 | 0.00 | ||
| 正增长合计 | 306 | 244 | 62 | 91.67 | 84.25 | 97.39 | ||
| 负增长合计 | 34 | 32 | 2 | 8.33 | 15.75 | 2.61 | ||
| 1982—1990年 | < -1 | 3 | 3 | 0 | 0.15 | 0.34 | 0.00 | |
| -1~0 | 1 | 1 | 0 | 0.13 | 0.30 | 0.00 | ||
| 0~1 | 68 | 25 | 43 | 62.37 | 20.97 | 94.34 | ||
| 1~10 | 222 | 201 | 21 | 34.05 | 70.80 | 5.66 | ||
| ≥ 10 | 46 | 46 | 0 | 3.31 | 7.59 | 0.00 | ||
| 正增长合计 | 336 | 272 | 64 | 99.72 | 99.36 | 100.00 | ||
| 负增长合计 | 4 | 4 | 0 | 0.28 | 0.64 | 0 | ||
注:① 东南半壁和西北半壁的划分依据是地级尺度的“准胡焕庸线”;② 1982—2010年可对比的人口空间数据和2010—2020年可对比的人口空间数据库的空间单元数量存在差异;③ “面积占比”各列自左向右分别对应为占全国的面积比重、占东南半壁的面积比重和占西北半壁的面积比重。 |
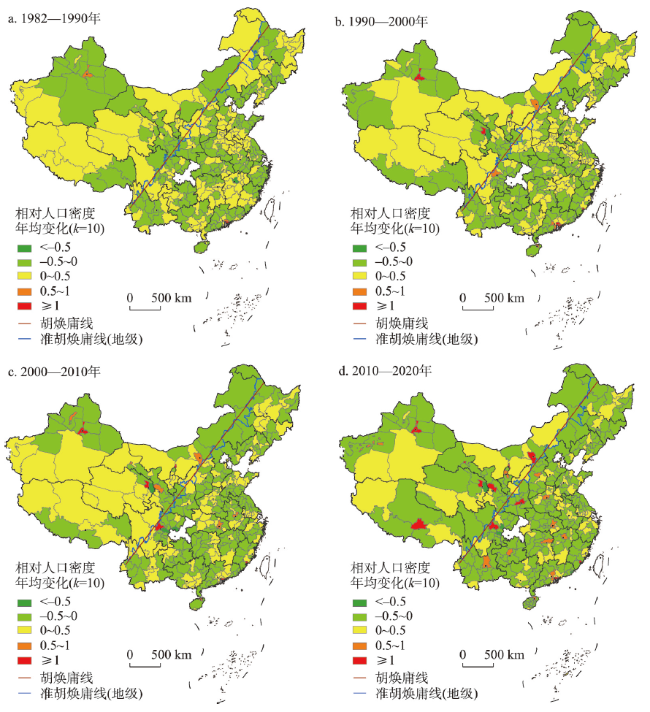
图3 1982—2020年中国相对人口密度年均变化指数注:基于自然资源部标准地图服务网站GS(2016)1585号标准地图制作,底图边界无修改;北京市、上海市、天津市和重庆市属于省级单元,不参与相对人口密度的核算。 Fig. 3 Spatial distributions of average annual changes of relative density of population in China from 1982 to 2020 |
表6 1982—2020年“胡焕庸线”两侧相对人口密度年均变化统计表Tab. 6 Statistics of annual average changes of relative density of population on both sides of the "Hu Line" from 1982 to 2020 |
| 年份 | 人口密度年均 变化区间(人/km2) | 数量(个) | 面积占比(%) | |||||
|---|---|---|---|---|---|---|---|---|
| 全国 | 东南半壁 | 西北半壁 | 全国 | 东南半壁 | 西北半壁 | |||
| 2010—2020年 | < -0.5 | 4 | 3 | 1 | 0.28 | 0.33 | 0.24 | |
| -0.5~0 | 247 | 209 | 38 | 66.24 | 77.08 | 58.13 | ||
| 0~0.5 | 80 | 63 | 17 | 31.17 | 19.78 | 39.68 | ||
| 0.5~1 | 12 | 10 | 2 | 1.09 | 2.08 | 0.35 | ||
| ≥ 1 | 11 | 4 | 7 | 1.22 | 0.73 | 1.59 | ||
| 正增长合计 | 103 | 77 | 26 | 33.48 | 22.59 | 41.62 | ||
| 负增长合计 | 251 | 212 | 39 | 66.52 | 77.41 | 58.38 | ||
| 2000—2010年 | < -0.5 | 3 | 2 | 1 | 0.30 | 0.36 | 0.25 | |
| -0.5~0 | 190 | 162 | 28 | 49.35 | 65.13 | 37.52 | ||
| 0~0.5 | 130 | 102 | 28 | 49.33 | 33.72 | 61.04 | ||
| 0.5~1 | 7 | 3 | 4 | 0.60 | 0.40 | 0.75 | ||
| ≥ 1 | 6 | 3 | 3 | 0.42 | 0.40 | 0.44 | ||
| 正增长合计 | 143 | 108 | 35 | 50.35 | 34.51 | 62.23 | ||
| 负增长合计 | 193 | 164 | 29 | 49.65 | 65.49 | 37.77 | ||
| 1990—2000年 | < -0.5 | 1 | 0 | 1 | 0.14 | 0.00 | 0.25 | |
| -0.5~0 | 178 | 145 | 33 | 50.30 | 60.70 | 42.50 | ||
| 0~0.5 | 145 | 119 | 26 | 48.83 | 38.61 | 56.49 | ||
| 0.5~1 | 6 | 5 | 1 | 0.42 | 0.54 | 0.33 | ||
| ≥ 1 | 6 | 3 | 3 | 0.32 | 0.15 | 0.44 | ||
| 正增长合计 | 157 | 127 | 30 | 49.56 | 39.30 | 57.25 | ||
| 负增长合计 | 179 | 145 | 34 | 50.44 | 60.70 | 42.75 | ||
| 1982—1990年 | < -0.5 | 1 | 1 | 0 | 0.08 | 0.19 | 0.00 | |
| -0.5~0 | 170 | 140 | 30 | 48.13 | 54.50 | 43.36 | ||
| 0~0.5 | 160 | 128 | 32 | 51.56 | 45.18 | 56.34 | ||
| 0.5~1 | 3 | 2 | 1 | 0.19 | 0.09 | 0.27 | ||
| ≥ 1 | 2 | 1 | 1 | 0.04 | 0.05 | 0.03 | ||
| 正增长合计 | 165 | 131 | 34 | 51.79 | 45.31 | 56.64 | ||
| 负增长合计 | 171 | 141 | 30 | 48.21 | 54.69 | 43.36 | ||
注:① 东南半壁和西北半壁的划分依据是地级尺度的“准胡焕庸线”;② 1982—2010年可对比的人口空间数据和2010—2020年可对比的人口空间数据库的空间单元数量存在差异;③ “面积占比”各列自左向右分别对应占全国的面积比重、占东南半壁的面积比重和占西北半壁的面积比重;④ “相对人口密度年均变化指数”的核算不包括北京市、上海市、天津市和重庆市4个直辖市。 |
表7 2010—2020年“胡焕庸线”两侧人口变动影响因素的地理探测结果Tab. 7 Geodetector statistics of factors related to population changes on both sides of the "Hu Line" from 2010 to 2020 |
| 因素 | 人口密度年均变化 | 相对人口密度年均变化指数 | |||||
|---|---|---|---|---|---|---|---|
| 全国 | 东南半壁 | 西北半壁 | 全国 | 东南半壁 | 西北半壁 | ||
| 总人口规模等级 | 0.053*** | 0.048*** | 0.054 | 0.023* | 0.049*** | 0.044 | |
| 城区人口规模等级 | 0.286*** | 0.283*** | 0.487*** | 0.279*** | 0.381*** | 0.417*** | |
| 城市群类型 | 0.042*** | 0.037** | 0.111 | 0.025** | 0.020 | 0.043 | |
| 行政区划等级 | 0.041*** | 0.046*** | 0.516*** | 0.331*** | 0.246*** | 0.683*** | |
| 经济水平 | 0.140*** | 0.158*** | 0.166* | 0.120*** | 0.149*** | 0.149* | |
| 生态地理区类型 | 0.138*** | 0.134*** | 0.097 | 0.072 | 0.050 | 0.093 | |
注:***、**、*分别表示在1%、5%、10%的水平下显著。 |
| [1] |
[ 吴传钧. 胡焕庸大师对发展中国地理学的贡献. 人文地理, 2001, 16(5): 1-4.]
|
| [2] |
[ 刘劲松. 中国人口地理研究进展. 地理学报, 2014, 69(8): 1177-1189.]
|
| [3] |
|
| [4] |
|
| [5] |
[ 刘涛, 齐元静, 曹广忠. 中国流动人口空间格局演变机制及城镇化效应: 基于2000和2010年人口普查分县数据的分析. 地理学报, 2015, 70(4): 567-581.]
|
| [6] |
|
| [7] |
[ 朱宇, 林李月, 柯文前. 国内人口迁移流动的演变趋势: 国际经验及其对中国的启示. 人口研究, 2016, 40(5): 50-60.]
|
| [8] |
[ 胡焕庸. 中国人口之分布: 附统计图与密度图. 地理学报, 1935, 2(2): 33-74.]
|
| [9] |
[ 胡焕庸, 等. 中华人民共和国人口分布密度图. 北京: 中国地图出版社, 1989.]
|
| [10] |
[ 丁金宏, 程晨, 张伟佳, 等. 胡焕庸线的学术思想源流与地理分界意义. 地理学报, 2021, 76(6): 1317-1333.]
|
| [11] |
[ 葛美玲, 封志明. 基于GIS的中国2000年人口之分布格局研究: 兼与胡焕庸1935年之研究对比. 人口研究, 2008, 32(1): 51-57.]
|
| [12] |
[ 郭华东, 王心源, 吴炳方, 等. 基于空间信息认知人口密度分界线: “胡焕庸线”. 中国科学院院刊, 2016, 31(12): 1385-1394. ]
|
| [13] |
[ 王铮, 夏海斌, 田园, 等. 胡焕庸线存在性的大数据分析: 中国人口分布特征的生态学及新经济地理学认识. 生态学报, 2019, 39(14): 5166-5177.]
|
| [14] |
[ 戚伟, 刘盛和, 赵美风. “胡焕庸线”的稳定性及其两侧人口集疏模式差异. 地理学报, 2015, 70(4): 551-566.]
|
| [15] |
[ 陈明星, 李扬, 龚颖华, 等. 胡焕庸线两侧的人口分布与城镇化格局趋势: 尝试回答李克强总理之问. 地理学报, 2016, 71(2): 179-193.]
|
| [16] |
[ 李佳洺, 陆大道, 徐成东, 等. 胡焕庸线两侧人口的空间分异性及其变化. 地理学报, 2017, 72(1): 148-160.]
|
| [17] |
[ 尹文耀, 尹星星, 颜卉. 从六十五年发展看胡焕庸线. 中国人口科学, 2016(1): 25-40, 126.]
|
| [18] |
[ 黄贤金, 金雨泽, 徐国良, 等. 胡焕庸亚线构想与长江经济带人口承载格局. 长江流域资源与环境, 2017, 26(12): 1937-1944.]
|
| [19] |
[ 戚伟, 刘盛和, 周亮. 青藏高原人口地域分异规律及“胡焕庸线”思想应用. 地理学报, 2020, 75(2): 255-267.]
|
| [20] |
[ 黄成, 杜宇, 吴传清. 主体功能区建设与“胡焕庸线”破解. 学习与实践, 2019(4): 24-34.]
|
| [21] |
[ 单良, 马雪娇, 董晓菲. “一带一路”助推破解“胡焕庸线”. 党政干部学刊, 2018(4): 57-63.]
|
| [22] |
[ 程广帅, 胡锦锈. 信息化、就业增长与人口流动: 基于“胡焕庸线”的分析. 新疆大学学报(哲学·人文社会科学版), 2021, 49(5): 11-18.]
|
| [23] |
[ 张梅, 黄贤金, 揣小伟, 等. 胡焕庸线两侧城镇建设用地变化及其碳排放差异. 资源科学, 2019, 41(7): 1262-1273.]
|
| [24] |
[ 陆大道, 王铮, 封志明, 等. 关于“胡焕庸线能否突破”的学术争鸣. 地理研究, 2016, 35(5): 805-824.]
|
| [25] |
[ 王开泳, 邓羽. 新型城镇化能否突破“胡焕庸线”: 兼论“胡焕庸线”的地理学内涵. 地理研究, 2016, 35(5): 825-835.]
|
| [26] |
[ 尹德挺, 袁尚. 新中国70年来人口分布变迁研究: 基于“胡焕庸线”的空间定量分析. 中国人口科学, 2019(5): 15-28, 126.]
|
| [27] |
[ 戚伟, 王开泳. 中国城市行政地域与实体地域的空间差异及优化整合. 地理研究, 2019, 38(2): 207-220.]
|
| [28] |
[ 陈宗兴, 等. 经济活动的空间分析. 西安: 陕西出版集团陕西人民出版社, 2012: 19-20.]
|
| [29] |
[ 王劲峰, 徐成东. 地理探测器: 原理与展望. 地理学报, 2017, 72(1): 116-134.]
|
| [30] |
[ 刘睿文, 封志明, 游珍. 中国人口集疏格局与形成机制研究. 中国人口·资源与环境, 2010, 20(3): 89-94.]
|
| [31] |
[ 吴绍洪, 杨勤业, 郑度. 生态地理区域界线划分的指标体系. 地理科学进展, 2002, 21(4): 302-310.]
|
| [32] |
[ 李建新, 杨珏. “胡焕庸线”以西的西部人口格局. 西北民族研究, 2018(1): 191-202.]
|
| [33] |
[ 高向东, 王新贤, 朱蓓倩. 基于“胡焕庸线”的中国少数民族人口分布及其变动. 人口研究, 2016, 40(3): 3-17.]
|
| [34] |
[ 柯文前, 朱宇, 陈晨, 等. 1995—2015年中国人口迁移的时空变化特征. 地理学报, 2022, 77(2): 411-425.]
|
| [35] |
[ 刘涛, 彭荣熙, 卓云霞, 等. 2000—2020年中国人口分布格局演变及影响因素. 地理学报, 2022, 77(2): 381-394.]
|
/
| 〈 |
|
〉 |