
RCP 8.5气候变化情景下21世纪印度粮食单产变化的多模式集合模拟
收稿日期: 2018-05-28
要求修回日期: 2019-08-22
网络出版日期: 2019-11-01
基金资助
国家重点研发计划(2016YFA0600401)
中国科学院重点部署项目(ZDRW-ZS-2016-6)
中国科学院重点部署项目(QYZDB-SSW-DQC 005)
中国科学院地理科学与资源研究所杰出青年人才基金项目(2015RC101)
中国科学院青年创新促进会(2015038)
版权
Multi-model ensemble projection of crop yield of India under RCP 8.5 climate change scenario during the 21st century
Received date: 2018-05-28
Request revised date: 2019-08-22
Online published: 2019-11-01
Supported by
The National Key Research and Development Program of China(2016YFA0600401)
Key Program from CAS, No.ZDRW-ZS-2016-6(ZDRW-ZS-2016-6)
Key Program from CAS(QYZDB-SSW-DQC 005)
Outstanding Young Scholars from IGSNRR(2015RC101)
Youth Innovation Promotion Association CAS(2015038)
Copyright
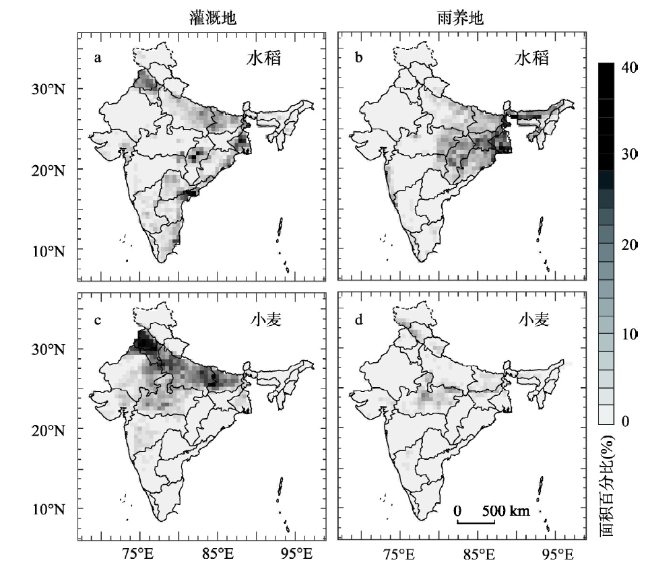
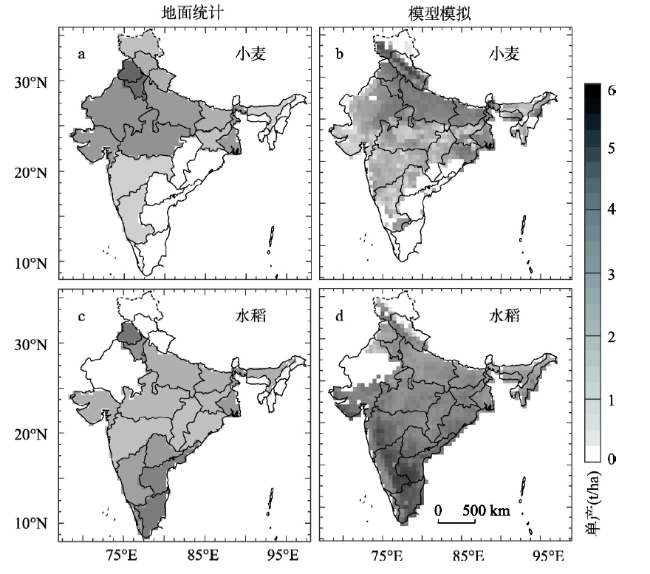
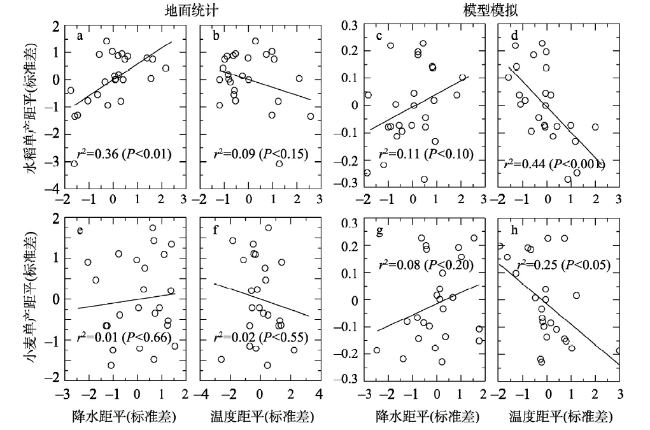
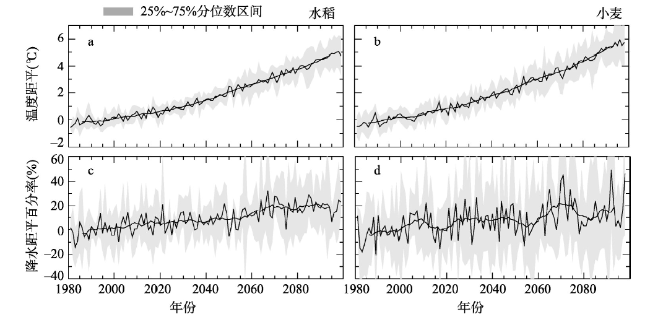
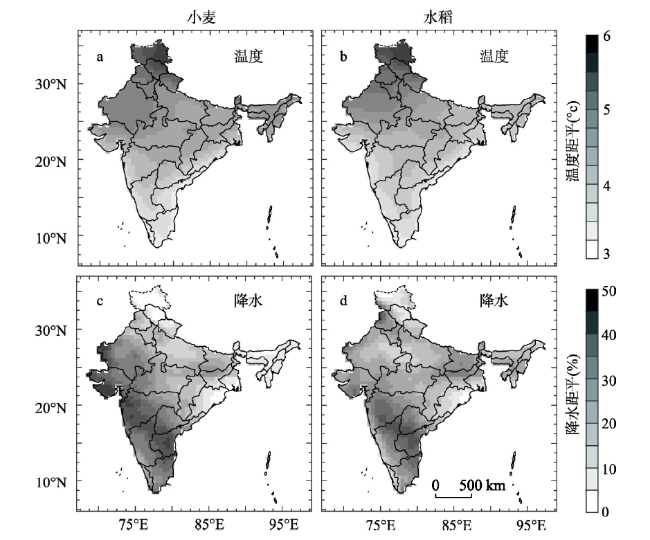
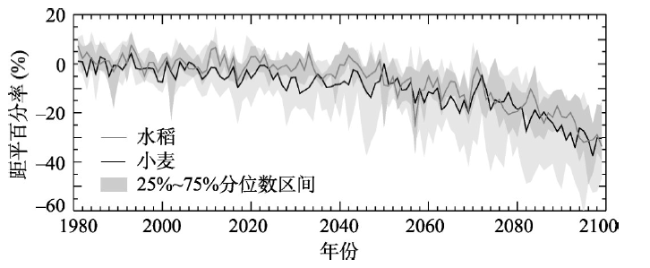
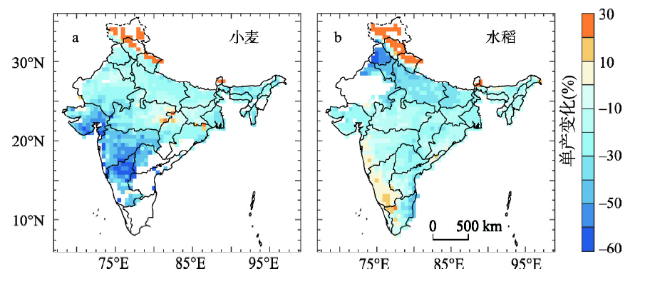
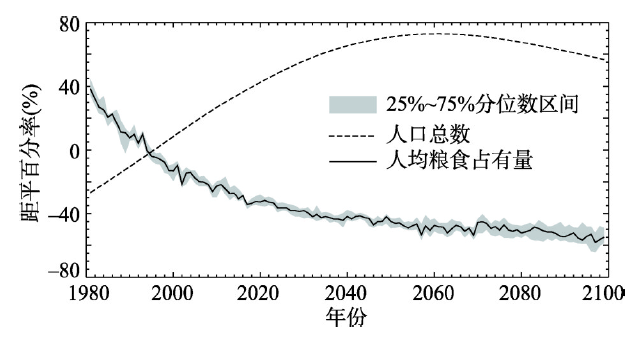
基于跨部门影响模型比较计划(ISI-MIP)中20种气候模式与作物模型组合的模拟结果,预估了RCP 8.5排放情景下21世纪印度小麦和水稻单产变化。研究发现:① 多模式集合模拟结果基本再现了印度小麦和水稻单产的空间差异;同时,再现了小麦和水稻单产对温度和降水变化的响应特征:与温度呈负相关,与降水呈正相关。② RCP 8.5情景下,水稻和小麦生长季温度和降水均呈增加趋势,小麦生长季的温度、降水增加幅度大于水稻。空间上,温度增加幅度自北向南逐渐减小,降水增幅则逐渐增加,并且小麦种植区升温幅度大于非种植区,降水增幅则少于非种植区,水稻种植区升温幅度小于非种植区,降水增幅则多于非种植区。③ RCP 8.5情景下,小麦和水稻单产均呈下降趋势,21世纪后半叶尤为明显。小麦单产的下降速度明显大于水稻,其中21世纪前半叶小麦和水稻单产下降速度约分别为1.3%/10a (P < 0.001)和0.7%/10a (P < 0.05),后半叶分别增至4.9%/10a (P < 0.001)和4.4%/10a (P < 0.001)。小麦和水稻单产变化存在明显的空间异质性,小麦单产的最大下降幅度出现在德干高原西南部,降幅约60%,水稻单产最大下降幅度出现在印度河平原北部,降幅约50%。这意味着未来气候变化情景下印度粮食供给将面临较大的挑战。
张学珍 , 李侠祥 , 张丽娟 , 席建超 , 戴尔阜 . RCP 8.5气候变化情景下21世纪印度粮食单产变化的多模式集合模拟[J]. 地理学报, 2019 , 74(11) : 2314 -2328 . DOI: 10.11821/dlxb201911009
Using the multi-model ensemble projections of wheat and rice in India during the 21st century from the Inter-Sectoral Impact Model Intercomparison Project, this study assessed the future changes in crop yield under the RCP 8.5 emission scenario. The results show that the multi-model ensemble simulations generally reproduce the spatial variability in crop yield that is represented by ground measurements. Furthermore, the simulations reproduce the response of crop yield to climate changes, which is characterized by negative correlations between crop yield and temperature and positive correlations between crop yield and precipitation. Under the RCP8.5 emission scenario, temperature and precipitation during the growing season of wheat and rice will increase. Generally, temperature will increase at a higher rate than precipitation; the increases in temperature and precipitation during the wheat growing season will be stronger than that during the rice growing season. In terms of spatial dimension, the increase in temperature will be weakened gradually from the north to the south, while that of precipitation will be intensified gradually from the north to the south. Temperature increase in the wheat producing areas will be stronger than that in the wheat non-producing area, while precipitation increase in the wheat producing areas will be weaker than that in the wheat non-producing areas. However, the scenario is predicted to be reversed for the rice producing areas. In response to the climate changes, wheat and rice yields will decrease in the 21st century, particularly in the second half. The decrease in wheat yield will be greater than that of rice yield. In the first half of the 21st century, wheat and rice yields are predicted to decrease at the rates of 1.3%/10 a (P < 0.001) and 0.7%/10 a (P < 0.05), respectively. In the second half of the 21st century, they are predicted to decrease at the rates of 4.9%/10 a (P < 0.001) and 4.4%/10 a (P < 0.05), respectively. The drought stress resulting from climate warming might be the main reason for this projected yield reduction. The greatest decrease in wheat yield (as high as 60%) will occur in the southwest part of the Deccan Plateau, and the greatest decrease in rice yield (as high as 50%) will occur in the northern part of the Gangetic Plain. These findings suggest that food supply in India will face extreme challenges under the future climate change scenarios.
表1 气候系统模式与作物模型Tab. 1 Climate system models and crop models |
| 气候系统模式 | 作物模型 | ||||||
|---|---|---|---|---|---|---|---|
| 模式名称 | 研发机构 | 模型名称 | 研发机构 | 胁迫项 | 模拟时间及作物 | ||
| HadGEM2-ES | 哈德利气候中心 | EPIC | 维也纳(BOKU)自然资源与生命科学大学 | W, T, H, A, N, P, BD, AL | 1980-2099年; 小麦、水稻 | ||
| IPSL-CM5A-LR | 法国Pierre-Simon物理学研究所 | GEPIC | 瑞士联邦水质科学技术研究所 | W, T, H, A, N, P, BD, AL | 1971-2099年; 小麦、水稻 | ||
| MIROC-ESM-CHEM | 日本海洋地球科学与技术局、大气海洋研究所和国家环境变化研究所 | PEGASUS | 英国东英吉利大学延德尔气候变化研究中心,加拿大麦吉尔大学 | W, T, H, N, P, K | 1971-2099小麦 | ||
| GFDL-ESM2M | 美国地球物理流体动力学实验室 | pDSSAT | 芝加哥大学计算机学院 | W, T, H, A, N | 1971-2099年 小麦、水稻 | ||
| NorESM1-M | 挪威气候中心 | ||||||
注:W:水分胁迫;T:温度胁迫;H:比热胁迫;A:氧胁迫;N:氮胁迫;P:磷胁迫;K:钾胁迫;BD:土壤容重;AL:铝胁迫。 |
| [1] |
|
| [2] |
|
| [3] |
|
| [4] |
|
| [5] |
|
| [6] |
|
| [7] |
|
| [8] |
|
| [9] |
|
| [10] |
|
| [11] |
|
| [12] |
|
| [13] |
|
| [14] |
|
| [15] |
|
| [16] |
|
| [17] |
|
| [18] |
|
| [19] |
|
| [20] |
|
| [21] |
|
| [22] |
|
| [23] |
|
| [24] |
|
| [25] |
|
| [26] |
|
| [27] |
|
| [28] |
[ 方修琦, 王媛, 徐锬 , 等. 近20年气候变暖对黑龙江水稻增产的贡献. 地理学报, 2004,59(6):820-828.]
|
| [29] |
|
| [30] |
|
| [31] |
|
| [32] |
|
| [33] |
|
| [34] |
|
| [35] |
|
| [36] |
[ 张学珍, 李侠祥, 徐新创 , 等. 基于模式优选的21世纪中国气候变化情景集合预估. 地理学报, 2017,72(9):1555-1568.]
|
| [37] |
[ 顾国达, 尹靖华 . 全球中长期粮食供需趋势分析. 华中农业大学学报, 2014,33(6):6-16.]
|
| [38] |
|
| [39] |
|
| [40] |
|
/
| 〈 |
|
〉 |
