
海平面上升风险中国大陆沿海地区人口与经济暴露度
|
高超(1978-), 男, 安徽全椒人, 博士, 教授, 研究方向为气候变化与水文水资源。E-mail: gaoqinchao1@163.com |
收稿日期: 2018-04-10
要求修回日期: 2019-05-26
网络出版日期: 2019-08-07
基金资助
国家自然科学基金项目(41871024)
国家自然科学基金项目(41571018)
版权
Population and economic risk exposure in coastal regionof China under sea level rise
Received date: 2018-04-10
Request revised date: 2019-05-26
Online published: 2019-08-07
Supported by
National Natural Science Foundation of China(41871024)
National Natural Science Foundation of China(41571018)
Copyright
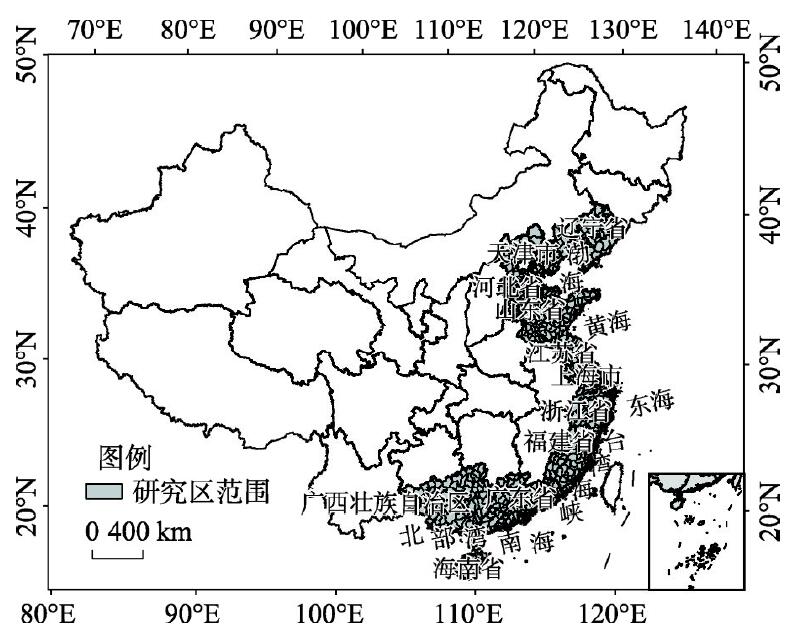
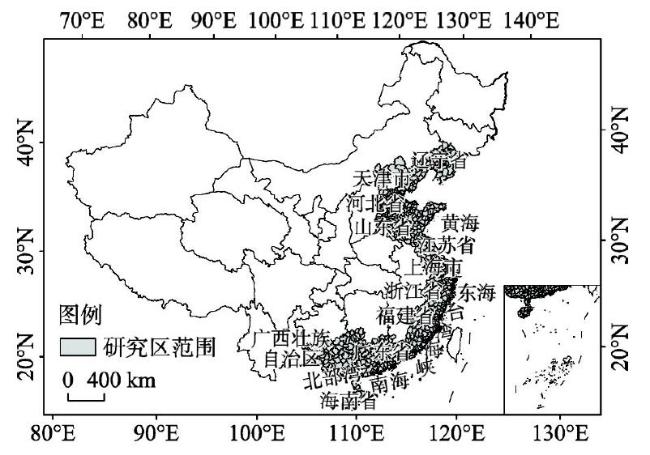
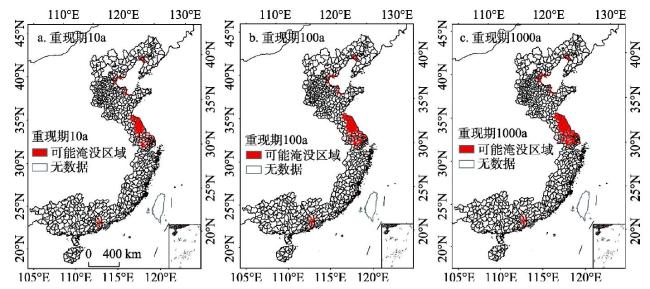
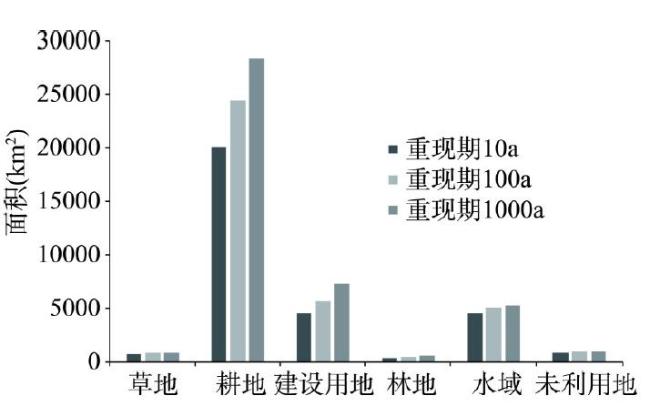
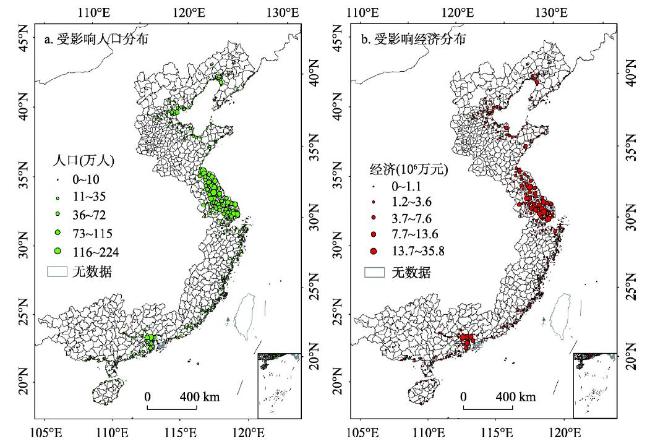
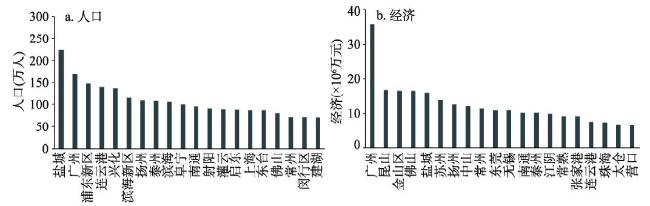
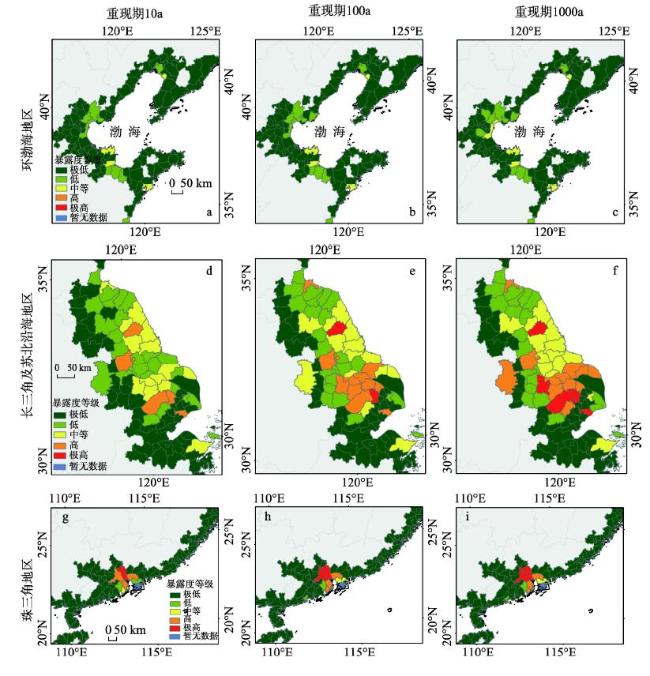
基于全球潮汐和浪涌再分析数据集,利用数字高程模型在ArcGIS空间分析工具支持下,提取了中国大陆沿海11个省市海平面上升可能淹没范围,结合人口、经济、土地利用数据构建海平面上升风险暴露度评估模型,评估中国大陆沿海地区海平面上升风险的人口和经济暴露度。结果表明:① 海平面上升风险可能淹没范围主要集中在长三角及苏北沿海、珠三角和环渤海等滨海平原地区,其中可能淹没范围最大的是江苏、上海等长三角地区;土地利用类型中受影响最严重的为耕地,约占受影响总面积的65%,其次为建设用地;② 基于2015年人口、经济统计数据,随着海平面上升水位值重现期的变化(10 a一遇至1000 a一遇),海平面上升风险影响的人口和经济总量逐渐增加;对海平面上升风险暴露度而言,广州是暴露度等级最高的城市,高暴露度等级的区域仍集中于长三角及苏北沿海、珠三角、环渤海地区;③ 基于5种共享社会经济路径预估的人口和经济统计数据,随着海平面上升水位值重现期的变化,2025年和2100年受影响的人口、经济总量在不同路径下均呈增长趋势,常规发展路径下受影响的人口和经济总量最大,局部或不一致发展路径和不均衡发展路径下受影响的人口、经济低于其他3种路径;从重现期角度看,10 a一遇至1000 a一遇海平面上升风险的人口、经济暴露度向高暴露度等级转移;对比2025和2100年两时段的人口、经济暴露度,2100年的暴露度等级整体低于2025年。
高超 , 汪丽 , 陈财 , 罗纲 , 孙艳伟 . 海平面上升风险中国大陆沿海地区人口与经济暴露度[J]. 地理学报, 2019 , 74(8) : 1590 -1604 . DOI: 10.11821/dlxb201908008
Based on the Global Tide and Surge Reanalysis (GTSR) dataset, the relevant Digital Elevation Model (DEM) was imported into ArcGIS and spatial analysis tools were used to extract possible flooding ranges due to sea level rise in 11 provinces and cities of coastal China. Combined with population, economic, and land use data, a sea level rise risk exposure assessment model is constructed and the population and economic risk exposure from sea level rise in coastal region of China are assessed. Three primary conclusions are drawn from the evaluation: (1) The impact of sea level rise on the coast areas is mainly concentrated in the Yangtze River Delta and northern Jiangsu coastal plains, as well as the Pearl River Delta and Bohai Rim, and other coastal plain areas. The most seriously affected land use types are arable land, which accounts for 65% of affected areas, followed by construction land; (2) Based on population and economic statistics from 2015 and 10 to 1000 years return periods, sea level rise increases risks to populations and the aggregated economy. In terms of sea level rise risk exposure, Guangzhou is most exposed and other areas with high exposure are concentrated in the Yangtze River Delta, northern Jiangsu coastal plains, the Pearl River Delta and Bohai Rim Region; (3) Based on population and economic statistics estimated using five shared social economic paths (SSPs), and variations in return periods from 10 to 1000 years, the gross population and the aggregated economies for 2025 and 2100 tended to increase in different paths. The conventional development path (SSP5) resulted in the largest affected population and aggregated economy while the local or inconsistent development path (SSP3) and unbalanced development path (SSP4) resulted in lower impacts than those of the other three paths. Changes in the return period from 10 to 1000 years can shift the risk exposure. Comparing the exposure risk to the population and economies, we found that the exposure degree in 2100 will be lower than that in 2025.
Key words: sea level rise; GTSR data; exposure; return period; SSPs; coastal area of China
表1 一级评估指标判断矩阵Tab. 1 The judgment matrix of the first level evaluation index |
| 人口 | 经济 | 土地利用数据 | |
|---|---|---|---|
| 人口 | 3 | 5 | |
| 经济 | 2 | ||
| 土地利用数据 |
表2 6种不同权重赋值方案Tab. 2 Six assignment schemes with different weights |
| 方案 | 人口 | 经济 | 土地利用数据 | CR值 |
|---|---|---|---|---|
| 1 | 0.7050 | 0.2053 | 0.0897 | 0.0176 |
| 2 | 0.7375 | 0.1773 | 0.0852 | 0.0015 |
| 3 | 0.7608 | 0.1576 | 0.0816 | 0.0012 |
| 4 | 0.7396 | 0.1666 | 0.0938 | 0.0136 |
| 5 | 0.6483 | 0.2297 | 0.1220 | 0.0036 |
| 6 | 0.7306 | 0.1884 | 0.0810 | 0.0624 |
表3 6种不同权重赋值方案的约束信息量Tab. 3 The binding information of six assignment schemes with different weights |
| 方案 | 1 | 2 | 3 | 4 | 5 | 6 |
|---|---|---|---|---|---|---|
| CR | 0.0176 | 0.0015 | 0.0012 | 0.0136 | 0.0036 | 0.0624 |
| BI | 0.4484 | 0.5157 | 0.5697 | 0.5120 | 0.3218 | 0.5067 |
表4 海平面上升风险暴露度指标及权重Tab. 4 The exposure risk index and weight of sea level rise |
| 目标 | 指标 | 权重 | 二级指标 | 权重 |
|---|---|---|---|---|
| 暴露度 评估 | 人口 | 0.6483 | P1 | 0.0388 |
| P2 | 0.0479 | |||
| P3 | 0.0979 | |||
| P4 | 0.1688 | |||
| P5 | 0.2950 | |||
| 经济 | 0.2297 | G1 | 0.0105 | |
| G2 | 0.0206 | |||
| G3 | 0.0252 | |||
| G4 | 0.0528 | |||
| G5 | 0.1207 | |||
| 土地利用 数据 | 0.1220 | L1(水域) | 0.0039 | |
| L2(未利用地) | 0.0086 | |||
| L3(草地) | 0.0091 | |||
| L4(林地) | 0.0163 | |||
| L5(耕地) | 0.0314 | |||
| L6(建设用地) | 0.0526 |
注:P1~P5和G1~G5是利用ArcGIS自然断点法划分不同等级的人口暴露量(万人)和经济暴露量(万元)。 |
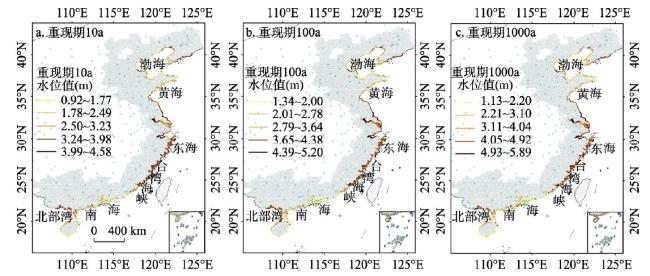
表5 不同重现期中国大陆沿海可能淹没面积(×104 km2)Tab. 5 The possible flooded areas of China's coast in different return periods (×104 km2) |
| 重现期10 a | 重现期100 a | 重现期1000 a | |
|---|---|---|---|
| 可能淹没面积 | 4.59 | 5.65 | 6.67 |
表6 不同重现期受影响的中国大陆沿海地区人口和经济情况Tab. 6 The affected population and economy in different return periods |
| 人口(万人) | 经济(×106万元) | ||||||
|---|---|---|---|---|---|---|---|
| 重现期10 a | 重现期100 a | 重现期1000 a | 重现期10 a | 重现期100 a | 重现期1000 a | ||
| 合计 | 3856.51 | 4734.42 | 6025.99 | 336.54 | 434.86 | 543.16 | |
表7 不同重现期中国大陆沿海地区暴露度等级城市数量Tab. 7 The number of cities exposed in different return periods |
| 暴露度等级 | 极高 | 高 | 中等 | 低 | 极低 | 合计 |
|---|---|---|---|---|---|---|
| 重现期10 a城市个数 | 2 | 9 | 18 | 37 | 250 | 316 |
| 重现期100 a城市个数 | 4 | 15 | 18 | 36 | 245 | 318 |
| 重现期1000 a城市个数 | 7 | 16 | 19 | 34 | 243 | 319 |
表8 共享经济路径下暴露度等级格网数量Tab. 8 The grid numbers of exposure levels under the shared socioeconomic pathways |
| 2025年 | 2100年 | |||||||||||
|---|---|---|---|---|---|---|---|---|---|---|---|---|
| 等级 | SSP1 | SSP2 | SSP3 | SSP4 | SSP5 | SSP1 | SSP2 | SSP3 | SSP4 | SSP5 | ||
| 重现期10 a | 极低 | 145 | 145 | 144 | 145 | 144 | 145 | 145 | 144 | 145 | 144 | |
| 低 | 27 | 27 | 28 | 27 | 27 | 27 | 27 | 28 | 27 | 27 | ||
| 中 | 15 | 15 | 16 | 15 | 14 | 15 | 15 | 16 | 15 | 14 | ||
| 高 | 2 | 2 | 2 | 2 | 3 | 2 | 2 | 2 | 2 | 3 | ||
| 极高 | 1 | 1 | 0 | 1 | 2 | 1 | 1 | 0 | 1 | 2 | ||
| 重现期100 a | 极低 | 137 | 136 | 136 | 137 | 137 | 155 | 151 | 148 | 156 | 146 | |
| 低 | 30 | 31 | 31 | 30 | 30 | 26 | 29 | 33 | 26 | 29 | ||
| 中 | 17 | 17 | 17 | 17 | 17 | 7 | 9 | 7 | 6 | 12 | ||
| 高 | 6 | 4 | 5 | 5 | 4 | 2 | 2 | 3 | 2 | 1 | ||
| 极高 | 1 | 3 | 2 | 2 | 3 | 1 | 1 | 0 | 1 | 3 | ||
| 重现期1000 a | 极低 | 130 | 130 | 130 | 130 | 129 | 153 | 149 | 146 | 154 | 144 | |
| 低 | 31 | 32 | 32 | 32 | 31 | 26 | 28 | 33 | 26 | 28 | ||
| 中 | 20 | 19 | 20 | 20 | 19 | 8 | 10 | 8 | 7 | 13 | ||
| 高 | 7 | 5 | 6 | 6 | 7 | 2 | 3 | 4 | 3 | 3 | ||
| 极高 | 3 | 5 | 3 | 3 | 5 | 2 | 1 | 0 | 1 | 3 | ||
| [1] |
IPCC. Climate Change 2014: Impacts, Adaptation, and Vulnerability. Cambridge: Cambridge University Press, 2014.
|
| [2] |
State Oceanic Administration. China Sea Level Bulletin 2016. Beijing: State Oceanic Administration, 2017.
[ 国家海洋局. 2016年中国海平面公报. 北京: 国家海洋局, 2017.] .
|
| [3] |
[ 姜彤, 李修仓, 巢清尘 , 等. 《气候变化2014: 影响、适应和脆弱性》的主要结论和新认知. 气候变化研究进展, 2014,10(3):157-166.]
|
| [4] |
[ 尹占娥, 田鹏飞, 迟潇潇 . 基于情景的1951-2011年中国极端降水风险评估. 地理学报, 2018,73(3):405-413.]
|
| [5] |
[ 郑菲, 孙诚, 李建平 . 从气候变化的新视角理解灾害风险、暴露度、脆弱性和恢复力. 气候变化研究进展, 2012,8(2):79-83.]
|
| [6] |
[ 殷杰, 尹占娥, 于大鹏 , 等. 海平面上升背景下黄浦江极端风暴洪水危险性分析. 地理研究, 2013,32(12):2215-2221.]
|
| [7] |
[ 李茂林, 金国成, 周立佳 , 等. 基于多星融合高度计数据的太平洋海域海平面变化特征分析. 海洋技术学报, 2017,36(1):37-41.]
|
| [8] |
[ 吴炳方, 张淼 . 从遥感观测数据到数据产品. 地理学报, 2017,72(11):2093-2111.]
|
| [9] |
[ 闫白洋 . 海平面上升叠加风暴潮影响下上海市社会经济脆弱性评价[D]. 上海: 华东师范大学, 2016.]
|
| [10] |
[ 李永平, 秦曾灏, 端义宏 . 上海地区海平面上升趋势的预测和研究. 地理学报, 1998,53(5):393-403.]
|
| [11] |
[ 程和琴, 王冬梅, 陈吉余 . 2030年上海地区相对海平面变化趋势的研究和预测. 气候变化研究进展, 2015,11(4):231-238.]
|
| [12] |
[ 郑大伟, 虞南华 . 上海地区海平面上升趋势的长期预测研究. 中国科学院上海天文台年刊, 1996, ( 17):36-45.]
|
| [13] |
[ 顾小丽, 李培良, 谭海涛 , 等. 基于RBF神经网络的EMD方法在海平面分析中的应用. 海洋与湖沼, 2009,40(5):532-539.]
|
| [14] |
[ 李响, 段晓峰, 刘克修 , 等. 津冀沿海地区海平面上升的风险评估研究. 灾害学, 2014,29(3):108-114.]
|
| [15] |
[ 易思, 谭金凯, 李梦雅 , 等. 长江口海平面上升预测及其对滨海湿地影响. 气候变化研究进展, 2017,13(6):598-605.]
|
| [16] |
[ 罗紫丹, 孟宪伟, 罗新正 . 百年内全球海平面上升、地壳上升和潮滩沉积对广西英罗湾红树林分布的影响. 海洋通报, 2017,36(2):209-216.]
|
| [17] |
[ 孙志林, 李光辉, 许丹 , 等. 海平面上升对钱塘江河口盐水入侵影响的预测研究. 中国环境科学, 2017,37(10):3882-3890.]
|
| [18] |
[ 蒋昌波, 黄琼, 伍志元 , 等. 沙质岸滩形态对海平面变化响应的数值研究. 水动力学研究与进展( A辑), 2017,32(1):81-87.]
|
| [19] |
[ 黄晓军, 黄馨, 崔彩兰 , 等. 社会脆弱性概念、分析框架与评价方法. 地理科学进展, 2014,33(11):1512-1525.]
|
| [20] |
[ 李响, 刘克修, 董军兴 , 等. 中国沿海海平面上升风险区划方法研究. 海洋预报, 2014,31(2):41-49.]
|
| [21] |
[ 刘曙光, 刘洋, 尹鹏 . 海平面上升对策问题国际研究进展. 中国海洋大学学报(社会科学版), 2017, ( 6):7-10.]
|
| [22] |
|
| [23] |
[ 温家洪, 袁穗萍, 李大力 , 等. 海平面上升及其风险管理. 地理科学进展, 2018,33(4):350-360.]
|
| [24] |
[ 李猷, 王仰麟, 彭建 , 等. 海平面上升的生态损失评估: 以深圳市蛇口半岛为例. 地理科学进展, 2009,28(3):417-423.]
|
| [25] |
[ 张平, 孔昊, 王代锋 , 等. 海平面上升叠加风暴潮对2050年中国海洋经济的影响研究. 海洋环境科学, 2017,36(1):129-135.]
|
| [26] |
|
| [27] |
|
| [28] |
|
| [29] |
|
| [30] |
|
| [31] |
|
| [32] |
|
| [33] |
|
| [34] |
|
| [35] |
[ 姜彤, 赵晶, 景丞 , 等. IPCC共享社会经济路径下中国和分省人口变化预估. 气候变化研究进展, 2017,13(2):128-137.]
|
| [36] |
|
| [37] |
|
| [38] |
[ 姜彤, 赵晶, 曹丽格 , 等. 共享社会经济路径下中国分省经济变化预测. 气候变化研究进展, 2018,14(1):50-58.]
|
| [39] |
[ 高超, 张正涛, 刘青 , 等. 承灾体脆弱性评估指标的最优格网化方法: 以淮河干流区暴雨洪涝灾害为例. 自然灾害学报, 2018,27(3):119-129.]
|
| [40] |
[ 葛全胜 . 中国自然灾害风险综合评估初步研究. 北京: 高等教育出版社, 2008.]
|
/
| 〈 |
|
〉 |

