王向楠
中国社会科学院金融研究所,北京 100086
WANG Xiangnan
收稿日期: 2016-05-2
修回日期: 2017-01-30
网络出版日期: 2017-08-20
版权声明: 2017 《地理学报》编辑部 本文是开放获取期刊文献,在以下情况下可以自由使用:学术研究、学术交流、科研教学等,但不允许用于商业目的.
基金资助:
作者简介:
作者简介:王向楠(1984-), 男, 博士, 副研究员, 主要从事保险与金融地理问题研究。E-mail:jaffwang@126.com
展开
摘要
中国财产保险业(简称产险业)的经营状况存在明显的空间分异性,且近些年中国产险公司进行了较快速的地理扩张,那么,地理扩张如何影响了公司的盈利能力?本文基于2006-2015年中国64家产险公司的面板数据,采用地理加权方法估计了每家公司的利润效率,并基于多个地理扩张指标进行了回归分析。研究发现:① 地理扩张与盈利能力呈显著正相关,六成以上的正相关来自于有更强盈利能力的产险公司更会去实施地理扩张。② 地理扩张对产险公司的盈利能力仍然产生了一定程度的正向影响,其他条件不变时,如果产险公司经营的省区市数目增加10家、产险公司来自于非总部所在的省区市的保费收入份额增加10个百分点、产险公司在各省区市的保费收入的集中度降低单位标准差、产险公司总部与分部的平均距离增加1%,那么,产险公司的盈利能力将分别提高样本中单位标准差的2%、1%、2%、1%。③ 采用基于普通方法估计的利润效率时,难以得到地理扩张影响产险公司的盈利能力的结论。
关键词:
Abstract
There is significant spatial stratified heterogeneity in the operating conditions of property insurance industry in China. What is more, China's property insurers have carried out a rapid geographic expansion in recent years, then, how does the geographic expansion affect the profit of property insurers? On the basis of the panel data of China's 64 property insurers during the period from 2006 to 2015, this paper estimates the the profit efficiency for each property insurer using the geographically-weighted method. Moreover, through the regression analysis with five geographical expansion measures, we draw the following conclusions. (1) Geographical expansion is significantly and positively related to the profitability and more than 60% of the positive correlation attribute to the larger possibilities of higher profitability insurers to carry out geographical expansion. (2) Geographical expansion also plays a positive role in property insurers' profitability to some extent. Other things being equal, the number of the provincial-level regions where an insurer operates increases by 10, the premium income share from the provincial-level regions other than its headquarters-located region increases by 10 percentage points, the concentration ratio of the premium income across provincial-level regions decreases by a unit of standard deviation, and the average distance between the headquarters and its branches increases by 1%, the profitability of the property insurer will increase by 2%, 1%, 2% and 1% of a unit of standard deviation in the sample, respectively. (3) It is difficult to reach a conclusion on the positive impact of geographical expansion on profitabilitywhen the profit efficiency is estimated by ordinary methods.
Keywords:
金融服务业是具有明显地理特征的经济活动[1-4],财产保险业(简称产险业)是为财产及其相关利益提供财务保障,并由于获取保费收入与支出赔付款之间的时间差而具有投资功能的一个金融子行业,其发展水平与所在地的风险特征密切相关,影响其经营成果的众多因素存在着明显的空间分异性(spatial stratified heterogeneity)。因此,产险的经营主体——产险公司的经营状况应当显著受到其地理布局的影响。过去二十几年,中国产险公司实施了较快速的地理扩张,其中,2006-2015年产险公司突破总部所在省区市去拓展业务的占比从不足50%上升到90%以上。商业企业以利润最大化为根本目的,那么,地理扩张如何影响了中国产险公司的盈利能力?这是本文的研究主题。
国内外已有一些研究分析了地理扩张(或“地理分散化”)对金融机构的经营成果(效率、会计绩效、市场价值等指标)的影响。个别研究发现地理扩张有助于金融机构提高经营成果[4-5],但是更多的研究发现地理扩张对金融机构产生了不利影响[6-13]。鉴于此,本文将分析中国产险行业主要经营指标的空间分异状况及其原因,基于2006-2015年中国64家产险公司的面板数据,定量研究地理扩张对产险公司利润效率的影响。其中,地理扩张程度采用5个度量指标(“是否”实施了跨省区市经营、经营的省区市数目、从非总部所在的省区市获得的收入比重、“1”-收入的地理集中度和“总部—分部”距离),利润效率综合反映了企业最小化成本和最大化收入的能力,是度量盈利能力的适宜指标。
财产保险业广泛地服务于社会生产和居民生活,其经营成果与地理因素的关联很大,且这种关联在金融业的主要子行业(银行、产险、寿险、证券、信托、基金、金融租赁等)中或许是最大的。产险业的经营状况存在着明显的空间分异性,本文结合中国前五大产险险种(保费收入之和占全行业的95%以上)进行分析。
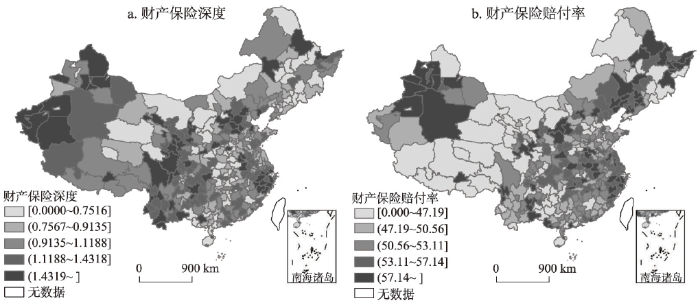
笔者从《中国保险年鉴》和《中国区域经济统计年鉴》收集和计算了2013年中国339个地级(包括地级市、地级地区、自治州和自治盟以及直辖市,不包括港澳台地区)单位的五大财产险险种的占比、深度和赔付率。其中,“占比”是指该险种的保费收入占产险市场总保费收入的比重;“深度”是指该险种的保费收入与国内生产总值(Gross Domestic Produc, GDP)的比值,反映该险种的发达程度;“赔付率”是指该险种的赔款支出除以保费收入,是反映该险种经营盈亏的一个简易指标。
表1中报告了中国7个地理区域中五大险种的占比、深度和赔付率以及反映这3个指标的空间分异程度的
式中:
(1)机动车险在各地区都占据产险市场七成以上的份额,但是机动车险的赔付率和综合成本率在华东地区大幅高于西南、西北地区,这主要归因于不同地区在人口和道路密度、人均收入上的差异[18]。
(2)企业财产险承保各类企业由于遭受“火灾、爆炸、雷电、暴风、龙卷风、洪水、地陷、崖崩、突发性滑坡、雪灾、雹灾、冰凌、泥石流以及空中运行物体坠落等自然灾害或者停电、停水、停气等意外事故”而造成的损失,所以企业财产险的经营成果受到所在地的气象、地质、水文等因素的较大影响[19]。东北、华北、华东地区的企业财产险相对发达主要归因于这些地区较好的工业基础,而企业财产险的赔付率在各地区之间差别较大,反映了各地区气象、地质、水文等因素的差异。
(3)农业生产有“靠天吃饭”的特点,农业保险的科学发展依赖于农业区划,其经营成果高度依赖于所在地的农业生产环境。东北、西北、西南地区农业保险的发展程度较高,这是得益于这些地区农业在国民经济中的占比较高,而东北、华东、华中地区农险的赔付率较高,这是由于这些地区发生了相对严重的气象和病虫害。
(4)在信用保证险中,信用险主要是出口信用险,而进出口情况很大程度上取决于地理位置(如是否有港口、与哪些国家或地区临近);保证险承保投保人自身的违约风险,而较大规模的违约风险往往具有区域性特征[20]。做为外向型经济地区和信用交易发达的地区,华北、华东、华南地区的信用保证险的发达程度和赔付率均相对高;相应地,东北、西北、西南地区均相对低。
(5)责任险的特点是与法制环境息息相关,而法制受到文化的巨大影响,进而也受到地理环境的影响。华东、华中、华南地区的责任险相对发达,这在一定程度上得益于这些地区较好的民事法律环境,而这些地区的责任险较高的赔付率也应当归因于此。
图1显示了地级单位产险的深度和赔付率的分布。不难发现,产险的深度和赔付率均呈现出明显的空间分异性;深度和赔付率也存在一定的空间聚集性。虽然本文没有通过图形展示产险单个险种的深度和赔付率的空间分布,但它们均在明显的空间效应。
综上可知,中国产险行业经营状况存在明显的空间分异性,所以产险公司的地理扩张对其经营成果应当会产生影响。
图1 2013年中国财产保险深度与赔付率的空间分布
Fig. 1 Spatial distribution of property insurance penetration and loss ratio in China in 2013
表1 2013年中国主要产险险种发展程度和赔付率的空间分异性
Tab. 1 Spatial stratified heterogeneity for the development degree and loss ratio of main property insurance categories in China in 2013
| 区域所含地级 单位数 | 东北 | 华北 | 华东 | 华南 | 华中 | 西北 | 西南 | q统计量(%)(显著性) 基于省级单位计算 | |||||||
|---|---|---|---|---|---|---|---|---|---|---|---|---|---|---|---|
| 40 | 31 | 66 | 37 | 55 | 53 | 54 | |||||||||
| 机动车险 | 占比(%) | 70.3 | 80.1 | 77.2 | 76.6 | 79.0 | 71.6 | 74.0 | 51.0 (0.000) | ||||||
| 深度(%) | 0.53 | 0.91 | 0.83 | 0.73 | 0.62 | 0.78 | 0.97 | 40.8 (0.000) | |||||||
| 赔付率(%) | 52.8 | 52.4 | 56.0 | 51.2 | 53.2 | 50.6 | 51.4 | 18.9 (0.000) | |||||||
| 企业 财产险 | 占比(%) | 4.4 | 4.4 | 4.3 | 3.7 | 2.8 | 4.1 | 2.3 | 24.6 (0.000) | ||||||
| 深度(%) | 0.04 | 0.05 | 0.05 | 0.04 | 0.02 | 0.05 | 0.03 | 22.2 (0.000) | |||||||
| 赔付率(%) | 43.9 | 43.5 | 47.4 | 102.2 | 61.7 | 52.2 | 54.6 | 19.4 (0.000) | |||||||
| 农业保险 | 占比(%) | 13.0 | 4.5 | 2.4 | 3.0 | 6.0 | 9.6 | 9.2 | 45.2 (0.000) | ||||||
| 深度(%) | 0.09 | 0.06 | 0.03 | 0.03 | 0.04 | 0.10 | 0.11 | 31.0 (0.000) | |||||||
| 赔付率(%) | 78.5 | 44.2 | 46.6 | 62.5 | 63.2 | 50.0 | 45.0 | 27.6 (0.000) | |||||||
| 信用 保证险 | 占比(%) | 2.4 | 6.2 | 5.3 | 5.7 | 4.6 | 4.0 | 3.7 | 21.5 (0.000) | ||||||
| 深度(%) | 0.05 | 0.03 | 0.05 | 0.08 | 0.04 | 0.06 | 0.06 | 17.9 (0.000) | |||||||
| 赔付率(%) | 10.2 | 29.6 | 31.1 | 19.7 | 22.5 | 15.2 | 22.4 | 23.1 (0.000) | |||||||
| 责任险 | 占比(%) | 2.3 | 2.7 | 3.8 | 3.4 | 3.5 | 2.8 | 2.6 | 38.7 (0.000) | ||||||
| 深度(%) | 0.02 | 0.03 | 0.03 | 0.03 | 0.03 | 0.05 | 0.05 | 37.0 (0.000) | |||||||
| 赔付率(%) | 47.2 | 38.1 | 40.8 | 40.4 | 45.8 | 35.4 | 36.1 | 21.1 (0.000) | |||||||
| 其他险 | 占比(%) | 5.1 | 5.3 | 8.1 | 10.0 | 7.4 | 9.6 | 9.1 | 48.3 (0.000) | ||||||
| 深度(%) | 0.04 | 0.05 | 0.08 | 0.08 | 0.06 | 0.12 | 0.11 | 42.0 (0.000) | |||||||
| 赔付率(%) | 46.5 | 53.1 | 47.3 | 52.6 | 47.3 | 52.2 | 45.2 | 13.6 (0.000) | |||||||
本文样本为2006-2015年中国64家产险公司,观察值为474个。样本剔除了专营政策性强的出口信用险业务的中国出口信用保险公司;由于数据披露不完整和经营波动性较大,剔除了公司首个完整经营年度的样本。样本始于2006年,这是由于新《企业财务会计准则》的实施导致样本期间的一些财务指标与更早之前的财务指标不容易比较。表2显示样本中产险公司的保费收入占中国产险业总保费收入的96%以上,样本的代表性很好。
表2 本文样本的代表性
Tab. 2 Representation of the samples
| 年份 | 公司数量(家) | 保费收入占全行业比重(%) | 年份 | 公司数量(家) | 保费收入占全行业比重(%) |
|---|---|---|---|---|---|
| 2006年 | 30 | 99.03 | 2011年 | 51 | 98.56 |
| 2007年 | 33 | 98.56 | 2012年 | 54 | 96.63 |
| 2008年 | 37 | 98.74 | 2013年 | 59 | 97.59 |
| 2009年 | 41 | 98.89 | 2014年 | 61 | 98.14 |
| 2010年 | 46 | 98.11 | 2015年 | 62 | 98.28 |
注:保费收入数据来自《中国保险年鉴》。
本文的利润函数使用替代利润函数形式,即公司在给定投入价格和产出数量的基础上去追求利润最大化[4]。基于以往文献[21-23],本文为产险公司选择了3项投入和2项产出。投入项包括劳动、物料和金融资本。① 劳动投入的数量使用“员工人数”度量,劳动投入的价格使用“职工薪酬/员工人数”度量。② 物料投入的数量使用“固定资产”度量,物料投入的价格使用“‘业务及管理费用-职工薪酬’/固定资产”度量。③ 金融资本投入使用“资本金+公积金”度量,金融资本投入的价格使用“税后利润/‘资本金+公积金’”的期望值度量。借鉴Cummins等[24]的研究,“期望值”是通过将“税后利润/‘资本金+公积金’”对一系列公司特征进行面板数据混合OLS回归获得的拟合值。其中,公司特征包括公司规模、产品多元化程度、广告支出占保费收入的比重、公司年龄的对数、年度哑变量。
保险的职能是损失补偿和资金融通,本文选择了2项保险公司的产出:① 反映“损失补偿”功能的“赔付支出+准备金增量”,其中,赔付支出对应公司当年的实际赔付,而准备金增量对应未来年度支出的赔付。② 反映“资金融通”功能的“投资资产”。投入和产出变量的描述统计情况如表3所示。反映资金融通功能产出是反映损失补偿功能产出的大约2倍,反映出金融行业的特点。在回归中,为了剔除样本期间物价变动的影响,将投入和产出变量按照历年的消费价格指数平减至2006年的价格水平。
表3 投入和产出变量的描述统计
Tab. 3 Descriptive statistics of the input and output variables
| 度量 | 均值 | 标准差 | ||
|---|---|---|---|---|
| 投入项数量 | 劳动 | 员工人数(人) | 5796.36 | 8845.45 |
| 物料 | 固定资产(百万元) | 369.61 | 826.15 | |
| 金融资本 | 资本金+公积金(百万元) | 2354.21 | 4390.93 | |
| 投入项价格 | 劳动 | 职工薪酬/员工人数(百万元/人) | 0.25 | 0.37 |
| 物料 | “业务及管理费用–职工薪酬”/固定资产 | 1.98 | 8.14 | |
| 金融资本 | 税后利润/“资本金+公积金”(拟合值) | 0.06 | 0.10 | |
| 产出项数量 (百万元) | 损失补偿 | 赔付支出+准备金增量(百万元) | 4687.37 | 15666.72 |
| 资金融通 | 投资资产(百万元) | 9472.91 | 28495.60 | |
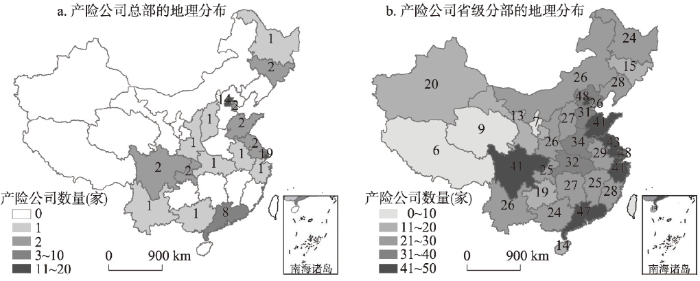
2015年样本中的产险公司平均在11.37个省区市开展业务。图2a报告了样本公司总部在内地31个省区市的分布,呈现出很强的聚集效应;图2b报告了2015年产险公司省级分部的地理分布,其较之总部的地理分布均衡很多。
本文采用超越对数函数形式(transcendental logarithmic form, Translog),如下:
式中:
本文对公式(2)采用两种估计方法:一种是借鉴Tabak等[25]的地理加权的SFA方法,以“每家”公司为基准进行一次Battes等[26]的面板数据SFA估计,每次估计中其他公司的权重是以距离基准公司总部所在城市的地理距离确定;另一种估计方法即是普通的(未进行地理加权的)Battese等[26]的SFA方法。
图2 2015年中国产险公司总部和省级分部的地理分布
Fig. 2 Geographical distribution of property insurers' headquarters, and provincial-level branches in 2015
表4 “地理扩张”变量的描述统计和相关性
Tab. 4 Descriptive statistics and correlation of the variables measuring geographical expansion
| 描述统计 | 简单相关系数 | ||||||||
|---|---|---|---|---|---|---|---|---|---|
| 均值 | 标准差 | 最小值 | 最大值 | ||||||
| 0.78 | 0.41 | 0 | 1 | 1 | |||||
| 11.36 | 10.78 | 1 | 31 | 0.51*** | 1 | ||||
| 0.54 | 0.39 | 0 | 1 | 0.69*** | 0.81*** | 1 | |||
| 0.56 | 0.38 | 0 | 0.95 | 0.78*** | 0.82*** | 0.95*** | 1 | ||
| 583.58 | 482.69 | 0 | 2604.54 | 0.56*** | 0.74*** | 0.86*** | 0.80*** | 1 | |
地理布局是任何一家公司的重要战略选择,那么,地理扩张是否影响了产险公司的盈利能力?本文以利润效率(Profitit)为因变量,估计如下模型:
式中:i、t分别表示公司和年度;GeoExpan是地理扩张程度,即本文关注的自变量;
结合已有研究,本文采用5个地理扩张(GeoExpan)的度量指标:① 公司“是否”实施了跨省区市经营。变量GeoDum对在超过一个省区市经营业务的公司取
式中:sip表示公司i的保费收入中来自于省区市p的份额。⑤ 公司总部和省区市分部之间距离的加权平均值(简称“总部—分部”距离):
式中:
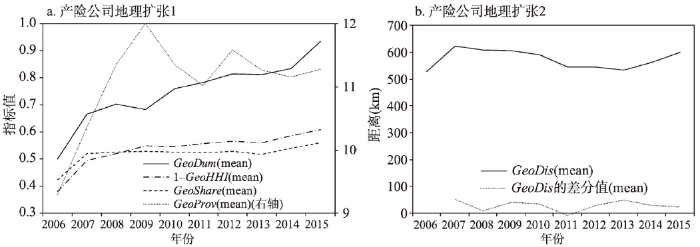
图3a显示,越来越多的产险公司实施了跨省区市经营,2015年这一比例已超过了85%;从2006年到2015年,产险公司经营的省区市数目的均值从9.3家上升到11.3家,上升幅度不大主要是由于这期间新成立了30多家产险公司;产险公司从非总部所在的省区市获得的保费收入比重在样本期间平均提高了15个百分点,2015年平均达到了56.2%;“
在估计地理扩张对盈利能力的影响时控制了如下变量(CV)。① 公司规模,使用资产总额的对数(
式中:siq表示公司i的保险收入中来自于产品线q的份额。
本文中产险公司的产品线分为10条:企业财产险、机动车险、货运险、责任险、工程险、信用保证险、农业险、短期健康险、意外伤害险和其他险,这种划分方法下,每条产品线的涵盖范围在2006-2015年是相同的。③ 财务杠杆(
表6报告了关于地理加权的利润效率的估计结果,地理扩张使用5个度量指标,对每个指标分别报告了3组不同的控制变量设定下的估计结果(在Battese等[26]的面板数据SFA模型中,无效率项(
当进一步控制公司固定效应(第(2)(5)(8)(11)(14)个结果)后,5个地理扩张指标的系数估计值均有明显减小,减小程度均在六成以上。因此,地理扩张与盈利能力的正相关性主要是由于盈利能力强的产险公司更会去实施地理扩张。Goetz等[11]对美国银行业的研究甚至发现,控制公司固定效应后,地理扩张对Tobin Q值的系数估计值从正向显著变成了负向显著,并认为地理扩张会降低美国银行绩效。不过,在本文的估计中,地理扩张的系数估计值虽然大幅减少,但是仍然是正向的,且除“
(1)与大多数公司相同,产险公司的成本包括固定性成本(如总部管理人员的固定性薪酬、固定资产折旧、无形资产摊销、技术授权费),故公司的业务量越大,单位业务分摊的经营成本越小;保险公司汇集的风险越多,单位业务的风险水平就越低,公司的经营稳定性越强。公司实施地理扩张往往同时扩大了业务量——地理扩张本身就是扩大业务的一种常用战略,所以地理扩张有利于产险公司降低成本和提高稳定性。不过,控制了公司规模因素后,此解释的说服力不足。
(2)任何一个风险因素在不同地区的分布存在或多或少的差异,所以任何一个风险因素对不同地区产险业的经营成果所产生的影响不完全相同。进一步讲,根据地理学第一定律,任何一个风险因素在距离越远的地区的分布通常会差别越大,所以,当其他条件不变时,公司越进行地理扩张,其受到任何一个风险的影响程度越小。
(3)不同类型的风险的发生概率和严重程度呈现出低度的正相关或负相关,如台风和干旱、交通事故(工业地区相对多)和病虫害(农业地区相对多)、东北省区市的出口收款风险(来自日韩俄的占比更高)和西南省区市的出口收款风险(来自东南亚国家的占比更高)。考虑到中国不同地区的风险因素构成存在较大差异,所以较之于仅在一个地区经营,地理扩张可以借助不同类型风险之间的对冲效应,降低产险公司承担风险的整体程度。
(4)在地理扩张的过程中,产险公司会设立地区分支机构,每家分支机构都有管理人员和资本,于是在一家产险公司内部就能形成“管理人市场”和“资本市场”。借助这两个内部市场,产险公司可以比较方便地考察各地区分支机构的管理水平以及所占用资本的回报率,从而激励管理人员工作和优化资本配置,最终提高公司的整体盈利能力。
当继续加入时变公司特征变量后(第(3)(6)(9)(12)(15)个结果),5个地理扩张指标的系数估计值进一步降低,不过,除“
在时变公司特征变量方面,表7显示,盈利能力与财务杠杆之间呈显著正相关(在第(6)(9)(12)(15)个回归结果中显著),说明适当增加负债有助于提高盈利能力。盈利能力与公司年龄之间呈显著正相关,反映出公司经验、技术等能通过“学习效应”而提高。盈利能力与公司规模和广告支出之间没有发现有显著关系,与产品分散化之间仅发现了一个显著关系(第(3)个结果)。
表8的回归结果中以普通方法估计的利润效率做为因变量,其余设定与表6相同。当仅控制年度固定效应时,5个地理扩张度量指标的系数估计值均正向且是统计显著的,这与表6的结果相同。然而,当进一步控制公司固定效应或者连同时变公司特征变量时,地理扩张的系数估计值仅在一个回归(第(5)个)中具有统计显著性(在10%的水平上)。因此采用普通方法估计效率时,难以得到地理扩张显著影响盈利能力的结论。
最后,直观地讲,如果地理扩张对公司的盈利能力真的产生了正向影响,应当观察到,实施地理扩张后,公司的盈利能力提高了;相反,如果实施地理扩张后的盈利能力没有什么变化,那么就很难支持地理扩张能够影响盈利能力的结论。对此,估计模型为:
式中:D-j、Dj分别表示公司进行首次地理扩张“之前”第j年和“之后”第j年的哑变量,θ-j、θj分别为它们的系数;ηi、λt、εit分别为公司固定效应、年度固定效应和随机扰动项。对于首次“地理扩张”,本文采用两种定义:首次跨省区市经营、首次跨大区域(指东北、华北、华东、华南、华中、西北和西南7个地理区域)经营。
表9显示,对于两种“首次地理扩张”的定义,反映地理扩张“之前”的3个哑变量(D-3t、D-2t、D-1t)的系数估计均不具有统计显著性,而反映公司地理扩张“之后”的3个哑变量(D1t、D2t、D3t)的系数估计均为正向且是统计显著的(表9的观察值数较全文的观察值数(474)有所减少,这是由于笔者从相关资料中仅能查阅到自2001年起的各家产险公司在各省区市的分布情况,所以表9的样本没有包括那些在2001年之前已经实施了“首次地理扩张”或截至2015年仍未实施“首次地理扩张”的公司的样本。)。产险公司首次跨省区市开设分部“之后”3年的利润效率均值比“之前”3年的利润效率均值高出0.010,占样本中利润效率的单位标准差(0.094)的11%;产险公司首次跨大区域开设分部之后3年的利润效率均值比之前3年的效率均值高出0.007,占样本中利润效率的单位标准差(0.094)的7%。
表5 控制变量的描述统计
Tab. 5 Description statistics of control variables
| 变量 | 均值 | 标准差 | 最小值 | 中位数 | 最大值 |
|---|---|---|---|---|---|
| 13221.35 | 38839.05 | 179.07 | 2009.66 | 420420.00 | |
| 0.47 | 0.20 | 0.00 | 0.48 | 0.84 | |
| 0.63 | 0.26 | 0.02 | 0.67 | 2.05 | |
| 0.05 | 0.33 | 0.00 | 0.01 | 5.84 | |
| 9.94 | 7.24 | 2 | 8 | 36 |
表6 地理扩张对地理加权的利润效率的影响
Tab. 6 The effect of geographical expansion on geographically-weighted profit efficiency
| 被解释变量:Profitit (地理加权) | ||||||
|---|---|---|---|---|---|---|
| (1) | (2) | (3) | (4) | (5) | (6) | |
| 0.0224*** | 0.0053*** | 0.0016 | 0.0010*** | 0.0004** | 0.0002* | |
| (0.0057) | (0.0009) | (0.0045) | (0.0002) | (0.0001) | (0.0001) | |
| 时变公司特征变量 | × | × | √ | × | × | √ |
| 公司固定效应 | × | √ | √ | × | √ | √ |
| 年度固定效应 | √ | √ | √ | √ | √ | √ |
| (7) | (8) | (9) | (10) | (11) | (12) | |
| 0.0311*** | 0.0113*** | 0.0055*** | 0.0335*** | 0.0127*** | 0.0053*** | |
| (0.0059) | (0.0017) | (0.0017) | (0.0060) | (0.0017) | (0.0017) | |
| 时变公司特征变量 | × | × | √ | × | × | √ |
| 公司固定效应 | × | √ | √ | × | √ | √ |
| 年度固定效应 | √ | √ | √ | √ | √ | √ |
| (13) | (14) | (15) | ||||
| 0.0050*** | 0.0021*** | 0.0010*** | ||||
| (0.0012) | (0.0003) | (0.0003) | ||||
| 时变公司特征变量 | × | × | √ | |||
| 公司固定效应 | × | √ | √ | |||
| 年度固定效应 | √ | √ | √ | |||
表7 时变公司特征变量的估计结果
Tab. 7 The estimate results for time-varied company characteristic variables
| (3) | (6) | (9) | (12) | (15) | |
|---|---|---|---|---|---|
| –0.0025 | 0.0001 | 0.0002 | 0.0001 | 0.0001 | |
| (0.0031) | (0.0006) | (0.0005) | (0.0006) | (0.0006) | |
| –0.0490*** | 0.0012 | 0.0033 | 0.0026 | 0.0025 | |
| (0.0144) | (0.0027) | (0.0027) | (0.0027) | (0.0027) | |
| 0.0067 | 0.0082*** | 0.0077*** | 0.0069*** | 0.0074*** | |
| (0.0069) | (0.0013) | (0.0012) | (0.0013) | (0.0013) | |
| –0.0049 | –0.0002 | –0.0001 | –0.0003 | –0.0002 | |
| (0.0037) | (0.0007) | (0.0006) | (0.0007) | (0.0007) | |
| 0.0200*** | 0.0026* | 0.0023* | 0.0022* | 0.0024* | |
| (0.0072) | (0.0014) | (0.0014) | (0.0013) | (0.0013) |
表8 地理扩张对普通方法估计的利润效率的影响
Tab. 8 The effect of geographical expansion on ordinary profit efficiency
| 被解释变量:Profitit (普通估计) | ||||||
|---|---|---|---|---|---|---|
| (1) | (2) | (3) | (4) | (5) | (6) | |
| 0.0708*** | 0.0032 | –0.0016 | 0.0038*** | 0.0008 | 0.0000 | |
| (0.0114) | (0.0040) | (0.0045) | (0.0004) | (0.0005) | (0.0006) | |
| 时变公司特征变量 | × | × | √ | × | × | √ |
| 公司固定效应 | × | √ | √ | × | √ | √ |
| 年度固定效应 | √ | √ | √ | √ | √ | √ |
| (7) | (8) | (9) | (10) | (11) | (12) | |
| 0.1040*** | 0.0129 | 0.0043 | 0.1090*** | 0.0136* | –0.0031 | |
| (0.0114) | (0.0080) | (0.0097) | (0.0117) | (0.0079) | (0.0098) | |
| 时变公司特征变量 | × | × | √ | × | × | √ |
| 公司固定效应 | × | √ | √ | × | √ | √ |
| 年度固定效应 | √ | √ | √ | √ | √ | √ |
| (13) | (14) | (15) | ||||
| 0.0231*** | 0.0014 | –0.0015 | ||||
| (0.0024) | (0.0014) | (0.0016) | ||||
| 时变公司特征变量 | × | × | √ | |||
| 公司固定效应 | × | √ | √ | |||
| 年度固定效应 | √ | √ | √ | |||
中国产险业的经营状况具有明显的空间分异性,且近些年中国产险公司进行了较快速的地理扩张,那么,地理扩张如何影响产险公司的盈利能力?本文收集了2006-2015年中国64家产险公司的面板数据,基于多个地理扩张指标的回归分析发现:地理扩张与盈利能力呈显著正相关,六成以上的正相关是来自于盈利能力强的产险公司更会去实施地理扩张;不过,地理扩张对产险公司的盈利能力仍然产生了一定程度的正向影响,此发现不同于以往绝大多数对于金融机构的相关研究结论;当以普通方法估计的利润效率作为回归中的因变量时,难以得出产险公司的地理扩张对盈利能力有(正向或负向)影响的结论。
本文的政策含义在于两个方面:① 由于中国产险行业的经营状况具有明显的空间分异性,因此,在研究产险业发展状况、经营成果等问题时建议对此加强考虑。② 在产业实践上,中国产险公司整体上应当加强地理扩张以提高盈利能力,而近十几年保险监管中“支持设立区域性保险公司”倾斜性政策可能不具有经济上的合理性,建议考虑修改,这属于中国保险业进行“供给侧结构性”改革的内容。
表9 首次地理扩张前后的利润效率
Tab. 9 Profit efficiency before and after the initial geographical expansion
| Profitit(地理加权) | ||||||
|---|---|---|---|---|---|---|
| 首次跨省区市经营的前后比较 | 首次跨大区域经营的前后比较 | |||||
| 系数 | 标准误 | t统计量 | 系数 | 标准误 | t统计量 | |
| D-3t | 0.006 | (0.006) | [0.99] | 0.006 | (0.007) | [0.92] |
| D-2t | 0.005 | (0.006) | [0.95] | 0.008 | (0.006) | [1.40] |
| D-t | 0.001 | (0.004) | [0.32] | 0.001 | (0.005) | [0.12] |
| Dt | 0.016 | (0.004) | [3.59] | 0.015 | (0.004) | [3.22] |
| D2t | 0.013 | (0.004) | [2.74] | 0.010 | (0.004) | [2.00] |
| D3t | 0.015 | (0.004) | [3.13] | 0.012 | (0.005) | [2.52] |
| 公司固定效应 | √ | √ | √ | √ | √ | √ |
| 年度固定效应 | √ | √ | √ | √ | √ | √ |
| R2 | 0.96 | 0.96 | ||||
| 观察值数 | 288 | 295 | ||||
附表 2015年样本构成和地理加权的利润效率
Annexed Table Composition of the sample and geographically-weighted profit efficiency in 2015
| 序号 | 公司名称(作为地理基准点的公司) | 总部地 | 利润效率 | 序号 | 公司名称 (作为地理基准点的公司) | 总部地 | 利润效率 |
|---|---|---|---|---|---|---|---|
| 1 | 中国人民 | 北京 | 0.682 | 33 | 信达 | 北京 | 0.742 |
| 2 | 中国人寿 | 北京 | 0.733 | 34 | 泰山 | 山东 | 0.777 |
| 3 | 中国大地 | 上海 | 0.692 | 35 | 锦泰 | 四川 | 0.617 |
| 4 | 太平 | 上海 | 0.696 | 36 | 众诚汽车 | 广东 | 0.639 |
| 5 | 中国太平洋 | 上海 | 0.727 | 37 | 长江 | 湖北 | 0.672 |
| 6 | 中国平安 | 广东 | 0.715 | 38 | 诚泰 | 云南 | 0.627 |
| 7 | 中华联合 | 北京 | 0.624 | 39 | 富德 | 广东 | 0.690 |
| 8 | 阳光 | 北京 | 0.740 | 40 | 鑫安汽车 | 吉林 | 0.442 |
| 9 | 华泰 | 北京 | 0.702 | 41 | 北部湾 | 广西 | 0.542 |
| 10 | 天安 | 上海 | 0.685 | 42 | 众安在线 | 上海 | 0.542 |
| 11 | 史带 | 上海 | 0.540 | 43 | 中意 | 北京 | 0.507 |
| 12 | 华安 | 广东 | 0.766 | 44 | 国泰 | 上海 | 0.672 |
| 13 | 永安 | 陕西 | 0.653 | 45 | 美亚 | 上海 | 0.718 |
| 14 | 永诚 | 上海 | 0.696 | 46 | 东京海上日动 | 上海 | 0.564 |
| 15 | 安信农业 | 上海 | 0.467 | 47 | 瑞再企商 | 上海 | 0.716 |
| 16 | 安邦 | 北京 | 0.589 | 48 | 丘博 | 上海 | 0.823 |
| 17 | 安华农业 | 吉林 | 0.592 | 49 | 三井住友海上 | 上海 | 0.444 |
| 18 | 阳光农业 | 黑龙江 | 0.286 | 50 | 三星 | 上海 | 0.386 |
| 19 | 安盛天平 | 上海 | 0.542 | 51 | 安联 | 广东 | 0.551 |
| 20 | 渤海 | 天津 | 0.738 | 52 | 日本 | 上海 | 0.652 |
| 21 | 都邦 | 吉林 | 0.744 | 53 | 利宝互助 | 重庆 | 0.709 |
| 22 | 华农 | 北京 | 0.678 | 54 | 中航安盟 | 四川 | 0.862 |
| 23 | 民安 | 广东 | 0.661 | 55 | 苏黎世 | 北京 | 0.789 |
| 24 | 安诚 | 重庆 | 0.685 | 56 | 现代 | 北京 | 0.327 |
| 25 | 中银 | 北京 | 0.658 | 57 | 劳合社 | 上海 | 0.458 |
| 26 | 英大泰和 | 北京 | 0.584 | 58 | 爱和谊日生同和 | 天津 | 0.682 |
| 27 | 长安责任 | 北京 | 0.701 | 59 | 日本兴亚 | 广东 | 0.607 |
| 28 | 国元农业 | 安徽 | 0.299 | 60 | 乐爱金 | 江苏 | 0.390 |
| 29 | 鼎和 | 广东 | 0.444 | 61 | 富邦 | 福建 | 0.749 |
| 30 | 中煤 | 山西 | 0.689 | 62 | 信利 | 上海 | 0.593 |
| 31 | 紫金 | 江苏 | 0.690 | 63 | 天平汽车 | 上海 | 0.739 |
| 32 | 浙商 | 浙江 | 0.579 | 64 | 安盛 | 上海 | 0.688 |
The authors have declared that no competing interests exist.
| [1] |
An empirical study on the locational choices of foreign banks in China. https://doi.org/10.3321/j.issn:0375-5444.2009.06.007 URL [本文引用: 1] 摘要
金融业渐进式准入制度直接影响外资银行进入中国市场。伴随改革开放进程,外资银行最初聚集于经济特区和北京,进而扩散到上海、天津、大连和广州,以致于中西部城市,如重庆、成都和西安。外资银行的分行支行尤为聚集于珠三角、长三角和京津等经济发达地区,代表处则偏好聚集于北京和上海。条件逻辑模型统计结果表明,外资银行所有权优势、内部化优势和中国城市的区位优势,尤其是制度优势和银行业规模经济优势共同影响外资银行分支机构在中国的区位选择。外资银行尤为偏好金融规模效应显著、对外资银行准入管制较少的贸易型城市,央行总部及其区域性分行所在城市也是外资银行偏好的区位。由于代表处与分行或支行的功能差异,两者的区位行为存在一定不同。
外资银行在中国的区位选择 .https://doi.org/10.3321/j.issn:0375-5444.2009.06.007 URL [本文引用: 1] 摘要
金融业渐进式准入制度直接影响外资银行进入中国市场。伴随改革开放进程,外资银行最初聚集于经济特区和北京,进而扩散到上海、天津、大连和广州,以致于中西部城市,如重庆、成都和西安。外资银行的分行支行尤为聚集于珠三角、长三角和京津等经济发达地区,代表处则偏好聚集于北京和上海。条件逻辑模型统计结果表明,外资银行所有权优势、内部化优势和中国城市的区位优势,尤其是制度优势和银行业规模经济优势共同影响外资银行分支机构在中国的区位选择。外资银行尤为偏好金融规模效应显著、对外资银行准入管制较少的贸易型城市,央行总部及其区域性分行所在城市也是外资银行偏好的区位。由于代表处与分行或支行的功能差异,两者的区位行为存在一定不同。
|
| [2] |
Regional differences of local banking systems in China. https://doi.org/10.3321/j.issn:0375-5444.2007.12.001 URL 摘要
随着中国国金融服务业不断深人改革以及对外资金融机构的逐渐开放.金融服务业的空间格局更为复杂。以银行业为例.区域内服务地域范围不同的银行金融机构的组合已经引起人们的重视.这种组合就构成了地区金融系统(地区银行系统)。地区金融系统内的银行金融机构可以划分为包括国有商业银行、政策性银行、全国性股份制商业银行、外资银行等的外来型银行金融机构.以及包括城市商业银行(城市信用社)、农村信用社(农村合作银行)等的本地型银行金融机构。研究表明:地区金融系统存在着萌芽期、发展期以及成熟期三个发展阶段.不同阶段具有明显的特点。地区金融系统受到地区经济发展水平、产业结构、地方政策以及地区金融素养等因素影响。采用定性和定量相结合的方法.利用中国30个省市(自治区)的数据.分析了中国各地区金融系统的区域差异。在各地区金融系统中,外来型银行金融机构表现为:国有银行的分支机构处于相对主导的地位;外资银行集中于重要结点;全国性股份制商业银行区域性集中趋势明显:对于本地型银行金融机构则具有城市商业银行分布不均:农村信用社填充国有银行撤出地区空白,但实际发挥的作用有限等特点。
中国地区银行业金融系统的区域差异 .https://doi.org/10.3321/j.issn:0375-5444.2007.12.001 URL 摘要
随着中国国金融服务业不断深人改革以及对外资金融机构的逐渐开放.金融服务业的空间格局更为复杂。以银行业为例.区域内服务地域范围不同的银行金融机构的组合已经引起人们的重视.这种组合就构成了地区金融系统(地区银行系统)。地区金融系统内的银行金融机构可以划分为包括国有商业银行、政策性银行、全国性股份制商业银行、外资银行等的外来型银行金融机构.以及包括城市商业银行(城市信用社)、农村信用社(农村合作银行)等的本地型银行金融机构。研究表明:地区金融系统存在着萌芽期、发展期以及成熟期三个发展阶段.不同阶段具有明显的特点。地区金融系统受到地区经济发展水平、产业结构、地方政策以及地区金融素养等因素影响。采用定性和定量相结合的方法.利用中国30个省市(自治区)的数据.分析了中国各地区金融系统的区域差异。在各地区金融系统中,外来型银行金融机构表现为:国有银行的分支机构处于相对主导的地位;外资银行集中于重要结点;全国性股份制商业银行区域性集中趋势明显:对于本地型银行金融机构则具有城市商业银行分布不均:农村信用社填充国有银行撤出地区空白,但实际发挥的作用有限等特点。
|
| [3] |
Research on the spatial radiation ability of regional financial center in China. https://doi.org/10.11821/dlyj201406014 URL Magsci 摘要
通过对中国地市级以上行政区域及部分县级行政区域金融业的空间分布格局和空间相关性的分析,将金融业的空间区位差作为衡量区域性金融中心辐射能力的指标,并在新经济地理学理论框架下,拓展传统的空间计量回归模型,对中国区域性金融中心辐射能力进行影响因素分析。结果发现中国金融业存在着较强的空间相关性和空间溢出效应,中国区域性金融中心具有显著的空间辐射能力;中国区域性金融中心空间辐射能力不仅同本区域经济规模、金融环境和人力支撑有关,而且还受到相邻区域的经济因素和相邻区域间经济差异的影响;中国金融产业空间扩散不同于传统产业,有其本身固有的特点,其受贸易活跃程度和交通运输条件的影响并不明显。进而,本文提出了研究的理论启示和政策建议。
中国区域性金融中心的空间辐射能力 .https://doi.org/10.11821/dlyj201406014 URL Magsci 摘要
通过对中国地市级以上行政区域及部分县级行政区域金融业的空间分布格局和空间相关性的分析,将金融业的空间区位差作为衡量区域性金融中心辐射能力的指标,并在新经济地理学理论框架下,拓展传统的空间计量回归模型,对中国区域性金融中心辐射能力进行影响因素分析。结果发现中国金融业存在着较强的空间相关性和空间溢出效应,中国区域性金融中心具有显著的空间辐射能力;中国区域性金融中心空间辐射能力不仅同本区域经济规模、金融环境和人力支撑有关,而且还受到相邻区域的经济因素和相邻区域间经济差异的影响;中国金融产业空间扩散不同于传统产业,有其本身固有的特点,其受贸易活跃程度和交通运输条件的影响并不明显。进而,本文提出了研究的理论启示和政策建议。
|
| [4] |
The influence of geographical distribution of commercial bank loan on the bank profit efficiency in China. https://doi.org/10.11821/dlxb201506009 URL [本文引用: 3] 摘要
The regional development research on commercial banks has always been the focus of financial geography research. At present, there is still debate on whether the geographical decentralization level of commercial bank loan can positively influence bank performance. This paper uses the loan data of 13 listed commercial banks in China releasing to each province during 2007-2013 to analyze the loan releasing geographical distribution characteristics of large-sized commercial banks and small and medium-sized commercial banks and the geographic variation trend of non-performing loans. On such basis, it uses stochastic frontier analysis (SFA) and the basic model of Battese and Collie (1995) to build the trans-log profit function model to conduct empirical analysis of the influence of geographical decentralization level of commercial bank loan on the efficiency of bank profits. Research results show that: (1) Increasing the geographical decentralization level of loan can boost the revenue and profit efficiency for commercial banks in the process of banking operation; (2) Large-sized commercial banks, due to the effect of national policies, cover broader loan releasing areas, and the loan releasing proportion in the central and western regions is significantly higher than that of the small and medium-sized commercial banks, and the average profit efficiency has always been higher than that of the small and medium-sized commercial banks. However, in recent years, with the gradually increasing geographical decentralization level of small and medium-sized commercial banks loan, the gap of profit efficiency between the two has been narrowed; (3) At present, the loan business of some small and medium-sized commercial banks in China still belongs to the relationship loan, and raising the geographical decentralization level of loan will lower their profit efficiency. Therefore, the diversified business operation should be carefully handled and cannot blindly follow it.
中国商业银行贷款地理分布对银行利润效率的影响 .https://doi.org/10.11821/dlxb201506009 URL [本文引用: 3] 摘要
The regional development research on commercial banks has always been the focus of financial geography research. At present, there is still debate on whether the geographical decentralization level of commercial bank loan can positively influence bank performance. This paper uses the loan data of 13 listed commercial banks in China releasing to each province during 2007-2013 to analyze the loan releasing geographical distribution characteristics of large-sized commercial banks and small and medium-sized commercial banks and the geographic variation trend of non-performing loans. On such basis, it uses stochastic frontier analysis (SFA) and the basic model of Battese and Collie (1995) to build the trans-log profit function model to conduct empirical analysis of the influence of geographical decentralization level of commercial bank loan on the efficiency of bank profits. Research results show that: (1) Increasing the geographical decentralization level of loan can boost the revenue and profit efficiency for commercial banks in the process of banking operation; (2) Large-sized commercial banks, due to the effect of national policies, cover broader loan releasing areas, and the loan releasing proportion in the central and western regions is significantly higher than that of the small and medium-sized commercial banks, and the average profit efficiency has always been higher than that of the small and medium-sized commercial banks. However, in recent years, with the gradually increasing geographical decentralization level of small and medium-sized commercial banks loan, the gap of profit efficiency between the two has been narrowed; (3) At present, the loan business of some small and medium-sized commercial banks in China still belongs to the relationship loan, and raising the geographical decentralization level of loan will lower their profit efficiency. Therefore, the diversified business operation should be carefully handled and cannot blindly follow it.
|
| [5] |
Geographic diversification, bank holding company value, and risk. Journal of Money, |
| [6] |
DeYoung R. The effects of geographic expansion on bank efficiency. |
| [7] |
Boundaries of the firm: Evidence from the banking industry. https://doi.org/10.1016/S0304-405X(03)00170-3 Magsci 摘要
<h2 class="secHeading" id="section_abstract">Abstract</h2><p id="">Agency theory implies that asset ownership and decision authority are complements. Using 1998 data from Texas commercial banks, we test whether the likelihood of local ownership of bank offices increases with the importance of granting local managers greater decision authority (for example, due to location or customer base). Our empirical evidence is consistent with this hypothesis. It suggests that complementarities between strategy and organizational structure can foster differentiation among firms in terms of location, customers, and products. It also supports the growing view that small locally-owned banks have a comparative advantage over large banks within specific environments.</p>
|
| [8] |
Does diversification improve the performance of German banks? Evidence from individual bank loan portfolios. https://doi.org/10.1007/s10693-007-0017-0 URL Magsci 摘要
Should banks be diversified or focused? Does diversification indeed lead to increased performance and therefore greater safety on the part of banks as traditional portfolio and banking theory would suggest? Recently, Acharya et al. (J Bus, 79:1355–1412, 2006) have found that for Italian banks the answers to these questions depend on the level of risk that a bank has taken. In this paper we investigate whether this result is robust to the choice of the sample and to the calculation of the risk variable. To this end we use a unique data set of the individual bank loan portfolios of 983 German banks for the period from 1996 to 2002 and calculate a Value-at-Risk based risk variable. We then investigate the link between banks’ profitability and their portfolio diversification across different industries, broader economic sectors and geographical regions. We find little evidence of large performance benefits associated with diversification: For the majority of our data, diversification tends to be associated with reductions in bank returns, even after controlling for risk. Only in a few cases (e.g., high-risk banks and industrial diversification) do we find statistically significant positive relationships between diversification and bank returns. Our findings contradict both the empirical findings of Acharya et al. (J Bus, 79:1355–1412, 2006) and the theoretical findings of Winton (Don’t put all your eggs in one basket? Diversification and specialization in lending. Working Paper No. 00-16, University of Minnesota, 1999).
|
| [9] |
Do financial conglomerates create or destroy economic value? https://doi.org/10.1016/j.jfi.2008.07.002 URL Magsci 摘要
This paper investigates whether functional diversification is value-enhancing or value-destroying in the financial services sector, broadly defined. Based on a U.S. dataset comprising approximately 4060 observations covering the period 1985鈥2004, we report a substantial and persistent conglomerate discount among financial intermediaries. Our results suggest that it is diversification that causes the discount, and not that troubled firms diversify into other more promising areas. In addition, the discount applies to all financial services activity-areas with the exception of investment banking and is stable over different combinations of financial activity-areas with the exception of commercial banking units combined with insurance companies and/or investment banking activities.
|
| [10] |
Trans-regional operation of city commercial bank: Credit expansion, risk level and bank performance .URL 摘要
本文使用我国城市商业银行2004—2009年跨区域经营数据,首次对城市商业银行跨区域经营的相关问题进行了实证研究。结果发现,现阶段进行跨区域经营的城市商业银行中多是资产规模大、资本水平高、资产质量好、市场势力强的“好银行”。与只在本区域经营的银行相比,跨区域经营能有效分散投资风险,避免区域经济波动的风险,有益于降低银行风险水平。此外,跨区域经营的程度越高,银行的信贷增速越快、风险水平也显著降低。本文的这些发现为城市商业银行跨区域经营战略提供了经验支持,也为监管当局进一步改革监管政策提供了相关依据。
城市商业银行跨区域经营: 信贷扩张、风险水平及银行绩效 .URL 摘要
本文使用我国城市商业银行2004—2009年跨区域经营数据,首次对城市商业银行跨区域经营的相关问题进行了实证研究。结果发现,现阶段进行跨区域经营的城市商业银行中多是资产规模大、资本水平高、资产质量好、市场势力强的“好银行”。与只在本区域经营的银行相比,跨区域经营能有效分散投资风险,避免区域经济波动的风险,有益于降低银行风险水平。此外,跨区域经营的程度越高,银行的信贷增速越快、风险水平也显著降低。本文的这些发现为城市商业银行跨区域经营战略提供了经验支持,也为监管当局进一步改革监管政策提供了相关依据。
|
| [11] |
Identifying the valuation effects and agency costs of corporate diversification: Evidence from the geographic diversification of US banks. https://doi.org/10.1093/rfs/hht021 URL Magsci [本文引用: 2] 摘要
This paper assesses the impact of the geographic diversification of bank holding company (BHC) assets across the United States on their market valuations. Using two new identification strategies based on the dynamic process of interstate bank deregulation, we find that exogenous increases in geographic diversity reduced BHC valuations. We also find that the geographic diversification of BHC assets increased insider lending and reduced loan quality. Taken together, these findings are consistent with theories predicting that geographic diversity intensifies agency problems.
|
| [12] |
Trans-regional operation and small and medium-sized banks' performance .
跨区经营与中小银行绩效 .
|
| [13] |
The roles of business concentration in the profit and risks of life insurance companies. https://doi.org/10.3969/j.issn.1002-2848.2015.03.004 URL [本文引用: 1] 摘要
本文从产品类型、销售渠道、地理区域三个维度研究业务集中度对中国寿险公司利润和风险的作用.基于2005-2012年中国寿险公司的非平衡面板数据,计量分析发现,三个维度的集中度对公司利润、风险的作用存在较大差异,并且业务集中度对中资寿险公司和外资寿险公司作用也显著不同.对于中资寿险公司,产品集中度负向影响利润,正向影响风险;渠道、地理集中度正向影响利润;对于外资寿险公司,三个维度的集中度均正向影响公司利润,负向影响公司风险.此外,产品集中度对利润的正向影响、产品和渠道集中度对风险的负向影响均在外资寿险公司中更强,外资寿险公司从专业化中受益更大.
业务集中度对寿险公司利润和风险的作用研究 .https://doi.org/10.3969/j.issn.1002-2848.2015.03.004 URL [本文引用: 1] 摘要
本文从产品类型、销售渠道、地理区域三个维度研究业务集中度对中国寿险公司利润和风险的作用.基于2005-2012年中国寿险公司的非平衡面板数据,计量分析发现,三个维度的集中度对公司利润、风险的作用存在较大差异,并且业务集中度对中资寿险公司和外资寿险公司作用也显著不同.对于中资寿险公司,产品集中度负向影响利润,正向影响风险;渠道、地理集中度正向影响利润;对于外资寿险公司,三个维度的集中度均正向影响公司利润,负向影响公司风险.此外,产品集中度对利润的正向影响、产品和渠道集中度对风险的负向影响均在外资寿险公司中更强,外资寿险公司从专业化中受益更大.
|
| [14] |
Non-life insurance consumption in Italy: A sub-regional panel data analysis. https://doi.org/10.1007/s10109-010-0125-5 URL Magsci 摘要
We analyze the consumption of non-life insurance across 103 Italian provinces in 1998鈥2002 in order to assess its determinants, in the light of the empirical literature. Using sub-regional data, we overcome an important limitation of cross-country analyses, i.e. the systemic heterogeneity due to country-specific characteristics. Individual heterogeneity is accounted for through panel data techniques. However, considering spatial units within a single market raises issues of cross-sectional or spatial dependence, either due to common nationwide and/or regional factors or to spatial proximity. We carefully assess spatial dependence, employing recent diagnostic tests, finding out that the regressors included in our specification successfully account for spatial dependence. Insurance turns out to depend on income, wealth and some demographics, as already established, but also on trust, judicial efficiency and borrowing conditions. These findings help in explaining the gap between Central-Northern Italy and the south of the country.
|
| [15] |
Geographical detectors-based health risk assessment and its application in the neural tube defects study of the Heshun Region, China. https://doi.org/10.1080/13658810802443457 URL [本文引用: 2] 摘要
Physical environment, man‐made pollution, nutrition and their mutual interactions can be major causes of human diseases. These disease determinants have distinct spatial distributions across geographical units, so that their adequate study involves the investigation of the associated geographical strata. We propose four geographical detectors based on spatial variation analysis of the geographical strata to assess the environmental risks of health: the risk detector indicates where the risk areas are; the factor detector identifies factors that are responsible for the risk; the ecological detector discloses relative importance between the factors; and the interaction detector reveals whether the risk factors interact or lead to disease independently. In a real‐world study, the primary physical environment (watershed, lithozone and soil) was found to strongly control the neural tube defects (NTD) occurrences in the Heshun region (China). Basic nutrition (food) was found to be more important than man‐made pollution (chemical fertilizer) in the control of the spatial NTD pattern. Ancient materials released from geological faults and subsequently spread along slopes dramatically increase the NTD risk. These findings constitute valuable input to disease intervention strategies in the region of interest.
|
| [16] |
A measure of spatial stratified heterogeneity. https://doi.org/10.1016/j.ecolind.2016.02.052 URL [本文引用: 1] 摘要
Spatial stratified heterogeneity, referring to the within-strata variance less than the between strata-variance, is ubiquitous in ecological phenomena, such as ecological zones and many ecological variables. Spatial stratified heterogeneity reflects the essence of nature, implies potential distinct mechanisms by strata, suggests possible determinants of the observed process, allows the representativeness of observations of the earth, and enforces the applicability of statistical inferences. In this paper, we propose a q -statistic method to measure the degree of spatial stratified heterogeneity and to test its significance. The q value is within [0,1] (0 if a spatial stratification of heterogeneity is not significant, and 1 if there is a perfect spatial stratification of heterogeneity). The exact probability density function is derived. The q -statistic is illustrated by two examples, wherein we assess the spatial stratified heterogeneities of a hand map and the distribution of the annual NDVI in China.
|
| [17] |
Spatial differentiation patterns and influencing mechanism of housing prices in China: Based on data of 2872 counties. https://doi.org/10.11821/dlxb201608004 URL [本文引用: 2] 摘要
以2014年中国2872个县级单元的住宅平均单价为基本数据,通过空间自相关和核密度函数分析中国住宅价格的差异格局、空间关联特征和分布形态,构建“住宅价格等级金字塔”;根据“需求+供给+市场”的三维理论视角建立包括5大住宅价格差异影响因素在内的价格模型,采用地理探测器分析全国及其区域子市场的影响因素强度差异,并探索其影响机制.结果表明:①中国区域住宅价格呈现以行政等级性为主、空间集聚性为辅的双重差异格局,其空间关联与集聚性显著;②中国住宅价格呈现出房价越高,区域越少,所居住城镇人口越少的“金字塔式”等级分布特征.③租房户比例、流动人口规模、住房支付能力、住房市场活跃度、土地成本是中国住宅价格差异的5个核心影响因素,不同行政等级子市场的影响因素作用强度各异.
中国县域住宅价格的空间差异特征与影响机制 .https://doi.org/10.11821/dlxb201608004 URL [本文引用: 2] 摘要
以2014年中国2872个县级单元的住宅平均单价为基本数据,通过空间自相关和核密度函数分析中国住宅价格的差异格局、空间关联特征和分布形态,构建“住宅价格等级金字塔”;根据“需求+供给+市场”的三维理论视角建立包括5大住宅价格差异影响因素在内的价格模型,采用地理探测器分析全国及其区域子市场的影响因素强度差异,并探索其影响机制.结果表明:①中国区域住宅价格呈现以行政等级性为主、空间集聚性为辅的双重差异格局,其空间关联与集聚性显著;②中国住宅价格呈现出房价越高,区域越少,所居住城镇人口越少的“金字塔式”等级分布特征.③租房户比例、流动人口规模、住房支付能力、住房市场活跃度、土地成本是中国住宅价格差异的5个核心影响因素,不同行政等级子市场的影响因素作用强度各异.
|
| [18] |
|
| [19] |
|
| [20] |
|
| [21] |
Analyzing firm performance in the insurance industry using frontier efficiency and productivity methods//Dionnes G. Handbook of Insurance. |
| [22] |
Analyzing firm performance in the insurance industry using frontier efficiency and productivity methods//Dionnes G. Handbook of Insurance. 2nd ed.
|
| [23] |
Frontier efficiency methodologies to measure performance in the insurance industry: Overview, systematization, and recent developments. Geneva Papers on Risk and Insurance-Issues and |
| [24] |
Organizational form and efficiency: The coexistence of stock and mutual property-liability insurers. https://doi.org/10.1287/mnsc.45.9.1254 URL [本文引用: 1] 摘要
This article introduces a new approach, cross-frontier analysis, for estimating the relative efficiency of alternative organizational forms in an industry. The technique is illustrated by analyzing a sample of stock and mutual property-liability insurers using nonparametric frontier efficiency methods. Cross-frontier analysis measures the relative efficiency of each organizational form by computing the efficiency of each stock (mutual) firm relative to a reference set consisting of all mutual (stock) firms. We test agency-theoretic hypotheses about organizational form, including the managerial discretion and expense preference hypotheses. The results indicate that stocks and mutuals are operating on separate production and cost frontiers and thus represent distinct technologies. Consistent with the managerial discretion hypothesis, the stock technology dominates the mutual technology for producing stock outputs and the mutual technology dominates the stock technology for producing mutual outputs. However, consistent with the expense preference hypothesis, the stock cost frontier dominates the mutual cost frontier. Our findings thus suggest a richer interpretation of organizational form than provided by previous researchers.
|
| [25] |
A geographically weighted approach to measuring efficiency in panel data: The case of US saving banks. https://doi.org/10.1016/j.jbankfin.2013.05.022 URL [本文引用: 1] 摘要
The objective of this article is to discuss a new approach to control for the environment when one estimates efficiency by the stochastic frontier model. By introducing geographical weights and estimating local frontiers for each US saving bank for 2001-09, we find that bank technical performance is higher for most banks in comparison to a fixed-effects approach. This result highlights the importance of explicitly considering local environment and constraints while analyzing banks' behavior. All in all, this model has been proved very promising and viable for future empirical studies.
|
| [26] |
Frontier production functions, technical efficiency and panel data: With application to paddy farmers in India. https://doi.org/10.1007/BF00158774 URL [本文引用: 3] 摘要
Frontier production functions are important for the prediction of technical efficiencies of individual firms in an industry. A stochastic frontier production function model for panel data is presented, for which the firm effects are an exponential function of time. The best predictor for the technical efficiency of an individual firm at a particular time period is presented for this time-varying model. An empirical example is presented using agricultural data for paddy farmers in a village in India.
|
| [27] |
A literature review on the stochastic frontier analysis in panel data. https://doi.org/10.19343/j.cnki.11-1302/c.2016.06.002 URL [本文引用: 1] 摘要
近年来,面板数据随机前沿分析(SFA)越来越多地被用于测算各类决策单位的效率,取得了很多成果,但是国内外实证研究文献也存在过度依赖几种假设严格的模型和不注重模型局限性的问题。本文在统一的计量框架下,对面板SFA模型的发展研究进行了系统的梳理总结。本文将相关模型分为效率不随时间变化的模型和效率可随时间变化两大类,每一类又根据是否对效率项的分布做出假设分为有分布假设的模型和无分布假设的模型。在明确和比较不同模型的假设、估计过程和局限性的基础上,对面板SFA模型的应用提出了建议。
面板数据随机前沿分析的研究综述 .https://doi.org/10.19343/j.cnki.11-1302/c.2016.06.002 URL [本文引用: 1] 摘要
近年来,面板数据随机前沿分析(SFA)越来越多地被用于测算各类决策单位的效率,取得了很多成果,但是国内外实证研究文献也存在过度依赖几种假设严格的模型和不注重模型局限性的问题。本文在统一的计量框架下,对面板SFA模型的发展研究进行了系统的梳理总结。本文将相关模型分为效率不随时间变化的模型和效率可随时间变化两大类,每一类又根据是否对效率项的分布做出假设分为有分布假设的模型和无分布假设的模型。在明确和比较不同模型的假设、估计过程和局限性的基础上,对面板SFA模型的应用提出了建议。
|

/
| 〈 |
|
〉 |