马琳
MA Lin
通讯作者:
收稿日期: 2016-07-15
修回日期: 2017-03-22
网络出版日期: 2017-08-07
版权声明: 2017 《地理学报》编辑部 本文是开放获取期刊文献,在以下情况下可以自由使用:学术研究、学术交流、科研教学等,但不允许用于商业目的.
基金资助:
作者简介:
作者简介:马琳(1988-), 女, 河北沧州人, 博士, 助理研究员, 中国地理学会会员(S110010111M), 研究方向为土地利用、城市与区域规划。E-mail: linma2007@hotmail.com
展开
摘要
生态系统为人类供给产品与服务,人类对其产品与服务形成需求和消费,供需两者共同构成生态系统服务从自然生态系统流向人类社会系统的动态过程。对生态系统服务的供给和需求进行识别、度量、空间化及均衡分析是生态系统服务研究的重要组成部分,有助于生态系统有效管理以及自然资源合理配置,为生态系统服务付费和生态补偿提供理论支撑。本文基于国内外理论和案例研究成果,首先梳理生态系统服务供给和需求的含义,其次总结和对比从供需空间特征角度对生态系统服务的分类,并归纳生态系统供给和需求的空间化方法,最后从实际供给和潜在供给、实现需求和总量需求、供需数量和空间关系3个方面探讨生态系统服务供需均衡分析框架。
关键词:
Abstract
Natural ecosystems supply tangible products and intangible services, which are demanded and consumed by human beings. Therefore, supply and demand make up the dynamic process of ecosystem services flowing from natural ecosystems to human society. The process of identifying, measuring, mapping and conducting an equilibrium analysis of the supply and demand of ecosystem services is beneficial for the effective management of natural ecosystems and optimal allocation of natural resources. Moreover, this can provide theoretical support to payments for environmental services and ecological compensation, thus promoting ecological security and sustainable development. Although the study of ecosystem services supply and demand is important, related studies are limited in China and are mainly focused on Europe and North America. Based on the theory and case studies conducted in China and other countries, this paper first presented the definition of ecosystem services supply and demand, including actual supply, potential supply, satisfied demand, and total demand. Second, the classifications of ecosystem services were compared based on their spatial characteristics. Third, the methods of mapping ecosystem services supply and demand were divided as follows: (1) land use estimation, which needs simple operation and limited data, may cause errors due to the loss of internal heterogeneity and boundary effects; (2) ecological process simulation is mostly applied in water-related ecosystem services, showing detailed and reliable results with multi-calculation; (3) spatial data superposition, which is an ideal method for mapping ecosystem services with complete spatial data sets; (4) expert knowledge, where the mapping of ecosystem services supply and demand is decided by a group of experts or is based on the previous related findings; however, the mapping principle followed in a local study may not be applicable to studies conducted at other places; and (5) the use of integrated models InVEST (Integrated Valuation of Ecosystem Services and Trade-offs), which is suitable for supply analysis, and ARIES (ARtificial Intelligence for Ecosystem Services), maps service flow from natural ecosystems to human beings. Finally, we discussed the equilibrium analysis framework for ecosystem services supply and demand from three angles: actual supply and potential supply, satisfied demand and total demand, and the spatial and quantitative relation between supply and demand.
Keywords:
生态系统服务是生态系统形成和维持的人类赖以生存和发展的环境条件与效用[1],是人类直接或者间接从生态系统功能中获得的产品和服务[2]。联合国千年生态系统评估计划(Millennium Ecosystem Assessment, MA)将生态系统服务定义为人类从生态系统获得的各种收益并将其分为4类:提供食物和水等物质的供给服务,调控洪水和疾病等方面的调节服务,提供精神、消遣和文化收益等方面的文化服务,以及在养分循环等方面维持地球生命条件的支持服务[3],因此,生态系统服务是至关重要的资源与环境基础。Daily[1]和Costanza等[2]发表的成果极大推动生态系统服务的研究工作,而千年生态系统评估则可称为生态系统服务研究的里程碑。自此之后,国内外生态系统服务研究大量涌现,取得了长足进展和丰富成果,主要集中在生态系统服务的分类、形成与影响机制、空间制图、与人类社会福祉的关系,以及服务之间的相互联系与作用[4]。
生态系统服务的供给指生态系统为人类生产产品与服务,需求则是人类对生态系统生产的产品与服务的消费与使用,两者共同构成生态系统服务从自然生态系统流向人类社会系统的动态过程[5]。从供给和需求角度对生态系统服务进行研究,对实现生态安全和社会经济可持续发展具有重要推动作用[6]。识别生态系统服务的供给区域并评估供给潜力,采取有效管理和适当开发,以满足日益增长的社会需求;明晰生态系统服务的需求空间和需求结构,有助于探究生态系统服务对经济发展的促进和制约作用;揭示生态系统服务供给和需求的差异,反映环境资源的空间配置,为生态系统服务付费和生态补偿提供理论支撑。在Web of Science和CNKI数据库以“ecosystem services”、“supply”和“demand”为主要关键字进行检索,并结合引文网络筛选相关文献,对近百篇期刊论文的统计显示生态系统服务供需研究的学者和案例主要集中在欧洲和美国。从研究对象来看,参考MA的生态系统服务分类,研究较多针对供给服务,其次为调节服务和文化服务,对支持服务的关注较少。空间尺度上,中小尺度的研究较多,且多以地形等自然条件划分研究区,如流域、山区和盆地;洲际和全球等大尺度研究较为少见。时间尺度上,静态研究较多,重点探讨供给和需求在某一时间点的空间和数量关系,少数涉及时间段内两者的时间和空间动态。从研究角度来看,多数学者以案例分析生态系统服务的供需关系,亦有单一关注供给或需求,少部分学者在理论上探讨研究范式和机理。
生态系统服务供需研究在国内尚处于起步阶段,理论方面,张立伟等[5]在综述生态系统服务制图时将供给和需求制图作为一项重点研究内容并予以概述;刘慧敏等[7]和肖玉等[8]关注生态系统服务从供给区到受益区的中间流动过程,分别梳理了服务空间流动的形成机制、载体和成本效应,以及研究发展脉络等。亦有学者进行案例研究和成果应用,如杨莉等[9]定量展示了黄河流域食物和薪柴供给的消费满足状况及其时空差异特征;赵庆建等[10]对森林生态系统碳流和水流的供需状况进行定性分析;唐秀美等[11]以生态系统服务需求为依据为北京划分生态区位。本文围绕生态系统服务供给和需求,对国内外相关理论方法和案例研究进行系统梳理,首先对比分析供给、需求、潜在供给、实际供给、总量需求和实现需求等概念的内涵;其次,归纳生态系统服务供需的空间特征及以此为基础的生态系统服务分类;第三,总结生态系统供给和需求的空间化方法和模型,对比土地利用估计、生态过程模拟、数据空间叠置、专家经验判别、InVEST(Integrated Valuation of Ecosystem Services and Trade-offs)模型和ARIES(ARtificial Intelligence for Ecosystem Services)模型等空间化方法的基本原理及优缺点;最后,从实际供给和潜在供给、实现需求和总量需求、供需数量和空间关系3个方面讨论生态系统服务供需的均衡分析框架。
生态系统服务的源头即服务在此产生,国内外学者主要以“供给”[11]和“Supply”[12]表示,亦或“供应”[10]、“Provision”[13]、“Production”[14]和“Source”[15]等,本文称之为供给。供给区域是由生态系统及其中的生物种群和物理组分构成。在刻画供给时,需考虑服务的直接形成因素(如生物种群、水体和土壤)和间接背景因素(如地形和流域)[15]。根据生态系统的承载能力和人对生态系统服务的利用程度,将供给分为潜在供给和实际供给。其中,潜在供给是生态系统以可持续的方式长期提供服务的能力,实际供给是被人切实消费或利用的产品或生态过程。一方面,由于需求较小或可达性差,并非所有的生态过程都可转变为服务,形成潜在供给>实际供给;另一方面,人类对某些生态系统服务的利用可能超过其本身的潜力,导致潜在供给<实际供给。以水供给和旅游娱乐为例,潜在供给体现于生态系统为人提供水资源以及风景等非物质信息,只有人利用水和探访景区时,潜在供给才转变为实际供给;若水源和景区未完全开发或利用不足,则潜在供给>实际供给;若水源过度汲取导致水质下降和水量减少,接纳游客过量使景区环境遭到破坏,则认为对生态系统服务的利用超过了其供给能力,即潜在供给<实际供给。
生态系统服务的终点即服务在此发生消减并产生效用,国内外学者主要称为“需求”[10]“Demand”[17],亦或“使用”[7]、“消费”[9]、“Use”[15]和“Benefit”[14]等,本文称之为生态系统服务的需求。对需求的研究应关注人类的活动地区,如城市、农村和行政辖区,同时需要一系列因子表示需求程度,如人口密度、家庭数目等人口统计量,以及服务重要性和服务可替代性等主观偏好参数[16]。不同学者在定义需求时存在差异,有的指代已经满足的生态系统服务需求[18],本文将其定义为实现需求,且等于已经利用的生态系统服务即实际供给;有的表示人对生态系统服务的全部需求即人的主观意愿[19],本文将其称为总量需求,既包括实现需求,也包括需求中未满足的部分,因此实现需求≤ 总量需求。
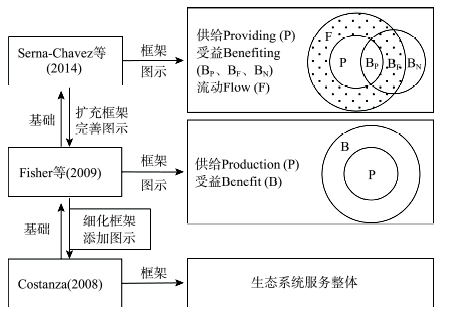
不同于应用广泛的基于生态系统服务内容的分类体系,近年来部分学者从服务供给和需求的空间特征角度对生态系统服务进行分类和探讨,具有代表性的是Costanza[20]、Fisher等[14]和Serna-Chavez等[21]的研究。Costanza[20]按照生态系统服务的整体空间特征将其归纳为5类:全球非临近、局部邻近、流动方向性、原位性和使用者迁移性。其中,气候调节等服务属于“全球非临近”,因其影响区域广,服务利用不依赖与供给地区的距离远近;“局部邻近”与“全球非临近”类似,不同的是前者的服务供给程度随到供给地区的距离增大而衰减,如蜂蝶等昆虫为栖息地周边农田提供的授粉服务;若生态系统服务从供给到利用的过程在空间上具有明显的方向则属于“流动方向性”,如河流上游生态系统为河流下游提供的洪水控制;土壤形成等服务在空间上不能产生转移即“原位性”,对服务的利用只能在供给区域发生;“使用者迁移性”意为服务使用者能够朝向生态系统移动,如游客到达景区后感受到的美学价值。在此基础上,Fisher等[14]明确区分服务产生区域(Service Production Areas)和服务受益区域(Service Benefit Areas),将生态系统服务识别为4类并辅以概念图示。与Costanza分类相比,Fisher等更关注生态系统服务的传播方向,将不具有特定方向的“全球非临近”和“局部邻近”合并为“全方向”,并将“流动方向性”按照是否依赖重力细分为两类,如山林提供的雪崩和滑坡防护为“重力依赖”,滨海湿地对海岸线的洪水防护属于“非重力依赖”。随后,Serna-Chavez等[21]将生态系统服务的空间传播媒介和流动途径纳入分类准则,如昆虫授粉和食物供给分别为基于生物传播和人为传播的服务类型,并以服务供给区(Service Providing Areas, P)、服务受益区(Service Benefiting Areas, B)和服务空间流动可达范围(Flow Areas, F)作为描述生态系统服务空间特征的3个基本要素,同时根据B与P、F的空间位置关系,将B进一步细分为与供给区重合(BP,即可在原地利用服务)、与P相离但与F重合(BF,即对利用的服务依赖于服务在空间上的传递),以及与P和F均相离(BN,表示无法利用服务)。
对比上述3类生态系统服务分类系统(图1),可以发现Costanza关注生态系统服务的整体空间特征,虽然分类结果相对简略,但为生态系统服务研究提供了新的空间视角,后续学者在不断完善服务流动和供给需求的研究框架时,均以其分类思路为基础。Fisher等将生态系统服务从生态系统到人类社会的动态过程划分为供给和受益两个部分,并以图示将两者的空间关系清晰直观的展现出来,细化理论框架并制图空间关系,对生态系统服务供需理论有重要推动作用。Serna-Chavez等除考虑供给和需求的空间特征外,还将服务流动的传播媒介纳入分类准则,以体现服务在供给区域和需求区域之间的流动过程,从而将理论框架扩展为供给、需求和流动3个要素;同时,区分生态系统服务的来源为当地生态系统或为异地生态系统服务流入,旨在强调服务流动对人类福祉的重要意义。总体来看,生态系统服务供需的概念框架经历了由简单到复杂、由静态到动态的逐步完善过程,研究趋向于更加细致的内部组分及其相互联系的探讨,为进一步生态系统服务供给和需求的度量、空间化及均衡分析提供了坚实的理论基础。
图1 基于空间特征的生态系统服务分类对比
Fig. 1 Comparison of ecosystem services classification based on spatial characteristics
目前,生态系统服务供给和需求的空间化方法尚不成熟,也由于研究区域、目的、对象和数据不同,方法多样且各具优劣。梳理国内外已有文献,依据采用的数据和模型将空间化方法总结为4类:土地利用估计、生态过程模拟、数据空间叠置和专家经验判别。另外,作为整合多种算法到同一平台的集成式模型,InVEST(Integrated Valuation of Ecosystem Services and Trade-offs)和ARIES(ARtificial Intelligence for Ecosystem Services)虽具有不同的开发目的和适用范围,但都可针对多种服务类型选择相应模块进行空间化和分析,具有良好的发展和应用前景。
该方法以土地利用和覆被为基础,根据生态系统服务的供需特点选择相关的土地利用和覆被类型,再采用阈值或空间化模型确定服务的供给区和需求区。例如,Serna-Chavez等[21]在全球尺度上探讨昆虫为农作物提供的授粉服务,首先以人为干预较少的绿地,如森林、灌木林和草地等作为服务的供给地类,再依据昆虫习性确定覆盖度≥ 45%的绿地为昆虫栖息地,即服务供给区域;随后结合作物分布图和作物对昆虫授粉的依赖程度,选择昆虫栖息地周围2 km范围内60种作物的种植区作为服务的需求区域。Schroter等[22]关注挪威Telemark郡的驼鹿狩猎(Moose Hunting)的潜在供给和实际供给。以森林和林地池沼作为驼鹿栖息地,采用驼鹿数量的统计值作为实际供给,以种群模型(Population Model)计算驼鹿数量的理论值作为潜在供给。Kroll等[18]研究德国东部地区Leipzig-Halle城乡梯度带的生物能等能源供给,将燃料作物耕地和森林作为供给区域,以城市和工业用地等用地类型为需求区域,并利用空间化模型及能源公司、郡和州等级别的统计数据进行制图。
在数据限制的情况下,基于土地利用和覆被进行估算可较为简便的对生态系统服务的供给和需求进行空间化。通过设置阈值确定供需边界,采用空间化模型体现供给能力和需求程度的空间差异。但由于数据精度有限和步骤相对简单,该方法并不足以充分体现供给和需求的内部异质性和边缘效应。另外,已有研究表明只以土地利用和覆被作为判断生态系统服务研究的依据,通常与基于生态监测的分析结果存在一定分歧[23]。
生态过程模拟多见于以水文模型分析洪水调节服务的供给。Stürck等[24]采用水文模型STREAM(Spatial Tools for River Basin Environment Analysis and Management)并结合流域、降雨、高程、土壤和植被等数据,计算欧洲地区50年一遇降雨条件下洪水调节服务的实际供给,再结合情景分析,以调整土地利用和植被覆盖情景下增强的洪水调节服务作为潜在供给。同时,以损害估计模型DSM(Damage Scanner Model,基于土地利用类型和洪水深度计算洪灾损失)和GDP数据估计GDP损失作为服务需求。Nedkov & Burkhard[25]以保加利亚南部的Malki Iskar流域为研究区,分析不同土地覆被类型对洪水的调节作用。通过KINEROS(KINematic Runoff and EROSion model)和SWAT(Soil and Water Assessment Tool)模型计算入渗速率、地表径流和最大流量等水文因子,并结合专家经验、土地利用等空间化生态系统服务供给。需求区域和程度则由地形、人口和经济等统计数据确定。
STREAM、KINEROS和SWAT都是目前应用较多且较为成熟的分布式流域水文模型,通过模拟截留、入渗和地表径流等水文过程分析洪水调节服务。利用过程模型模拟生态系统服务形成的自然和生物物理过程,往往需与多学科领域结合,过程相对复杂,对数据的要求也较高,因此空间化结果更为详细、客观和可靠。从已有文献来看,该方法案例相对较少,且主要集中在供给分析,是否适用于需求分析和模拟生态系统服务的消费过程仍有待探讨。
该方法不需进行复杂的模型计算,将影响服务供需的各个因素叠加,利用阈值等准则限定供给和需求的区域和程度。由于采用的数据和图件直接影响空间化结果,所以数据搜集需要全面准确。
Serna-Chavez等[21]在全球尺度下从农业角度分析气候调节和地下水灌溉服务,首先以碳固定和存储为例,研究气候变化对农作物生产的影响,将植被碳存储图和表土碳存储图叠加以获得全球碳存储密度,再借鉴Sitch等[26]的研究,由LPJ(Lund-Potsdam-Jena)-Dynamic Global Vegetation 模型计算净生态系统生产力图,将碳存储密度>0且净生态系统生产力>0的地区作为服务供给区域;其次,采用Wu等[27]的研究成果,即在管理和经济等条件保持稳定,仅气温和降水等气候条件变化的情景下,将4种主要作物小麦、水稻、大豆和玉米的减产区域作为服务需求区域。制图和量化地下水灌溉服务的方法则更为简便,提取地下水补给率>2 mm/a的盆地为研究区,并假设地下水灌溉的供给和利用仅局限在同一盆地内部,即某一盆地内部的地下水(灌溉水)不能服务于(来自于)另一盆地内的农业灌溉(地下水),之后分别利用全球地下水长期补给图和灌溉提取图得到供给和需求。
部分研究基于专家经验确定生态系统服务的供给和需求,如Palomo等[28]以西班牙南部的Donana国家公园和Sierra Nevada国家公园及附近保护区为研究区,在小尺度上探讨娱乐活动、食物供给和气候调节等的供给和需求。首先由来自国家公园、保护区、相关研究所和高校等机构的学者共41位专家组成团队,以调查问卷选定对当地较为重要的生态系统服务类型作为研究对象,通过实地考察判断各个服务类型的供需情况。Burkhard等[19, 29]以德国东部的城乡交错带Leipzig-Halle为研究区,以土地利用图为基础,利用专家经验并参考已有研究案例制定土地利用类型和生态系统服务供需状态的一一对应矩阵。结果显示森林、沼泽和荒野等自然地类的供给能力较高,需求主要集中在城镇、商业和工业用地等人工地类。
该方法需要研究者或具备研究区充分的背景材料,或组织多名相关专家形成团队,以详细了解当地的自然环境和社会条件,减少主观判定导致的误差。在数据难以获取的情况下,可采用该方法判断生态系统服务的供需情况。需要注意的是,因为同种地类或生态系统在地域间具有不同的状态从而供给程度不一,以及社会、经济、人口和政策环境存在差异而具有不同的需求,所以针对某一地区制定的评判准则难以直接用于其他 地区。
InVEST模型由美国斯坦福大学、明尼苏达大学、大自然保护协会和世界自然基金会联合开发,用于分析生态系统的结构和功能变化对生态系统服务及其价值的影响[30]。从2008年发布至今经过多个版本不断修善,是目前较为成熟且应用广泛的生态系统服务评估集成式模型。最新发布的InVEST 3.3.1版本具有生境质量(Habitat Quality)、农作物授粉(Crop Pollination)和海水养殖渔业(Marine Fish Aquaculture)等18种生态系统服务类型,涵盖陆地、淡水、海洋和滨海生态系统。
InVEST模型通过“供给(Supply)—服务(Service)—价值(Value)”框架将生态系统和人类社会联系起来。根据模型定义,“供给”为生态系统可潜在提供的物质或功能,同于本文的潜在供给;“供给”经过受益人的需求和利用转变为“服务”,对应本文实际供给和实现需求;之后再纳入社会偏好以经济和社会指标表示服务的“价值”[31]。Boithias等[32]采用InVEST模型估算西班牙北部埃布罗河盆地的工业、农业和城镇居民生活用水的供给和需求,以供给子模型结合土地利用和覆被、降水和土壤深度等数据计算供给水量,以服务子模型结合流域分布计算需求水量,并辅以当地17个水文站点的监测数据校正模型。
InVEST模型采用分层式设计,层级的高低与输入数据的完备程度和输出结果的准确性对应,因此可适应不同数据条件和结果要求,并且模型操作简便,在国内外应用广泛。然而模型的目标在于明晰生态系统变化对生态系统服务的影响,因此主要针对供给分析,在需求方面的应用相对不足。
ARIES模型由美国佛蒙特大学、地球经济组织和保护国际基金会于2007年开发并于2008年投入使用,目前仍处于不断完善中。与InVEST模型不同,ARIES关注生态系统服务的受益者和服务流动的时空动态,通过将贝叶斯概率模型(Bayesian Probabilistic Model)、过程模型(Process-based Model)和基于代理模型(Agent-based Model)等多种模型整合到同一平台,量化生态系统服务并探讨其动态性、复杂性和产生的效应,旨在明晰自然与社会间的复杂关系[33]。
ARIES模型通过建立“供给(Supply)—需求(Demand)—汇(Sink)”概念框架刻画生态系统服务的空间流动。不同的是,ARIES将生态系统服务分为提供型(Provisioning)和防护型(Preventive),提供型服务即生态系统为人提供某种物质或信息,如食物、淡水和风景;防护型服务即生态系统形成某种生物物理过程以减少人的损失,如调节洪水、净化污染物和减少泥沙沉积。服务的空间流动借助传递介质,在流动过程中对传递介质起削弱作用的统称为“汇”,所以“汇”能减弱提供型服务,同时增强防护型服务。目前,ARIES模型可用于8类生态系统服务的研究:碳固定和存储(Carbon Sequestration and Storage)、洪水调节(Flood Regulation)、滨海洪水调节(Coastal Flood Regulation)、审美与开放空间(Aesthetic Views and Open Space Proximity)、淡水供给(Freshwater Supply)、泥沙调节(Sediment Regulation)、自给性渔业(Subsistence Fisheries)和娱乐(Recreation)[33]。可解决的问题包括生态系统服务供给和需求的制图和计算,生态系统服务经济价值的空间分布,自然资本核算,优化生态系统服务付费,保护规划和空间政策规划,预测生态系统服务供给动态等多个方面。ARIES已被用于北美洲、欧洲、亚洲和非洲的多项生态系统服务研究。Bagstad等[34]和Villa等[35]分别利用ARIES模型研究马达加斯加的水供给服务和美国普吉特海湾的碳固定和存储、河流的洪水调节、水库泥沙调节、开放空间和观光服务,计算每种服务的潜在供给和实际供给,并刻画空间流动过程。
ARIES模型主要关注生态系统服务的需求或受益,以及生态系统服务从产生到利用之间的动态过程,扩展了以往生态系统服务的研究角度,具有广泛的应用前景。但由于模型开发和使用的时间较短,覆盖的生态系统服务类型尚不全面,且应用案例主要集中在北美洲和欧洲,对中国生态系统服务研究的适用性仍需探讨。
以上生态系统服务供给和需求的空间化方法各具特点,可用于不同数据条件和精度要求的研究(表1),在应用时可依据具体情况采用单一方法或多种方法组合并用。
表1 生态系统服务供给和需求的空间化方法及其特点
Tab. 1 Methods of mapping ecosystem services supply and demand and their characteristics
| 方法 | 优点 | 缺点 | 适用特征 | 生态系统服务类型 |
|---|---|---|---|---|
| 土地利用估计 | 操作简便,数据要求低 | 易导致内部异质性和边缘效应缺失,结果存在一定误差 | 数据有限 | 授粉[21],驼鹿狩猎[22],能源供给[18] |
| 生态过程模拟 | 结果详尽可靠 | 操作复杂,对数据要求高 | 水文类生态系统服务的供给研究 | 洪水调节[24, 25] |
| 数据空间叠置 | 操作简便 | 对数据要求高 | 具备服务影响因素的空间数据 | 气候调节、地下水灌溉[21] |
| 专家经验判别 | 对数据要求低 | 空间化准则的普适性差 | 背景材料充分或建立专家团队 | 食物供给、气候调节、娱乐活动等[28],水净化、木材生产、美学价值[19, 29] |
| InVEST模型 | 操作简便,适用性强 | 难以进行需求分析 | 供给研究 | 水供给[32] |
| ARIES模型 | 刻画生态系统服务空间流动 | 模型功能有限,对中国的适用性尚不明确 | 碳固定和存储等8类生态系统服务 | 水供给[34],碳固定和存储、水库泥沙调节、观光游览等[35] |
由于供给和需求主要反映的分别是其自然属性和社会经济属性,在实践中可根据侧重点不同对两者展开独立探讨;同时,作为生态系统服务流动的起点和终点,两者又共同体现生态系统与人类社会之间的相互作用。因此,可以从供给、需求和供需均衡3个方面初步构建生态系统服务供需分析框架。
在对生态系统服务的供给进行分析时,应区分实际供给和潜在供给(图2)。依据生态系统服务的概念,形成生态系统服务的必要条件是生态过程或产品存在(S>0)且被利用和需求(D>0);若未被利用或不存在需求(D = 0),则视为当前潜在供给。以洪水调节为例,若灾害易发区内无农田或建筑等人工设施,洪水发生也不造成人的财产或其他方面损失,则人未感受到洪水调节服务,对服务亦无需求,此生态过程只能作为潜在服务。在制图时,将服务的供给和流动范围与人口和设施分布数据叠加,无人口或设施的服务供给和流动区域即为潜在供给。另一方面,依据生态系统服务潜在供给的概念,因为生态系统提供服务的能力由自然条件、土地利用方式、生态系统管理措施和科学技术等多因素影响,对于存在需求(D>0)却缺乏生态过程和产品(S = 0)的服务类型,若改变这些因素可使生态系统服务得到增强(S′>0),则视为存在未来潜在供给。以粮食供给为例,若采用优良播种作物和科学耕作方式等途径可使粮食增产,则增长后的粮食产量为未来潜在供给。制图时通常结合情景分析,设置土地利用或管理政策调整等情景。若生态过程和需求均不存在(S= 0,D= 0),则完全不具备生态系统服务是形成条件,本文不对其进行讨论。
图2 生态系统服务的实际供给和潜在供给
Fig. 2 The actual supply and potential supply of ecosystem services
实际供给和潜在供给的空间和数量关系可反映生态系统服务的承载能力以及空间配置的均衡程度。定义供给比=实际供给/潜在供给,可在数量上直观反映人对生态系统服务的利用程度。供给比取值范围为[0, +∞],供给比大于、等于和小于1分别表示对生态系统服务的过度、充分和未充分利用。
对生态系统服务的需求进行分析时,区分实现需求和总量需求,定义需求比=实现需求/总量需求,取值范围为[0, 1],需求比越小,表示对该生态系统服务的需求越强烈。目前对生态系统服务需求的研究较少,且研究方法存在一定不足。首先在概念上存在模糊,如Kroll等[18]以实际消耗的能源、水和食物的数量表示需求,忽略实现需求和总量需求之间的差异。其次是衡量指标的选择和量化(图3),如Serna-Chavez等[21]在大尺度上以需求区域的面积大小表示需求程度的高低,未衡量单位面积上的需求强度。按照MA对生态系统服务的分类[3],供给类服务的需求往往产生于人的居住地区和经济活动的发生地区,可以物质量或价值量表示;调节类服务的需求可在情景分析下以缺少调节作用而导致损失的地区和程度来衡量,如Stürck等[24]以洪灾情景下的受灾地区和GDP损失表示对洪水调节服务的需求;文化类服务提供的是抽象的非物质收益,所以需要选择适宜的具象指标来表示,Schirpke等[36]以自然保护区周边一定空间距离的人口数量表示对保护区提供的娱乐和赏景服务的需求;支持类服务不为人提供直接的产品或效用,但却为其他生态系统服务的形成提供基础,如土壤形成和养分循环,Palomo等[28]以专家经验判断对国家公园提供的物种栖息地服务的需求。
生态系统服务的需求研究较少涉及文化类服务和支持类服务,因为前者为人提供娱乐和科学等抽象收益,并且对服务的需求往往由人的价值偏好、经济条件和教育程度等多因素影响,这些因素在不同人群中存在较大差异且难以用具象的指标衡量,因此文化类服务研究在数据采集和分析上存在一定难度。支持类服务不能产生人可直接利用物质或作用,而是通过形成衍生服务间接使人受益,如土壤形成是食物供给、洪水调节和旅游娱乐等多种服务的基础,因此支持类服务难以利用单一物质量或价值量表示,对需求的评价需要解决如何从某一角度出发选择合适的参数予以度量。
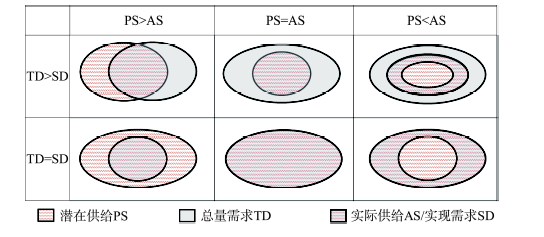
根据潜在供给(PS)、实际供给(AS)、实现需求(RD)和总量需求(TD)的定义,分析总结四者的数量关系并识别为以下六类情景(图4):① 当PS>AS且TD>RD,生态系统服务的不充分利用和需求不完全满足同时存在,形成供需空间不均衡,因此需识别影响服务空间流动的自然和人为因素以及空间流动路径,以增强服务的空间传递;② 当PS>AS且TD = RD,在生态系统的承载范围内满足了人对生态系统服务的需求,是实现生态系统可持续发展和利用的最优状态;③ 当PS = AS且TD>RD,对生态系统服务的充分利用仍不能满足需求,在此情况下应首先避免出现服务的过度利用,同时积极开发替代服务,并逐步调整经济产业和人口偏好以改变需求结构;④ 当PS = AS/TD = RD,对生态系统服务的充分利用实现了需求满足,虽未突破生态系统的承载能力,但由于不存在剩余潜在供给,若需求结构发生变化,服务将不足以支撑甚至制约社会经济发展;⑤ 当PS<AS且TD>RD和 ⑥ PS<AS且TD = RD,两类情景的需求满足程度不同,但均因过度利用生态系统而对其组分、结构和功能造成损害,此时生态系统和社会经济的发展都不可持续,需在调整需求结构的同时减少人为干扰甚至辅以人工措施以促进生态系统的恢复与重建。
图4 生态系统服务供给和需求的数量关系
Fig. 4 The quantitative relation between ecosystem services supply and demand
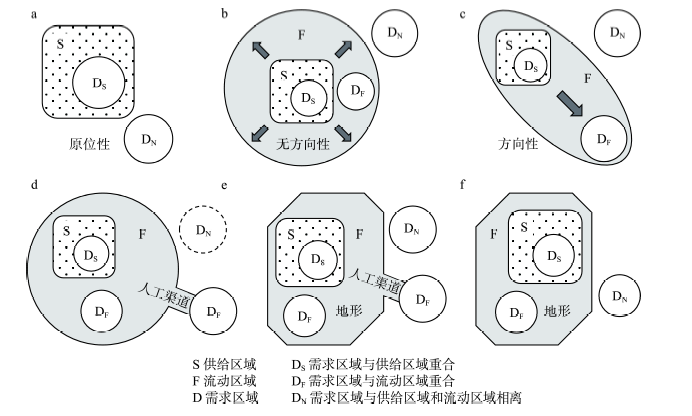
参考Costanz[20]、Fisher等[14]和Serna-Chavez等[21]的研究,以“供给—流动—需求”框架表示生态系统服务供需的空间关系(图5)。按照生态系统服务是否在供给区域和需求区域之间形成空间流动,将其分为两类。以土壤形成和旅游观光为例,土壤、生境和风景作为媒介不能传播到供给区域之外,对服务的利用只能在供给原地进行,属于原位性生态系统服务(图5a)。对于存在空间流动的生态系统服务类型,依据流动方向分为无方向性(图5b)和方向性(图5c)两类。无方向性生态系统服务如气候调节和美学价值,分别以水气和可视域为媒介,因受周边因素影响较小,媒介可由供给区域向四周传递,处于供给区域之外的一定距离内均可利用服务。不同的是,因为水气具有强流动性,通常认为气候调节服务的影响为全球尺度,而可视范围具有明显的距离衰减,因此美学价值服务的流动范围有限。方向性生态系统服务如河流上游为下游提供的净化水质和森林为工业生产提供的木材,作为媒介的水和木材在传播过程中受多种自然条件和人为因素限制,从而使服务流动具有明显的方向性。
图5 生态系统服务供给和需求的空间特征
Fig. 5 The spatial characteristics of ecosystem services supply and demand
基于以上流动特性,本文认为原位性和无方向性生态系统服务的供需空间特征不随空间尺度变化,而方向性生态系统服务由于易受环境因素影响而具有尺度效应,在不同尺度下呈现各异的供需空间关系。以水供给为例,在市镇小尺度上,由于修建沟渠和管道等人为因素,服务的流动范围被动扩大,需求多位于供给区域(DS)和服务流动范围内(DF),甚至不存在未满足需求(DN)(图5d);在省、流域中尺度上,除考虑人为因素,地形和降雨等自然条件对水供给亦产生限制(图5e);在全球大尺度,人为因素的作用减弱,水供给服务的流动主要由自然条件决定(图5f)。尺度效应主要反映在流动区域的确定上,从而影响供需的空间化和计算,所以生态系统服务供需空间关系的尺度效应,亦包括生态系统服务流动的人为和自然因素的尺度效应。因此在各个空间尺度上,识别生态系统服务流动的关键因素,是缓解供需矛盾和促进服务空间配置均衡的基础。
生态系统服务是人类赖以生存和发展的资源与环境基础。虽然国内外已有大量相关研究成果,如生态系统服务的价值核算与评估、形成与影响机制、服务之间的相互联系与作用、与人类社会福祉的关系等,但对生态系统服务供给和需求的研究仍为不足。生态系统服务的供给为生态系统服务的源头,生态系统服务的需求则是生态系统服务的终点,服务在此发生消减并产生效应,两者共同构成生态系统服务从自然生态系统流向人类社会系统的动态过程。部分生态系统服务的供给区域和需求区域在地理位置上并非完全重合,因此生态系统服务在空间上形成流动和传递,并受多种自然条件和人为因素影响呈现各异的空间特征。
生态系统服务供给和需求的空间化仍处于探索阶段,如何在确定空间边界的同时反映内部异质性是重要的研究内容,也是下一步探讨供需关系和空间流动的基础。依据采用的数据和模型,将生态系统服务供给和需求的空间化方法总结为4类:土地利用估计、生态过程模拟、数据空间叠置和专家经验判别。同时,InVEST和ARIES作为相对成熟的集成式模型,在供需空间化上亦具有广阔的应用前景。虽然空间化方法多样,便于学者们结合研究目的和研究区条件进行适宜的选择,但不同方法下得出的结果难免存在偏差,所以亟需建立普适性的空间化准则和框架,以利于多种方法在不同地区的应用,从而通过对比和验证增强结果可靠性,并进一步应用到生态系统管理和规划等领域。
生态系统服务的供给和需求反映生态系统和人类社会间复杂的动态关联,为对其进行深入探讨,将供需二者关系与生态系统服务的供给潜力、实际利用和需求潜力结合,扩展为潜在供给、实际供给、实现需求和总量需求的四者关系。通过制图表征其空间结构以及计算供给比和需求比,可更清晰的反映生态系统的承载能力和受到的人为干扰,生态系统服务的空间配置,以及生态系统服务对社会经济的制约程度等多重信息,对促进生态系统和社会经济的可持续发展有重要意义。
The authors have declared that no competing interests exist.
| [1] |
|
| [2] |
The value of the world's ecosystem services and natural capital. https://doi.org/10.1038/387253a0 URL [本文引用: 2] 摘要
This article provides a crude initial estimate of the value of ecosystem services to the economy. Using data from previous published studies and a few original calculations the current economic value of 17 ecosystem services for 16 biomes was estimated. The services of ecological systems and the natural capital stocks that produce them are critical to the functioning of the Earths life-support system. They contribute to human welfare both directly and indirectly and therefore represent part of the total economic value of the planet. It was estimated that for the entire biosphere the value (most of which is outside the market) ranges US$16-54 trillion/year with an average of US$33 trillion/year. Due to the nature of uncertainties this must be considered a minimum estimate. In addition the global gross national product total is around US$18 trillion/year.
|
| [3] |
|
| [4] |
The research trends of ecosystem services and the paradigm in geography. https://doi.org/10.11821/xb201112004 URL [本文引用: 1] 摘要
As studies on ecosystem services are becoming a hot spot among scientists, a research paradigm needs to be built in related discipline fields such as geography. This paper reviewed the progress, problems and trends of studies on ecosystem services at home and abroad. Furthermore, aiming at the topics and problems in current ecosystem service studies, we proposed a geographical paradigm and priority themes in this field. It is suggested that spatial heterogeneity and regional difference should be taken as entry points to study ecosystem services from geographical perspectives. Researches should be focused on the theme of ecosystem structure and function-ecosystem services-human well-being, and take the coupling connections between "ecosystem services offered by natural system and then internalized consumption of socioeconomic system" as the core research theme for comprehensive analysis of the response of socioeconomic system to the internalization of natural capital. We can promote integrated research on geographical sciences by constructing the geographical study paradigm of ecosystem service, which can not only expand the study capacity for ecosystem services, but also raise the level of comprehensive studies on social-ecological system. In addition, we should offer an important practical field for the study of human-land relationship, which is the core issue of geography.
生态系统服务研究动态及地理学研究范式 .https://doi.org/10.11821/xb201112004 URL [本文引用: 1] 摘要
As studies on ecosystem services are becoming a hot spot among scientists, a research paradigm needs to be built in related discipline fields such as geography. This paper reviewed the progress, problems and trends of studies on ecosystem services at home and abroad. Furthermore, aiming at the topics and problems in current ecosystem service studies, we proposed a geographical paradigm and priority themes in this field. It is suggested that spatial heterogeneity and regional difference should be taken as entry points to study ecosystem services from geographical perspectives. Researches should be focused on the theme of ecosystem structure and function-ecosystem services-human well-being, and take the coupling connections between "ecosystem services offered by natural system and then internalized consumption of socioeconomic system" as the core research theme for comprehensive analysis of the response of socioeconomic system to the internalization of natural capital. We can promote integrated research on geographical sciences by constructing the geographical study paradigm of ecosystem service, which can not only expand the study capacity for ecosystem services, but also raise the level of comprehensive studies on social-ecological system. In addition, we should offer an important practical field for the study of human-land relationship, which is the core issue of geography.
|
| [5] |
The progress in ecosystem services mapping: A review. 生态系统服务制图研究进展 . |
| [6] |
Research framework of ecosystem services geography from spatial and regional perspectives. 基于空间与区域视角的生态系统服务地理学框架 . |
| [7] |
Research progress of ecosystem service flow. https://doi.org/10.13287/j.1001-9332.201607.005 URL [本文引用: 2] 摘要
随着社会经济的发展,人类对生态系统的干扰导致多种生态服务退化或消失.生态系统服务流对生态系统服务的输送、转化和维持有重要作用,并成为相关研究的新兴方向之一.本文在对生态系统服务流进行分类的基础上,分析了生态系统服务传递的载体,初步探讨生态系统服务流的形成机制,包括服务流的形成、属性、尺度特征、定量化及其制图等.同时,对生态系统服务流的成本效应,如输送成本、转化成本、使用成本和成本相对性等进行尝试性分析,旨在分析生态系统服务流传递过程中的成本耗散.生态系统服务流研究一定程度上解决了生态系统服务价值评估的“双重核算”问题,使人类准确识别生态系统服务供给和消费热点区域,有利于生态系统服务在传递过程中达到效益最大化,对提出科学合理的生态补偿有重要意义.
生态系统服务流研究进展 .https://doi.org/10.13287/j.1001-9332.201607.005 URL [本文引用: 2] 摘要
随着社会经济的发展,人类对生态系统的干扰导致多种生态服务退化或消失.生态系统服务流对生态系统服务的输送、转化和维持有重要作用,并成为相关研究的新兴方向之一.本文在对生态系统服务流进行分类的基础上,分析了生态系统服务传递的载体,初步探讨生态系统服务流的形成机制,包括服务流的形成、属性、尺度特征、定量化及其制图等.同时,对生态系统服务流的成本效应,如输送成本、转化成本、使用成本和成本相对性等进行尝试性分析,旨在分析生态系统服务流传递过程中的成本耗散.生态系统服务流研究一定程度上解决了生态系统服务价值评估的“双重核算”问题,使人类准确识别生态系统服务供给和消费热点区域,有利于生态系统服务在传递过程中达到效益最大化,对提出科学合理的生态补偿有重要意义.
|
| [8] |
Involvement of ecosystem service flows in human wellbeing based on the relationship between supply and demand. https://doi.org/10.5846/stxb201411172274 URL [本文引用: 1] 摘要
生态系统服务研究越来越强调服务与人类福利的关系。生态系统服务空间流动研究试图在生态系统服务供给与使用之间构建因果联系,探索服务供给时空动态与人类福利变化的关系。综述了20世纪90年代以来国内外生态系统服务研究的进展,梳理了生态系统服务空间流动研究发展的脉络及其出现的必要性,提出了未来生态系统服务空间流动发展的重要方向是分布式空间模拟,但这受到数据可获得性和专业知识的限制。未来可以通过利用已有地理资源数据库和派生数据库增加数据来源,组建由不同学科人员组成的研究团队来弥补专业知识不足造成的影响。通过生态系统服务空间流动研究,可以在生态系统服务供给和需求之间建立反馈关系,为制定科学合理的管理政策提供科学依据。
基于供需关系的生态系统服务空间流动研究进展 .https://doi.org/10.5846/stxb201411172274 URL [本文引用: 1] 摘要
生态系统服务研究越来越强调服务与人类福利的关系。生态系统服务空间流动研究试图在生态系统服务供给与使用之间构建因果联系,探索服务供给时空动态与人类福利变化的关系。综述了20世纪90年代以来国内外生态系统服务研究的进展,梳理了生态系统服务空间流动研究发展的脉络及其出现的必要性,提出了未来生态系统服务空间流动发展的重要方向是分布式空间模拟,但这受到数据可获得性和专业知识的限制。未来可以通过利用已有地理资源数据库和派生数据库增加数据来源,组建由不同学科人员组成的研究团队来弥补专业知识不足造成的影响。通过生态系统服务空间流动研究,可以在生态系统服务供给和需求之间建立反馈关系,为制定科学合理的管理政策提供科学依据。
|
| [9] |
Ecosystem services supply and consumption: A case in Yellow River watershed, China. 生态系统服务供给-消费研究: 黄河流域案例 . |
| [10] |
|
| [11] |
Ecological regionalization based on ecological demanding evaluation in Beijing City. 基于生态需求评价的北京市生态区位划分研究 . |
| [12] |
A multiscale analysis of ecosystem services supply in the NW Iberian Peninsula from a functional perspective. https://doi.org/10.1016/j.ecolind.2014.10.027 URL [本文引用: 1] 摘要
In recent years, the assessment of ecosystem services (ES) supply has been based on the use of Land Use/Land Cover (LULC) data as proxies for spatial representation of ecosystems. Nevertheless, some shortcomings of this method, such as uncertainties derived from generalization of the ecosystem types and assumptions of invariance across spatial scales, indicate the need for new approaches. Such approaches could be aimed at improving knowledge of the relationships between ecosystem services and landscape structure and the spatial characteristics of ES patterns. In this study, we propose an integrative approach that involves the generation and analysis of continuous maps representing the supply of five ES potentially related to the amount of biomass. Five remote sensing images of the Northwestern Iberian Peninsula, obtained with Landsat-5 TM, were used to generate a proxy for net primary production by combining the normalized difference vegetation index (NDVI) of each image to calculate a 危NDVI index that could act as a potential indicator of some ecosystem services. This information was combined with three variables 鈥 terrain slope, population density and occurrence of protected areas 鈥 to produce spatial models for the five ES and eventually a series of five supply maps. Food, materials and energy provision services showed a clustered pattern, with high supply values in flat zones and areas with high population densities. In contrast, mass flow and climate regulation services were more widely distributed throughout the study area. The five ecosystem service patterns were analyzed at different scales by two methods: lacunarity and four term local quadrat variance (4TLQV) analysis. These methods revealed differences in the spatial pattern: lacunarity analysis was useful for detection of scale thresholds at the local level, whereas 4TLQV was more sensitive to scale thresholds at larger spatial levels. Thus, the variance analysis yielded higher values for larger windows sizes, particularly for provisioning services. The results demonstrated the suitability of the proposed approach for the spatially explicit modeling of ecosystem services, avoiding the uncertainty of other assessments such as those based on LULC data, and for the exploratory analysis of ES supply from a spatial point of view.
|
| [13] |
Ecosystem services and hydroelectricity in Central America: Modelling service flows with fuzzy logic and expert knowledge. https://doi.org/10.1007/s10113-010-0149-x Magsci [本文引用: 1] 摘要
Because ecosystem services are generally not produced and used in the same place, their assessment should consider the flows of services from ecosystems to users. These flows depend on the characteristics and spatial distribution of ecosystems and users, the spatial relationships between them, and the presence of filters or barriers between ecosystems and users. The objective of this paper is to map the ecosystem services provided to the Costa Rican and Nicaraguan hydroelectric sectors, which are crucial sectors for national sustainable development and depend directly on hydrological ecosystem services. The paper presents an approach for modelling the flows of multiple services from diverse ecosystems to diverse users through different kinds of filters in a landscape. The approach uses expert knowledge and fuzzy numbers to handle uncertainties. The analyses for Costa Rica and Nicaragua show how the approach helps identify priority areas for the conservation and restoration of forests for the services they provide to the hydroelectric sector. As such, it is a useful tool for defining spatially targeted policies for the conservation of ecosystem services and for involving the users of ecosystem services in ecosystem management.
|
| [14] |
Defining and classifying ecosystem services for decision making. https://doi.org/10.1016/j.ecolecon.2008.09.014 URL [本文引用: 5] 摘要
The concept of ecosystems services has become an important model for linking the functioning of ecosystems to human welfare. Understanding this link is critical for a wide-range of decision-making contexts. While there have been several attempts to come up with a classification scheme for ecosystem services, there has not been an agreed upon, meaningful and consistent definition for ecosystem services. In this paper we offer a definition of ecosystem services that is likely to be operational for ecosystem service research and several classification schemes. We argue that any attempt at classifying ecosystem services should be based on both the characteristics of the ecosystems of interest and a decision context for which the concept of ecosystem services is being mobilized. Because of this there is not one classification scheme that will be adequate for the many contexts in which ecosystem service research may be utilized. We discuss several examples of how classification schemes will be a function of both ecosystem and ecosystem service characteristics and the decision-making context.
|
| [15] |
Spatial dynamics of ecosystem service flows: A comprehensive approach to quantifying actual services. https://doi.org/10.1016/j.ecoser.2012.07.012 URL [本文引用: 3] 摘要
Recent ecosystem services research has highlighted the importance of spatial connectivity between ecosystems and their beneficiaries. Despite this need, a systematic approach to ecosystem service flow quantification has not yet emerged. In this article, we present such an approach, which we formalize as a class of agent-based models termed "Service Path Attribution Networks" (SPANs). These models, developed as part of the Artificial Intelligence for Ecosystem Services (ARIES) project, expand on ecosystem services classification terminology introduced by other authors. Conceptual elements needed to support flow modeling include a service's rivalness, its flow routing type (e.g., through hydrologic or transportation networks, lines of sight, or other approaches), and whether the benefit is supplied by an ecosystem's provision of a beneficial flow to people or by absorption of a detrimental flow before it reaches them. We describe our implementation of the SPAN framework for five ecosystem services and discuss how to generalize the approach to additional services. SPAN model outputs include maps of ecosystem service provision, use, depletion, and flows under theoretical, possible, actual, inaccessible, and blocked conditions. We highlight how these different ecosystem service flow maps could be used to support various types of decision making for conservation and resource management planning. Published by Elsevier B.V.
|
| [16] |
Spatial indicators for the assessment of ecosystem services: Providing, benefiting and connecting areas and landscape metrics. https://doi.org/10.1016/j.ecolind.2012.02.013 URL Magsci [本文引用: 1] 摘要
The ecosystem services approach is an established framework for the balanced evaluation of ecological, economic and social landscape resources. It promotes functional synergies (win-win situations) as well as trade-offs among various benefits resulting from ecosystem processes. Spatial aspects of heterogeneity and configuration play a major role in maintaining biodiversity and ecosystem services and hence in human wellbeing. Cultural artifacts also contribute to landscape functionality. Because of the underlying areal aspects, an additional term, landscape service has been proposed and is increasingly used (Termorshuizen and Opdam. 2009). We take a particular interest in spatial aspects of this framework and the optimization of trade-offs between landscape services.<br/>Firstly, spatial heterogeneity is assessed by means of landscape metrics computed as indicators for landscape services. Landscape heterogeneity is a key measure of biodiversity and contributes to several valuable functions. Habitat connectivity and other measures of landscape structure are also essential criteria for the behavior of metapopulations and for recreational value.<br/>Secondly, service providing areas (SPAs) are discussed as the areal basis for service provision. Similarly, service benefiting areas (SBAs) and connecting areas (SCAs) for the transfer of matter, energy and organisms between them are investigated. Place-based assessment addresses such areas. We thus show possibilities for estimating and evaluating landscape units.<br/>Thirdly, the landscape consists of the natural environment, artifacts from past human use, current human activity and even social thinking. The landscape services approach in a wider sense allows us to take social/cultural services better into account because they depend strongly on heritage assets, structural characteristics, historical conditions end even cultural specifics; which can hardly be subsumed to ecosystems. Place-based assessment is an appropriate solution for combining several spatial categories. (C) 2012 Elsevier Ltd. All rights reserved.
|
| [17] |
Improving the identification of mismatches in ecosystem services assessments. https://doi.org/10.1016/j.ecolind.2014.12.016 URL [本文引用: 1] 摘要
Assessments and sustainable management of ecosystem services (ES) require an understanding of both ES supply and demand qualities, quantities, spatial scales and dynamics. Mismatches, i.e., differences in quality or quantity between the supply and demand of ES, can occur in many different forms. Being able to identify these mismatches and their nature is of prime importance for informing governance and management decisions. This manuscript explores which mismatches can be detected by current ES supply and demand assessments and which mismatches currently remain unidentified. An analytic framework was developed comprised of five interlinked components of ES supply and demand linking nature and society (i.e., potential supply, managed supply, match, demand, and interests). This framework was used to examine 11 recent papers, which applied ES assessments to both ES supply and demand, to determine which mismatches were or could be identified and which mismatches remained unidentified. The selected papers typically used multiple methods in their assessments to capture supply and demand components. The found diversity in methods and the inclusion of temporal and spatial dimensions, and the existence of multiple stakeholder groups allowed for the assessments to identify several mismatches, but also lead to differences in the discriminative capacity of the assessments between the selected papers. The mismatch that was most often included in the assessments was Unsatisfied demand, whereas the least included mismatch was Unsustainable uptake. The mismatches caused by differing spatial patterns were most often identified, whereas the existence of mismatches among different stakeholder groups was least often detected in the assessment methods. Three options emerged that could further strengthen the discriminative capacity of ES supply and demand assessments to inform sustainable ES governance and management decisions: (i) include multiple stakeholders groups and the diversification of their roles and demands; (ii) acknowledge that ES supply is not only determined by the bio-geophysical conditions, but also determined by the ES demand by society, in terms of their quantity, quality and location, as well as by the applied management; (iii) include temporal and spatial scale sensitivity into the discriminative capacity of assessment methods to allow for a better identification which institutional structures could most effectively act upon them.
|
| [18] |
Rural-urban gradient analysis of ecosystem services supply and demand dynamics. https://doi.org/10.1016/j.landusepol.2011.07.008 Magsci [本文引用: 4] 摘要
Urban regions are important places of ecosystem service demands and, at the same time, are the primary source of global environmental impacts. Although there is broad agreement on the importance of incorporating the concept of ecosystem services into policy strategies and decision-making, the lack of a standardized approach to quantifying ecosystem services at the landscape scale has hindered progress in this direction. Moreover, tradeoffs between ecosystem services and the supply/demand ratio of ecosystem services in urban landscapes have rarely been investigated. In our paper, we present a method to quantify and map the supply and demand of three essential provisioning services - energy, food, and water - along the rural-urban gradient of the eastern German region Leipzig-Halle. This urban region has experienced significant socio-economic dynamics and land use changes since the German reunification in 1990. The results show that both the demand and the supply of ecosystem services changed considerably during the time span under consideration (1990-2007). We identified an increasing supply/demand ratio of food and water but a decreasing supply/demand ratio of energy. In addition, the pattern of ecosystem demands shows a levelling of rural-urban gradients, reflecting profound modifications of traditional rural-urban relationships. The changes of ecosystem service supply gradients are determined more by land use intensity, such as the intensification of agricultural production, than by land cover changes such as urban sprawl. The comparison of supply/demand ratios and rural-urban patterns of ecosystem services can help decision-makers in landscape management in striving for a sustainable balance between resource supply and demand. (C) 2011 Elsevier Ltd. All rights reserved.
|
| [19] |
Mapping ecosystem service supply, demand and budgets. https://doi.org/10.1016/j.ecolind.2011.06.019 URL Magsci [本文引用: 3] 摘要
Among the main effects of human activities on the environment are land use and resulting land cover changes. Such changes impact the capacity of ecosystems to provide goods and services to the human society. This supply of multiple goods and services by nature should match the demands of the society, if self-sustaining human-environmental systems and a sustainable utilization of natural capital are to be achieved. To describe respective states and dynamics, appropriate indicators and data for their quantification, including quantitative and qualitative assessments, are needed. By linking land cover information from, e.g. remote sensing, land survey and GIS with data from monitoring, statistics, modeling or interviews, ecosystem service supply and demand can be assessed and transferred to different spatial and temporal scales. The results reveal patterns of human activities over time and space as well as the capacities of different ecosystems to provide ecosystem services under changing land use. Also the locations of respective demands for these services can be determined. As maps are powerful tools, they hold high potentials for visualization of complex phenomena. We present an easy-to-apply concept based on a matrix linking spatially explicit biophysical landscape units to ecological integrity, ecosystem service supply and demand. An exemplary application for energy supply and demand in a central German case study region and respective maps for the years 1990 and 2007 are presented. Based on these data, the concept for an appropriate quantification and related spatial visualization of ecosystem service supply and demand is elaborated and discussed. (C) 2011 Elsevier Ltd. All rights reserved.
|
| [20] |
Ecosystem services: Multiple classification systems are needed. https://doi.org/10.1016/j.biocon.2007.12.020 URL [本文引用: 3] 摘要
In a recent paper in Biological Conservation, Wallace (2007) argues that the classification systems currently used for ecosystem services are inadequate because they mix ends and means. He then proposes a system to rectify this perceived problem. While there is much interesting material in Wallace's paper, his basic premise is flawed and much of the paper suffers from a gross oversimplification of a complex reality. Wallace's solutions to the classification problem might work if the world had consistently crisp boundaries, static linear processes with no feedbacks, clear distinctions between means and ends, little uncertainty, only one use for the classification system, and people who always knew both everything about the world and how it all affects their welfare - in other words some very different planet from the one we inhabit. In the messy world we do inhabit, we need multiple classification systems for different purposes, and this is an opportunity to enrich our thinking about ecosystem services rather than a problem to be defined away.
|
| [21] |
Schulp C J E, van Bodegom P M, et al. A quantitative framework for assessing spatial flows of ecosystem services. |
| [22] |
Accounting for capacity and flow of ecosystem services: A conceptual model and a case study for Telemark, Norway. https://doi.org/10.1016/j.ecolind.2013.09.018 URL Magsci [本文引用: 2] 摘要
Understanding the flow of ecosystem services and the capacity of ecosystems to generate these services is an essential element for understanding the sustainability of ecosystem use as well as developing ecosystem accounts. We conduct spatially explicit analyses of nine ecosystem services in Telemark County, Southern Norway. The ecosystem services included are moose hunting, sheep grazing, timber harvest, forest carbon sequestration and storage, snow slide prevention, recreational residential amenity, recreational hiking and existence of areas without technical interference. We conceptually distinguish capacity to provide ecosystem services from the actual flow of services, and empirically assess both. This is done by means of different spatial models, developed with various available datasets and methods, including (multiple layer) look-up tables, causal relations between datasets (including satellite images), environmental regression and indicators derived from direct measurements. Capacity and flow differ both in spatial extent and in quantities. We discuss five conditions for a meaningful spatial capacity-flow-balance. These are (1) a conceptual difference between capacity and flow, (2) spatial explicitness of capacity and flow, (3) the same spatial extent of both, (4) rivalry or congestion, and (5) measurement with aligned indicators. We exemplify spatially explicit balances between capacity and flow for two services, which meet these five conditions. Research in the emerging field of mapping ES should focus on the development of compatible indicators for capacity and flow. The distinction of capacity and flow of ecosystem services provides a parsimonious estimation of over- or underuse of the respective service. Assessment of capacity and flow in a spatially explicit way can thus support monitoring sustainability of ecosystem use, which is an essential element of ecosystem accounting. (C) 2013 Elsevier Ltd. All rights reserved.
|
| [23] |
The impact of proxy-based methods on mapping the distribution of ecosystem services. https://doi.org/10.1111/j.1365-2664.2010.01777.x URL [本文引用: 1] 摘要
1. An increasing number of studies are examining the distribution and congruence of ecosystem services, often with the goal of identifying areas that will provide multiple ecosystem service ' hotspots'. However, there is a paucity of data on most ecosystem services, so proxies (e. g. estimates of a service for a particular land cover type) are frequently used to map their distribution. To date, there has been little attempt to quantify the effects of using proxies on distribution maps of ecosystem services, despite the potentially large errors associated with such data sets. 2. Here, we provide the first study examining the effects of using proxies on ecosystem service maps and the degree of spatial congruence of these maps with primary data, using England as a case study. 3. We show that land cover based proxies provide a poor fit to primary data surfaces for biodiversity, recreation and carbon storage, and that correlations between ecosystem services change depending on whether primary or proxy data are used for the analyses. 4. The poor fit of proxies to primary data was also evident when we selected hotspots of single ecosystem services, and consistency between raw and modelled surfaces was extremely low when considering the locations that were coincident hotspots for multiple services. 5. Synthesis and applications. Proxies may be suitable for identifying broad-scale trends in ecosystem services, but even relatively good proxies are likely to be unsuitable for identifying hotspots or priority areas for multiple services.
|
| [24] |
Mapping ecosystem services: The supply and demand of flood regulation services in Europe. https://doi.org/10.1016/j.ecolind.2013.11.010 URL Magsci [本文引用: 3] 摘要
Ecosystem services (ES) feature highly distinctive spatial and temporal patterns of distribution, quantity, and flows. The flow of ecosystem goods and services to beneficiaries plays a decisive role in the valuation of ES and the successful implementation of the ES concept in environmental planning. This is particularly relevant to regulating services where demands emerge often spatially separated from supply. However, spatial patterns of both supply and demand are rarely incorporated in ES assessments on continental scales. In this paper, we present an ES modeling approach with low data demand, fit to be employed in scenario analysis and on multiple scales. We analyze flood regulation services at a European scale by explicitly addressing the spatial distribution of ES demand. A flood regulation supply indicator is developed based on scenario runs with a hydrological model in representative river catchments, incorporating detailed information on land, cover, land use and management. Land use sensitive flood damage estimates in the European Union (EU) are employed to develop a spatial indicator for flood regulation demand. Findings are transferred to the EU territory to create a map of the current supply of flood regulation and the potential supply under conditions of natural vegetation. Regions with a high capacity to provide flood regulation are mainly characterized by large patches of natural vegetation or extensive agriculture. The main factor limiting supply on a continental scale is a low water holding capacity of the soil. Flood regulation demand is highest in central Europe, at the foothills of the Alps and upstream of agglomerations. We were able to identify areas with a high potential capacity to provide flood regulation in conjunction with land use modifications. When combined with spatial patterns of current supply and demand, we could identify priority areas for investments in ES flood regulation supply through conservation and land use planning. We found that only in a fraction of the EU river catchments exhibiting a high demand, significant increases in flood regulation supply are achievable by means of land use modifications. (C) 2013 Elsevier Ltd. All rights reserved.
|
| [25] |
Flood regulating ecosystem services: Mapping supply and demand, in the Etropole municipality, Bulgaria. https://doi.org/10.1016/j.ecolind.2011.06.022 URL Magsci [本文引用: 2] 摘要
Floods exert significant pressure on human societies. Assessments of an ecosystem's capacity to regulate and to prevent floods relative to human demands for flood regulating ecosystem services can provide important information for environmental management. In this study, the capacities of different ecosystems to regulate floods were assessed through investigations of water retention functions of the vegetation and soil cover. The use of the catchment based hydrologic model KINEROS and the GIS AGWA tool provided data about peak rivers' flows and the capability of different land cover types to "capture" and regulate some parts of the water. Based on spatial land cover units originating from CORINE and further data sets, these regulating ecosystem services were quantified and mapped. Resulting maps show the ecosystems' flood regulating service capacities in the case study area of the Malki Iskar river basin above the town of Etropole in the northern part of Bulgaria. There, the number of severe flood events causing significant damages in the settlements and infrastructure has been increasing during the last few years. Maps of demands for flood regulating ecosystem services in the study region were compiled based on a digital elevation model, land use information and accessibility data. Finally, the flood regulating ecosystem service supply and demand data were merged in order to produce a map showing regional supply-demand balances. The resulting map of flood regulation supply capacities shows that the Etropole municipality's area has relatively high capacities for flood regulation. Areas of high and very high relevant capacities cover about 34% of the study area. The flood regulation ecosystem service demand map shows that areas of low or no relevant demands far exceed the areas of high and very high demands, which comprise only 0.6% of the municipality's area. According to the flood regulation supply-demand balance map, areas of high relevant demands are located in places of low relevant supply capacities. The results show that the combination of data from different sources with hydrological modeling provides a suitable data base for the assessment of complex function-service-benefit relations. (C) 2011 Elsevier Ltd. All rights reserved.
|
| [26] |
Evaluation of ecosystem dynamics, plant geography and terrestrial carbon cycling in the LPJ dynamic global vegetation model. https://doi.org/10.1046/j.1365-2486.2003.00569.x URL [本文引用: 1] 摘要
Abstract The Lund–Potsdam–Jena Dynamic Global Vegetation Model (LPJ) combines process-based, large-scale representations of terrestrial vegetation dynamics and land-atmosphere carbon and water exchanges in a modular framework. Features include feedback through canopy conductance between photosynthesis and transpiration and interactive coupling between these ‘fast’ processes and other ecosystem processes including resource competition, tissue turnover, population dynamics, soil organic matter and litter dynamics and fire disturbance. Ten plants functional types (PFTs) are differentiated by physiological, morphological, phenological, bioclimatic and fire-response attributes. Resource competition and differential responses to fire between PFTs influence their relative fractional cover from year to year. Photosynthesis, evapotranspiration and soil water dynamics are modelled on a daily time step, while vegetation structure and PFT population densities are updated annually. Simulations have been made over the industrial period both for specific sites where field measurements were available for model evaluation, and globally on a 0.5°° × 0.5°° grid. Modelled vegetation patterns are consistent with observations, including remotely sensed vegetation structure and phenology. Seasonal cycles of net ecosystem exchange and soil moisture compare well with local measurements. Global carbon exchange fields used as input to an atmospheric tracer transport model (TM2) provided a good fit to observed seasonal cycles of CO 2 concentration at all latitudes. Simulated inter-annual variability of the global terrestrial carbon balance is in phase with and comparable in amplitude to observed variability in the growth rate of atmospheric CO 2 . Global terrestrial carbon and water cycle parameters (pool sizes and fluxes) lie within their accepted ranges. The model is being used to study past, present and future terrestrial ecosystem dynamics, biochemical and biophysical interactions between ecosystems and the atmosphere, and as a component of coupled Earth system models.
|
| [27] |
Scenario-based assessment of future food security. https://doi.org/10.1007/s11442-011-0825-x Magsci [本文引用: 1] 摘要
This paper presents a scenario-based assessment of global future food security. To do that, the socio-economic and climate change scenarios were defined for the future and were linked to an integrated modeling framework. The crop yields simulated by the GIS-based Environmental Policy Integrated Climate (EPIC) model and crop areas simulated by the crop choice decision model were combined to calculate the total food production and per capita food availability, which was used to represent the status of food availability and stability. The per capita Gross Domestic Product (GDP) simulated by IFPSIM model was used to reflect the situation of food accessibility and affordability. Based on these two indicators, the future food security status was assessed at a global scale over a period of approximately 20 years, starting from the year 2000. The results show that certain regions such as South Asia and most African countries will likely remain hotspots of food insecurity in the future as both the per capita food availability and the capacity of being able to import food will decrease between 2000 and 2020. Low food production associated with poverty is the determining factor to starvation in these regions, and more efforts are needed to combat hunger in terms of future actions. Other regions such as China, most Eastern European countries and most South American countries where there is an increase in per capita food availability or an increase in the capacity to import food between 2000 and 2020 might be able to improve their food security situation.
|
| [28] |
National Parks, buffer zones and surrounding lands: Mapping ecosystem service flows. https://doi.org/10.1016/j.ecoser.2012.09.001 URL [本文引用: 3] 摘要
ABSTRACT The use of ecosystem service maps for conservation planning is increasing. However, their potential for measuring the benefits derived from protected areas has rarely been studied. To overcome this, information gap, we organized two expert workshops based on participatory mapping techniques for Do帽ana and Sierra Nevada protected areas. Protected area managers and scientists mapped service provision hotspots, (SPHs), degraded SPHs and service benefiting areas (SBAs). In Do帽ana, SPHs were located inside the protected area and its surroundings, whereas, degraded SPHs were located primarily within the protected areas. In Sierra Nevada, most SPHs and most degraded SPHs were located inside the protected area. SBAs were located in the surrounding territory for both protected areas, especially in the neighboring cities. We also identified the major issues that faced both protected areas and their drivers of change. We found that most problems originated outside the limits of the protected areas and were produced by drivers associated with economic factors and land use changes. We discuss the implications of using ecosystem services maps for protected area management and the effects of the surrounding territory on areas within the protected zone. The results of our study demonstrate the need for a broader territorial planning strategy.
|
| [29] |
Landscapes' capacities to provide ecosystem services: A concept for land-cover based assessments. https://doi.org/10.3097/LO.200915 URL [本文引用: 2] 摘要
Landscapes differ in their capacities to provide ecosystem goods and services, which are the benefits humans obtainfrom nature. Structures and functions of ecosystems needed to sustain the provision of ecosystem services are alteredby various human activities. In this paper, a concept for the assessment of multiple ecosystem services is proposedas a basis for discussion and further development of a respective evaluation instrument. Using quantitative andqualitative assessment data in combination with land cover and land use information originated from remote sensingand GIS, impacts of human activities can be evaluated. The results reveal typical patterns of different ecosystems鈥榗apacities to provide ecosystem services. The proposed approach thus delivers useful integrative information forenvironmental management and landscape planning, aiming at a sustainable use of services provided by nature. Theresearch concept and methodological framework presented here for discussion have initially been applied in differentcase studies and shall be developed further to provide a useful tool for the quantification and spatial modelling ofmultiple ecosystem services in different landscapes. An exemplary application of the approach dealing with foodprovision in the Halle-Leipzig region in Germany is presented. It shows typical patterns of ecosystem service distributionaround urban areas. As the approach is new and still rather general, there is great potential for improvement,especially with regard to a data-based quantification of the numerous hypotheses, which were formulated as base forthe assessment. Moreover, the integration of more detailed landscape information on different scales will be neededin future in order to take the heterogeneous distribution of landscape properties and values into account. Therefore,the purpose of this paper is to foster critical discussions on the methodological development presented here.
|
| [30] |
|
| [31] |
InVEST User's Guide. The Natural Capital Project, Stanford University, University of Minnesota, The Nature Conservancy, |
| [32] |
Assessment of the water supply: Demand ratios in a Mediterranean basin under different global change scenarios and mitigation alternatives. https://doi.org/10.1016/j.scitotenv.2013.10.003 URL PMID: 24176705 Magsci [本文引用: 2] 摘要
Spatial differences in the supply and demand of ecosystem services such as water provisioning often imply that the demand for ecosystem services cannot be fulfilled at the local scale, but it can be fulfilled at larger scales (regional, continental). Differences in the supply:demand (S:D) ratio for a given service result in different values, and these differences might be assessed with monetary or non-monetary metrics. Water scarcity occurs where and when water resources are not enough to meet all the demands, and this affects equally the service of water provisioning and the ecosystem needs. In this study we assess the value of water in a Mediterranean basin under different global change (i.e. both climate and anthropogenic changes) and mitigation scenarios, with a non-monetary metric: the S:D ratio. We computed water balances across the Ebro basin (North-East Spain) with the spatially explicit InVEST model. We highlight the spatial and temporal mismatches existing across a single hydrological basin regarding water provisioning and its consumption, considering or not, the environmental demand (environmental flow). The study shows that water scarcity is commonly a local issue (sub-basin to region), but that all demands are met at the largest considered spatial scale (basin). This was not the case in the worst-case scenario (increasing demands and decreasing supply), as the S:D ratio at the basin scale was near 1, indicating that serious problems of water scarcity might occur in the near future even at the basin scale. The analysis of possible mitigation scenarios reveals that the impact of global change may be counteracted by the decrease of irrigated areas. Furthermore, the comparison between a non-monetary (S:D ratio) and a monetary (water price) valuation metrics reveals that the S:D ratio provides similar values and might be therefore used as a spatially explicit metric to valuate the ecosystem service water provisioning. (C) 2013 Elsevier B.V. All rights reserved.
|
| [33] |
|
| [34] |
From theoretical to actual ecosystem services: Mapping beneficiaries and spatial flows in ecosystem service assessments. https://doi.org/10.5751/ES-06523-190264 URL [本文引用: 2] 摘要
Ecosystem services mapping and modeling has focused more on supply than demand, until recently. Whereas the potential provision of economic benefits from ecosystems to people is often quantified through ecological production functions, the use of and demand for ecosystem services has received less attention, as have the spatial flows of services from ecosystems to people. However, new modeling approaches that map and quantify service-specific sources (ecosystem capacity to provide a service), sinks (biophysical or anthropogenic features that deplete or alter service flows), users (user locations and level of demand), and spatial flows can provide a more complete understanding of ecosystem services. Through a case study in Puget Sound, Washington State, USA, we quantify and differentiate between the theoretical or in situ provision of services, i.e., ecosystems capacity to supply services, and their actual provision when accounting for the location of beneficiaries and the spatial connections that mediate service flows between people and ecosystems. Our analysis includes five ecosystem services: carbon sequestration and storage, riverine flood regulation, sediment regulation for reservoirs, open space proximity, and scenic viewsheds. Each ecosystem service is characterized by different beneficiary groups and means of service flow. Using the ARtificial Intelligence for Ecosystem Services (ARIES) methodology we map service supply, demand, and flow, extending on simpler approaches used by past studies to map service provision and use. With the exception of the carbon sequestration service, regions that actually provided services to people, i.e., connected to beneficiaries via flow paths, amounted to 16-66% of those theoretically capable of supplying services, i.e., all ecosystems across the landscape. These results offer a more complete understanding of the spatial dynamics of ecosystem services and their effects, and may provide a sounder basis for economic valuation and policy applications than studies that consider only theoretical service provision and/or use.
|
| [35] |
A methodology for adaptable and robust ecosystem services assessment. https://doi.org/10.1371/journal.pone.0091001 URL PMID: 3953216 [本文引用: 2] 摘要
Ecosystem Services (ES) are an established conceptual framework for attributing value to the benefits that nature provides to humans. As the promise of robust ES-driven management is put to the test, shortcomings in our ability to accurately measure, map, and value ES have surfaced. On the research side, mainstream methods for ES assessment still fall short of addressing the complex, multi-scale biophysical and socioeconomic dynamics inherent in ES provision, flow, and use. On the practitioner side, application of methods remains onerous due to data and model parameterization requirements. Further, it is increasingly clear that the dominant "one model fits all" paradigm is often ill-suited to address the diversity of real-world management situations that exist across the broad spectrum of coupled human-natural systems. This article introduces an integrated ES modeling methodology, named ARIES (ARtificial Intelligence for Ecosystem Services), which aims to introduce improvements on these fronts. To improve conceptual detail and representation of ES dynamics, it adopts a uniform conceptualization of ES that gives equal emphasis to their production, flow and use by society, while keeping model complexity low enough to enable rapid and inexpensive assessment in many contexts and for multiple services. To improve fit to diverse application contexts, the methodology is assisted by model integration technologies that allow assembly of customized models from a growing model base. By using computer learning and reasoning, model structure may be specialized for each application context without requiring costly expertise. In this article we discuss the founding principles of ARIES--both its innovative aspects for ES science and as an example of a new strategy to support more accurate decision making in diverse application contexts.
|
| [36] |
Mapping beneficiaries of ecosystem services flows from natural 2000 sites. https://doi.org/10.1016/j.ecoser.2014.06.003 URL [本文引用: 1] 摘要
61Beneficiaries have to be included into ecosystem services assessments.61We propose spatially-explicit approaches to identify and map beneficiaries.61We tested the approaches for a Natura 2000 site in northern Italy.61Results can support management strategies for biodiversity conservation.
|

/
| 〈 |
|
〉 |

