崔颖颖 , 鞠建廷
, 鞠建廷
CUI Yingying, JU Jianting
通讯作者:
收稿日期: 2016-08-8
修回日期: 2017-05-13
网络出版日期: 2017-08-07
版权声明: 2017 《地理学报》编辑部 本文是开放获取期刊文献,在以下情况下可以自由使用:学术研究、学术交流、科研教学等,但不允许用于商业目的.
基金资助:
作者简介:
作者简介:崔颖颖(1990-), 女, 河南人, 博士生, 主要从事青藏高原湖泊水量平衡研究。E-mail: cuiyy@itpcas.ac.cn
展开
摘要
青藏高原分布着亚洲大陆最大的湖泊群,其湖泊变化对气候变化响应敏感。基于遥感数据的湖泊面积变化不足以反映外流湖对气候变化的响应,需借助湖泊水量平衡过程分析来进一步研究各补给要素的变化。本文利用2015年4月-11月然乌湖水文气象监测数据,通过建立流量—水位关系,依据连续的水位数据重建了观测期内然乌湖主要径流的水文过程线,并结合SRM模型分析了然乌湖的水量平衡过程及季节变化。结果表明,观测期内然乌湖入湖水量约为18.49×10⁸ m3,其中冰川融水约为10.06×10⁸ m3,冰川融水占然乌湖补给的54%以上,湖面降水、湖面蒸发对湖泊水量平衡过程影响微弱。流域降水对湖泊的补给具有明显的季节特征。春季受西风南支扰动影响,然乌湖地区降水量大,降水是春季然乌湖的主要补给源。夏季和早秋由于气温升高,冰川消融量大,冰川融水是湖泊补给的主控因素。在未来气候变暖的条件下,冰川融水将会在湖泊补给中占据更大比例,并可能使得流域内的冰湖水量增加,产生潜在灾害风险。
关键词:
Abstract
The Tibetan Plateau boasts the greatest lake group in the Asian continent, where the lakes respond sensitively to climate change. For the exorheic lakes, the area changes based on remote sensing data are insufficient to reflect their responses to climatic changes. Water balance analyses of these lakes are needed for understanding the hydrological processes of lake basins and their relationships with climate changes. In this paper, we use the hydrological and meteorological monitoring data in the Ranwu Lake Basin from April to November in 2015 to examine the relationship between water level and runoff and reconstruct flux process line according to continuous water level data. Together with the snowmelt runoff model (SRM) simulation, we analyze the water balance process and its seasonal changes of the Ranwu Lake. The result shows that the total water yield inputted into the lake during the monitoring period is about 18.49×10⁸ m³, and that the glacial melt water is about 10.06 ×10⁸ m³, accounting for more than 54% of the lakes' supplies. Precipitation and evaporation of lake water surface and the lake water storage change have only slight effects on the process of lake water balance. Replenishment of the lake water is clearly seasonal as it depends on rainfall. Under the influence of southern branch of Westerlies, the Ranwu Lake area witnesses high precipitation, which is the main supply source in spring. Due to temperature rise in dummer and early autumn, a large amount of glacial melt water is a dominant factor of the water balance of this lake. With the temperature rise in the future, glacial melt water will occupy higher proportions in the total supplies of the lakes in this area. It will conduce to the speedy rise of the glacial lake level and lead to potential hazard risks.
Keywords:
以青藏高原为主体的第三极地区是亚洲大江大河的发源地,具有“亚洲水塔”之 称[1]。这里分布着众多的湖泊,是亚洲大陆最大的湖区之一。基于2000年的陆地卫星影像分析,青藏高原湖泊总面积达43151.08 km2,超过中国境内湖泊面积的一半[2]。湖泊不仅是地表液态水体的主要存在形式,也在以大气水汽为主的气态水体和以冰川为主的固态水体及其相态转化中起着必不可缺的作用。气候变化引起的降水增减、冰川进退直接对湖泊面积和水量变化产生影响[3]。许多冰川发生的显著变化与下游河流和湖泊的变化密切相关[4-5]。因此,湖泊的水量平衡直接反映了降水、融水和湿度变化等气候信息,并进一步通过这些信息指示着流域尺度的气候变化、水资源及其可持续利用条件等。
气温升高导致了青藏高原冰冻圈和水圈系统的改变,如冰川退缩、积雪融化、冻土面积减少等[6-7],从而影响了其补给湖泊的状态。因此,对湖泊水量平衡的分析成为研究气候变化及其影响的重要视角。封闭湖泊的面积变化与其水量变化密切相关。近年来,随着遥感技术的发展,已经开展了大量基于封闭湖泊面积及其与气候变化的关系研究。其中一些研究分析了单个湖泊流域的水量平衡,如青海湖[8]、色林错[9]、纳木错[10]、当惹雍错[11]、羊卓雍错[12]、佩枯错[13]、玛旁雍错及拉昂错[14]等;也有一些研究开展了区域湖泊面积变化的时空分异特征分析[15-19]。然而,对于青藏高原南部和东南部的大量的外流型湖泊来讲,由于湖水通过外流江河入海,湖泊面积与其水量变化之间并非存在简单的相关关系,基于遥感技术开展的湖泊面积变化难以准确认识湖泊水量平衡及其补给过程。
在近年来的气候变化和季风与西风相互作用影响下,青藏高原的冰川和湖泊呈现出明显的区域变化特征[19-20]。在冰川变化上,无论是冰川长度、冰川面积还是物质平衡均指示沿喜马拉雅山脉的高原东南部—南部冰川退缩显著,中部的唐古拉山—羌塘高原退缩程度减弱,西北部以及喀喇昆山地区变化较小甚至部分出现前进的现象[20]。在湖泊变化上,湖泊面积在高原南部雅鲁藏布江流域减小,而在高原北部羌塘高原明显增加[18]。主要受降水增加影响,湖泊水量在羌塘东南部和西北部以及阿里地区具有一直上升的趋势;受降水和温度升高导致的冰川融水增加共同影响,湖泊水量在昆仑山北部—羌塘中部先下降然后快速上升。然而,青藏高原南部和东南部海洋性冰川广布,在冰川退缩增强的影响下,该地区湖泊对气候变化极为敏感。研究表明,1980-2005年以来,然乌湖地区冰川面积明显减小,湖泊面积逐年增加[21],但冰川消融对湖泊水量平衡的定量影响难以通过简单的冰川、湖泊面积分析得出结论,需要结合水量平衡的季节变化进行研究,从流量过程的视角详细分析该区的湖泊补给过程。
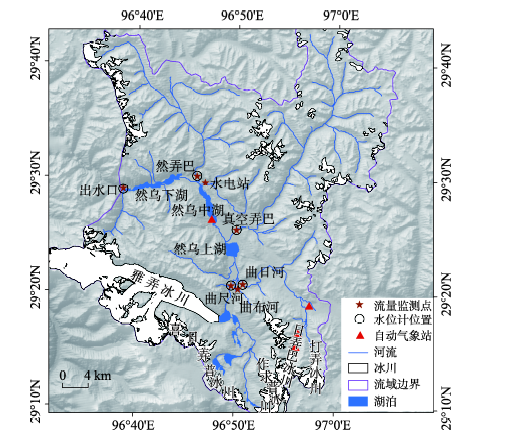
然乌湖位于青藏高原东南部,地理位置29.47°N、96.78°E,是雅鲁藏布江支流帕隆藏布源头的过水湖(图1),湖泊呈河道型,总长29 km,平均宽约800 m,湖周长约58 km,湖岸线发育系数为3.5[22]。然乌湖湖面海拔3928 m,湖水面积约20 km2,湖区控制流域面积为1985 km2,冰川占流域面积的16.4%[23]。然乌湖分上、中、下三段,各段之间有浅窄河道连通。上段称雅错,面积约4 km2,最深处达28.2 m,平均深度为18.6 m;中、下段分别为安错和安目错,面积各约8 km2,安错最深处为21.1 m,平均深度为11.2 m;安目错最深处为16.4 m,平均深度为10.6 m。
图1 然乌湖地理位置及流域水文分布示意图
Fig. 1 Geographical location of Ranwu Lake and its drainage basin
然乌湖主要入湖补给河流有曲尺河、曲日河、真空弄巴、然弄巴和曲布河。曲尺河自雅错的西南岸汇入,源头自雅弄冰川、作球普冰川和喜日弄普冰川直接补给的冰前湖朗错流出。曲日河来自40 km外帕隆藏布源头数个冰川的融水以及沿途汇聚的降水径流。真空弄巴和然弄巴均自湖东岸汇入,流域内冰川分布很少,可视为降水补给河流。2015年8月作者用多普勒走航式流速仪测得曲尺河、曲日河、真空弄巴、然弄巴流量分别为71.9 m3/s、7.8 m3/s、29.3 m3/s、11.4 m3/s。曲布河流域较小,流程较短,主要为地下水补给,2014年夏季测得其流量仅为1 m3/s。
然乌湖所在的藏东南地区在夏季受印度季风影响,冬季则主要受西风南支影响。高登义等[24]通过对比藏东南的降水分布及雨季开始时间指出,沿布拉马普特拉河—雅鲁藏布江河谷向青藏高原内地有着强大的水汽输送能力。因此,与藏东南的大多数地区一样,夏季的印度季风将暖湿的印度洋和孟加拉湾水汽向然乌湖地区输入。但是,该区的春季环流形式与其他地区有所区别,从每年的3月份起,西风南支急流在该地区扰动频繁,带来了大量的孟加拉湾水汽并在本区形成强降水[25]。从分区来看,然乌湖属于高原温带季风湿润气候区[26]。
对于过水型湖泊来讲,在不考虑地下水参与的前提下,某一时期的湖泊水量平衡(变化)等于补给减去损耗。其中补给水量主要来自流域降水及其形成的地表径流、冰川融水径流、湖面降水,而损耗水量则等于湖面蒸发和湖水流出量。由于湖面降水和蒸发能够根据气象资料进行计算,因此,获得相对准确的气象和径流数据就成为研究水量平衡的关键。
为了获得湖区的气象数据,中国科学院藏东南高山环境观测站于2014年在然乌湖中湖旁的阿日村(29.47°N,96.78°E,3928 m)布设了自动气象站,对风速风向、气温、相对湿度、大气压、总辐射、降水和陆地蒸发进行连续记录。同时,为了比较数据间的相关性以及补充部分缺失数据并建立气温和降水梯度,本文也获取了然察公路三道班处(29.38°N,96.88°E,4398 m)、曲日河源处(29.32°N,96.96°E,4600 m)的自动气象站记录。
由于然乌湖地区没有固定水文站,本文采用连续的水位观测和非连续的流量观测,建立流量—水位关系,以此来计算入湖河流和出湖的流量过程线。2015年4月初,然乌湖湖冰完全融化后,在主要补给河流曲尺河、曲日河、真空弄巴、然弄巴,然乌湖中湖、然乌湖下湖出水口放置了HOBO水位计进行水位监测。水位数据由水位计记录的水压经气象站的气压数据校准计算所得。同时,在2015年4月-11月,使用SonTek M9型声学多普勒剖面流速仪对然乌湖入湖河流和出湖口流量进行了共16次监测,每次测量至少进行3个重复。水位监测和流量观测点如图1所示。
湖泊水量变化计算采用Lei等[27]提出的湖泊水量估算方法:
式中:S1为起始时间的湖泊面积;S2为计算终止时间的湖泊面积;h为两期影像时间对应的水位高程差。
使用Landsat 8遥感影像,分别计算了2015年4月初、6月底、10月底、11月底的湖泊面积。由于该地区常年多云,4月初和6月底的遥感影像云层遮挡严重,根据水位计的数据,分别采用了时间较近且水位相近的3月中和7月中的影像来替代。实际计算中使用2015年3月12日、7月18日、10月22日、11月23日的4期影像来计算湖面面积。
为验证水量平衡的计算结果,采用融雪径流模型(Snowmelt runoff model, SRM)[28]模拟然乌湖流域的冰川消融。SRM模型是一种概念性分布式水文模型,使用度日因子法计算融冰融雪,采用Nash-Sutchliffe系数R2和体积差Dv来评价模拟结果。
SRM模型结构简单,在高寒地区的融雪融冰模拟中应用广泛,效果比较理想,其基本计算公式为:
式中:Q为日均流量(m³/s);
SRM模型的主要驱动数据为气温、降水和积雪覆盖率,驱动数据可以通过实测或遥感的方式获得。本文使用的气温和降水数据均来自流域内的气象站观测,为明确冰川消融对湖泊水量平衡的影响,本文单独对冰川消融进行了模拟,冰川面积数据采用第二次冰川编目的流域内冰川面积[29]。模拟中然乌湖流域的度日因子为1.1~1.5 cm
本文模拟将然乌湖流域根据海拔高度分为3个条带,每个条带内均有一个气象站,利用3个气象站分别计算了各条带的气温和降水垂直递减率,将其应用到全流域进行模拟,以此计算冰川消融对流域水量平衡的影响。
基于SRM模型的模拟结果,对湖泊的水量平衡过程进程分析,以分析不同补给来源所占的比例。然乌湖流域主要是冰川融水和降水补给。流域内的曲布河为地下水补给,使用机械式流速仪测得年内流量稳定在1 m³/s左右,补给量小且年内变化不大,故认为然乌湖流域地下水补给对湖泊补给量可以忽略,对水量平衡季节变化影响不大。湖泊水量平衡计算公式如下:
式中:P为时段内的湖面降水;Rp为降水入湖径流;Rg为冰川入湖径流;Es为湖面蒸发;Rdo为出湖径流;△S为湖水储量变化。
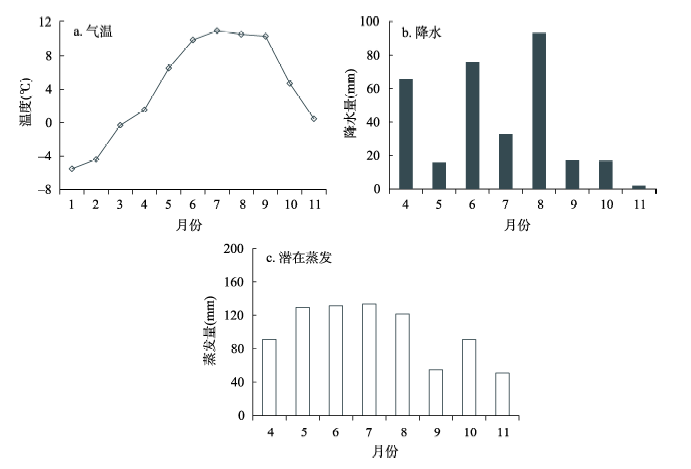
图2给出了然乌湖阿日村自动气象站记录的2015年的气温、降水和潜在蒸发情况。然乌湖湖面位置在3月的平均气温仍在0 ℃左右,4月平均气温达到1.5 ℃,验证了前人认为该湖泊4月份完全解冻,并出现冰川融水补给的结论[22]。全年的气温变化呈现夏季气温高(10.96 ℃),冬季气温低(-5.5 ℃)的单峰抛物线形态。从降水的情况看,2015年1-11月降水量为355.81 mm,其中4月9日-11月24日监测期间的降水量为307.91 mm。值得注意的是,尽管8月出现全年的最大降水量(93 mm),但春季的4月也出现了另一个降水峰值(66 mm),流域的降水变化敏感地反映了本区春季受西风南支扰动的特点。根据自动气象站记录的风速、气温、相对湿度、气压、辐射等参数,采用Penman-Monteith模型[31]计算了湖面潜在蒸发及其变化。
图2 然乌湖流域2015年观测期的气象要素变化
Fig. 2 Change of climatic factors in Ranwu Lake Basin during monitoring period in 2015
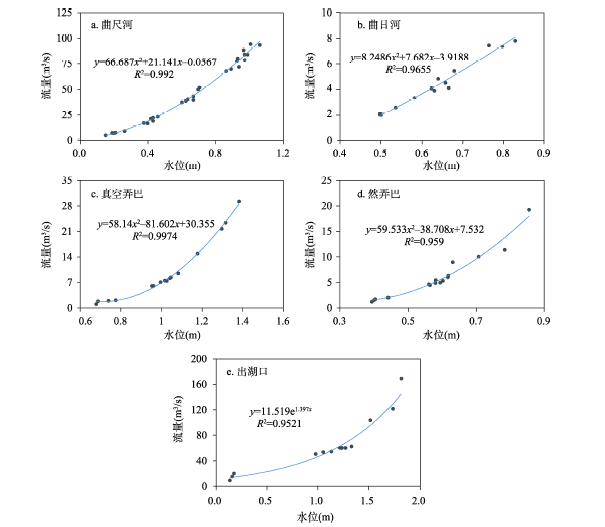
2014年以来,对然乌湖主要入湖河流以及出湖口的水位进行了连续监测,并在湖泊非封冻期开展了不同水位条件下的非连续性流量测量。对各个监测位置的水位和流量关系进行拟合(图3),结果表明,根据流量—水位关系重建的流量总体具有较高的精度。相对而言,低水位时由于流量小,拟合结果虽然绝对误差很小,但相对误差较大,可能会对低水位期模型模拟结果产生影响。
图3 然乌湖主要入湖补给河流以及出水口的流量—水位关系
Fig. 3 The relationships between water levels and runoff of input rivers and outlet of the Ranwu Lake
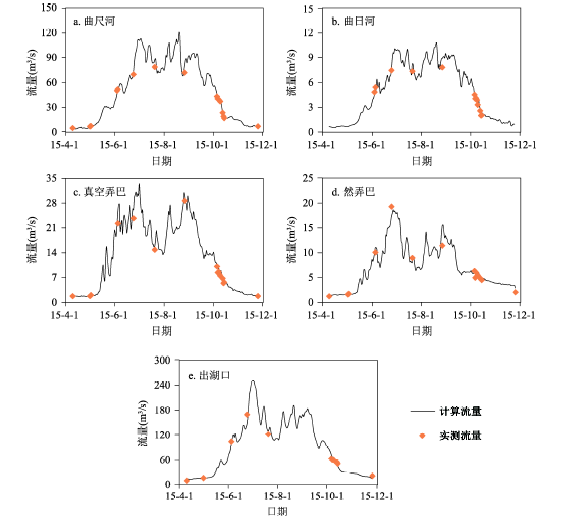
根据流量—水位关系,利用水位计数据重建了然乌湖主要补给河流和下湖出水口的流量过程线(图4)。然乌湖主要补给河流和湖泊水位及流量变化过程一致。
图4 然乌湖入湖河流与出湖流量过程线
Fig. 4 The discharge curves of input rivers and outlet of the Ranwu Lake
从然乌湖2015年观测期的水位变化(图5)和水量变化(表1)看,水量平衡的季节变化主要分为五个阶段:① 第一阶段,自4月9日-5月10日为春季枯水期,水位较低并且湖泊面积变化不大,这一时期湖泊储水量增加1.51×10⁶ m³;② 第二阶段,自5月11日-6月24日为涨水期,水位快速上升,湖泊面积扩张,湖泊储水量增加18.34×10⁶ m³;③ 第三阶段,自6月25日-9月10日为夏季洪水期,水位保持在高值,湖面最大,相对稳定,湖泊储水量增加2.03×10⁶ m³;④ 第四阶段,自9月11日-10月25日为落水期,水位快速下降,湖泊面积缩小,湖水出流,储水量迅速下降,储水量减少约17.32×10⁶ m³;⑤ 第五阶段,自10月26日-11月24日,重新进入枯水期,水位处于较低值并缓慢下降,湖泊面积缓慢缩小,储水量减少约3.38×10⁶ m³。
图5 然乌湖2015年观测期相对水位变化
Fig. 5 The relative water level changes of the Ranwu Lake during monitoring period in 2015
表1 然乌湖2015年观测期水储量变化
Tab. 1 The water storage changes of the Ranwu Lake during monitoring period in 2015
| 时间 | 面积(km²) | 水位相对变化量(m) | 水位累计变化量(m) | 水量相对变化(106 m³) | 水量累计变化(106 m³) |
|---|---|---|---|---|---|
| 4月9日 | 15.1 | 0 | 0 | 0 | 0 |
| 5月10日 | 15.1 | +0.10 | +0.10 | +1.51 | +1.51 |
| 6月24日 | 20.3 | +1.04 | +1.14 | +18.34 | +19.85 |
| 9月10日 | 20.3 | +0.09 | +1.23 | +2.03 | +21.88 |
| 10月25日 | 17.0 | -0.93 | +0.30 | -17.32 | +4.56 |
| 11月24日 | 16.8 | -0.20 | +0.10 | -3.38 | +1.18 |
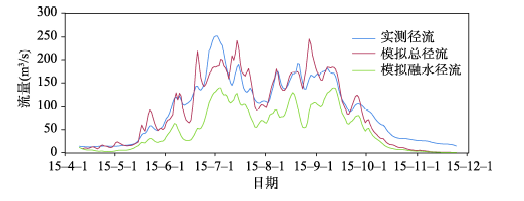
以流域内的气象站记录为驱动数据,将然乌湖流域按照表2分为了3个不同海拔的条带,采用SRM模型对该区域分别进行了总径流模拟和冰川融水量模拟(图6)。模型模拟的Nash-Sutchliffe系数R2为0.86,体积差为4,Nash-Sutchliffe系数R2优于该模型在全球的平均模拟精度(0.84),而体积差略大于全球平均模拟精度(3.8)。观测时段内,然乌湖出湖径流约为18.33
表2 然乌湖流域高程分带、各分带面积及平均高程
Tab. 2 Area of elevation zones and the mean hypsometric elevation in the Ranwu Lake basin
| 条带 | 高程范围(m) | 流域面积(km2) | 条带平均海拔(m) | 所占流域面积比例(%) | 冰川所占流域面积比例(%) |
|---|---|---|---|---|---|
| 1 | 3883~4349 | 261.52 | 4155.65 | 13 | 6.2 |
| 2 | 4350~4599 | 236.72 | 4484.14 | 12 | 10.6 |
| 3 | 4600~6342 | 1481.24 | 5115.5 | 75 | 19.2 |
| 全流域 | 3883~6342 | 1979.48 | 4929.78 | 100 | 16.4 |
5.1.1 湖泊的输入水量及其季节变化 表3为2015年观测期不同的水文阶段然乌湖入湖径流补给的季节变化。
表3 然乌湖2015年观测期入湖径流补给的季节变化
Tab. 3 The runoff seasonal change of input rivers of the Ranwu Lake during observation period in 2015
| 时间 | 曲尺河 (108m³) | 曲日河(108m³) | 真空弄巴(108m³) | 然弄巴(108m³) | 湖面降水(108m³) | 其他补给(108m³) | 出湖径流(108m³) | 湖泊水增量(108m³) | 湖面降水 比例(%) | 其他补给比例(%) |
|---|---|---|---|---|---|---|---|---|---|---|
| 4/09-5/10 | 0.17 | 0.02 | 0.05 | 0.04 | 0.01 | 0.13 | 0.40 | +0.02 | 2.38 | 30.96 |
| 5/11-6/24 | 1.65 | 0.16 | 0.65 | 0.26 | 0.02 | 0.62 | 3.18 | +0.18 | 0.56 | 18.45 |
| 6/25-9/10 | 6.21 | 0.59 | 1.52 | 0.77 | 0.05 | 1.93 | 11.05 | +0.02 | 0.45 | 17.43 |
| 9/11-10/25 | 1.83 | 0.19 | 0.41 | 0.23 | 0.01 | 0.27 | 3.11 | -0.17 | 0.34 | 9.18 |
| 10/26-11/24 | 0.26 | 0.03 | 0.07 | 0.10 | 0 | 0.10 | 0.59 | -0.03 | 0 | 17.86 |
| 总计 | 10.12 | 0.99 | 2.70 | 1.40 | 0.09 | 3.04 | 18.33 | +0.02 | 0.49 | 16.58 |
(1)湖面直接降水 观测时间段内,然乌湖流域总降水量为307.91 mm,湖面降水量在五个时段内分别仅在丰水期能达到0.05
(2)入湖主要径流 入湖主要径流从来源上主要可以分为以下3类:① 冰川融水补给径流:从然乌湖流域水文分布(图1)看出,曲尺河直接来自雅弄冰川、作球普冰川和喜日弄普冰川直接补给的冰前湖朗错,入然乌湖之前流程较短(仅有8.3 km),无其他径流汇入,可视为单纯的冰川融水补给径流。由重建的流量过程线计算得到,曲尺河2015年4月9日-11月24日补给量约占流域补给量的55%。② 降水补给径流:真空弄巴和然弄巴流域内无冰川融水补给,可视为单纯的降水补给径流。在2015年的监测期内,真空弄巴总流量为2.7×10⁸ m³,然弄巴总流量1.4×10⁸ m³。降水补给的主要河流径流补给约占湖泊流域补给量的21%。③ 降水—冰川融水混合补给径流:曲日河来自40 km外帕隆藏布源头数个冰川的融水以及沿途汇聚的降水径流。在2015年观测期内,曲日河总流量约为0.99×10⁸ m³,全年补给量约占流域总补给量的5%。
(3)其他补给 除湖面降水、4条主要入湖径流外,然乌湖流域还有一些其他的小规模地表径流和季节性径流。根据水量平衡计算公式,这些其他形式的补给在观测时间内总量约为3.04
5.1.2 湖泊的输出水量及其季节变化 (1)湖面蒸发 然乌湖2015年观测时间内的蒸发总量为0.14
(2)出湖径流量 整个监测期间,2015年4月9日-11月24日,出湖流量为18.33
基于径流观测的湖泊水量平衡在准确区分不同补给源的补给量方面存在一定不足,故采取SRM模型模拟来区分冰川融水补给和降水补给。表4中给出了SRM模型模拟结合实测数据计算得到的不同补给源在观测期内不同阶段对然乌湖补给过程的变化。
表4 然乌湖2015年观测期湖泊水量收支平衡
Tab. 4 Water balance of the Ranwu Lake during observation period in 2015
| 时间 | 湖面降水量(108m³) | 蒸发水量(108m³) | 湖泊储量(108m³) | 融水径流(108m³) | 降水径流(108m³) | 出湖径流(108m³) | 融水补给 占比(%) |
|---|---|---|---|---|---|---|---|
| 4/09-5/10 | 0.01 | 0.02 | +0.02 | 0.15 | 0.28 | 0.40 | 34 |
| 5/11-6/24 | 0.02 | 0.03 | +0.18 | 1.31 | 2.06 | 3.18 | 39 |
| 6/25-9/10 | 0.05 | 0.06 | +0.02 | 6.66 | 4.42 | 11.05 | 60 |
| 9/11-10/25 | 0.01 | 0.02 | -0.17 | 1.87 | 1.07 | 3.11 | 63 |
| 10/26-11/24 | 0 | 0.01 | -0.03 | 0.06 | 0.51 | 0.59 | 11 |
| 总计 | 0.09 | 0.14 | 0.02 | 10.06 | 8.34 | 18.33 | 54 |
模拟结果显示,全年冰川融水补给占流域总补给量的54%。其中第一阶段,冰川补给占总补给量的34%;第二阶段,冰川融水占补给量的39%;第三阶段冰川融水占补给量的60%;第四阶段冰川融水占补给量的63%;第五阶段冰川融水占补给量的11%。
其中模拟结果显示第五阶段冰川融水对补给的贡献量突然减小,结合然乌湖流域融水径流模拟结果(图6)分析表明,模型在温度较低时对径流的模拟偏差较大。在10月26日-11月24日这一时段内,实测然乌湖出湖径流量约为0.59
综上所述,模型模拟的结果与流量监测的结果基本一致,冰川融水是然乌湖的最主要补给源,观测时间段内冰川融水补给占流域补给55%左右。
图6 然乌湖流域总径流和冰川消融量的SRM模拟结果以及与实测径流的对比
Fig. 6 Simulated result of total and glacial melt runoff in the Ranwu Lake Basin using SRM Model and their comparison with in situ surveyed total runoff
作为河道型的过水湖泊,然乌湖在2015年观测期总补给水量为18.49
从湖泊水量平衡的各个阶段看:2015年4月9日-5月10日,然乌湖枯水期温度较低,冰川消融量较小。然乌湖流域春季具有较多的降水,使降水补给超过水量增加与消耗的66%,成为湖泊补给的重要来源。
2015年5月11日-6月24日,然乌湖涨水期气温迅速回升,冰川消融增加,融水补给约占水量增加与消耗的39%,成为湖泊水量平衡的重要因素。这一时期湖泊水位上涨明显,但湖水储量变化在整体的水量平衡中依然占比很小,不足5%。
2015年6月25日-9月10日,洪水期冰川融水和降水均大幅度增加,气温稳定在较高水平,冰川消融量很大,占水量增加与消耗的的60%,而季风带来的大量降水补给则占40%左右。
2015年9月11日-10月25日,这一时期为落水期,气温回落,冰川消融量逐渐减小,但冰川融水占水量增加与消耗的60%以上,依然是维持湖泊水量平衡的最主要因素。
2015年10月26日-11月24日,这一时期气温降低导致冰川消融量迅速减小,模拟显示冰川补给仅占总补给的11%,而冰川融水占绝对优势的曲尺河在这一阶段占总径流量比约为44%。造成模拟结果精度差的原因在上文已有分析。
以上分析表明,从全年来看,冰川融水占然乌湖总补给量的一半以上,对然乌湖流域的水量平衡过程起着决定性作用。降水的季节变化明显,春季受西风南支扰动,孟加拉涡旋带来的降水对春季的湖泊水量平衡影响重大。夏季降水主要受季风影响,降水量大,但由于同期温度升高,冰川融水增多,降水对湖泊的补给量居于次位。秋季季风消退,降水量减小,温度下降,融水逐渐减少,降水补给所占比例回升。
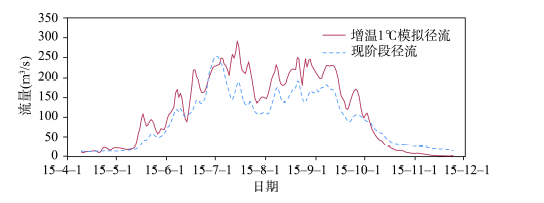
在全球变化的大背景下,西藏地区气温呈现快速升高的特点,冬季升温尤为突出。基于耦合模式比较计划第三阶段(CMIP 3)的耦合模式结果表明,2011-2040年西藏及周边地区冬夏季增温超过1.0 ℃的概率大于80%[30]。使用SRM模型对然乌湖流域水文过程在日均温较2015年观测时段内升高1 ℃的情况下进行冰川消融模拟,结果表明(图7),相对2015年,日均温升高1.0 ℃的条件下,冰川的消融量将增加25%。
已有研究表明,然乌湖流域的冰川物质平衡为负,且随着气候变暖加剧,冰川退缩速率可能会加大[32]。通过对近25年来的遥感影像分析,然乌湖流域的湖泊面积增加明 显[21]。如果气候变暖趋势继续,短时间内冰川径流加大[21, 32],融水补给河流的流量将会增加,然乌湖出湖流量将增加。
对帕隆藏布流域的冰湖研究表明,随着气温的升高,冰川退缩,帕隆藏布流域的冰湖面积和数量逐步增长[33]。位于帕隆藏布上游的然乌湖流域也存在一定数量的冰湖。由于消融期冰川径流与汛期余量的叠加将进一步增加汛期径流的分配比例[34],使得冰湖水量存在迅速增加的可能,存在冰湖溃决的风险,进而引发次生地质灾害[35]。
(1)对于藏东南地区的过水型湖泊,湖泊面积及其反映的水量变化在其水量平衡过程所占比例较小,湖泊面积和水量变化对湖泊水量平衡过程代表性差,即使在年内的季节间,依据湖泊面积变化开展的对区域湖泊水量平衡的分析存在着极大的不确定性。
(2)对于分布在青藏高原南部和东南部的河道型湖泊来讲,由于湖泊面积较小,滞水时间很短,湖面直接降水和蒸发对于湖泊水量平衡的影响较弱。流域内降水补给季节特征明显。
(3)然乌湖作为典型的冰川湖泊,冰川融水是湖泊水量平衡的主要因素。然乌湖的水量平衡过程能够很好地反映该流域的冰川变化。对于分布在青藏高原南部、东南部的大多数湖泊来说,由于流域内存在面积较大的冰川,冰川融水成为维持湖泊水量平衡的重要来源,在未来气候变暖的态势下,冰川融水在一定时期内将会进一步加大对湖泊水量的补给程度。
致谢:感谢中国科学院藏东南高山环境综合观测研究站在水文气象观测研究中的支持,感谢中国科学院青藏高原研究所王磊研究员和杨威副研究员慷慨提供用以建立模拟气温和降水梯度的气象数据。
The authors have declared that no competing interests exist.
| [1] |
Van Beek L P , Bierkens M F. Climate change will affect the Asian Water Towers. |
| [2] |
Lakes' state and abundance across the Tibetan Plateau. |
| [3] |
Quantitative analysis of lake area variations and the influence factors from 1971 to 2004 in the Nam Co Basin of the Tibetan Plateau. |
| [4] |
Impact of warmer climate on melt and evaporation for the rainfed, snowfed and glacierfed basins in the Himalayan region. https://doi.org/10.1016/j.jhydrol.2004.06.005 URL [本文引用: 1] 摘要
The impact of warmer climate on melt and evaporation was studied for rainfed, snowfed and glacierfed basins located in the western Himalayan region. Hydrological processes were simulated under current climatic conditions using a conceptual hydrological model, which accounts for the rainfall鈥搑unoff, evaporation losses, snow and glacier melt. After simulations of daily observed streamflow ( R 2=0.90) for 6 years, the model was used to study the impact of warmer climate on melt and evaporation. Based on the future projected climatic scenarios in the study region, three temperature scenarios ( T+1, T+2 and T+3 掳 C) were adopted for quantifying the effect of warmer climate. The comparison of the effect of warmer climate on different types of basins indicated that the increase in evaporation was the maximum for snowfed basins. For a T+2 掳C scenario, the annual evaporation for the rainfed basins increased by about 12%, whereas for the snowfed basins it increased by about 24%. The high increase of the evaporation losses would reduce the runoff. It was found that under a warmer climate, melt was reduced from snowfed basins, but increased from glacierfed basins. For a T+2 掳C scenario, annual melt was reduced by about 18% for the studied snowfed basin, while it increased by about 33% for the glacierfed basin. Thus, impact of warmer climate on the melt from the snowfed and glacierfed basins was opposite to each other. The study suggests that out of three types of basins, snowfed basins are more sensitive in terms of reduction in water availability due to a compound effect of increase in evaporation and decrease in melt. For a complex type of basin, the decrease in melt from seasonal snow may be counterbalanced by increase in melt from glaciers. However, on long-term basis, when the areal extent of glaciers will decrease due to higher melt rate, the water availability from the complex basins will be reduced.
|
| [5] |
Relation between climate change and runoff volume in the headwaters of the Tarim River during the last 50 years.
<FONT face=Verdana>通过对近50 a塔里木河源流区径流、温度、降水量的年代际分析,探讨了过去半个世纪塔里木河源流区气候变化及其对河川径流的影响。研究结果显示,在过去50 a里,塔里木河三源流径流量总体呈现增加的趋势,尤其体现在20世纪90年代以后,丰水年出现次数较多;对径流和降水量与温度作相关分析可知,随着温度的逐年代升高,其对径流量的影响越来越显著。蒸发量随着温度的升高也在逐渐增大,但是降水量的增长速率远大于蒸发量的增长速率,所以即使蒸发量的增加也不足以使径流量减少。</FONT>
塔里木河源流区近50a径流量与气候变化关系研究 .
<FONT face=Verdana>通过对近50 a塔里木河源流区径流、温度、降水量的年代际分析,探讨了过去半个世纪塔里木河源流区气候变化及其对河川径流的影响。研究结果显示,在过去50 a里,塔里木河三源流径流量总体呈现增加的趋势,尤其体现在20世纪90年代以后,丰水年出现次数较多;对径流和降水量与温度作相关分析可知,随着温度的逐年代升高,其对径流量的影响越来越显著。蒸发量随着温度的升高也在逐渐增大,但是降水量的增长速率远大于蒸发量的增长速率,所以即使蒸发量的增加也不足以使径流量减少。</FONT>
|
| [6] |
Review of climate and cryospheric change in the Tibetan Plateau. |
| [7] |
Response of hydrological cycle to recent climate changes in the Tibetan Plateau. https://doi.org/10.1007/s10584-011-0099-4 URL [本文引用: 1] 摘要
AbstractThe Tibetan Plateau (TP) surfaces have been experiencing an overall rapid warming and wetting while wind speed and solar radiation have been declining in the last three decades. This study investigated how climate changes influenced the hydrological cycle on the TP during 1984鈭2006. To facilitate the analysis, a land surface model was used to simulate surface water budget at all CMA (China Meteorological Administration) stations on the TP. The simulated results were first validated against observed ground temperature and observation-derived heat flux on the western TP and observed discharge trends on the eastern TP. The response of evaporation and runoff to the climate changes was then analyzed. Major finding are as follows. (1) Surface water balance has been changed in recent decades. Observed precipitation shows insignificant increasing trends in central TP and decreasing trends along the TP periphery while evaporation shows overall increasing trends, leading to decreased discharge at major TP water resource areas (semi-humid and humid zones in the eastern and southern TP). (2) At the annual scale, evaporation is water-limited in dry areas and energy-limited (radiation and air temperature) in wet areas; these constraints can be interpreted by the Budyko-curve. Evaporation in autumns and winters was strongly controlled by soil water storage in summers, weakening the dependence of evaporation on precipitation at seasonal scales. (3) There is a complementary effect between the simulated actual evaporation and potential evaporation, but this complementary relationship may deviate from Bouchet鈥檚 hypothesis when vapor pressure deficit (or air temperature) is too low, which suppresses the power of vapor transfer.
|
| [8] |
Lake-level change and water balance analysis at Lake Qinghai, west China during recent decades. https://doi.org/10.1007/s11269-006-9096-1 Magsci [本文引用: 1] 摘要
<a name="Abs1"></a>Lake Qinghai, the largest saline lake with an area of 4,260 km<sup>2</sup> (2000) and average depth of 21 m (1985) in West China, has experienced severe decline in water level in recent decades. This study aimed to investigate water balance of the lake and identify the causes for the decline in lake level. There was a 3.35-m decline in water level with an average decreasing rate of 8.0 cm year<sup>−1</sup> between 1959 and 2000. The lake water balance showed that mean annual precipitation between 1959 and 2000 over the lake was 357 ± 10 mm, evaporation was 924 ± 10 mm, surface runoff water inflow was 348 ± 21 mm, groundwater inflow was 138 mm ± 9 and the change in lake level was −80 ± 31 mm. The variation of lake level was highly positively correlated to surface runoff and precipitation and negatively to evaporation, the correlation coefficients were 0.89, 0.81 and −0.66, respectively. Water consumption by human activities accounts for 1% of the evaporation loss of the lake, implying that water consumption by human activities has little effect on lake level decline. Most dramatic decline in lake level occurred in the warm and dry years, and moderate decline in the cold and dry years, and relatively slight decline in the warm and wet years, therefore, the trend of cold/warm and dry climate in recent decades may be the main reasons for the decline in lake level.
|
| [9] |
Laba, et al. The response of water level of Selin Co to climate change during 1975-2008.
根据1975年地形图、80年代至2008年的TM、CBERS卫星遥感资料和近34年(1975-2008年)的气温、降水量、蒸发量、最大冻土深度等气候资料分析得出,西藏那曲地区西部的色林错及其周围的错鄂、雅根错的面积在近30年来呈较显著的扩大趋势,到2008年面积分别为2196.23km2、279.24km2、103.07km2,与1975年分别增长了574.46km2、11.59km2和68.13km2,增长速度分别为35.4%、4.3%和195%。色林错从1999-2008年湖面扩大速度为20%,平均上涨了420km2/10a,已超过纳木错面积,成为西藏第一大咸水湖。冰雪融水量的增加是湖泊上涨的根本原因,其次与降水量的增加和蒸发量的减少、冻土退化等暖湿化的气候变化存在很大关系。
1975-2008年西藏色林错湖面变化对气候变化的响应 .
根据1975年地形图、80年代至2008年的TM、CBERS卫星遥感资料和近34年(1975-2008年)的气温、降水量、蒸发量、最大冻土深度等气候资料分析得出,西藏那曲地区西部的色林错及其周围的错鄂、雅根错的面积在近30年来呈较显著的扩大趋势,到2008年面积分别为2196.23km2、279.24km2、103.07km2,与1975年分别增长了574.46km2、11.59km2和68.13km2,增长速度分别为35.4%、4.3%和195%。色林错从1999-2008年湖面扩大速度为20%,平均上涨了420km2/10a,已超过纳木错面积,成为西藏第一大咸水湖。冰雪融水量的增加是湖泊上涨的根本原因,其次与降水量的增加和蒸发量的减少、冻土退化等暖湿化的气候变化存在很大关系。
|
| [10] |
The response of lake-glacier variations to climate change in Nam Co Catchment, central Tibetan Plateau, during 1970-2000. https://doi.org/10.1007/s11442-008-0177-3 URL Magsci [本文引用: 1] 摘要
<a name="Abs1"></a>Based upon the 1970 aero-photo topographic map, and TM/ETM satellite images taken in 1991 and 2000, the authors artificially interpreted boundaries of lake and glaciers in Nam Co Catchment, and quantified lake-glacier area variations in different stages by “integrated method” with the support of GIS. Results show that from 1970 to 2000, lake area increased from 1942.34 km<sup>2</sup> to 1979.79 km<sup>2</sup> at a rate of 1.27 km<sup>2</sup>/a, while glacier area decreased from 167.62 km<sup>2</sup> to 141.88 km<sup>2</sup> at a rate of 0.86 km<sup>2</sup>/a. The increasing rate of lake in 1991–2000 was 1.76 km<sup>2</sup>/a that was faster than 1.03 km<sup>2</sup>/a in 1970–1991, while in the same period of time, the shrinking rates of glaciers were 0.97 km<sup>2</sup>/a and 0.80 km<sup>2</sup>/a respectively. Important factors, relevant to lake and glacier response to the climate, such as air temperature, precipitation, potential evapotranspiration and their values in warm and cold seasons, were discussed. The result suggests that temperature increasing is the main reason for the accelerated melting of glaciers. Lake expansion is mainly induced by the increase of the glacier melting water, increase of precipitation and obvious decrease of potential evapotranspiration. Precipitation, evaporation and their linkages with lake enlargement on regional scale need to be thoroughly studied under the background of global warming and glacier retreating.
|
| [11] |
Possible causes of area change of Lake Tangra Yum Co Tibet based on TM images. https://doi.org/10.3969/j.issn.1671-6345.2012.04.031 URL [本文引用: 1] 摘要
根据1999—2004年及2008、2009年的TM卫星遥感资料和离湖泊较近的西藏申扎、改则两县1999—2009年气温、降水量、蒸发量资料,利用ARCGIS、ARCVIEW、ENVI等遥感、地理信息系统和数据统计处理软件分析了西藏当惹雍错湖面积变化。结果表明,西藏当惹雍错湖面积在近11年内呈较显著的扩大趋势,湖泊面积11年内增长了15.04km2,增长率为1.8%;湖泊面积在东南部区域有明显的扩大。湖泊面积变化原因分析表明,湖区气温持续升高引起流域内冰川和永久积雪的加速融化和降水量不断增大是湖泊面积增长的原因。
基于TM影像的西藏当惹雍错湖面积变化及可能成因 .https://doi.org/10.3969/j.issn.1671-6345.2012.04.031 URL [本文引用: 1] 摘要
根据1999—2004年及2008、2009年的TM卫星遥感资料和离湖泊较近的西藏申扎、改则两县1999—2009年气温、降水量、蒸发量资料,利用ARCGIS、ARCVIEW、ENVI等遥感、地理信息系统和数据统计处理软件分析了西藏当惹雍错湖面积变化。结果表明,西藏当惹雍错湖面积在近11年内呈较显著的扩大趋势,湖泊面积11年内增长了15.04km2,增长率为1.8%;湖泊面积在东南部区域有明显的扩大。湖泊面积变化原因分析表明,湖区气温持续升高引起流域内冰川和永久积雪的加速融化和降水量不断增大是湖泊面积增长的原因。
|
| [12] |
Glacier and lake variations in the Yamzhog Yumco basin, southern Tibetan Plateau, from 1980 to 2000 using remote-sensing and GIS technologies. https://doi.org/10.3189/002214308787779997 URL [本文引用: 1] 摘要
Not Available
|
| [13] |
Lake change and its implication in the vicinity of Mt. Qomolangma (Everest), central high Himalayas, 1970-2009. https://doi.org/10.1007/s12665-012-1736-6 Magsci [本文引用: 1] 摘要
High-elevation inland lakes are a sensitive indicator of climate change. The extents of lakes in Mt. Qomolangma region have been extracted using the object-based image-processing method providing 6-24 images during 1970-2009. Combined with data from five meteorological stations and three periods' glacier data, the inter-annual and intra-annual lake changes and responses to climate and glacier change have been analyzed. The results show that the lakes have shrunk overall, with clear inter-annual and intra-annual fluctuations during 1970-2009. In general, there appeared a trend of slight shrinkage in the 1970s, distinct shrinkage around 1990, general expansion in 2000 and accelerated decrease after 2000. Lake Peiku and neighboring lakes show a highly consistent change trend (correlation coefficients of 0.68-0.91), with larger lakes having smaller shrinkage rates, which implies a higher stability (in the order of Peiku > Langqiang > Cuochuolong). Lake Peiku, the largest lake, decreased 10.38 km(2) (3.69 % or 0.27 km(2) year(-1)) during 1970-2009. The changes in Lake Peiku indicate that precipitation is its main source of supply with glacier melt water a key supplement. Meanwhile, Lake Como Chamling reduced by 13.12 km(2) (19.79 %) during 1974-2007, with strong shrinkage-expansion-shrinkage-expansion fluctuations. Overall, lakes in the vicinity of Mt. Qomolangma are a sensitive good indicator to climate change.
|
| [14] |
Glacier and lake co-variations and their responses to climate change in the Mapam Yumco Basin on Tibet. https://doi.org/10.3969/j.issn.1007-6301.2004.06.009 URL [本文引用: 1] 摘要
Glacier and lake variations in the Mapam Yumco Basin were studied by integrating series of spatial data from topographic maps and Landsat images in four different periods of time:1974,1990,1999 and 2003.The results indicate that glaciers and lakes in the Basin both retreated and advanced during the last 30 years.As a contribution to the studies of the impact of climate change on glaciers and lakes in high-altitude closed basins of the western Himalayas,we present spatial and temporal variations of glaciers and lakes in the Mapam Yumco Basin on the Tibetan Plateau,by means of Geographical Information System and Remote Sensing techniques.Our results show that both glacier and lake areas in the Mapam Yumco Basin decreased from 1974 to 2003.Glaciers in the basin have receded due to the warmer climate,in total by 7.53 km2(0.26 km2 a-1 or 0.25 % a-1)during 1974 2003(c.f.0.07 % a-1 nearby the Yamzhog Yumco Basin,and 0.18% a-1,the mean glacier recession rate over China since the 1960s).During the same period,lake area decreased by 34.16 km2(1.18 km2 a-1 or 4.37 % of whole lake area in the basin)in total,where decreased by 1.43 km2 a-1 on average(with lake shrinkage amounting to 1.70 km2 a-1 in some areas and lake growth to 0.27 km2 a-1 in others)during 1974-1990,by 1.55 km2 a-1(with lake shrinkage amounting to 2.15 km2 a-1 in some areas and lake growth to 0.60 km2 a-1 in others)during 1990-1999,while enlarged by 0.66 km2 a-1(with lake shrinkage amounting to 2.24 km2 a-1 and lake growth to 2.89 km2 a-1)during 1999-2003 over the past three decades.It is suggested that both enlargement and reduction of lakes were accelerated,which might be an indicator for an accelerated water cycle process over the Tibetan Plateau in a warming climate condition.
|
| [15] |
Remote sensing analysisi for changes of lakes in the southeast of Qingtang area, Qinghai-Tibet Plateau in recent 30 years. 近30年来青藏高原羌塘地区东南部湖泊变化遥感分析 . |
| [16] |
Changing inland lakes responding to climate warming in northeastern Tibetan Plateau. https://doi.org/10.1007/s10584-011-0032-x URL 摘要
The main portion of Tibetan Plateau has experienced statistically significant warming over the past 5002years, especially in cold seasons. This paper aims to identify and characterize the dynamics of inland lakes that located in the hinterland of Tibetan Plateau responding to climate change. We compared satellite imageries in late 1970s and early 1990s with recent to inventory and track changes in lakes after three decades of rising temperatures in the region. It showed warm and dry trend in climate with significant accelerated increasing annual mean temperature over the last 3002years, however, decreasing periodically annual precipitation and no obvious trend in potential evapotranspiration during the same period. Our analysis indicated widespread declines in inland lake’s abundance and area in the whole origin of the Yellow River and southeastern origin of the Yangtze River. In contrast, the western and northern origin of the Yangtze River revealed completely reverse change. The regional lake surface area decreased by 11,49902ha or 1.72% from the late 1970s to the early 1990s, and increased by 6,86602ha or 1.04% from the early 1990s to 2004. Shrinking inland lakes may become a common feature in the discontinuous permafrost regions as a consequence of warming climate and thawing permafrost. Furthermore, obvious expanding were found in continuous permafrost regions due to climate warming and glacier retreating. The results may provide information for the scientific recognition of the responding events to the climate change recorded by the inland lakes.
|
| [17] |
Remotely sensed mapping of inland lake area changes in Tibet Plateau. https://doi.org/10.18307/2011.0301 URL 摘要
青藏高原上的内陆湖泊群是气候变化的敏感指示器,获取近几十年来湖泊变化的动态信息对研究区域气候及环境变化具有重要的意义.本文讨论了多时相遥感湖泊变化研究中的几个关键问题——湖泊变化季节性因素、湖泊变化信息的提取以及大区域湖泊变化的分析方法,并利用Landsat长时间序列遥感数据,制作青藏高原1970s,1990s,2000s和2009年四个时段的湖泊分布图及其湖泊变化图,分析三十多年来内陆封闭流域内湖泊变化的时空特征.研究结果表明,Landsat MSS/TM/ETM 多时相数据在对0.1km2以上湖泊进行变化分析时能取得较好的结果.湖泊在一年之内最稳定的时段为9-12月,其最大湖泊面积变化率不超过2%.从湖泊变化的时间过程来看,湖泊总面积在1970s-1990s呈萎缩趋势,在1990s-2009年剧烈扩张,1970s-2009年全时段湖泊总面积增长27.3%.从空间分布来看,湖泊变化具有明显的区域分布特性,藏北羌塘高原区湖泊出现先萎缩后扩张的变化,色林错及周边区域湖泊处于持续扩张的状态,而冈底斯山北麓的高山深谷湖泊则在近三十多年来保持相对稳定的状态.
青藏高原内陆湖泊变化的遥感制图 .https://doi.org/10.18307/2011.0301 URL 摘要
青藏高原上的内陆湖泊群是气候变化的敏感指示器,获取近几十年来湖泊变化的动态信息对研究区域气候及环境变化具有重要的意义.本文讨论了多时相遥感湖泊变化研究中的几个关键问题——湖泊变化季节性因素、湖泊变化信息的提取以及大区域湖泊变化的分析方法,并利用Landsat长时间序列遥感数据,制作青藏高原1970s,1990s,2000s和2009年四个时段的湖泊分布图及其湖泊变化图,分析三十多年来内陆封闭流域内湖泊变化的时空特征.研究结果表明,Landsat MSS/TM/ETM 多时相数据在对0.1km2以上湖泊进行变化分析时能取得较好的结果.湖泊在一年之内最稳定的时段为9-12月,其最大湖泊面积变化率不超过2%.从湖泊变化的时间过程来看,湖泊总面积在1970s-1990s呈萎缩趋势,在1990s-2009年剧烈扩张,1970s-2009年全时段湖泊总面积增长27.3%.从空间分布来看,湖泊变化具有明显的区域分布特性,藏北羌塘高原区湖泊出现先萎缩后扩张的变化,色林错及周边区域湖泊处于持续扩张的状态,而冈底斯山北麓的高山深谷湖泊则在近三十多年来保持相对稳定的状态.
|
| [18] |
Response of inland lake dynamics over the Tibetan Plateau to climate change. |
| [19] |
Spatiotemporal variations in volume of closed lakes on the Tibetan Plateau and their climatic responses from 1976 to 2013. https://doi.org/10.1007/s10584-016-1877-9 URL [本文引用: 2] 摘要
Abstract To study the response of lakes to climate change, variations in volume of closed lakes larger than 50 km2 on the Tibetan Plateau (TP) were analyzed by integrating Shuttle Radar Topography Mission, Digital Elevation Model (SRTM DEM) and LANDSAT images. Total lake volume (LV) increased (net) by 102.64 km3 during 1976–2013 with an average annual rate of 2.77 km3 year611; the rate increased dramatically to 7.67 km3 year611 during 2000–2013. Four main patterns of LV change were discovered using k-means clustering analysis: (1) a slight increase in LV during 1976–2000 followed by a rapid increase in the southeastern part of the endorheic region, (2) an initial decrease in LV followed by an increase during 1990–2013 in the central and western parts of the endorheic region, (3) an initial decrease in LV followed by an increase during 2000–2013 in the northeastern part of the endorheic region, and (4) an overall decrease during the whole study period for the southern outflow region. Precipitation was the dominant factor affecting LV change. In particular, abnormally large amounts of precipitation during 2000–2013 resulted in a dramatic increase in LV. Temperature changes were positively correlated to LV change before 2000 and negatively after 2000. Glaciers have different influence on LV change based on the comparison between lakes with and without glacial melt input. The distinct regional patterns of change in LV indicate that the sensitivity of lakes to a changing climate varies depending upon the time period and spatial location. These findings have important implications for both the interpretation of past lake level records and prediction of future lake responses to climate change.
|
| [20] |
Different glacier status with atmospheric circulations in Tibetan Plateau and surroundings. https://doi.org/10.1038/nclimate1580 URL [本文引用: 2] 摘要
The Tibetan Plateau and surroundings contain the largest number of glaciers outside the polar regions. These glaciers are at the headwaters of many prominent Asian rivers and are largely experiencing shrinkage, which affects the water discharge of large rivers such as the Indus. The resulting potential geohazards merit a comprehensive study of glacier status in the Tibetan Plateau and surroundings. Here we report on the glacier status over the past 30 years by investigating the glacial retreat of 82 glaciers, area reduction of 7,090 glaciers and mass-balance change of 15 glaciers. Systematic differences in glacier status are apparent from region to region, with the most intensive shrinkage in the Himalayas (excluding the Karakorum) characterized by the greatest reduction in glacial length and area and the most negative mass balance. The shrinkage generally decreases from the Himalayas to the continental interior and is the least in the eastern Pamir, characterized by the least glacial retreat, area reduction and positive mass balance. In addition to rising temperature, decreased precipitation in the Himalayas and increasing precipitation in the eastern Pamir accompanied by different atmospheric circulation patterns is probably driving these systematic differences.
|
| [21] |
Study of the fluctuations of glaciers and lakes around the Ranwu Lake of southeast Tibetan Plateau using remote sensing.
基于1980年地形图和1988年、2001年Landsat数据以及2005年中巴资源卫星数据,对藏东南然乌湖流域1980—2005年25 a来冰川和湖泊的面积变化进行了研究.结果表明:1980—2005年间,冰川面积从496.64 km2减少到466.94 km2,冰川萎缩了29.7 km2,萎缩速率为1.19 km2.a-1,萎缩量占冰川总面积的5.98%,冰川面积占流域总面积的比例从22.42%减小到21.08%.区域冰碛湖泊面积则从1980年29.79 km2增大到2005年33.27 km2,湖泊面积扩大了3.48 km2,增加的速率为0.14km2.a-1,扩大面积占湖泊总面积的11.68%,湖泊面积占流域总面积的比例从1.34%增加到1.5%.其中,冰川面积在1980—1988年萎缩速率为1.73 km2.a-1,1988—2001年为0.82 km2.a-1和2001—2005年为1.3 km2.a-1.而湖泊面积在1980—1988年扩涨速率为0.11 km2.a-1,1988—2001年为0.12 km2.a-1,2001—2005年为0.27 km2.a-1,湖泊逐年加速扩涨.从流域内的气象数据来看,温度升高,是该区域冰川萎缩的根本原因,湖泊加速扩涨主要受到冰川萎缩,冰川融水量加大的影响.
1980-2005年藏东南然乌湖流域冰川湖泊变化研究 .
基于1980年地形图和1988年、2001年Landsat数据以及2005年中巴资源卫星数据,对藏东南然乌湖流域1980—2005年25 a来冰川和湖泊的面积变化进行了研究.结果表明:1980—2005年间,冰川面积从496.64 km2减少到466.94 km2,冰川萎缩了29.7 km2,萎缩速率为1.19 km2.a-1,萎缩量占冰川总面积的5.98%,冰川面积占流域总面积的比例从22.42%减小到21.08%.区域冰碛湖泊面积则从1980年29.79 km2增大到2005年33.27 km2,湖泊面积扩大了3.48 km2,增加的速率为0.14km2.a-1,扩大面积占湖泊总面积的11.68%,湖泊面积占流域总面积的比例从1.34%增加到1.5%.其中,冰川面积在1980—1988年萎缩速率为1.73 km2.a-1,1988—2001年为0.82 km2.a-1和2001—2005年为1.3 km2.a-1.而湖泊面积在1980—1988年扩涨速率为0.11 km2.a-1,1988—2001年为0.12 km2.a-1,2001—2005年为0.27 km2.a-1,湖泊逐年加速扩涨.从流域内的气象数据来看,温度升高,是该区域冰川萎缩的根本原因,湖泊加速扩涨主要受到冰川萎缩,冰川融水量加大的影响.
|
| [22] |
|
| [23] |
Ranwu Lake, a proglacial lake with the potential to reflect glacial activity in SE Tibet. https://doi.org/10.1360/n972014-00084 URL [本文引用: 1] 摘要
青藏高原冰川和湖泊广布,湖泊水质、沉积物对冰川变化的响应研究较为匮乏.本文通过藏东南外流区第二大湖泊然乌湖监测的系统设计,研究了湖泊对冰川的响应程度.利用水位计对比然乌湖和各大补给河流水位与水温的关系,发现冰川融水补给河流(曲尺河)对湖泊水量平衡的重要性;利用水质多参数仪器定期监测湖泊和河流的水质参数的时空变化,发现冰川融水对然乌湖温度的时空变化有重要影响,导致水温自上而下降低,流量小的季节湖泊温度差异变小;自上游到下游电导率逐渐升高,显现出离子浓度低的冰川融水对湖泊的冲淡效应,pH随之变化;甚至影响到了叶绿素含量的时空变化;利用在上、中和下湖布设的沉积物捕获器监测沉积通量的时空变化,发现沉积速率非常大,通量具有上湖>中湖>下湖的规律,且时间上各湖具有入湖流量大的季节大于小的季节的规律,说明了冰川融水对然乌湖在沉积量方面的影响是决定性的.总之,然乌湖水体和沉积物能够高信度地响应上游冰川的变化,然乌湖沉积物具有高分辨率反演该区域冰川和气候变化的潜力.
基于监测的藏东南然乌湖现代过程: 湖泊对冰川融水的响应程度 .https://doi.org/10.1360/n972014-00084 URL [本文引用: 1] 摘要
青藏高原冰川和湖泊广布,湖泊水质、沉积物对冰川变化的响应研究较为匮乏.本文通过藏东南外流区第二大湖泊然乌湖监测的系统设计,研究了湖泊对冰川的响应程度.利用水位计对比然乌湖和各大补给河流水位与水温的关系,发现冰川融水补给河流(曲尺河)对湖泊水量平衡的重要性;利用水质多参数仪器定期监测湖泊和河流的水质参数的时空变化,发现冰川融水对然乌湖温度的时空变化有重要影响,导致水温自上而下降低,流量小的季节湖泊温度差异变小;自上游到下游电导率逐渐升高,显现出离子浓度低的冰川融水对湖泊的冲淡效应,pH随之变化;甚至影响到了叶绿素含量的时空变化;利用在上、中和下湖布设的沉积物捕获器监测沉积通量的时空变化,发现沉积速率非常大,通量具有上湖>中湖>下湖的规律,且时间上各湖具有入湖流量大的季节大于小的季节的规律,说明了冰川融水对然乌湖在沉积量方面的影响是决定性的.总之,然乌湖水体和沉积物能够高信度地响应上游冰川的变化,然乌湖沉积物具有高分辨率反演该区域冰川和气候变化的潜力.
|
| [24] |
Expeditionary studies on the moisture passage of the Yarlung Zangbo River. 雅鲁藏布江水汽通道考察研究 . |
| [25] |
|
| [26] |
|
| [27] |
Coherent lake growth on the central Tibetan Plateau since the 1970s: Characterization and attribution. https://doi.org/10.1016/j.jhydrol.2013.01.003 URL [本文引用: 1] 摘要
Although lakes on the central Tibetan Plateau (TP) expanded significantly in recent decades, causes for the lake growth still have not been well addressed. Based on remote sensing and GIS techniques together with bathymetric survey and water balance analysis, we show how climatic changes and glacier mass loss have influenced the inland lake dynamics on the central TP. Our results show that six closed lakes (Siling Co, Nam Co, Bam Co, Pung Co, Darab Co and Zige Tangco) expanded by 20.2% in area, by 8.7m in water depth, and by 37.7Gt in the total storage between 1976 and 2010, with a remarkable acceleration after 1999. The growth rate of lake area, water level and storage between 1999 and 2010 was 5.0, 3.6 and 4.8 times, respectively, than that between 1976 and 1999, corresponding well with the significant climatic changes in the late 1990s. Water balance analysis shows that increased precipitation and runoff, and decreased lake evaporation were the main causes for the coherent lake growth and could contribute by about 70% of total increase in lake storage. Based on modern mass balance results , glacier mass loss between 1999 and 2010 was estimated to contribute to the lake level rise of the three glacial-fed lakes, Siling Co, Nam Co and Pung Co, by 651.0m, 650.7m and 651.1m, respectively, accounting for 11.7%, 28.7% and 11.4% of the total lake level rise.
|
| [28] |
Snowmelt runoff model (SRM) User's Manual (Update Edition 2008, Windows Version 1.11). |
| [29] |
The Second Glacier Inventory Dataset of China (Version 1.0). 中国第二次冰川编目数据集(V1.0) . |
| [30] |
Characteristics of glacier variation and discharge in the Ranwu Lake region, southeast Tibetan Plateau [D]. Beijing: Institute of Tibetan Plateau Research, 藏东南然乌湖地区冰川变化与径流特征研究[D] . |
| [31] |
Crop evapotranspiration-Guidelines for computing crop water requirements.
CiteSeerX - Scientific documents that cite the following paper: Crop evapotranspiration – Guidelines for computing crop water requirements
|
| [32] |
Probabilistic projections of climate change over China under the SRES A1B scenario using 28 AOGCMs. https://doi.org/10.1175/2011JCLI4102.1 URL [本文引用: 2] 摘要
Probabilistic projections of climate change at global and regional scales are a developing area of research. In the present study, a simple yet effective approach is proposed, with the purpose of producing probabilistic results of climate change over China for the middle and end of the 21st century under SRES-A1B emission scenario, using the results of 28 Coupled Atmosphere-Ocean General Circulation Models (AOGCMs). First the 28 AOGCMs were ranked based on their ability to simulate climate over China in terms of two model evaluation metrics. Then the models were given with different weight according to their performance for present climate. The issue of uncertainties due to intermodel differences are also addressed to some extent by approaching the climate projection problem in a probabilistic way (CDFs). The evaluation results for the current climate show that five models, namely INGV_ECHAM4, UKMO_HADCM3, CSIRO_MK3.5, NCAR_CCSM3.0 and MIROC3. 2 (hires), clearly perform better than others over China. Their corresponding weights are 0.289, 0.096, 0.058, 0.048, and 0.044, respectively. Under A1B scenario, surface air temperature is projected to increase significantly for both middle and end of the 21st century, with larger magnitude over the north and in winter. There are also significant increases in rainfall in 21st century under A1B scenario, especially for the period 2070-2099. As far as the interannual variability is concerned, the most striking feature is that there are high probabilities for future intensification of interannual variability of precipitation over most of China in both DJF and JJA. For instance, over Yangtze-Huaihe River Valley (28掳N-35掳N, 105掳E-120掳E), there is a 60% probability of increased interannual standard deviation of precipitation by 20% in summer, which is much larger than that of the mean precipitation. However, it is clear that more research will be needed to investigate the appropriate approach of producing probabilistic results of climate change at the regional scale.
|
| [33] |
Mass balance of a maritime glacier on the southeast Tibetan Plateau and its climatic sensitivity. Journal of https://doi.org/10.1002/jgrd.50760 URL [本文引用: 1] 摘要
Based on glaciometeorological measurements and mass balance stake records during the 5year period of 2005-2010 on the southeast Tibetan Plateau, an energy-mass balance model was applied to study the surface mass balance of the Parlung No. 94 Glacier, as well as its response to regional climate conditions. The primary physical parameters involved in the model were locally calibrated by using relevant glaciometeorological data sets. The good agreement between the snowpack height/mass balance simulations and the in situ measurements available from a total of 12 monitoring stakes over this glacier confirmed the satisfactory performance of the energy-mass balance model. Results suggested that the recent state of the Parlung No. 94 Glacier was far removed from the ideal climatic regime leading to zero mass balance, with its annual mass balance of approximately -0.9m water equivalent during 2005-2010. Climatic sensitivity experiments were also carried out to interpret the observed mass balance changes, and the experiments demonstrated that the maritime glaciers concerned herein were theoretically more vulnerable to ongoing climate warming on the Tibetan Plateau than potential changes in the amount of precipitation. A plausible causal explanation for the recent glacier shrinkage in this region was concerned with the increasing air temperature. Moreover, both the mass balance simulations and the field measurements indicated that the mass accumulation over this maritime glacier occurred primarily in the boreal spring. Such spring-accumulation type glaciers are presumed to be distributed mainly within a narrow wedge-shaped region along the Brahmaputra River. Climatic sensitivities of the glacier mass balance are also found to be closely linked to the regional precipitation seasonality that is simultaneously modulated by various atmospheric circulation patterns, such as the southern westerlies, the Bay of Bengal vortex in the spring season, and the Indian monsoon in the summer season.
|
| [34] |
Glacial distribution and mass balance in the Yarlung Zangbo River and its influence on lakes. https://doi.org/10.1007/s11434-010-3213-5> URL [本文引用: 1] 摘要
Glaciers in the Yarlung Zangbo River witness severe glacial retreat nowadays, which gives important influence on lake processes in the region. We have studied glacial distribution, glacial mass balance and found large deficit in glacial mass and its impact in the region. Our study also integrated the variation in glacial-fed lakes of the Nam Co and Ranwu Lake, and presented an initial assessment of the impact of glacial mass balance on lakes. The study has shown a significant contribution of glacial melting to recent lake expansion and lake level rising.
|
| [35] |
Research on the typical debris flows chain based on RS in Palongzangbu Basin of Tibet [D]. 基于RS的西藏帕隆藏布流域典型泥石流灾害链分析[D] . |

/
| 〈 |
|
〉 |
